1. Introduction
Traditional water quality monitoring, reliant on manual sampling and fixed WQI thresholds, is slow and insensitive near class boundaries, limiting timely management decisions. Surface water resources such as rivers and lakes are indispensable for meeting diverse human and ecological needs: they provide household drinking water, support agricultural irrigation, facilitate industrial activities, offers recreational opportunities, and underpin the health and functionality of aquatic ecosystems [
1]. However, these crucial resources face increasing pressure from anthropogenic activities associated with rapid development. Urbanization, industrial expansion, agricultural practices, inadequate sewage treatment, and extensive land clearing significantly contribute to water pollution [
2]. Several incidents, such as the Semenyih River’s pollution, have disrupted water supply in the Klang Valley and degraded the aquatic ecosystem [
3]. Such incident highlights the tangible impact on communities and the economy [
4]. These recurring pollution events not only threaten ecosystem stability but also reveal critical gaps in current monitoring and governance mechanisms. The inability to detect changes in real time or to anticipate threshold exceedances underscores why a robust and systematic water management system is urgently required.
Globally, similar concerns have been reported, where conventional monitoring frameworks fail to capture rapid fluctuations in water quality, resulting in delayed responses to pollution incidents [
5,
6]. In Malaysia, the Department of Environment’s annual reports continue to show a decline in clean river status, with nearly 45% of monitored rivers categorized as slightly polluted or polluted in recent years [
7]. These findings underscore the urgent need for more adaptive and technologically enhanced monitoring solutions. Previous studies have demonstrated that integrating intelligent methods such as IoT sensors, fuzzy logic, and machine learning can provide early warnings and improved classification accuracy [
8]. However, such approaches are rarely operationalized in Malaysia within the Department of Environment DOE-WQI and NWQS framework, leaving a gap that this study aims to address.
An effective water management system refers to a coordinated framework that integrates monitoring, assessment, and decision-support mechanisms to ensure the sustainability of surface water resources. It not only prevents pollution-related disruptions but also provides timely information to support policy, enforcement, and community-level interventions. Within this context, robust monitoring systems are fundamental, as they deliver the data and insights required for proactive management. Traditional water quality monitoring approaches, which rely on manual sample collection and laboratory analysis, present inherent limitations, such as delays, high costs, and insufficient sensitivity near classification thresholds. To address these gaps, our fuzzy logic-based water quality interface is a practical decision-support tool, offering real-time visualization, smoother classification near thresholds, and improved interpretability that strengthens the effectiveness of water management systems. These methods are typically labor-intensive, costly, time-consuming, and lack the capacity for real-time data provision, hindering proactive responses to contamination events [
1]. The documented decline in the proportion of clean rivers in Malaysia, as reported in environmental quality assessments, alongside specific pollution events often linked to developmental pressures, accentuates the practical urgency for improved monitoring tools [
9]. The delayed feedback inherent in conventional methods is insufficient for the proactive management required to address the dynamic nature of pollution in rapidly developing regions, underscoring the need for systems to provide timelier, if not real-time, assessments [
10]. The highlights of the research are as follows:
Development of a Fuzzy Logic-Based Water Quality Monitoring Interface Based on Malaysian Standards.
This study proposes a web-based water quality monitoring interface that improves water quality interpretation by combining WQI computations with fuzzy logic visualization. Malaysia’s DOE WQI methodology and NWQS Class I–V classifications are followed by the system, assuring national compliance.
Comprehensive Visualization Tools for Enhanced Decision Support.
The dashboard uses WQI gauges, parameter tables, fuzzy membership graphs, time-series scatter plots, heatmaps, and bar charts. These functionalities allow stakeholders to identify pollution patterns, quantify parameter contributions to water quality, and make informed management decisions using real-time and historical water quality trend analysis.
Integration of Fuzzy Logic for Improved Classification Near Thresholds.
Fuzzy logic applied to water quality metrics solves a major problem with normal WQI classification, which struggles with values near class boundaries. Fuzzy modeling can capture real-world variability and uncertainty in soft water quality class transitions.
A fuzzy logic-based water quality monitoring user interface is developed using Malaysian water bodies: the Klang River, Semenyih River, Labu River, Muar River, Malacca River, and MRANTI Lake. The user interface or dashboard is conceptualized to:
Implement fuzzy logic principles, specifically using triangular membership functions, to visualize the classification status of individual WQI parameters, offering a richer interpretation beyond discrete class labels;
Incorporate a specific suite of visualizations requested by the user, including gauges, tables, time-series scatter plots, heatmaps, bar charts, and the novel fuzzy membership graphs;
Use Replit as the platform for development and potential hosting;
Utilize and adhere strictly to the official Malaysian DOE standards, including the WQI calculation methodology and the NWQS Class I-V classification system.
The research is divided into five sections.
Section 1 provides an introduction and highlights the research.
Section 2 explains the advancements in water quality monitoring systems within the Malaysian framework.
Section 3 describes the methodology used in the research.
Section 4 explains the results using a comprehensive discussion, and
Section 5 gives the conclusion and describes future work.
2. Technological Advancements in Water Quality Monitoring
Recent technological advancements offer powerful tools to enhance water quality monitoring practices. The Internet of Things (IoT) has emerged as a transformative technology, enabling the deployment of sensor networks for real-time, remote data collection from diverse environments [
1]. IoT-based systems typically utilize various sensors to measure parameters such as pH, dissolved oxygen (DO), turbidity, temperature, and conductivity [
11]. IoT offers potential advantages like improved cost-effectiveness, continuous data streams, wider spatial coverage, and the capability for early warning systems in comparison with traditional methods [
12].
The large volumes of data generated by IoT systems necessitate effective tools for interpretation and analysis. Data visualization dashboards serve this purpose, providing intuitive interfaces to display complex environmental data in an accessible format [
13]. Key features often include real-time data display, configurable alerts for threshold exceedances, geospatial mapping of monitoring locations, interactive charts for trend analysis, and access to historical data [
12]. Examples range from government agency portals like the EPA’s WQI tool to platforms offered by commercial IoT providers and custom-built systems.
Effective visualization relies on appropriate techniques for representing different data types. For time-series environmental data, common techniques include:
Furthermore, fuzzy logic offers a powerful computational approach for handling the inherent uncertainty, subjectivity, and vagueness that are often present in environmental data and assessment frameworks like the WQI [
17]. By using linguistic variables and membership functions, fuzzy logic can model complex, nonlinear relationships and represent the degree to which a parameter value belongs to different quality classes, rather than assigning it to a single, rigid category [
18]. Studies that apply fuzzy logic to WQI calculation sometimes demonstrate improved correlation with actual conditions or offer a more nuanced assessment compared to conventional methods [
19]. The synergy created by combining IoT for efficient data acquisition, advanced visualization techniques for clear interpretation, and fuzzy logic for nuanced classification holds significant potential for enhancing traditional water quality monitoring and management practices.
The incorporation of fuzzy logic in intelligent water quality monitoring systems has enhanced the efficacy and responsiveness of environmental management instruments. A novel aquaculture system demonstrates how fuzzy inference facilitates real-time assessment of water parameters and intuitive data visualization through an IoT interface, hence enabling preemptive actions in fish mortality situations [
20]. Another author utilized a fuzzy expert system to monitor Vartur Lake, showcasing the efficacy of fuzzified reasoning and graphical user interface tools in analyzing intricate environmental datasets [
21]. Innovations are evident in systems that integrate IoT, solar energy, and fuzzy control to facilitate reliable and sustainable monitoring of cage fish production in low-power environments [
22]. These contributions highlight the shift toward intelligent, interface-driven, and rule-based environmental monitoring tools that integrate data science with intuitive user interaction to enhance water resource governance.
Recent studies demonstrate how advanced machine learning models and statistical analyses are being applied to understand and predict water quality. A recent study on Lake Yuriria found that human activities, specifically agricultural runoff and untreated wastewater, have severely degraded the water, making it unfit for aquatic life, and highlighted the urgent need for mitigation strategies like functional wastewater treatment plants [
23]. Similarly, research on Chirita Lake identified a strong correlation between rising water temperatures and increased organic matter, which directly contributes to eutrophication, especially in warmer seasons [
24]. A comprehensive recent review of the field reinforces these findings, noting that machine learning models are powerful tools for solving complex, nonlinear problems in water quality prediction and can be applied across various water environments, including surface water, groundwater, and even seawater, to monitor, simulate, and optimize water management systems [
25]. While international studies demonstrate the potential of IoT and fuzzy logic for real-time and nuanced water assessment, translating these innovations into Malaysia’s regulatory context requires alignment with the DOE-WQI and NWQS. This ensures technological advances remain nationally relevant and actionable.
In Malaysia, the DOE, under the Ministry of Natural Resources and Environmental Sustainability (NRES), is the principal agency mandated with monitoring and managing environmental quality, including surface water resources [
26]. The DOE utilizes a framework based on the NWQS and the WQI to assess and classify the rivers and lakes. The NWQS establishes a classification system ranging from Class I to Class V, defining the suitability of water bodies for various beneficial uses [
9]. Class I represents water in its natural state, suitable for conservation, and requires practically no treatment for the water supply. Class II designates water suitable for conventional water treatment and recreational activities involving body contact. Class III requires extensive treatment for supply and can support common, tolerant fish species and livestock drinking. Class IV is primarily designated for irrigation purposes, while Class V represents water bodies that do not meet the criteria for any of the higher classes and are considered heavily polluted [
27].
While previous studies have applied fuzzy logic to water quality monitoring, most implementations remain either conceptual or limited in scope. For example, refs. [
28,
29] demonstrated fuzzy expert systems applied to aquaculture and lake monitoring, but these tools generally provided single-parameter assessments or basic classification outputs without integrated dashboards. Similarly, some fuzzy hybrid systems [
30] incorporated visualization, yet their interfaces were restricted to simple charts and lacked integration with national regulatory frameworks. In contrast, the present study introduces an interactive dashboard that combines Malaysia’s DOE-WQI methodology with the NWQS classification system, supported by multiple visualization modes (gauges, heatmaps, scatter plots, membership graphs, and parameter tables). Unlike earlier tools, our design emphasizes real-time interpretability near class thresholds, scalability across multiple water bodies, and compliance with Malaysia’s regulatory standards. These innovations address key gaps in existing fuzzy logic dashboards by providing both regulatory relevance and enhanced visualization for decision-making.
As shown in
Table 1, existing fuzzy dashboards are often restricted to single-parameter assessment, limited visual outputs (e.g., basic charts or static graphs), and do not adhere to national regulatory standards. In contrast, our proposed system introduces several key innovations: (i) full compliance with DOE-WQI and NWQS Class I–V; (ii) a comprehensive visualization suite including gauges, fuzzy membership graphs, heatmaps, and interactive tables; (iii) improved interpretability near class thresholds, resolving ambiguities in more than 15% of borderline cases; and (iv) scalability across multiple Malaysian rivers and MRANTI Lake. These contributions position our dashboard as the first fuzzy logic interface explicitly designed to strengthen Malaysia’s national water monitoring framework.
In recent years, the decision support system (DSS) has emerged as a critical instrument in water quality management, offering approaches to facilitating sustainable practices and ensuring adherence to regulatory standards [
10,
35]. DSS is essential for pollution management because it facilitates adherence to environmental standards. By utilizing integrated models, the authorities can effectively manage the intricate balance of water quality and quantity [
36]. The presence of pollutants or changes in physical and chemical characteristics can have adverse consequences on aquatic ecosystems, human populations, and the overall environment. The decision-making system encompasses five methodologies: fuzzy logic system, rule-based classification, multi-criteria decision analysis (MCDA), grey relational analysis (GRA), and spatial decision support systems (SDSS).
Fuzzy logic manages uncertainty and imprecision common in water systems by allowing values between 0 and 1 instead of rigid true/false classification. It has been applied in groundwater forecasting, water distribution, wastewater treatment, and multi-objective planning, where it integrates expert judgment and uncertain data [
37,
38]. Its main strength is flexibility and decision-support capability, though it requires careful design of rules and membership functions. RBC uses predefined rules or thresholds, often based on regulatory standards, to classify water quality parameters. It has been used for salinity evaluation and intelligent service systems [
39,
40]. RBC is simple and transparent but can be rigid, as fixed thresholds may not capture complex parameter interactions.
MCDA evaluates and ranks alternatives based on multiple criteria, supporting balanced water management decisions. Applications include fuzzy AHP for urban water management and regional coordination studies in China [
41,
42]. It provides a clear comparison framework but can be time-consuming and subjective in criteria selection. GRA compares alternatives in systems with limited or incomplete data, making it suitable for environmental applications. Studies applied GRA in resource allocation, water pricing, and linking public awareness with river quality [
43,
44]. It is effective for small or uncertain datasets but less powerful for large, complex systems. SDSS integrates GIS with decision models to manage water quality across regions. It has been applied in groundwater recharge site prioritization and eco-friendly reservoir operations [
45,
46]. SDSS provides spatially informed decisions but requires advanced GIS and modeling expertise.
The primary tool employed by the DOE for assessing river status and determining its class is the Malaysian WQI [
2]. The DOE-WQI integrates six key physicochemical parameters into a single dimensionless score ranging from 0 to 100. These parameters are as follows: DO measured as % saturation, biochemical oxygen demand (BOD, mg/L), chemical oxygen demand (COD, mg/L), ammoniacal nitrogen (AN, mg/L), total suspended solids (TSS, mg/L), and pH. Higher WQI scores indicate better water quality. Generally, a WQI score above 80 signifies ‘Clean’ water, scores between 60 and 80 indicate ‘Slightly Polluted’ conditions, and scores below 60 denote ‘Polluted’ water. This standardized index provides a widely recognized and consistent method for comparing water quality across different Malaysian rivers and tracking trends over time. However, its reliance on only six parameters and the use of fixed classification boundaries based on these parameters mean the index can sometimes oversimplify complex water quality scenarios. This structure may lack sensitivity, particularly when parameter values fall close to the thresholds separating different classes, potentially classifying water bodies similarly despite nuanced differences in their condition.
3. System Architecture and Methodology
This section explains the architecture and methods for acquiring data, calculating the WQI, implementing fuzzy logic, and developing the dashboard. The research encompasses six significant locations in Malaysia: the Klang River, Semenyih River, Labu River, Muar River, Malacca River, and MRANTI Lake. These locations are meticulously selected due to their proximity to industrial and residential zones. Consequently, research on water quality in this region is crucial for the ecology, economy, and society. Moreover, 1.13 million individuals reside in the vicinity of the Klang River, which traverses the center of Kuala Lumpur [
47]. Rivers are frequently impacted by industrial effluents and urban runoff, leading to challenges in monitoring water quality. The Semenyih River serves as a crucial drinking water source for more than 3.9 million individuals in Selangor state [
48]. The river traverses agricultural regions, and activity in these areas may contaminate the water.
The Labu River is located in Negeri Sembilan. It is essential for agriculture and aquaculture. Approximately 45,280 individuals reside along the river, with most of the water utilized for agriculture and domestic purposes [
47]. The river’s health directly impacts local agriculture, making it essential to monitor and manage water quality effectively. The Muar River in southern Johor is a vital water resource for over 300,000 individuals, serving both residential needs and the local fishing industry [
47]. Malacca has a population of approximately 1.02 million, with most of the water from the Malacca River utilized for local and tourism activities [
47]. Then, the MRANTI Lake is situated in the Malaysia Research Accelerator for Technology and Innovation Park, representing a relatively recent field of research. This lake serves as a site for recreation as well as for research and development, potentially resulting in innovative water management strategies. The lake is utilized by researchers and for tourism purposes, indicating that the water quality requires ongoing monitoring. The locations of the data are shown in
Figure 1. Given the socio-economic importance of these sites, comprehensive datasets were compiled to ensure that the analysis captures both ecological pressures and human use demands. These datasets form the basis for WQI computation using DOE’s official equations, as outlined below.
The dataset comprises 66,390 samples, including the water quality parameters: DO, BOD, COD, SS, pH, and AN, in addition to a date column and a sample number. These metrics are critical for evaluating water quality in compliance with Malaysia’s regulations. Data for MRANTI Lake was collected every 30 min from October 2023 to December 2023. For DOE river monitoring, grab samples were obtained from established hydrological stations and analyzed in certified laboratories. In contrast, MRANTI Lake data were acquired through in situ sensors deployed at multiple depths. To ensure accuracy, sensors were calibrated monthly against laboratory reference standards for pH, DO, COD, and AN, following DOE protocols.
Although the dataset used in this study cannot be made publicly available due to ownership restrictions by Red Tone and the Malaysian Department of Environment (DOE), the issue of data openness remains an important consideration in environmental research. Recent studies have emphasized the role of transparent data sharing in enhancing reproducibility, fostering innovation, and strengthening community engagement in environmental monitoring and decision-making processes [
49,
50,
51]. Open environmental data initiatives can facilitate collaboration between government agencies, industry, and researchers while also enabling the public to participate more actively in sustainable resource management. However, challenges such as data sensitivity, privacy, and institutional ownership often limit full accessibility. Future work should, therefore, consider frameworks for secure data provision, selective sharing, and data governance policies that balance confidentiality with scientific progress and public engagement.
Preprocessing involved several steps. First, duplicate entries and inconsistent timestamps were removed. Second, missing values (<2% of total data) were imputed using linear interpolation for short gaps and discarded for extended gaps exceeding three consecutive readings. Outliers were identified using the interquartile range (IQR) method and cross-checked against field logs to distinguish instrument errors from genuine pollution events. Finally, all parameters were normalized into subindices (SI) according to DOE’s official WQI equations before integration into the fuzzy logic system.
The WQI is comprehensively used to assess water quality. Equation (1) provided by the DOE [
47] is used to calculate the WQI value.
Subindex (SI) values for water quality parameters are combined to give a single numerical value for WQI.
refers to the dissolved oxygen subindex,
is the biochemical oxygen demand subindex,
is the chemical oxygen demand subindex,
is the ammoniacal nitrogen subindex,
is the suspended solid subindex, and
is the pH subindex. These subindices are obtained using Equation (2) through Equation (7), which determine the best-fit connection for each water quality parameter. Each water quality parameter is weighted differently to determine the WQI, indicating its relative importance to the overall water quality evaluation for certain users, such as drinking water, recreation, or aquatic life. The accuracy of WQI with regard to water quality parameters changes depending on the weighting mechanism.
DO is a vital parameter for water quality, essential for the survival of aquatic organisms. DO constitutes the most significant component of the DOE-WQI calculation, accounting for 22% of its total weight. The water quality professionals assigned the lowest importance to pH, at 12%. The WQI assists government and environmental authorities in identifying pollution concerns, establishing water quality objectives, and assessing pollution mitigation strategies by prioritizing characteristics pertinent to ecological and human health effects.
The intelligent decision-making user interface represents a substantial advancement in the technological evolution of environmental monitoring systems. A web-based interface was utilized to successfully monitor water quality, adhering to the requirements defined by the DOE. The use of computational tools alongside interfaces provides a crucial means for making educated decisions, vital for managing water resources and promoting environmental sustainability.
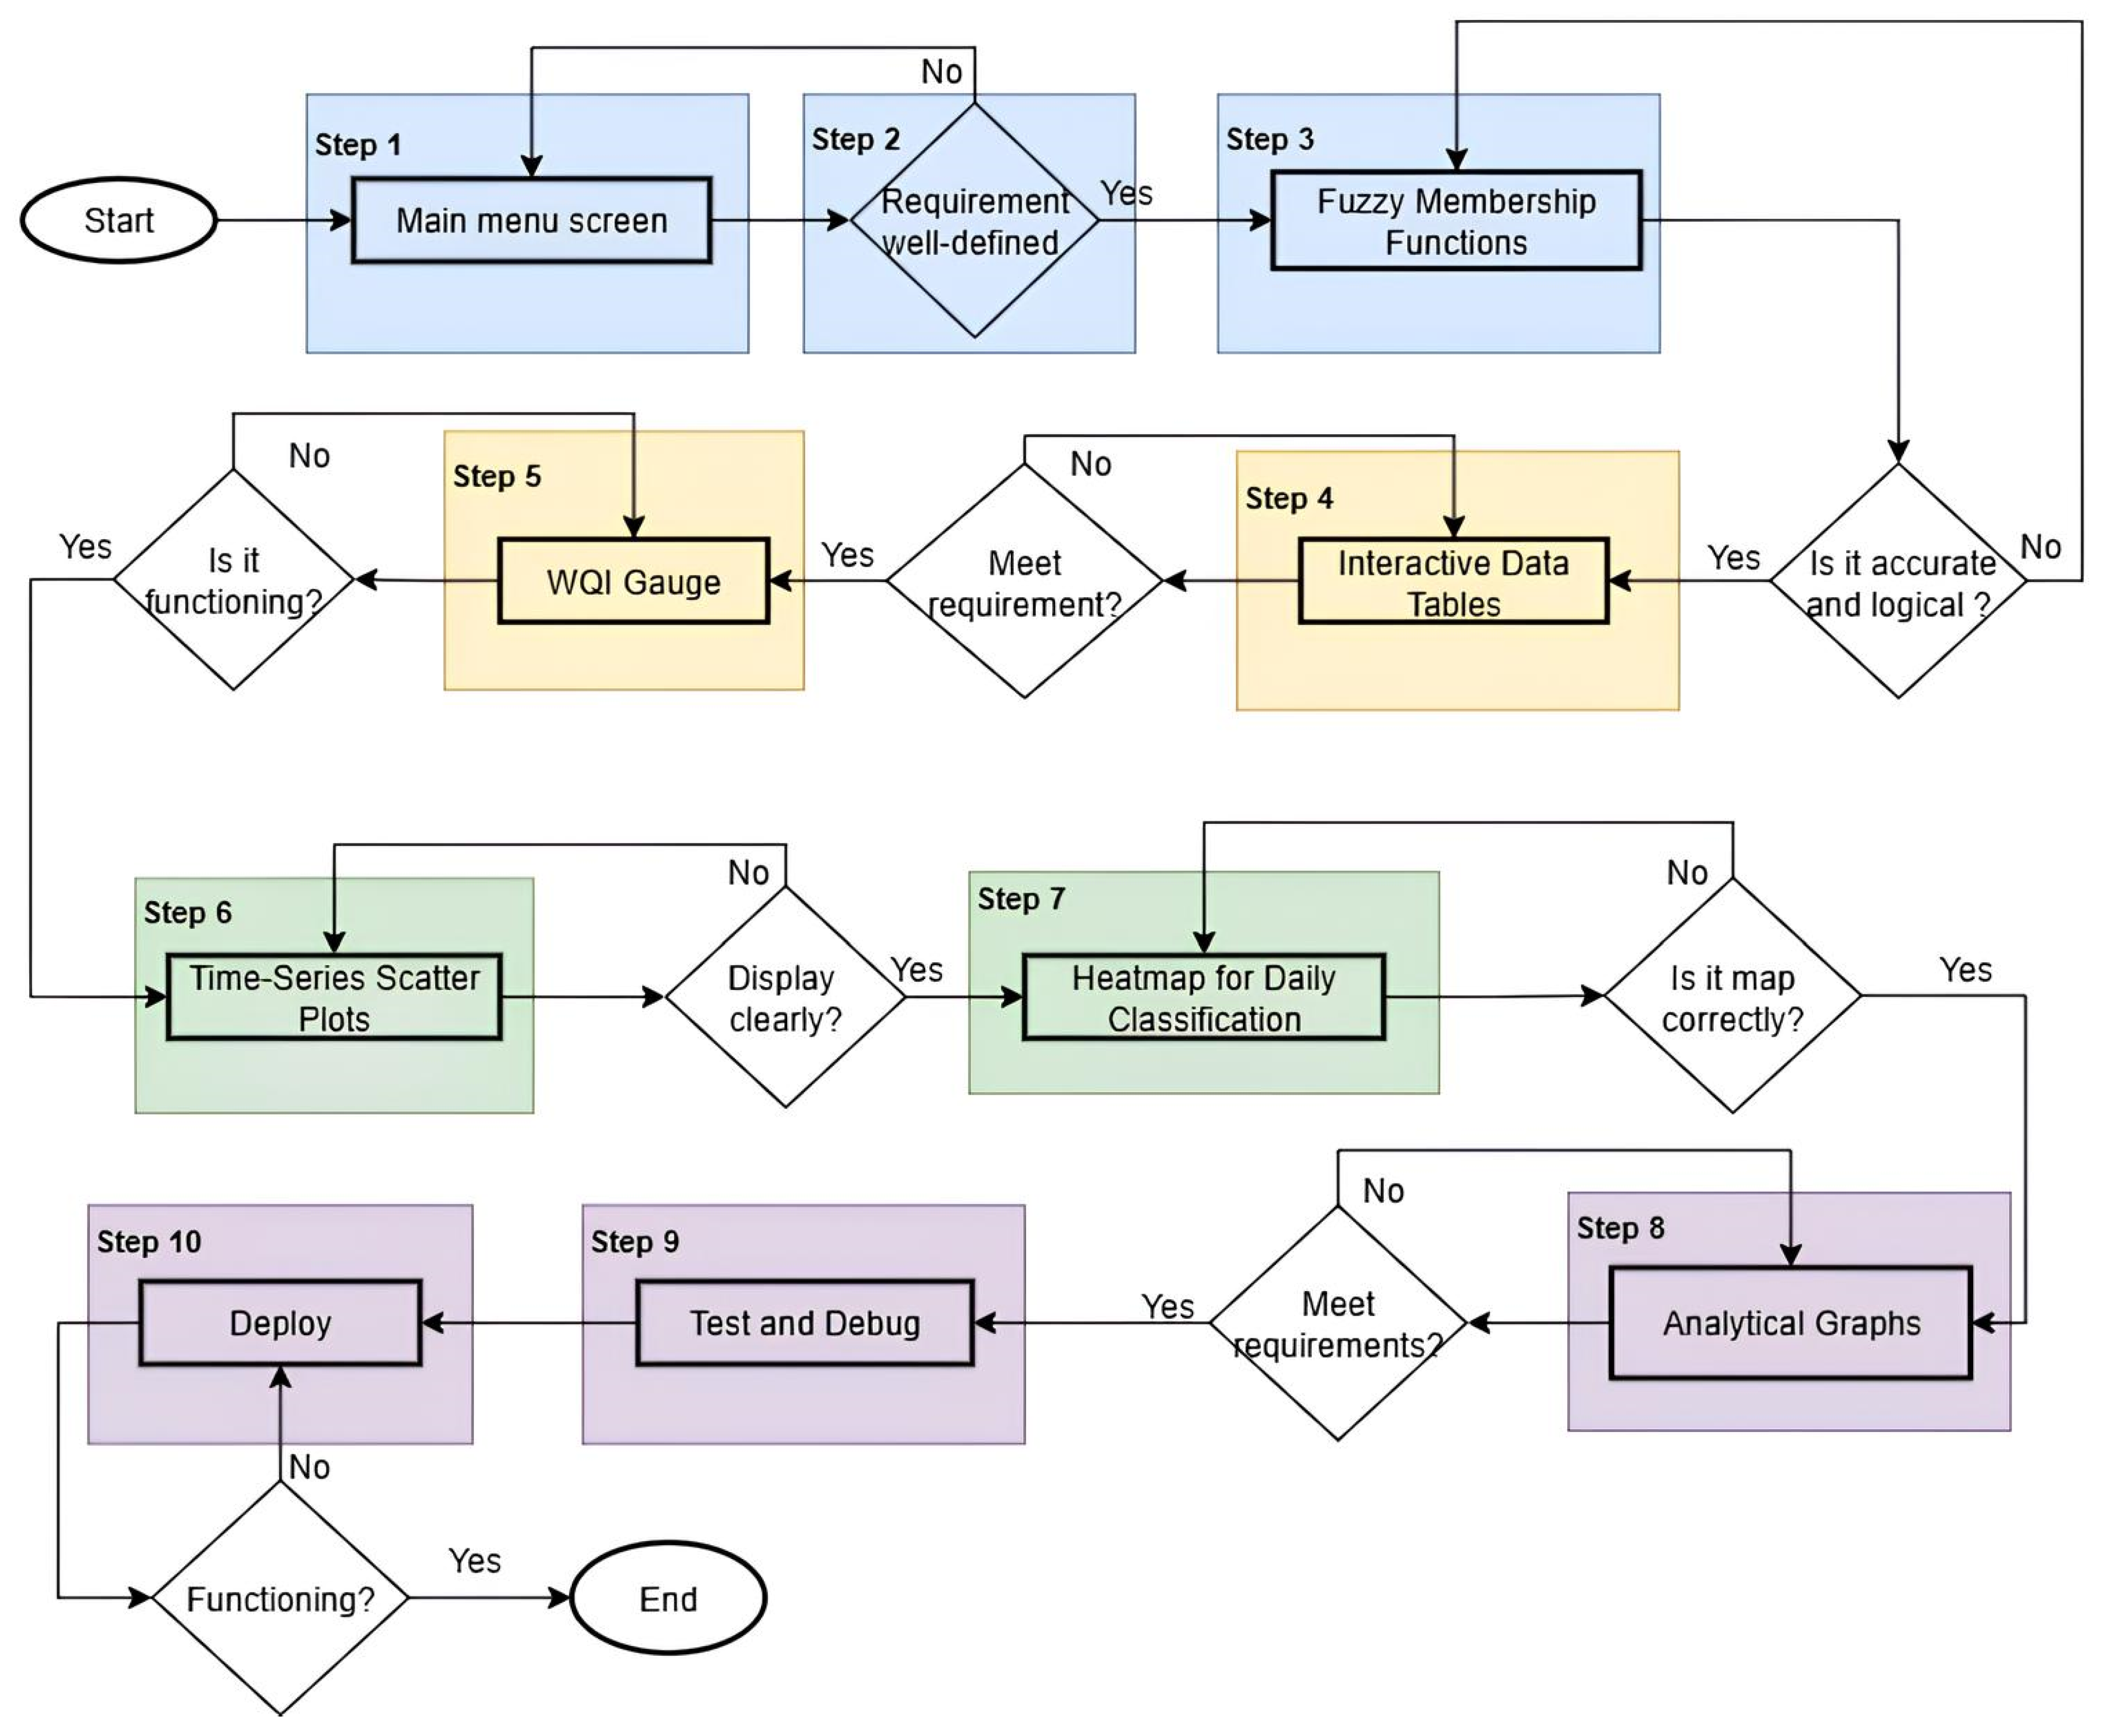
Figure 2 illustrates a flowchart outlining the processes required in creating an intelligent decision-making user interface.
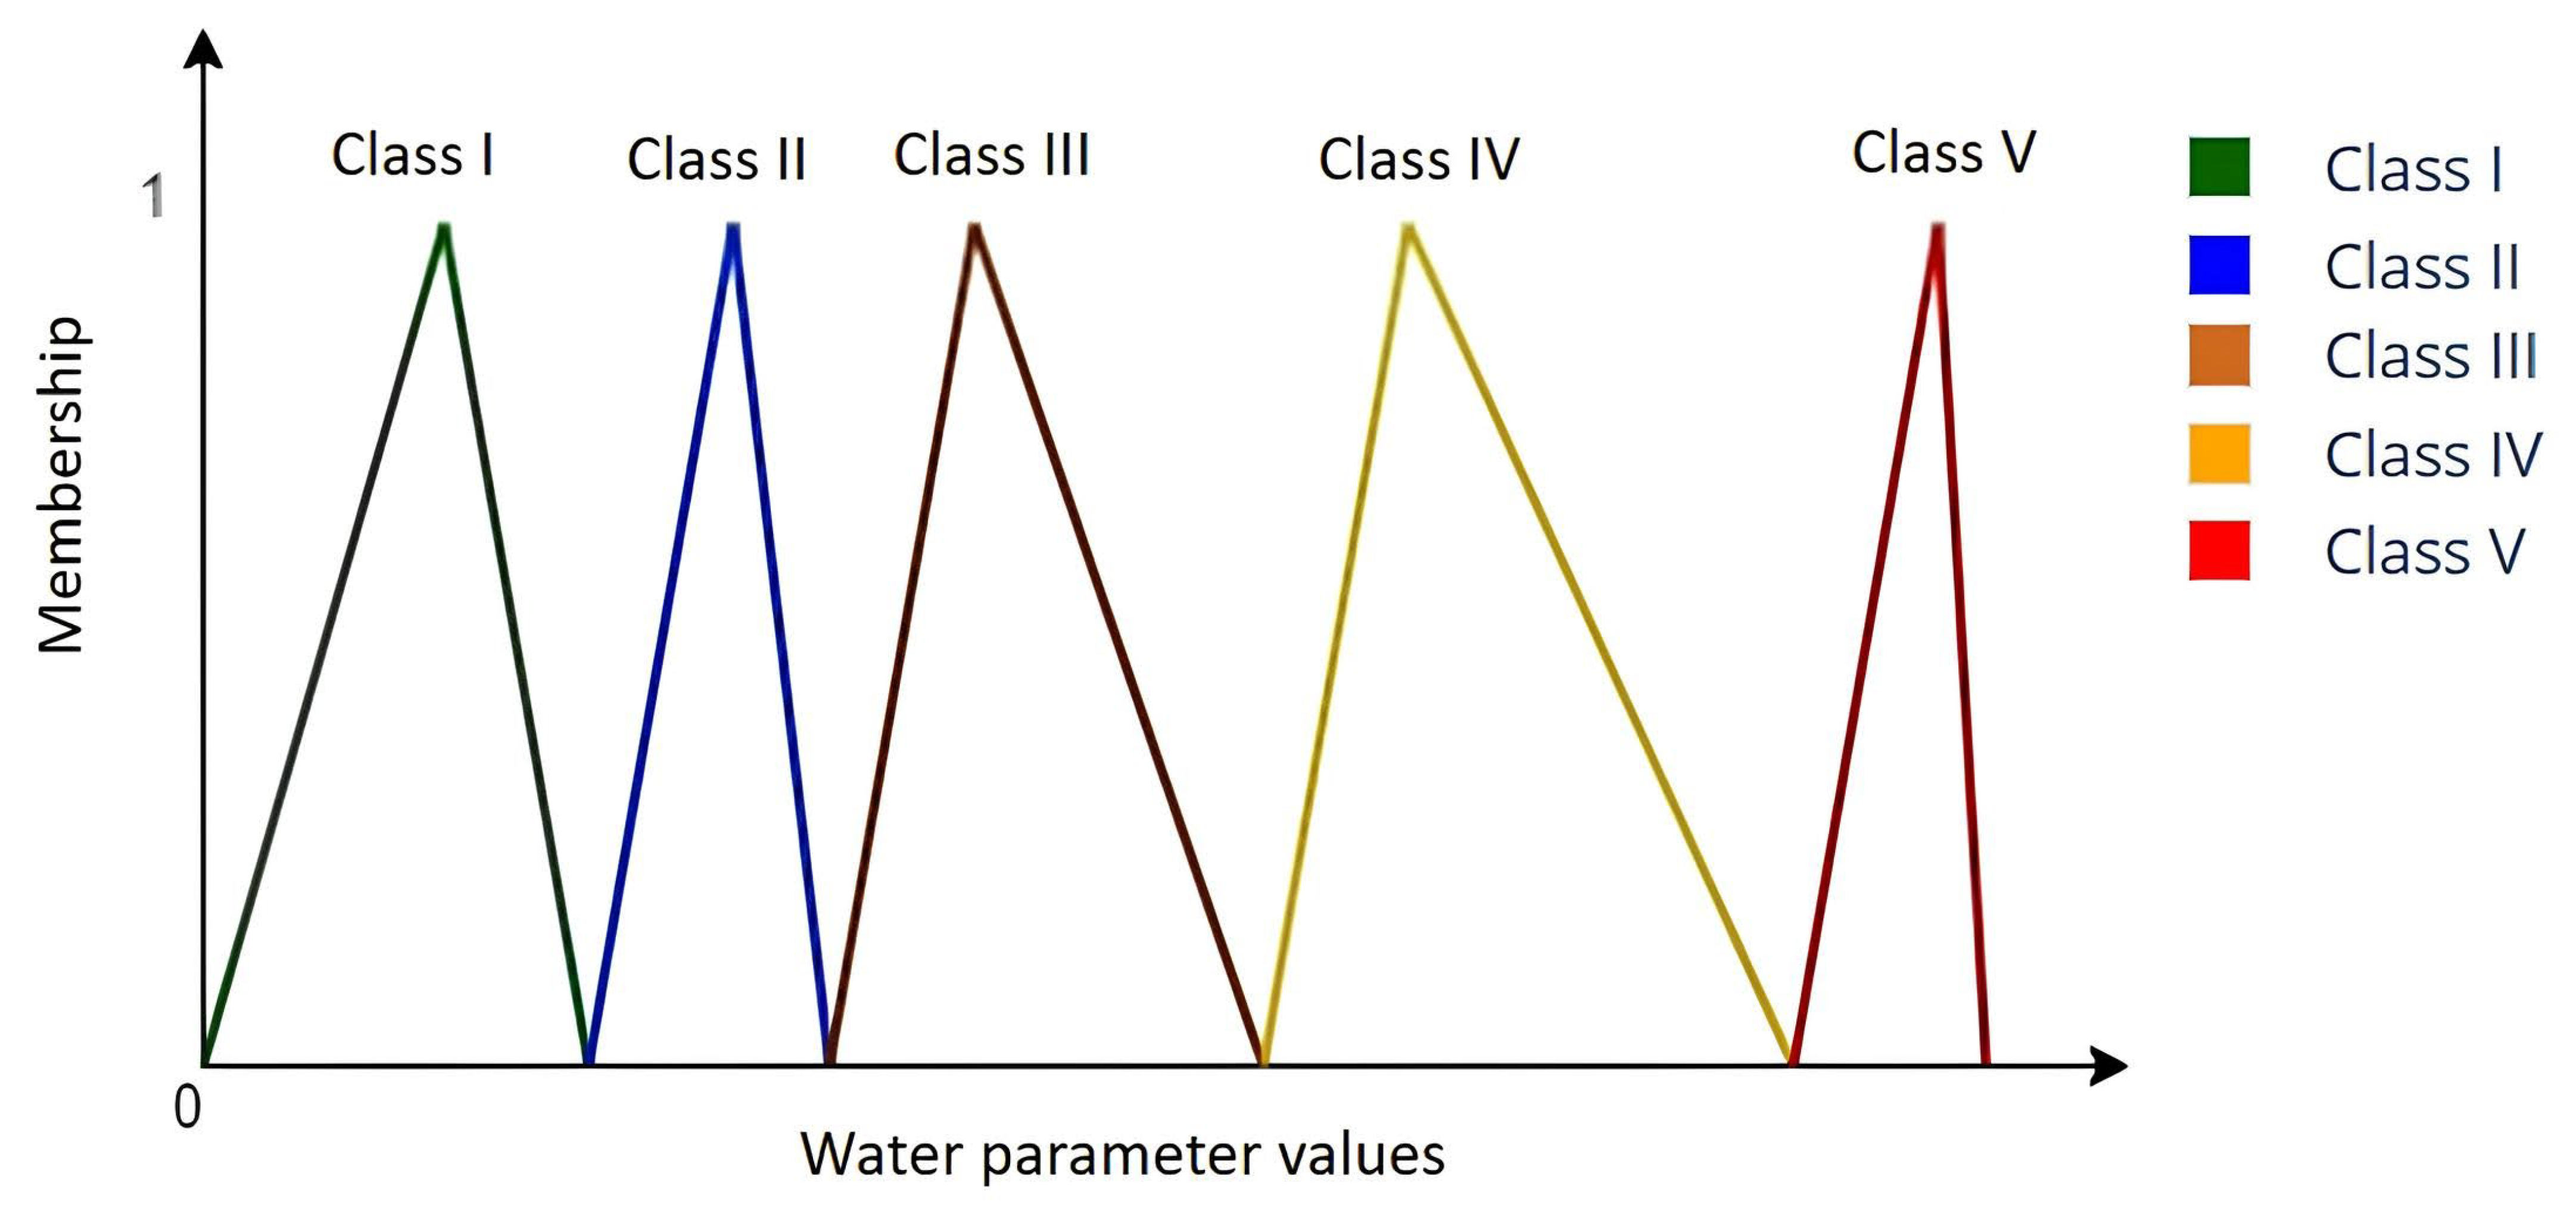
Fuzzy logic was utilized for each water quality indicator to transform actual measurement results into fuzzy values between 0 and 1. These figures demonstrate the degree to which a particular measurement correlated with various categories of water parameters. Triangular fuzzy membership functions provide a straightforward and effective approach to identifying and assessing water quality based on many parameters [
52].
A thorough technique was employed to analyze each water parameter, including AN, BOD, COD, DO, pH, and TSS. The classification from Class I to Class V is delineated according to the Malaysian DOE standard, as presented in
Table 2 [
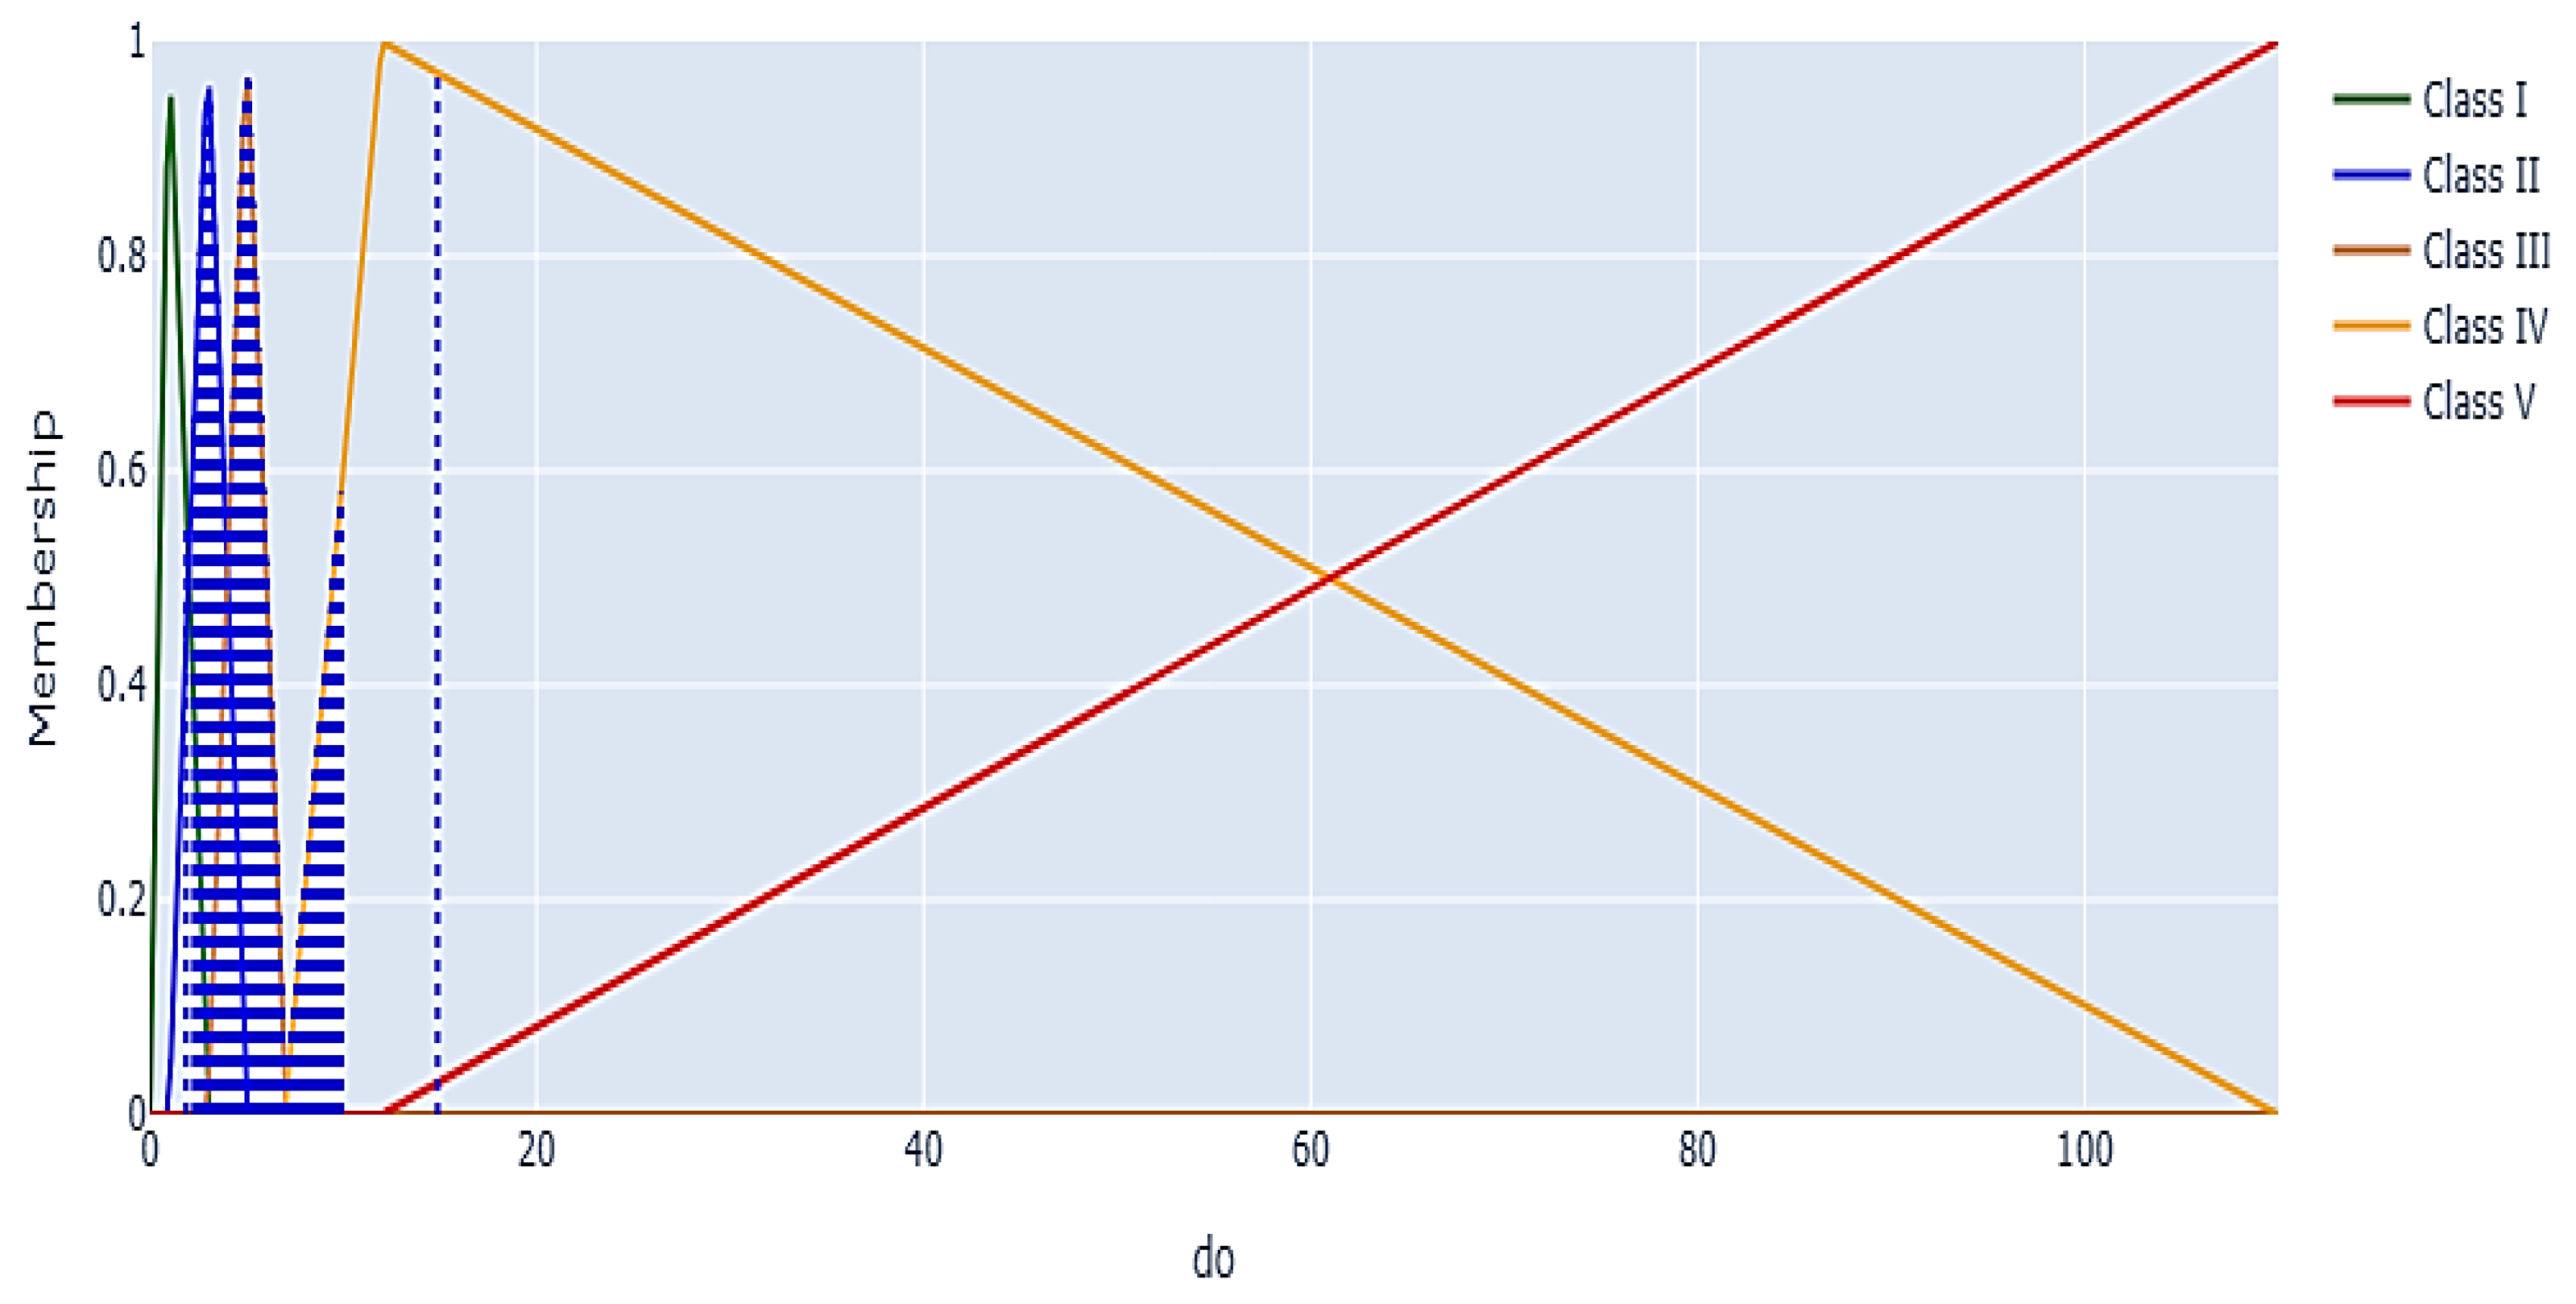
53]. Class I denotes a classification characterized by ammoniacal nitrogen concentrations ≤ 0.1 mg/L. This category signifies outstanding water quality characterized by minimal concentrations of ammoniacal nitrogen. The triangle function attains its peak value exactly at 0.1 mg/L and declines sharply as concentrations approach 0.3 mg/L. Class II is defined by a concentration range of 0.1 to 0.3 mg/L, peaking at 0.3 mg/L and subsequently declining to 0.9 mg/L. Classes III to V broaden the base of the triangle, representing the increasing acceptability of higher concentrations alongside deteriorating water quality. Class IV reaches a value of 0.9 mg/L and extends to 2.7 mg/L. Class V encompasses values exceeding 2.7 mg/L.
Reduced levels of BOD signify superior water quality. A triangle with a peak at 1 mg/L includes values that are ideally below this limit. The apex of each triangle signifies a class transition to the right, in accordance with the DOE guidelines. Class II attains its maximum at approximately 3 mg/L, Class III at 6 mg/L, and so forth. Each class encompasses a broader spectrum as the sides of the triangles intersect, signifying a gradual transition between the classes. The COD level, peaking at 10 mg/L, indicates few chemical pollutants. Similar to BOD, the triangles denoting COD likewise expand to the right as the thresholds rise. Class II peaks at 25 mg/L and subsequently progresses toward elevated values and broader bases for more contaminated categories.
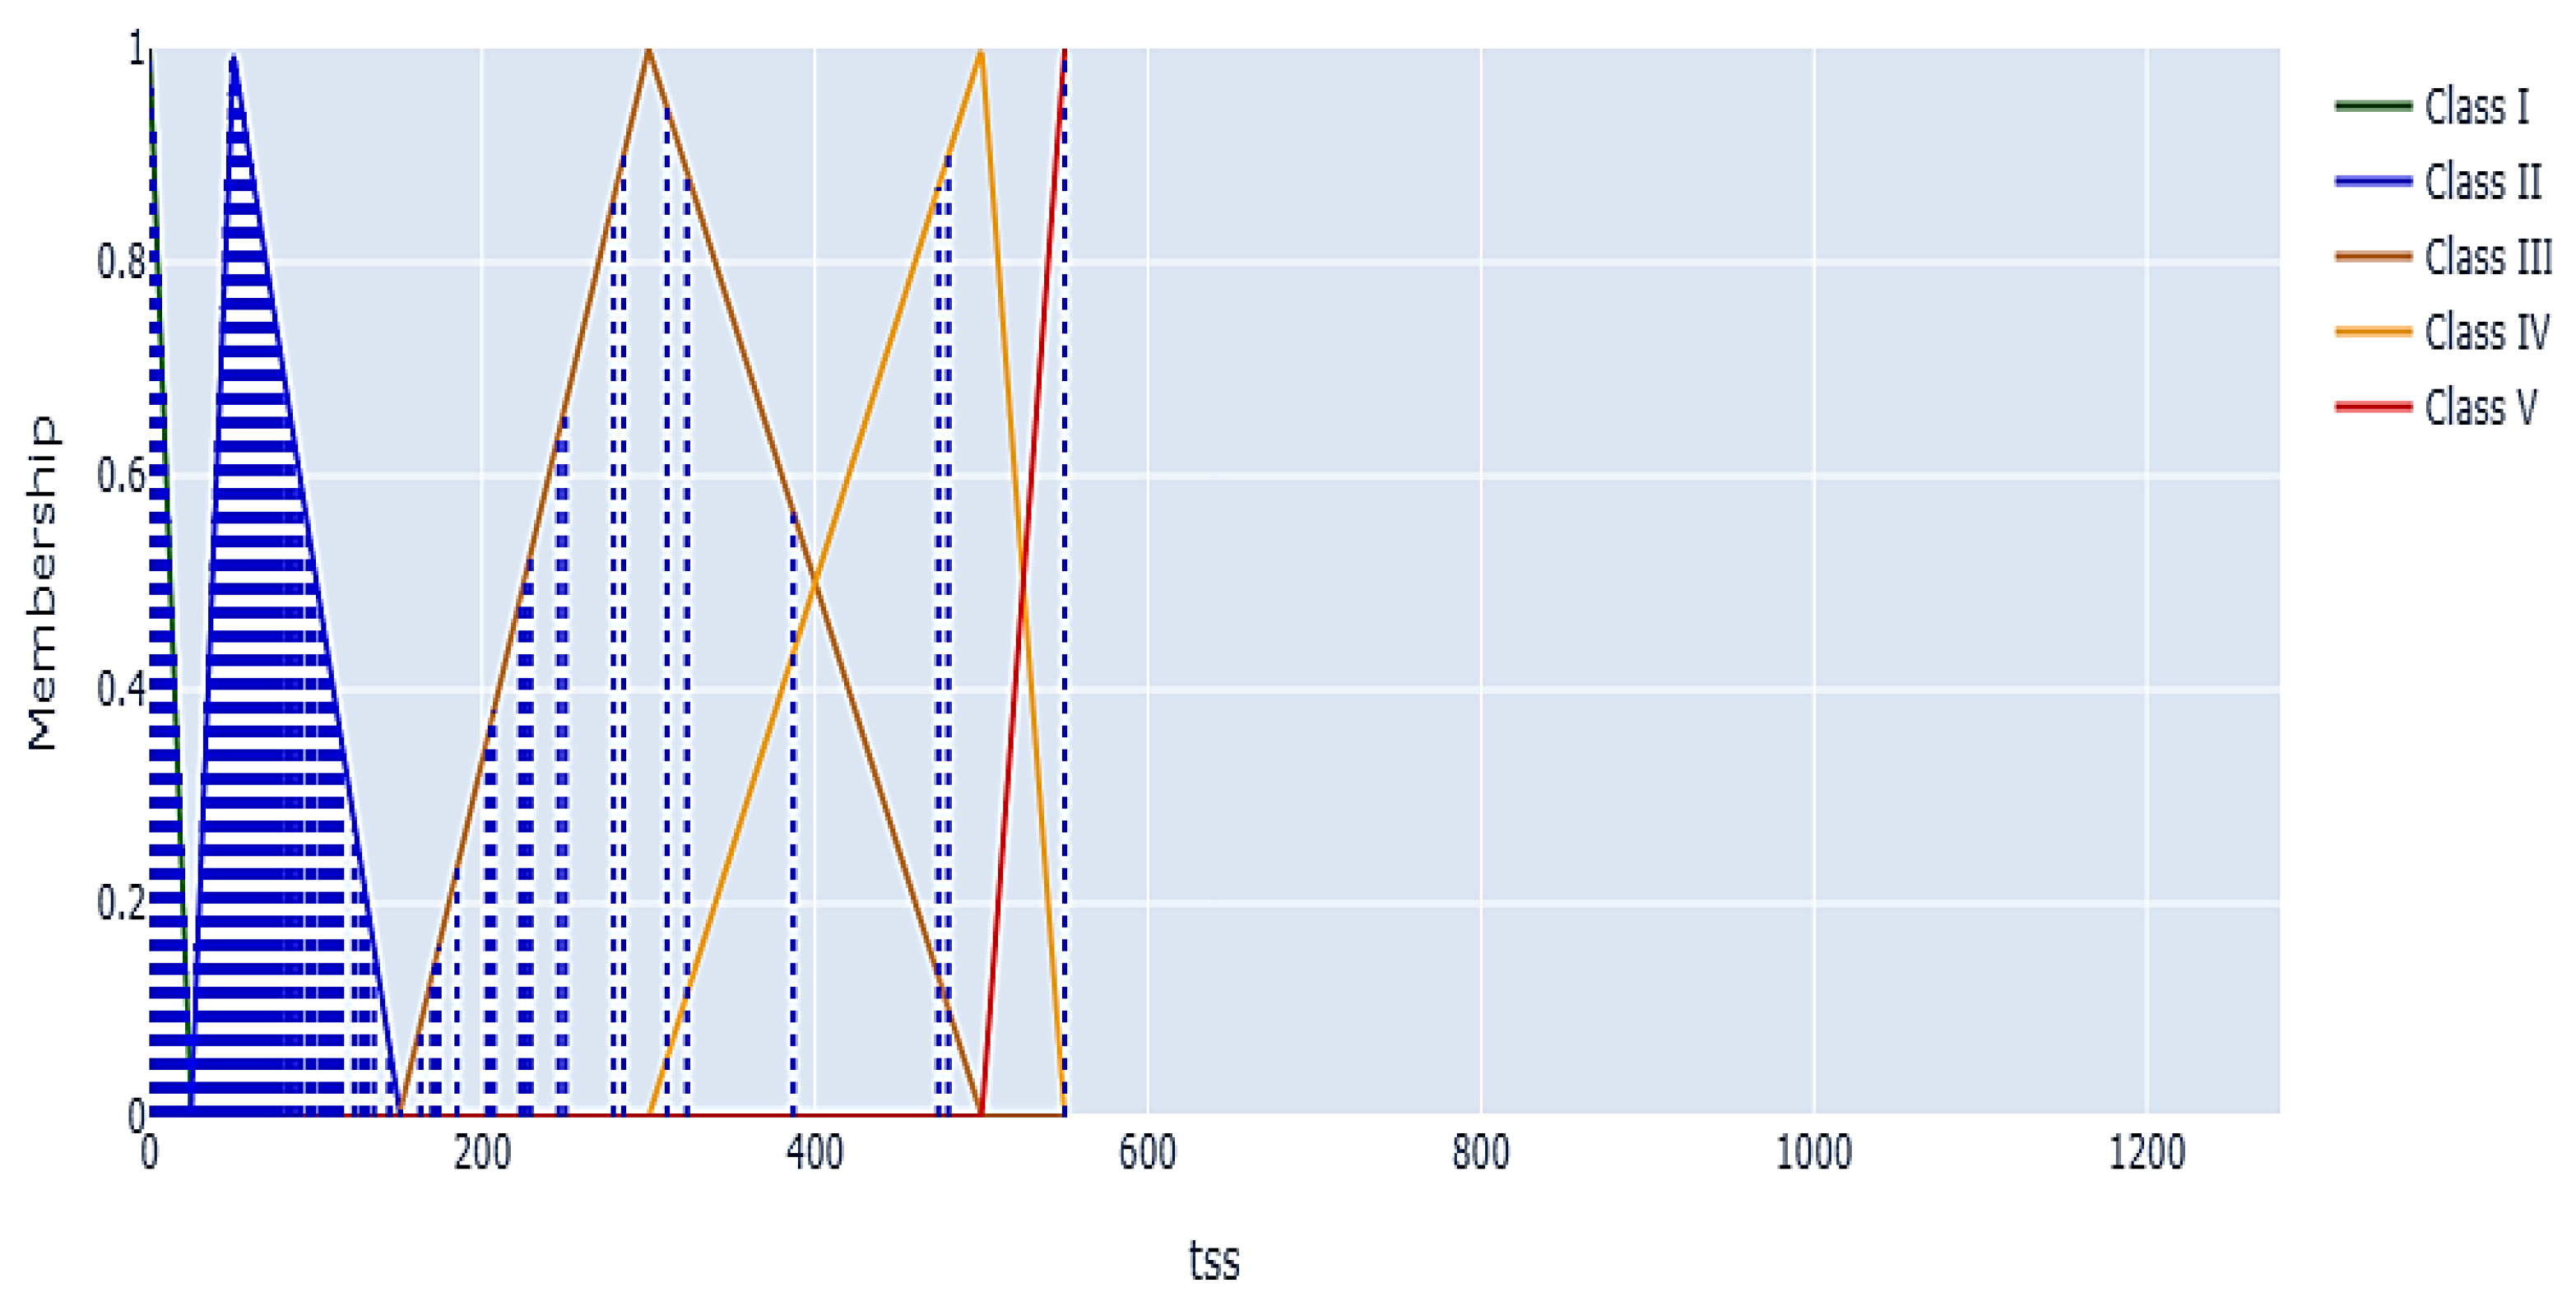
Figure 3 illustrates the application of inverted triangular fuzzy membership functions to represent variations in water quality parameters, namely, DO, pH, and TSS. In fuzzy logic, membership functions determine the degree to which a parameter value belongs to a particular class. Unlike rigid threshold-based systems, where a value either fully belongs or does not belong to a class, fuzzy logic allows partial membership across multiple classes. This flexibility ensures a more accurate representation of gradual changes in water quality conditions, thereby reducing the loss of information near classification boundaries.
For DO, the triangular membership function positions severe oxygen depletion at concentrations below 1 mg/L, where the triangle apex is at the lowest vertex. As DO levels increase, the degree of membership shifts upward across classes: Class IV centers near 3 mg/L, Class III around 5 mg/L, and Class I above 7 mg/L. This progression captures the reality that water quality does not improve abruptly but rather transitions smoothly across ranges. Similarly, pH is represented with a triangular function centered at neutrality (pH 7), with a narrow optimal range of 6.5–7.5 in Class I. Values below 6.0 or above 7.5 cause the membership apex to diverge, reflecting increasingly acidic or alkaline conditions.
For TSS, triangular functions reflect turbidity levels, with Class I assigned to values below 25 mg/L, representing clear water. As concentrations increase, membership shifts toward Class II (up to 50 mg/L) and Class III (up to 150 mg/L), indicating reduced clarity and higher suspended solids. These triangular models avoid sharp cut-offs and instead capture the uncertainty inherent in real-world water quality dynamics.
Overall, the fuzzy membership functions in
Figure 3 provide an intuitive yet mathematically grounded framework that enables gradual transitions between classes. This approach aligns with fuzzy logic theory, where intermediate parameter values contribute simultaneously to multiple quality categories, offering a realistic and interpretable basis for water quality classification. Beyond visualization, these triangular membership functions also provide analytical value by modeling the gradual transition between adjacent classes, thus capturing uncertainty and soft boundaries in water quality classification. This ensures that parameter values near thresholds are not rigidly categorized but instead represented in a way that supports more accurate interpretation and decision-making.
The interactive data table is a crucial visualization tool that provides a comprehensive view of both unprocessed and processed data for each recorded water parameter. The data include values for certain parameters, their associated subindices, and the calculated overall WQI.
Table 2 is a crucial tool for conducting a comprehensive analysis. It allows users to meticulously analyze individual data points and understand the influence of each parameter on the comprehensive evaluation of water quality.
Table 2 enables thorough examination and aids in detecting trends or anomalies in water quality data by presenting information in a structured and comprehensible style. The classification table improves the color-coded approach by offering a detailed tabular depiction of each water parameter’s classification, together with the overall classification of the WQI.
To provide clarity on the design of the proposed system, the main components of the fuzzy logic-based water quality monitoring interface are summarized in
Table 3. The table highlights each element of the dashboard and its specific function in supporting water quality assessment and decision-making. The WQI gauge offers an intuitive snapshot of overall water quality status, while parameter tables and bar charts provide a structured view of raw values and their categorical classifications. Fuzzy membership graphs enable more nuanced interpretation near threshold values, complementing time-series scatter plots that capture temporal variations. Similarly, the heatmap offers a holistic view of multiple parameters across sampling points, allowing rapid identification of anomalies. Collectively, these elements form an integrated and user-friendly dashboard designed to enhance the interpretation, communication, and management of water quality data.
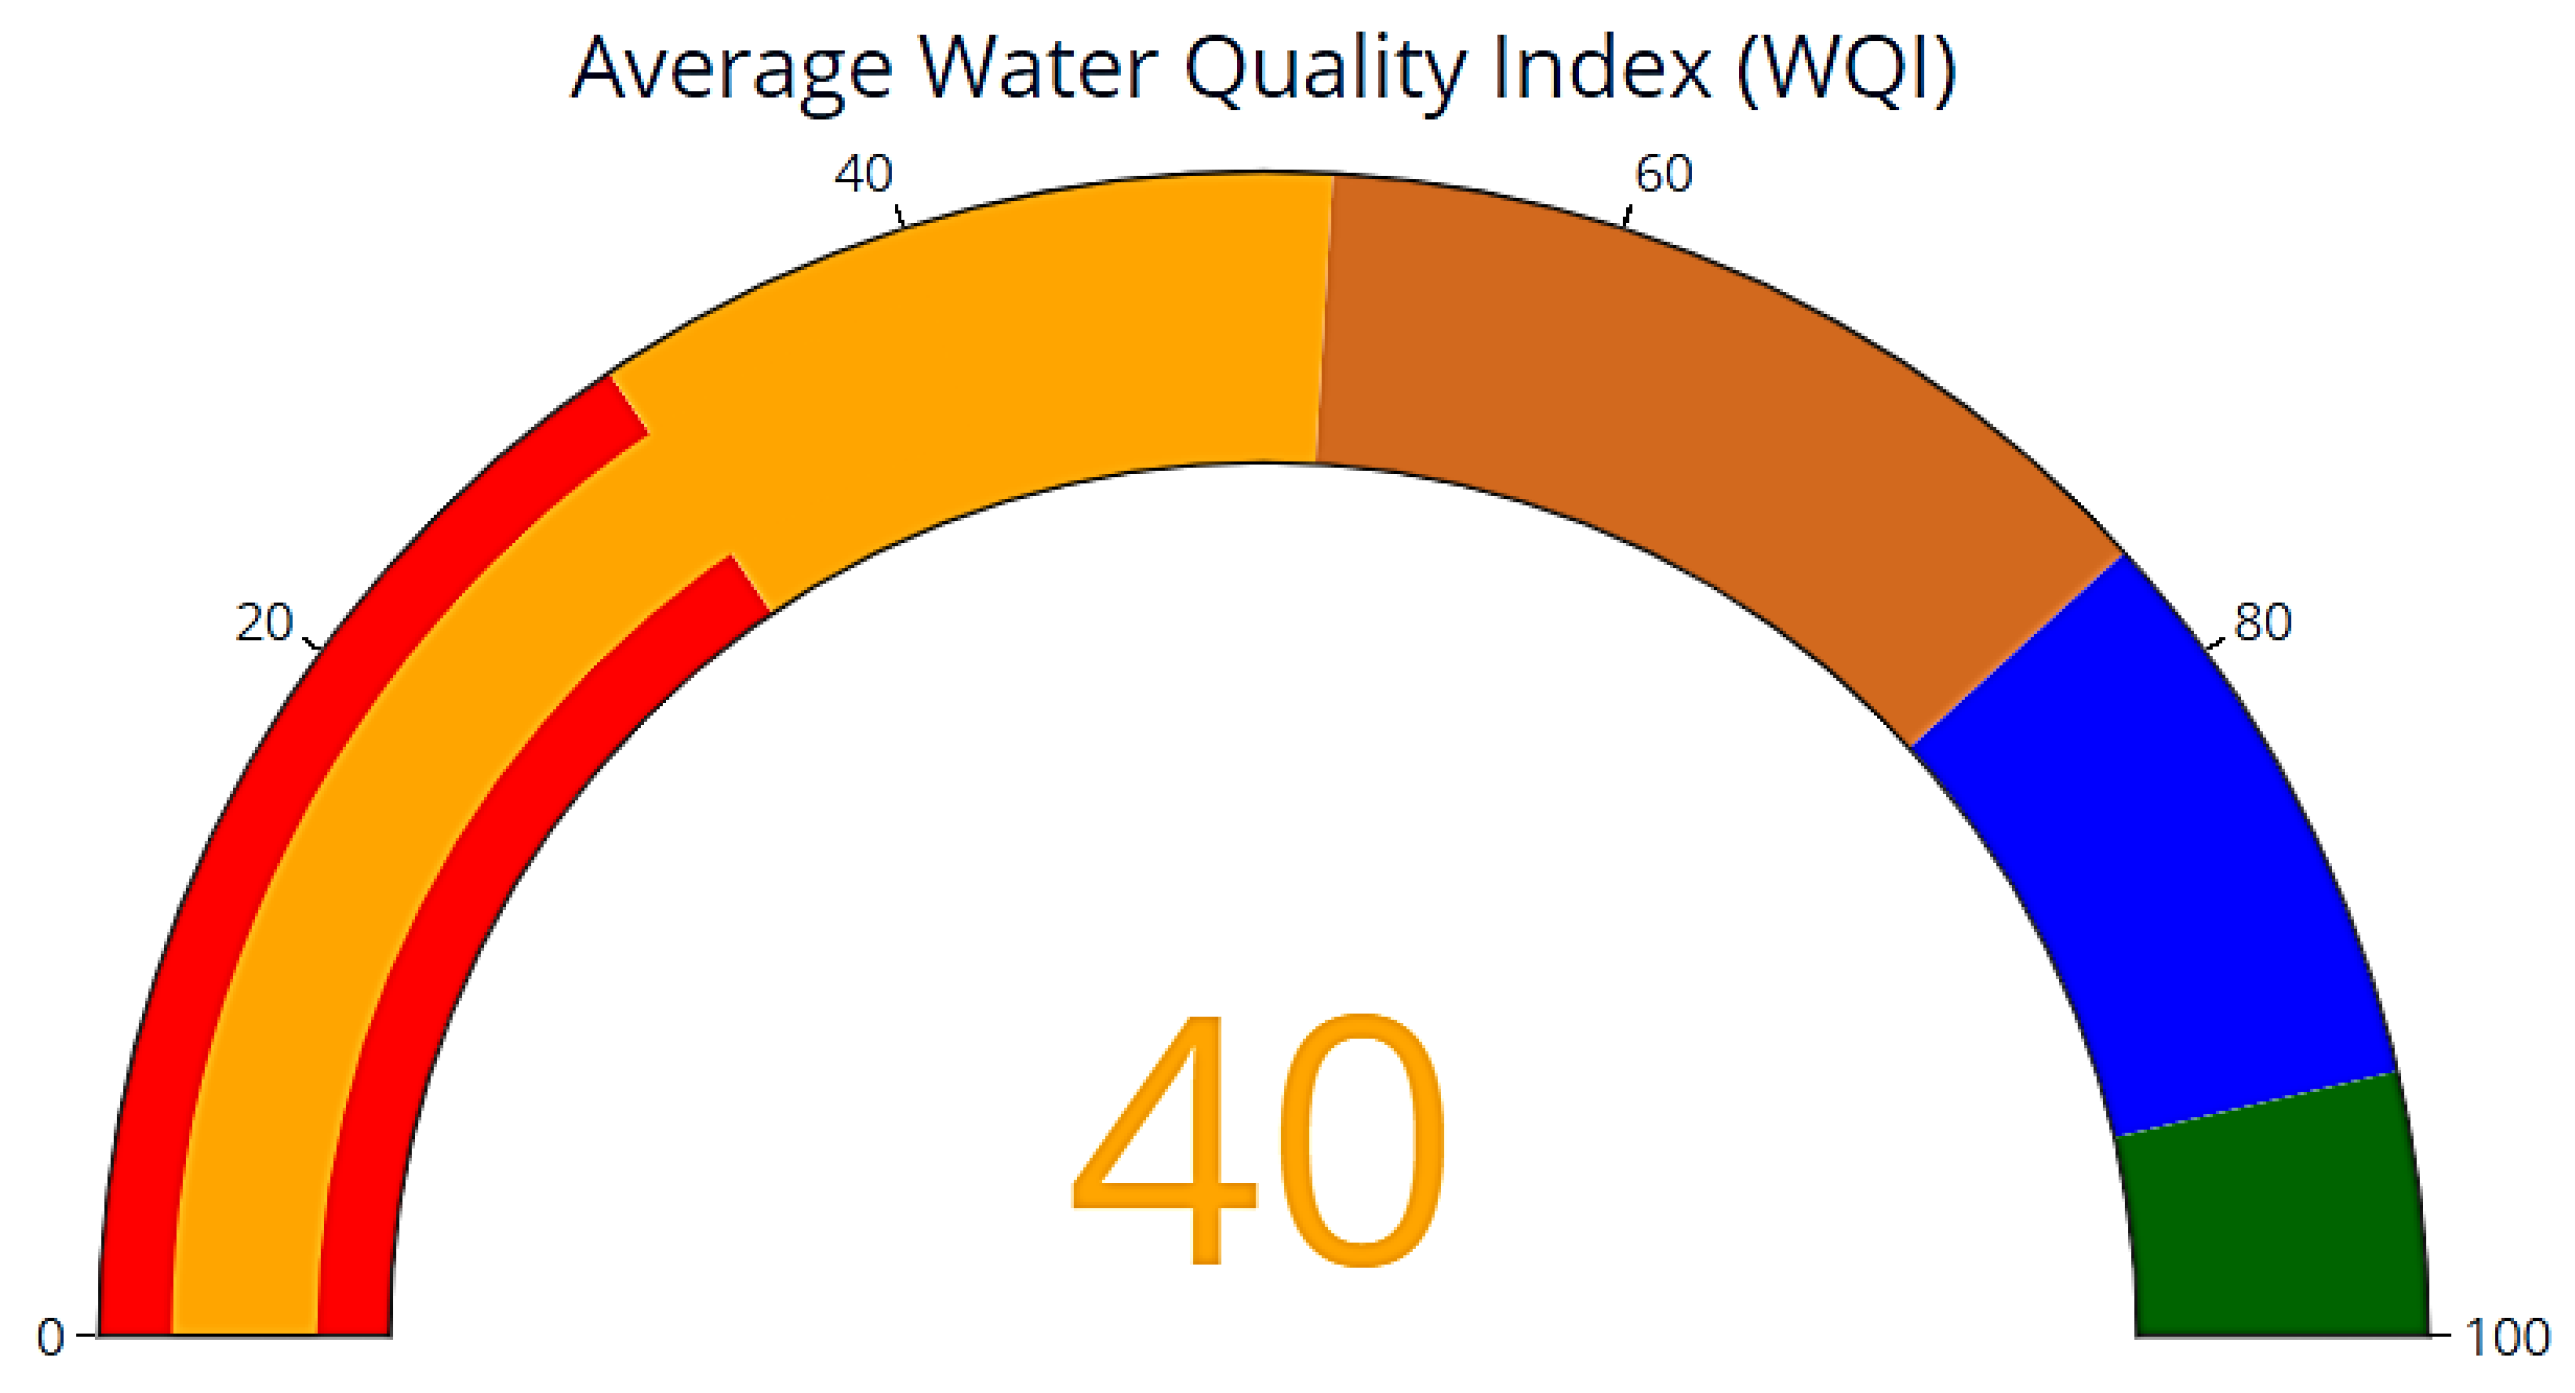
The WQI gauge average is a significant aspect of the visualization component, providing a succinct and immediate visual representation of overall water quality, as illustrated in
Figure 4. This gauge is designed to exhibit the WQI, a holistic metric generated from many water quality parameters. The gauge visually displays the WQI value for rapid understanding, categorizing it along a spectrum that denotes water quality levels as exceptional (Class I), decent (Class II), fair (Class III), bad (Class IV), or extremely poor (Class V). The intuitive visualization enables users to swiftly assess the overall status of the water body without requiring immediate analysis of more complex data.
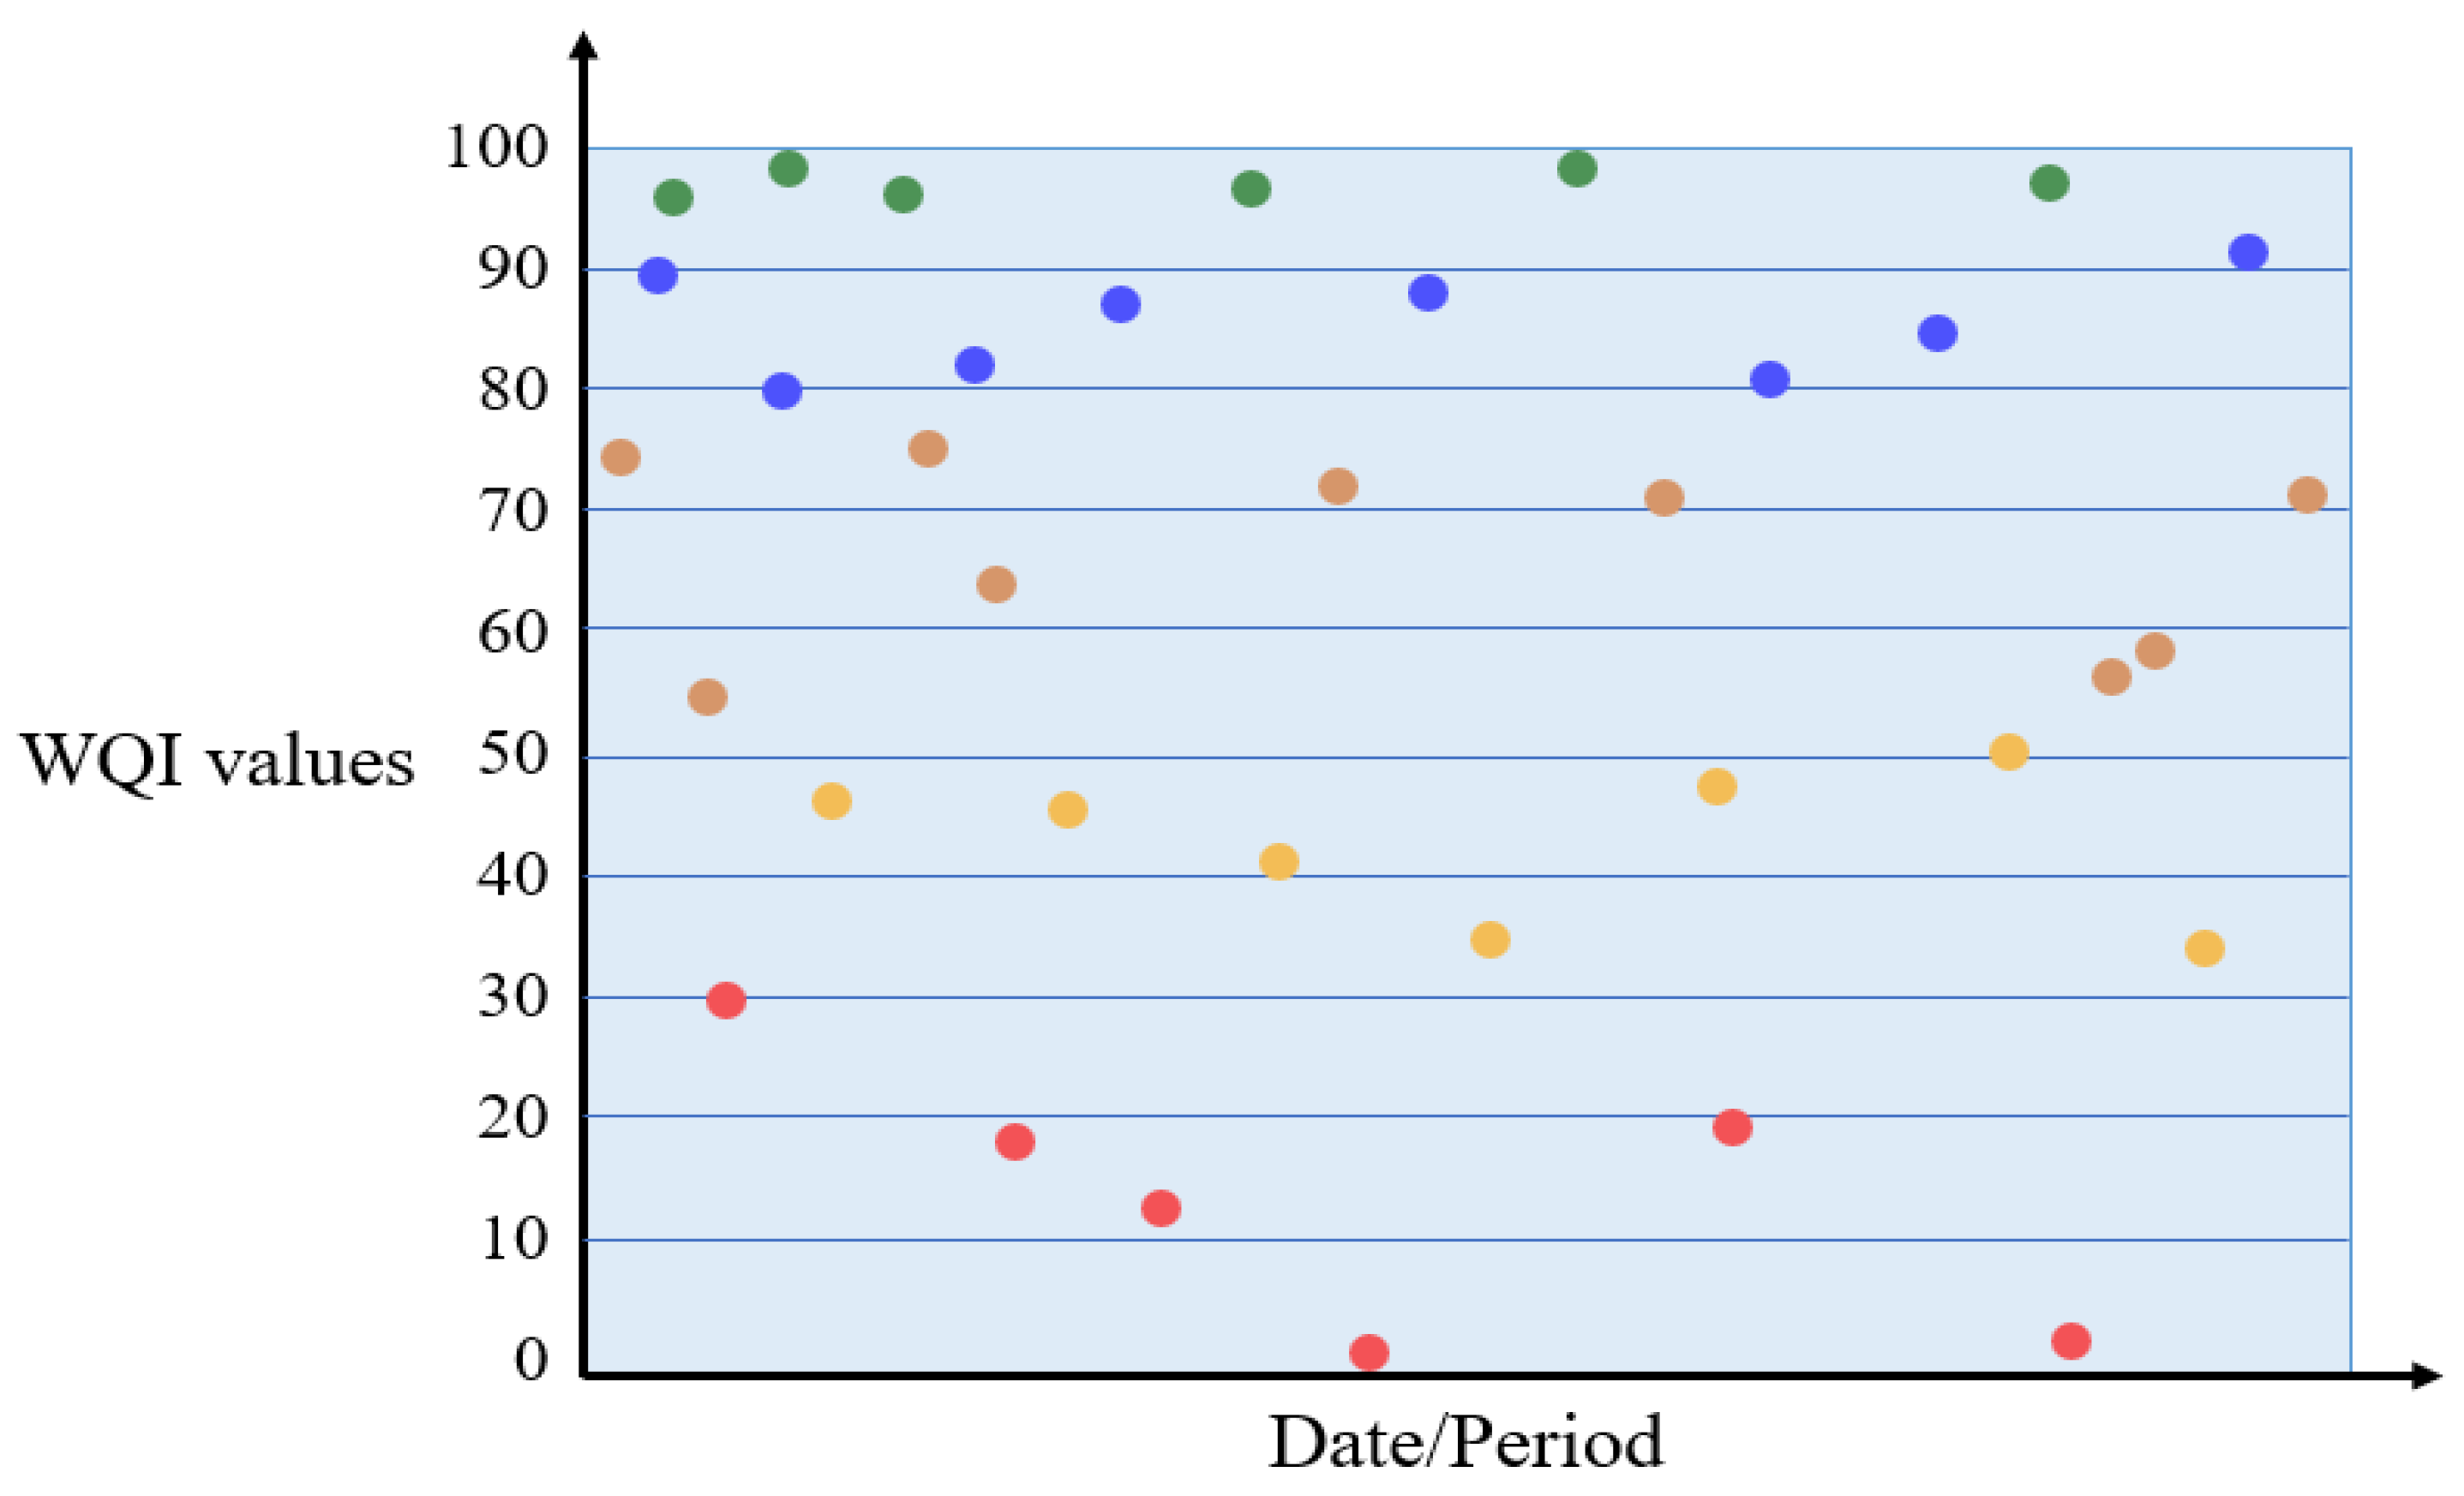
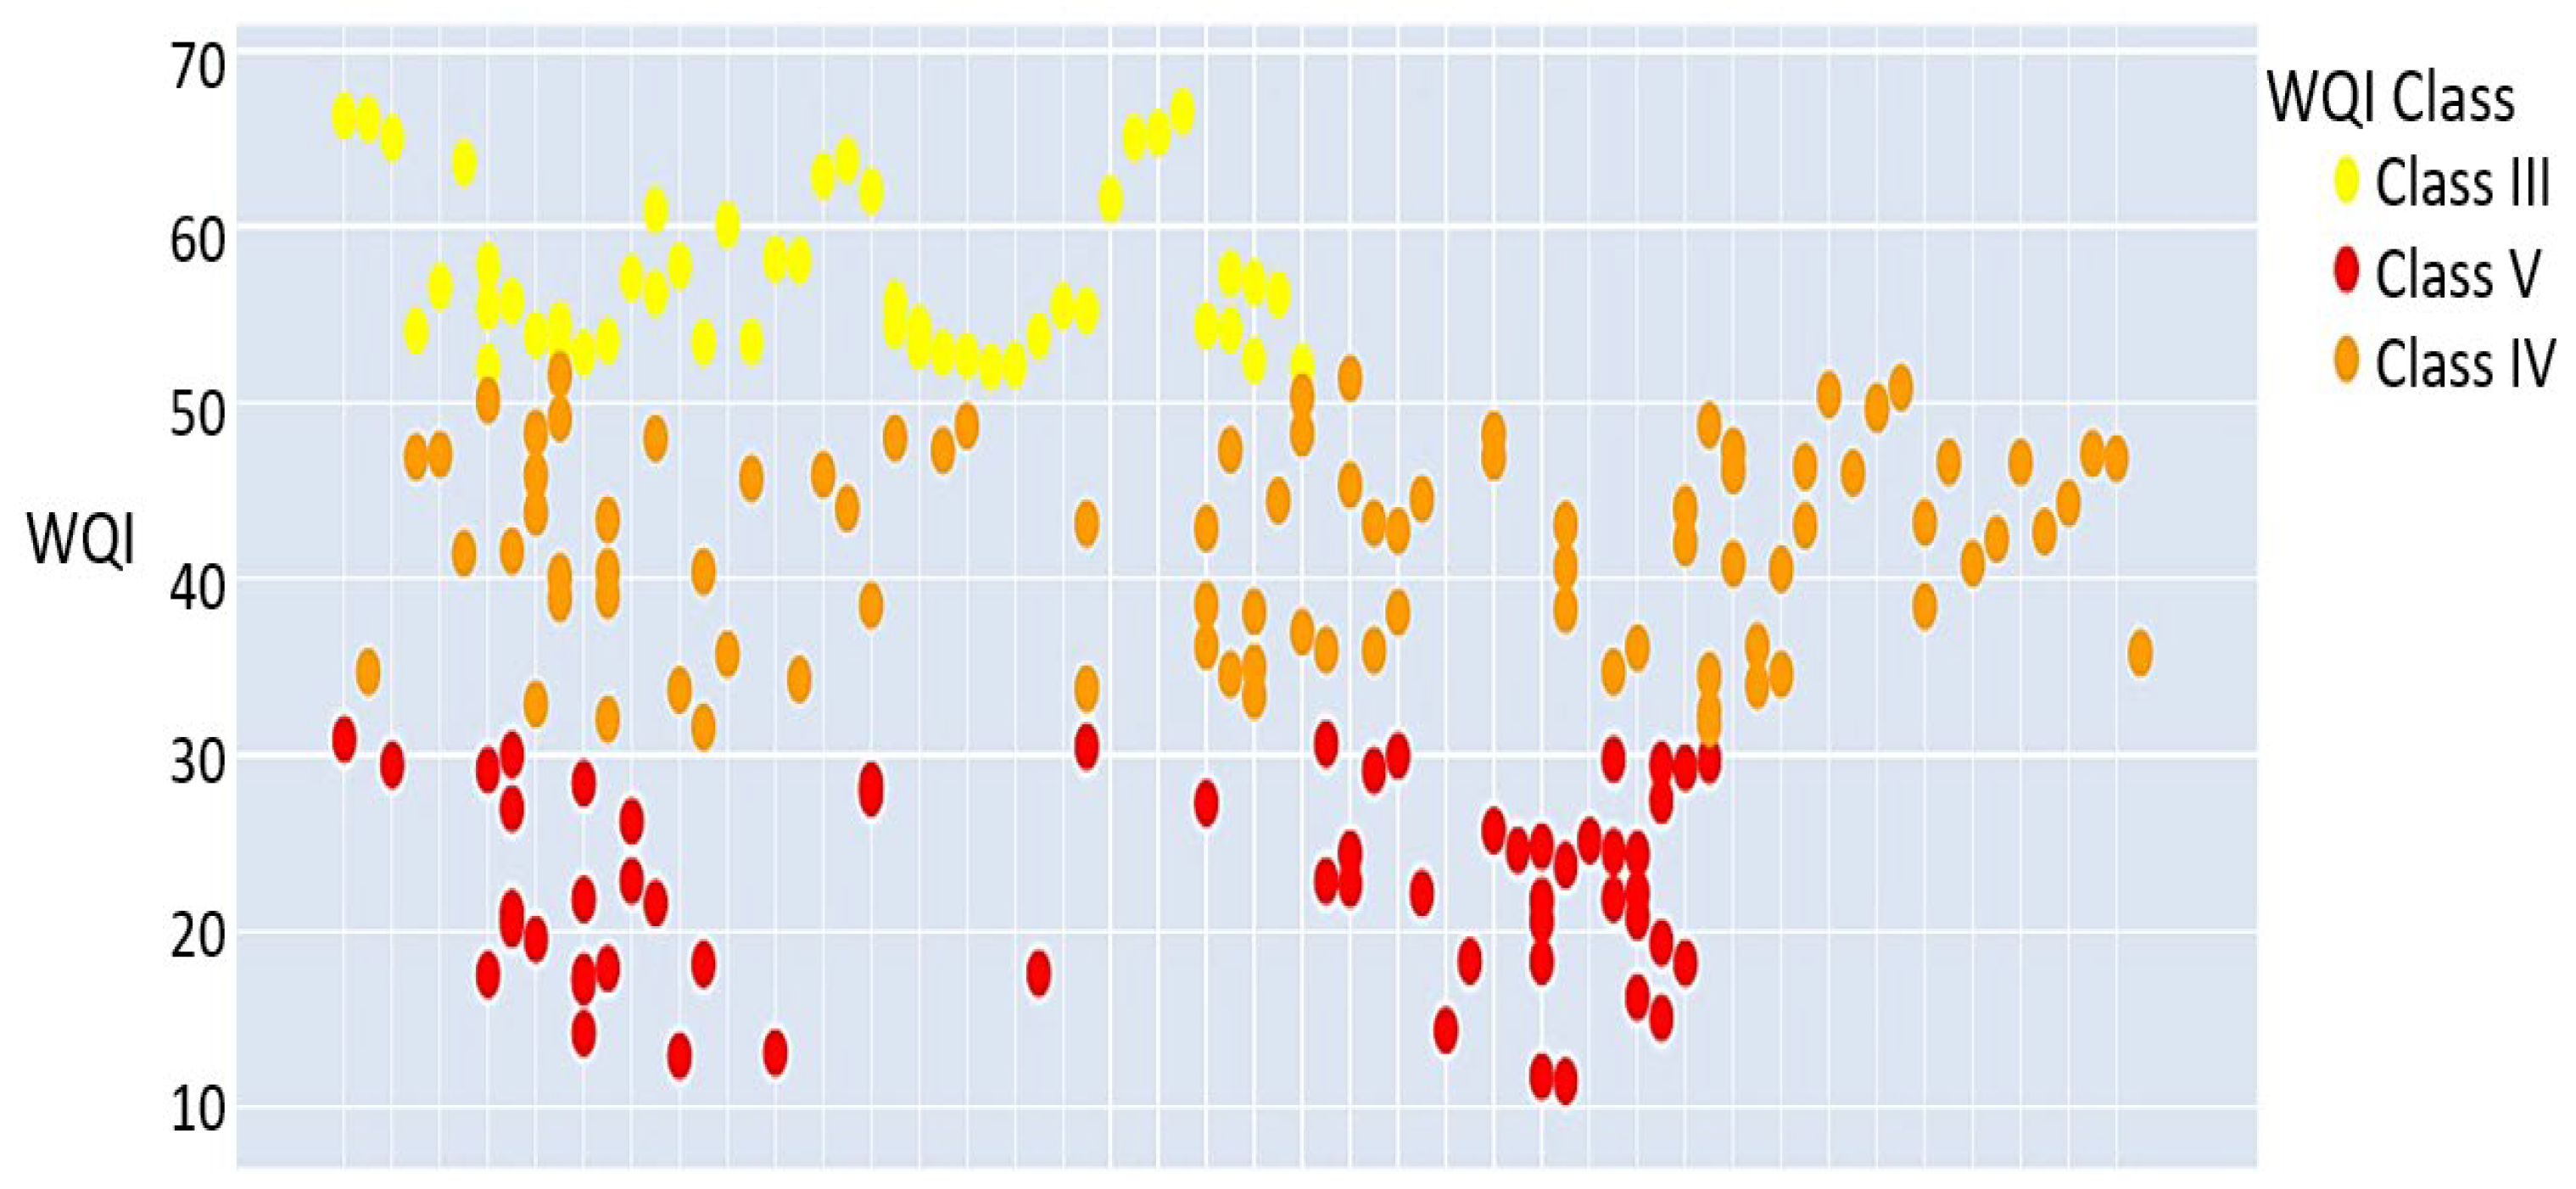
The time series scatter plot is an interactive visualization tool that illustrates the WQI over various time intervals, facilitating the detection of trends, seasonal patterns, and potential environmental impacts. The graph is essential for tracking temporal variations in water quality and can be pivotal in assessing the effectiveness of environmental policies and management strategies, as seen in
Figure 5. The map accurately depicts water quality over time by designating a distinct color to each data point according to WQI categories. This facilitates straightforward interpretation of environmental conditions through immediate visual indicators. The graph features a clearly labelled
x-axis with designated dates or intervals, facilitating a chronological evaluation of water quality. The
y-axis, calibrated to depict WQI values, facilitates a precise assessment of water quality levels during the specified period. The use of distinct colors for different WQI classes enhances the visual accessibility of the data, enabling swift assessments and comparisons of water quality over multiple time intervals. The visualization has interactivity as a key attribute, including technologies such as tooltips that deliver detailed information about specific data points upon hovering. This may include accurate WQI measurements, classifications, and associated dates [
55].
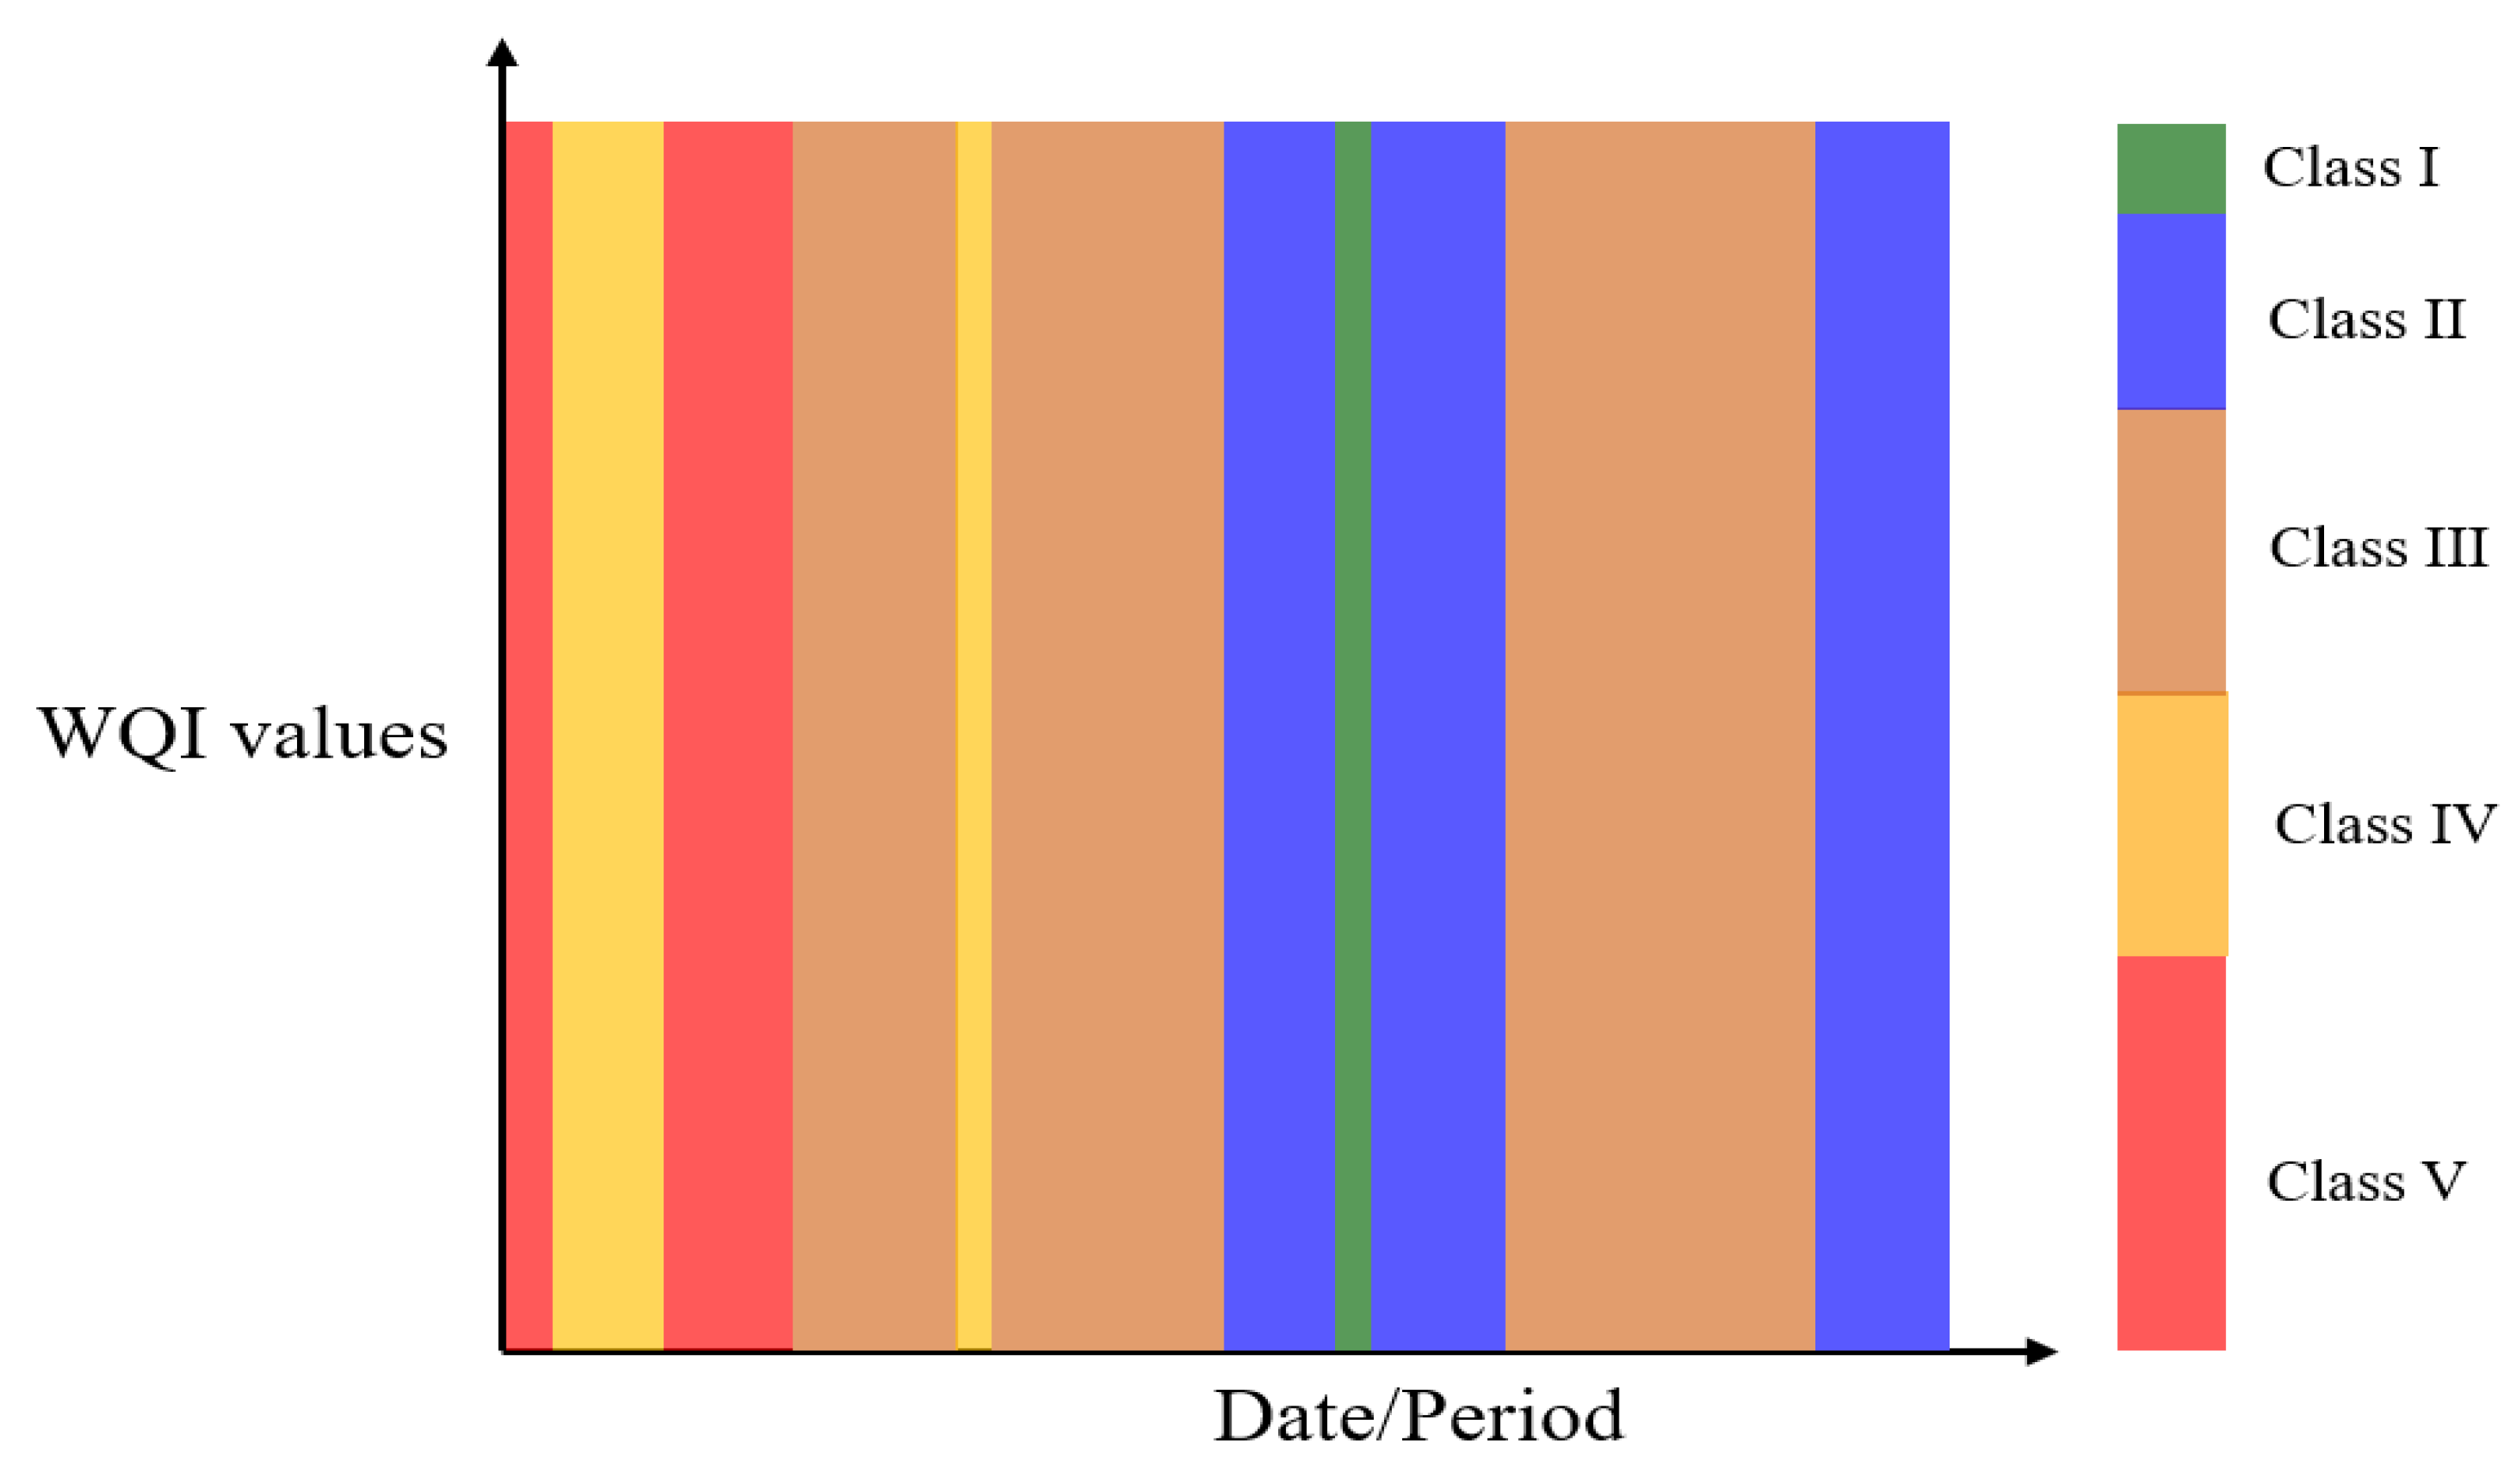
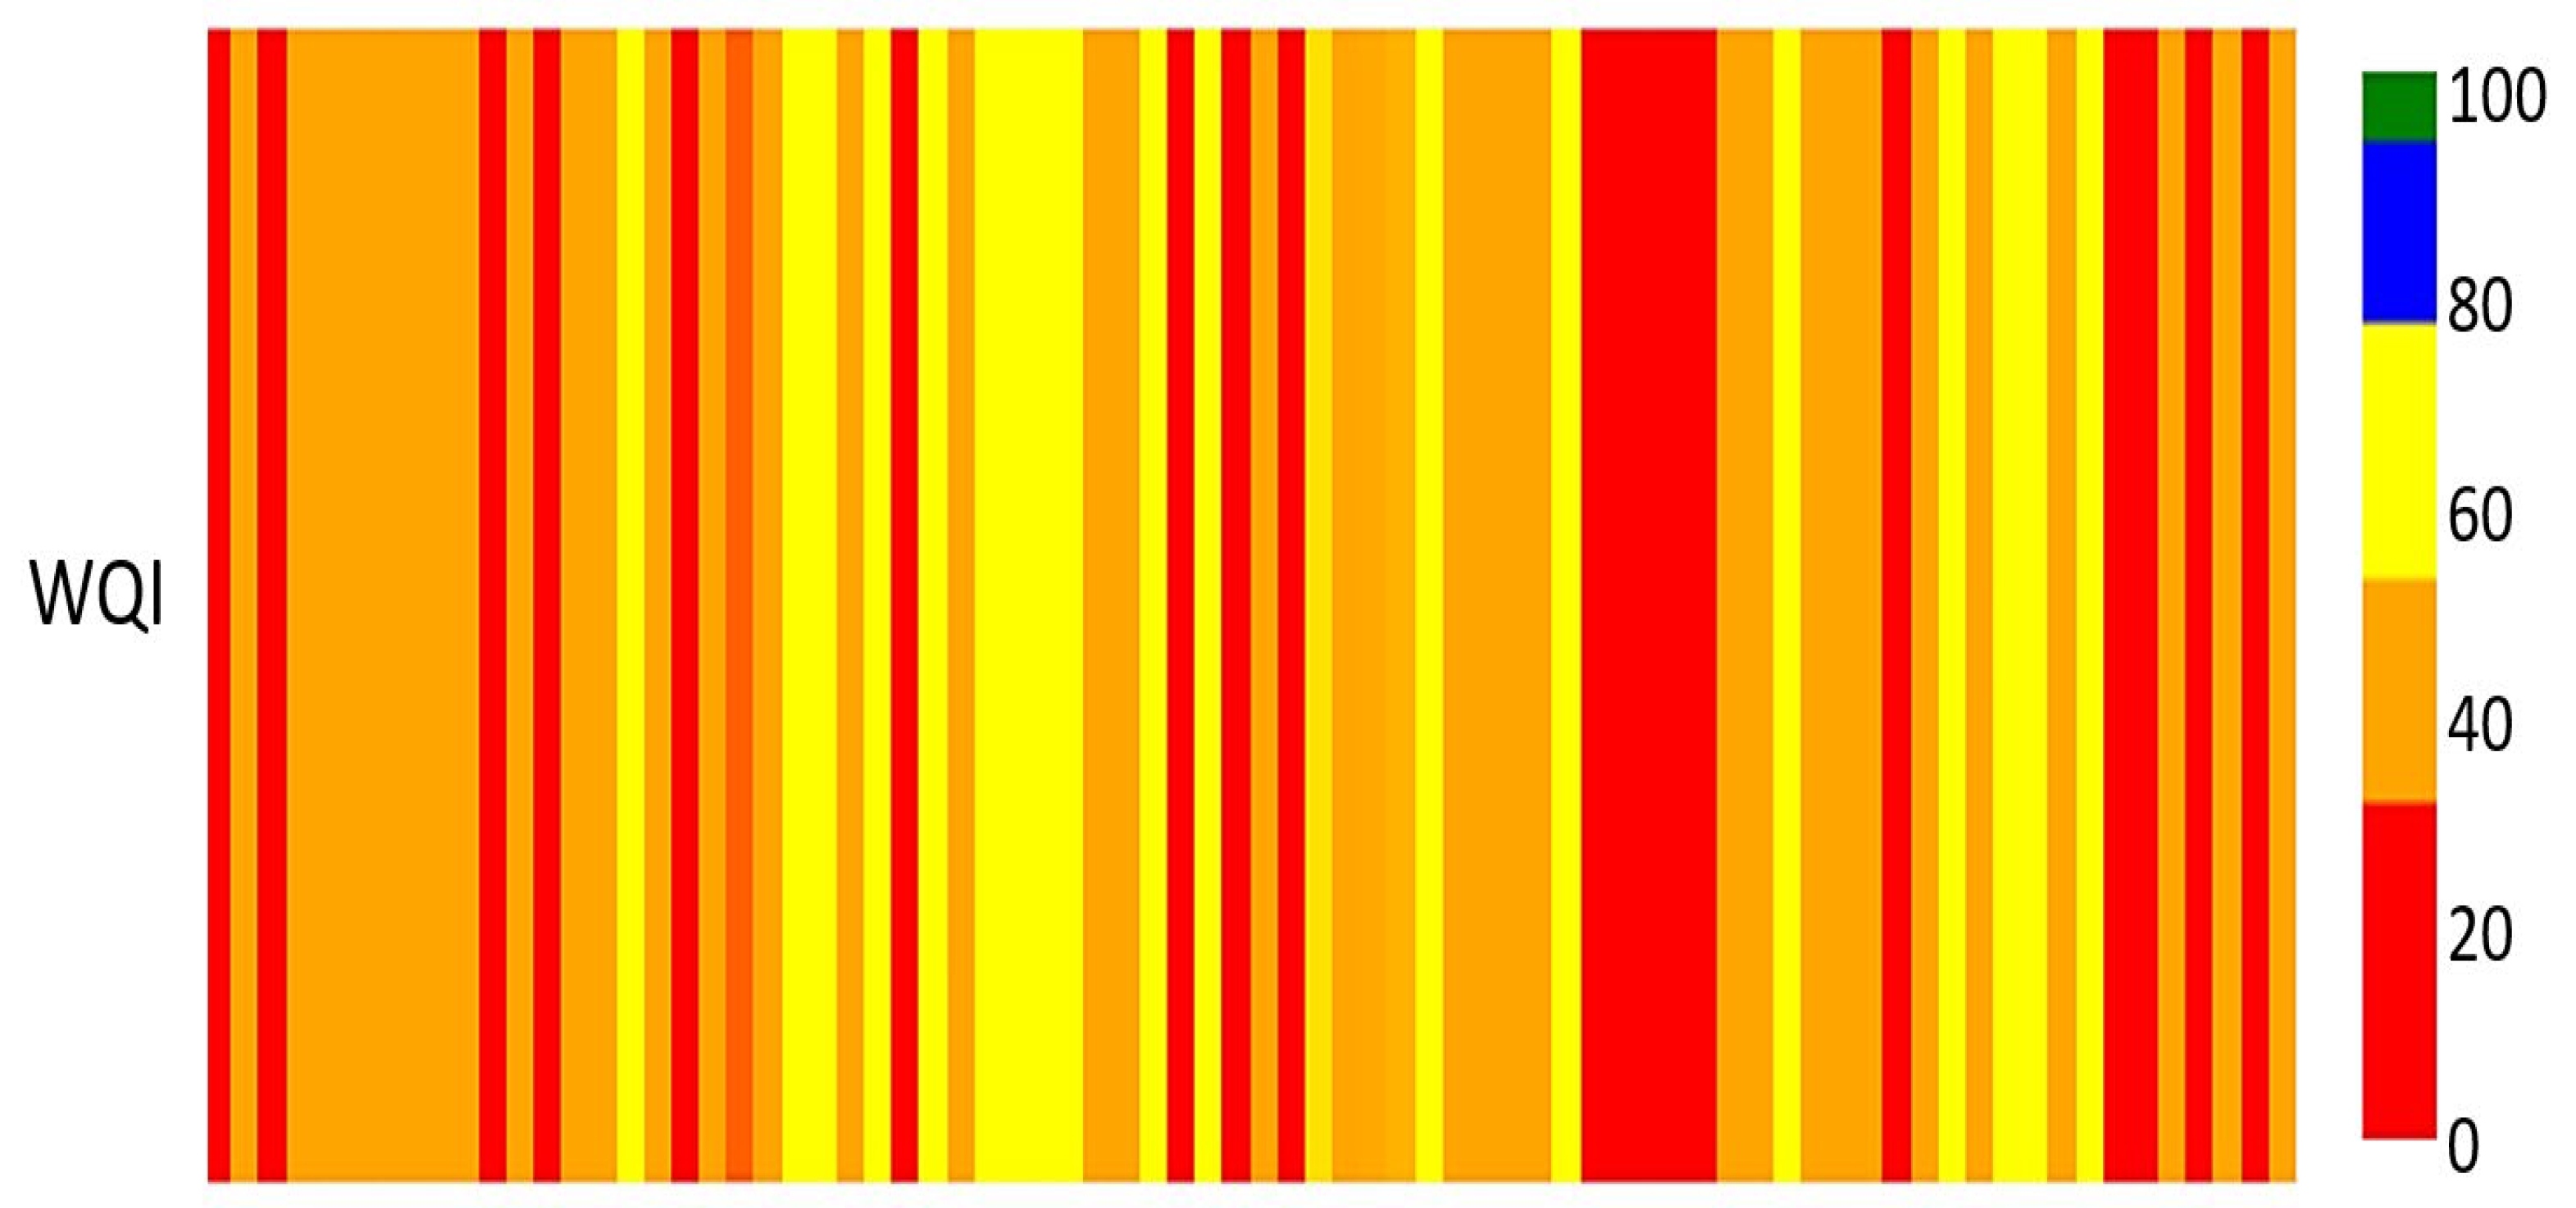
The heatmap offers a visual depiction of water quality, illustrating daily variations across various geographical regions from many sites.
Figure 6 illustrates that the heatmap offers a concise and direct approach to assessing the environmental conditions of a specific region by designating a distinct color to each area according to its water quality classification. The visualization method is particularly helpful in identifying places with elevated pollution levels or regions with water quality markedly superior to other communities. It is essential for guiding specific environmental actions and resource allocation.
The online interface is meticulously designed using Python version 3.13 for computational processing and data administration, while hypertext markup language (HTML) is utilized for creating a user-friendly web front end. This configuration leverages the distinct attributes of each element to enhance the functionality and user engagement of the visual interface. It is hosted on Replit, a cloud-based integrated development environment (IDE). The preference for Replit over alternative development platforms such as AWS, Heroku, and GitHub version 3.17 is primarily driven by its efficient and comprehensive IDE, which significantly streamlined both the initial setup and ongoing maintenance of the system [
56]. The browser-based IDE offered by Replit facilitates immediate code execution and hosting under a unified UI. This integration obviates the necessity for complex configuration processes typically associated with more robust cloud services like AWS, hence alleviating the effort involved in establishing and overseeing development environments [
57].
Python, functioning on the backend, does numerous essential actions. The method begins by parsing the user-provided CSV files to extract water quality information. This procedure involves data evaluation, structural verification, and ensuring compliance with established standards necessary for accurate analysis. The backend Python code manages interactions with a database that stores the processed data [
58]. This includes actions such as incorporating new data, altering existing entries, and retrieving data to produce reports and visualizations.
HTML constitutes the essential structure for the front end of the interface, providing a graphical user interface for user interaction [
59]. The interface is designed to be user-friendly, allowing users to easily upload their CSV files and acquire the results of data processing in a clear and comprehensible format. This includes real-time updates on data processing progress, the display of computed WQI through various charts and tables, and interactive elements that allow users to explore water quality data. The frontend HTML manages user inputs and delivers feedback. The interface logs user activities, including file uploads and parameter selections, which are then sent to the backend for processing.
The Replit function serves as a platform for the creation, testing, and deployment of the Python backend and HTML frontend [
60]. The IDE provides an integrated platform that supports Python and allows for the direct hosting of web applications, thereby accelerating development cycles. Replit is particularly suitable for development and small-scale applications. In this context, the dashboard does not generate new data metrics but rather represents and visualizes them through various tools, such as fuzzy membership functions, WQI gauges, and scatter plots. These visualizations show the different degrees of membership for each water quality class, allowing for a more intuitive understanding of parameter variations. Furthermore, the configuration on Replit enables effortless migration to more scalable cloud platforms if necessary [
60].
4. Results and Discussion
The user interface or dashboard has been designed to provide precise and operational water quality metrics. Optimizing the process of data upload and visualization facilitates timely decision-making, which is crucial for efficient water quality management. The dashboard design prioritizes clarity, usability, and accessibility, facilitating user navigation and enabling the extraction of essential insights from the data. To validate the added value of the fuzzy dashboard, a comparative analysis is conducted against the conventional DOE-WQI classification. Across the 66,390 samples, approximately 18% of cases fall within ±5% of the class boundaries. In these borderline cases, the rigid DOE-WQI produces abrupt class changes, whereas fuzzy membership functions provide smoother transitions. As a result, 15.4% of samples receive more interpretable classifications, reducing ambiguity and enabling clearer communication to stakeholders.
Figure 7 depicts the WQI gauge, which visually represents and evaluates water quality by integrating various pollution indicators. This gauge accurately represents the mean WQI as a numerical value of 40 on a scale from 0 to 100, where higher values indicate superior water quality. The incorporation of a multi-colored gauge improves data clarity. The red color indicates very poor water quality (WQI 0–31). The orange color signifies a medium water quality level, ranging from 31 to 52. The brown color signifies a moderate quality level, ranging from 52 to 77, and the blue color shows a high-quality level, with values ranging from 77 to 93. Meanwhile, the green color indicates a notable water quality level, ranging from 93 to 100.
Table 4 presents comprehensive data on user-uploaded values for various water quality indicators. The parameters encompass data, pH, AN, DO, BOD, COD, and TSS. These indications are essential for determining the overall status of water bodies. The system automatically computes the subindexes for each parameter following data upload. The subindex for each parameter is calculated using algorithms that accurately reflect the impact of each parameter on water quality. The subindex of DO can be calculated differently from the subindex for BOD. This illustrates the unique roles of individual parameters in assessing water quality. The calculation of WQI according to Malaysian standards is essential as it converts raw data into standardized indices, facilitating consistent comparisons across various time periods and contexts. The WQI aggregate quantitatively represents the significance of each component in assessing overall water quality.
Water quality is categorized into distinct classes following the computation of the WQI and its subindices. The classifications extend from Class I (Excellent) to Class V (Poor). The classification table presented in
Table 5 prominently features a color-coded representation. Persistent issues exist regarding nitrogen levels and organic pollutants. The parameters, such as AN and COD, persist in declining into lower classifications (Class IV and V). This trend is likely caused by insufficient wastewater treatment and intermittent industrial discharges. The variation in pH categories reflects the presence of different acid-based conditions in the water, potentially influenced by external factors such as precipitation, industrial pollutants, or environmental changes. The inadequacy of the BOD and COD categories may significantly contribute to the overall low WQI. This underscores the necessity of implementing targeted measures to mitigate organic pollution.
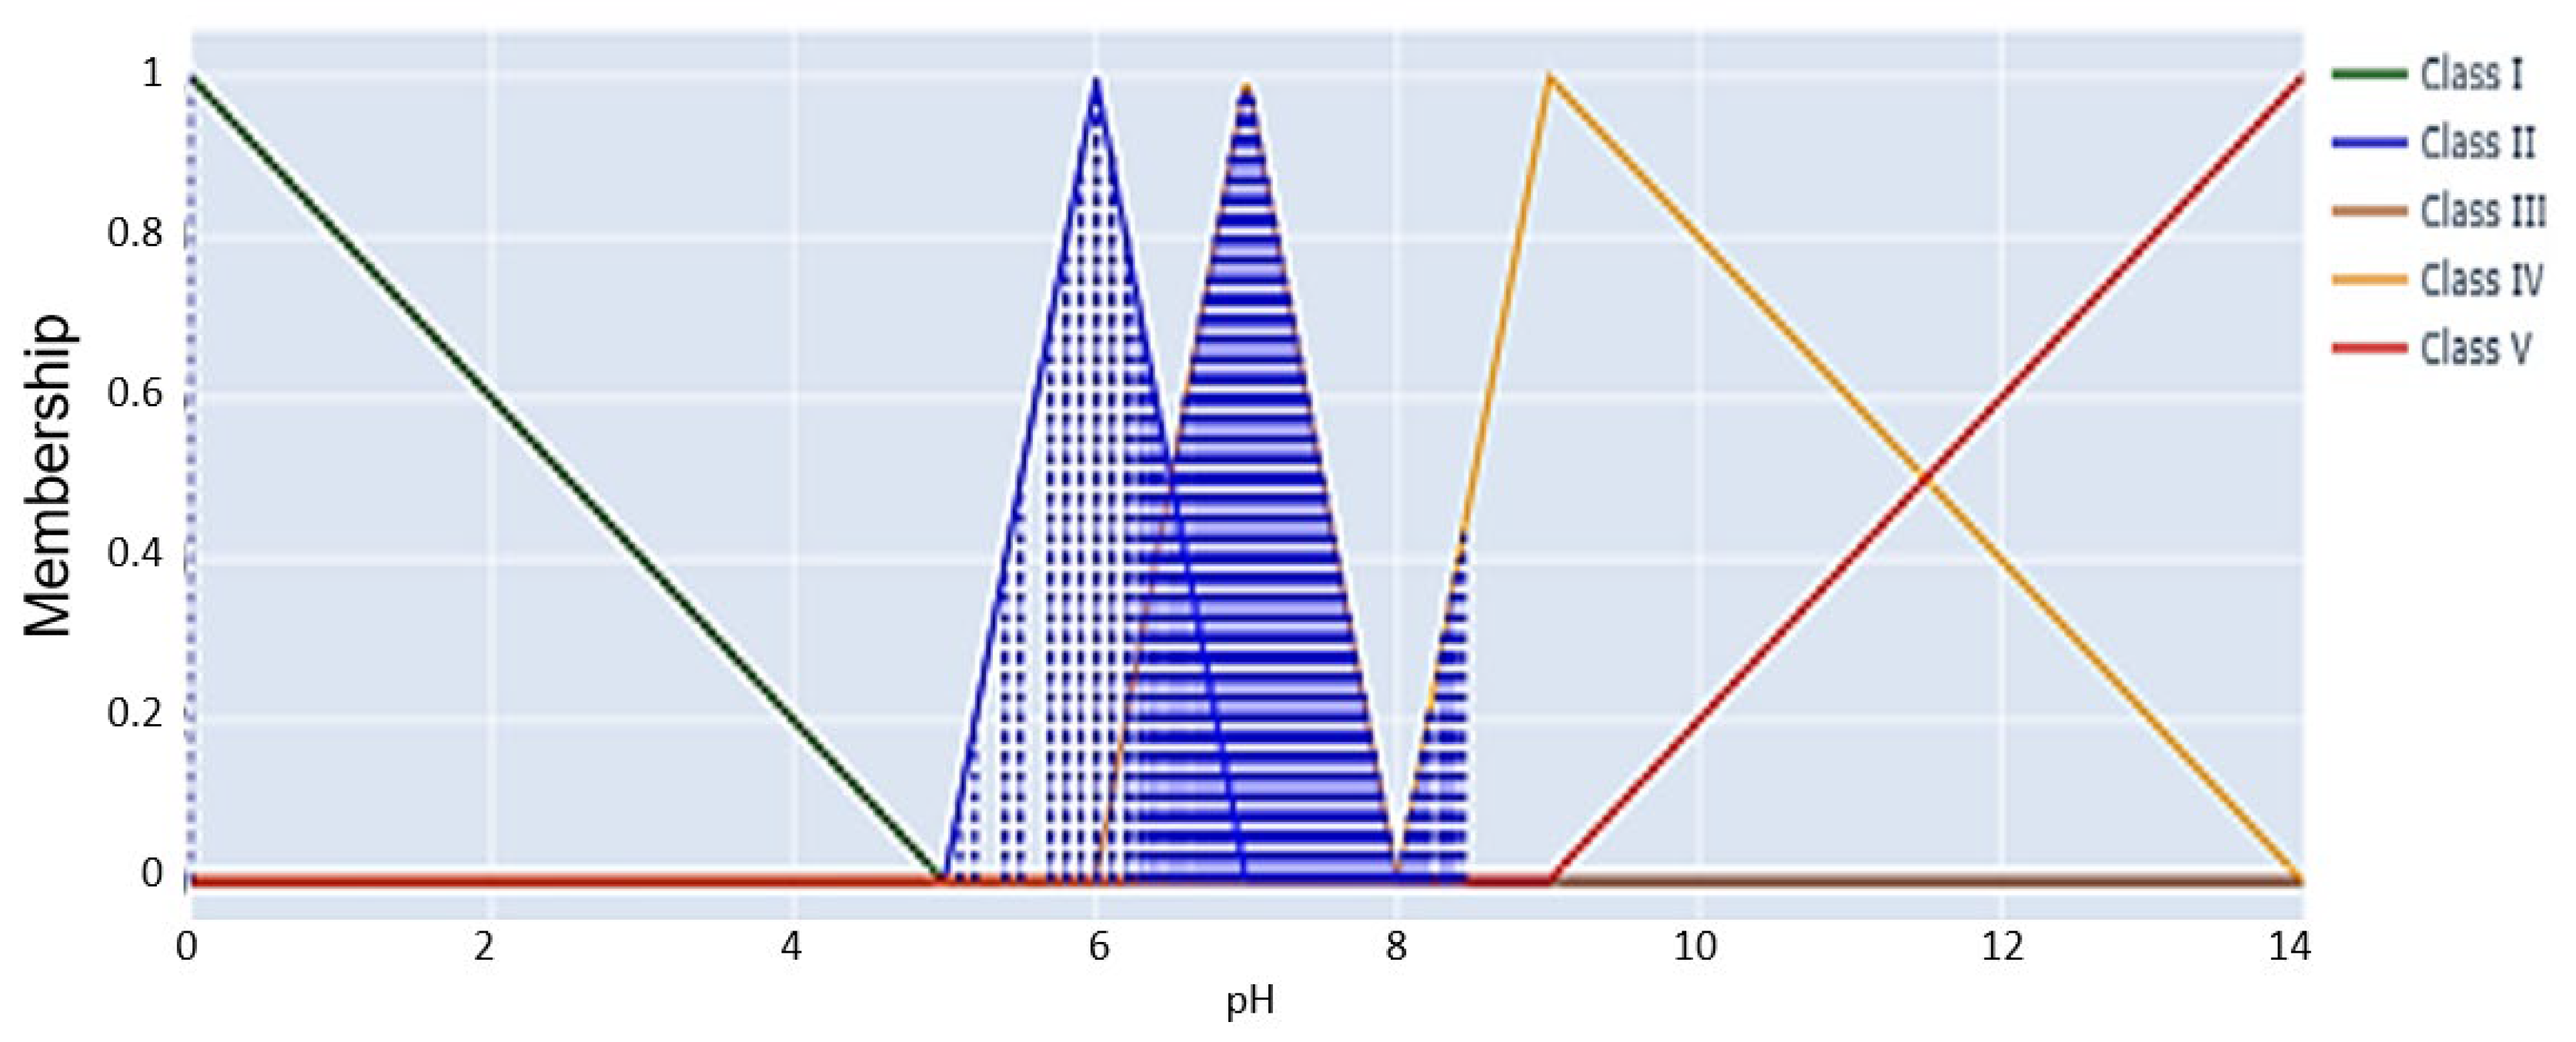
Figure 8 presents a detailed visualization of pH levels, categorized into distinct water quality classes through the application of fuzzy logic. The graph depicts triangle membership functions for five classes (I to V) used in the categorization of pH values ranging from 0 to over 14. The graphic presents actual pH data points overlaid on fuzzy membership graphs, facilitating a dynamic assessment of water quality. The majority of data points cluster in the Class I zone, indicating that pH levels generally remain within a neutral range, optimum for sustaining water quality. The prevalence of Class I circumstances indicates consistent water quality, which is advantageous for wildlife preservation and human needs. Clean water with minimal contaminants supports healthy ecosystems, sustains biodiversity, and promotes natural food chains. The occurrence of pH values in the Class V category is diminished, suggesting that highly alkaline conditions are less prevalent, though they remain present. This underscores the necessity for vigilance to prevent possible ecological repercussions.
Meanwhile,
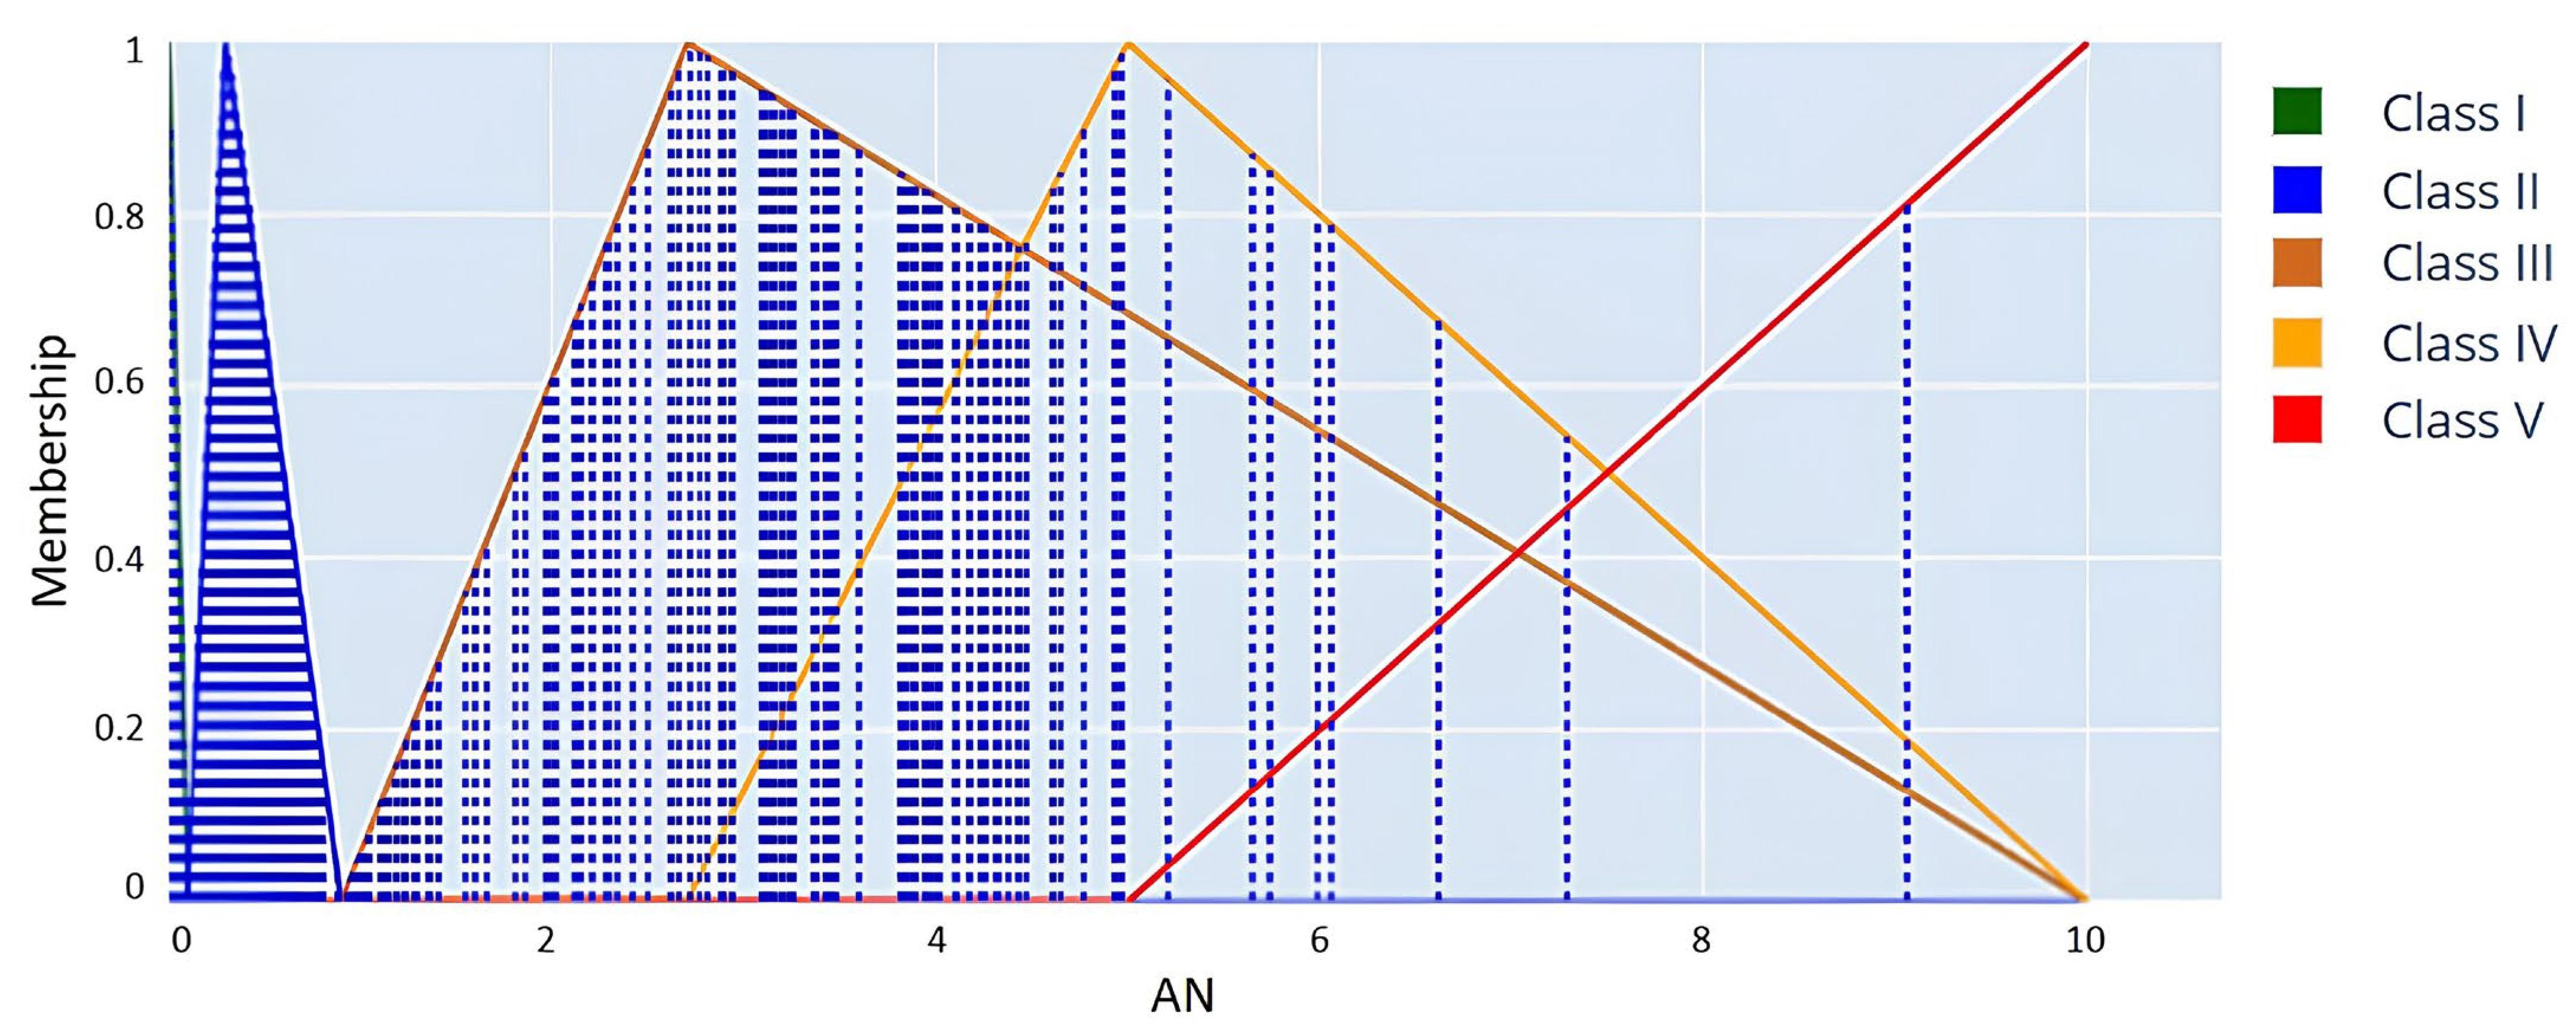
Figure 9 presents an illustration of the fuzzy membership function for ammoniacal nitrogen (AN). The graph illustrates various fuzzy membership functions corresponding to Classes I through V. The functions encompass the range of AN concentrations, specifically from 0 to 10 mg/L. The superimposition of actual data points on the fuzzy membership functions reveals that most AN values are categorized in Class III. This indicates that the water displays low levels of nitrogen contamination. The observed levels exceed the acceptable threshold (Class I) but have not attained the severe pollution classifications (Classes IV and V). The dataset contains limited data points classified as Class I, suggesting that extremely low levels of ammoniacal nitrogen are infrequent overall. Nitrogen compounds may consistently be present in the water.
The regions of overlap between adjacent curves (Class I and Class II or Class III and Class IV) indicate transitional zones where AN values are common to both classes. In these areas, a data point is associated with multiple classes, exhibiting different levels of membership, as dictated by fuzzy logic principles. The increase in AN concentration results in a gradual transition of membership to higher classes, with Class V (red) representing the highest concentration and indicating the poorest water quality. The overlapping regions indicate soft classification, wherein partial memberships address variability and uncertainties in parameter measurements.
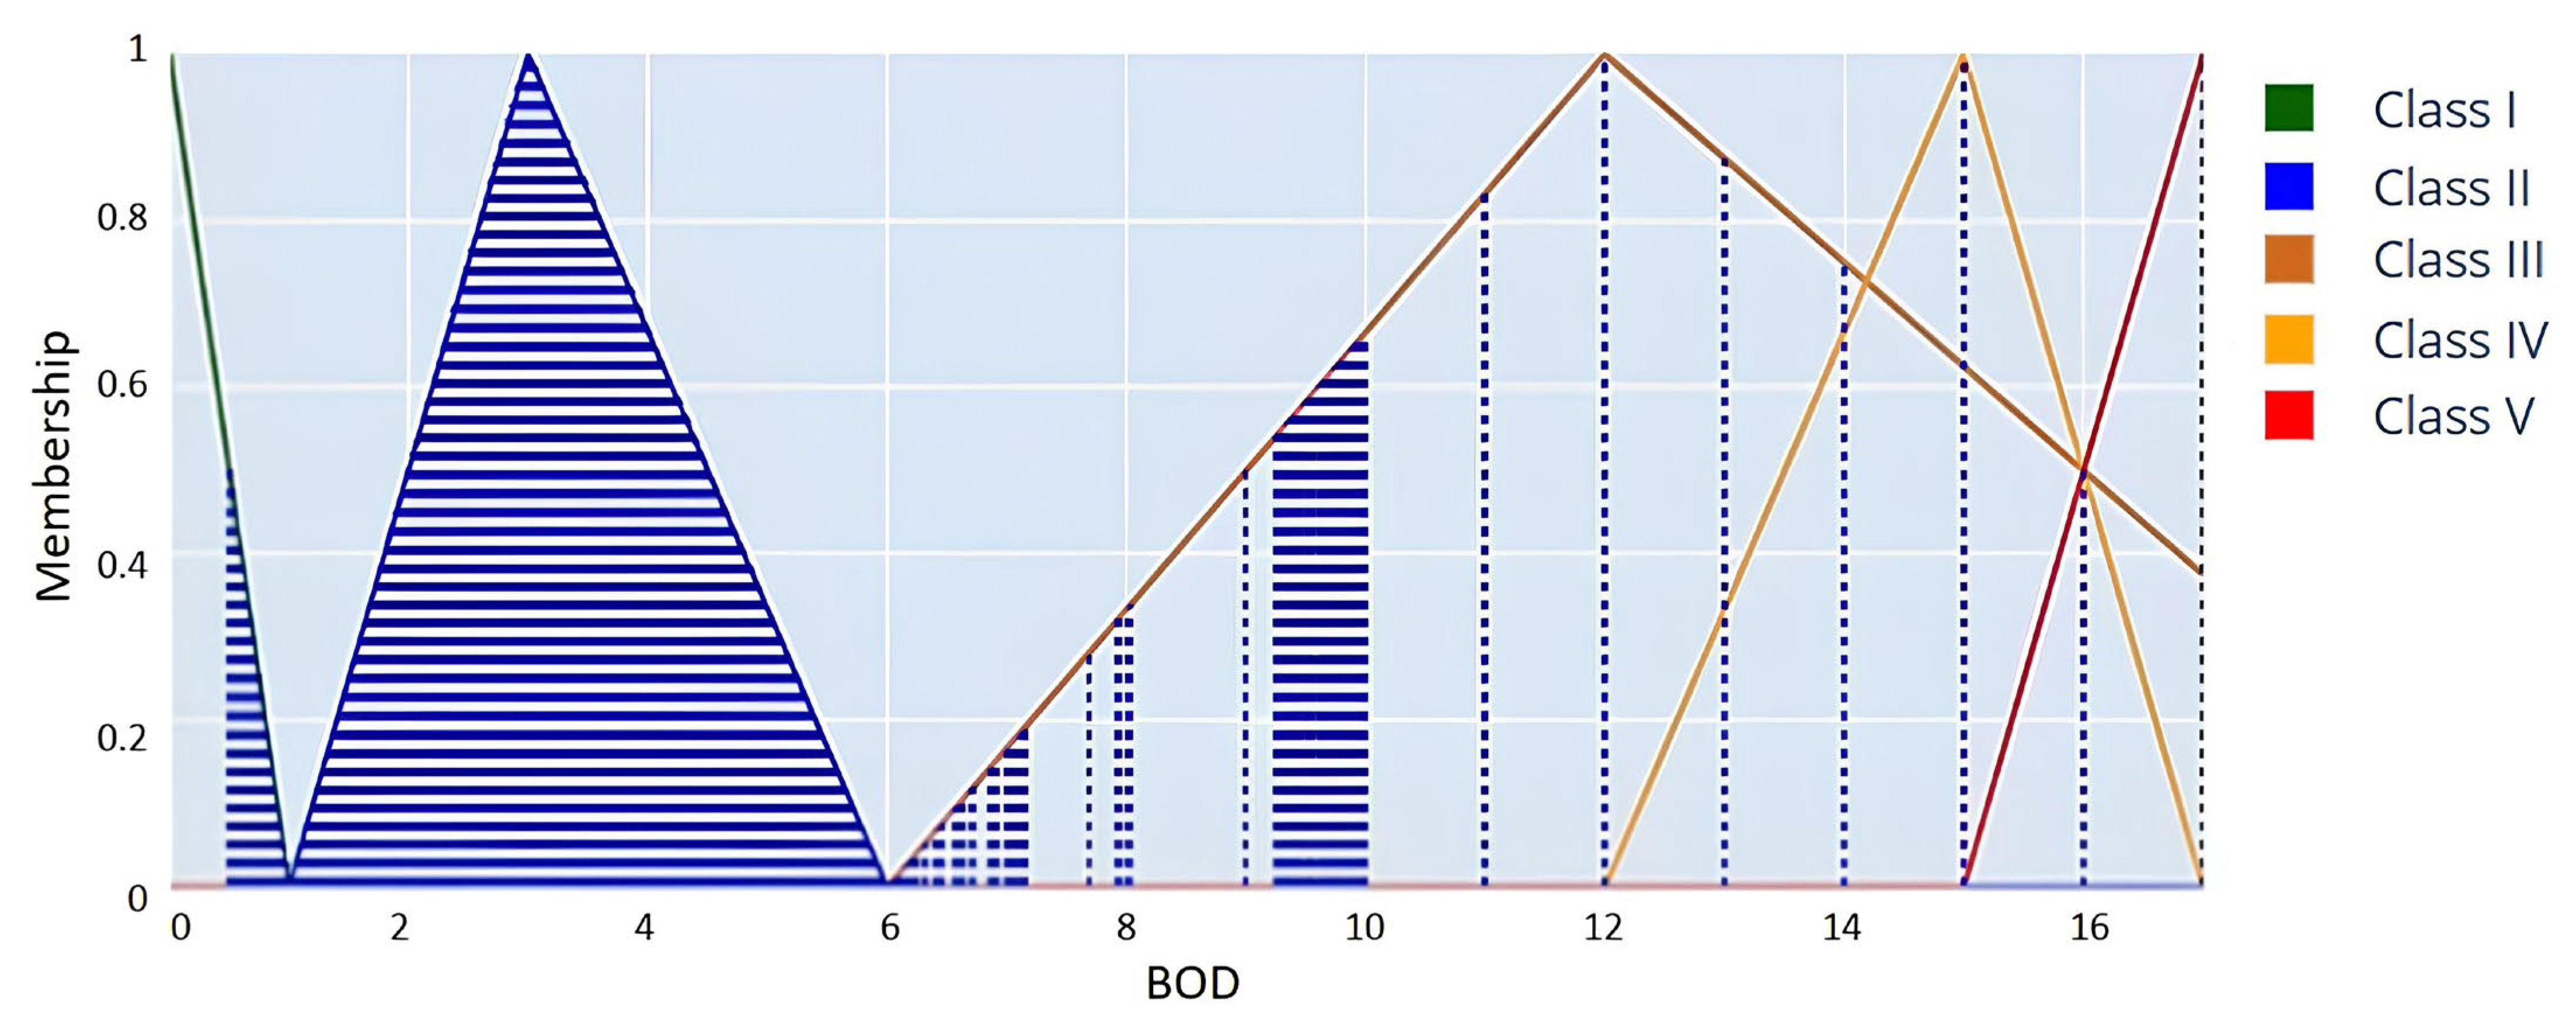
Figure 10 illustrates a clear triangle membership function for biochemical oxygen demand (BOD). The plotted data points indicate that most BOD values generally range from 6 to 8 mg/L, with most observations falling within the Class III category. The BOD level signifies a moderate degree of organic pollution, potentially supporting more resilient species while posing risks to sensitive aquatic organisms. Exceptional water quality conditions, characterized by low BOD, are suggested to be rare in the measured water body, as indicated by the limited number of data points that approach the low BOD levels typical of Class I. BOD serves as a critical metric for assessing water quality, as it quantifies the oxygen demand necessary for aerobic organisms to decompose organic matter in aquatic environments. To prevent future degradation of water quality, monitoring and potentially mitigating sources of organic pollution may be essential, as evidenced by the recurrent occurrence of Class III situations. The regions of overlap between Class II and Class III curves indicate transitional zones in which certain BOD values are partially linked to multiple classifications. The overlaps demonstrate the adaptability of fuzzy logic, facilitating gradual transitions between classes rather than sharp delineations. The increase in BOD concentration results in a progressive shift in membership toward higher classes, with Class V indicating the most polluted conditions at the highest concentration.
Figure 11 illustrates various fuzzy membership functions for COD values, which range from 0 to over 600 mg/L, corresponding to Classes I through V. The plotted data points indicate a concentration of observations primarily within the Class II zone, suggesting that the majority of COD levels are situated in a moderate range. This indicates that while certain pollutants are present in the water, they typically do not fall into the most severe categories. Extremely low or high COD levels are improbable, as indicated by the absence of data points in the lowest and highest categories (Class I and V), suggesting a degree of natural or regulatory control over the sources of chemical pollutants. The overlapping regions between adjacent classes, such as Class II and Class III, demonstrate transitional zones where COD concentrations are partially ascribed to multiple classes. The transitions facilitate flexibility, enabling a nuanced classification of water quality according to COD levels. The rise in COD levels results in a gradual transition in membership to higher classes, with Class V indicating the most polluted conditions at elevated COD concentrations.
Figure 12 presents fuzzy membership functions for Classes I to V, which include DO values from 0 to 100 mg/L. The current data points primarily fall within Class IV, suggesting that dissolved oxygen levels often remain at a threshold that is only marginally adequate for supporting aquatic life. The data suggest that while extreme oxygen depletion (Class V) occurs infrequently, optimal conditions (Class I) are similarly rare. The absence of points in the highest category indicates a need for interventions to enhance oxygen levels, likely due to organic pollution or eutrophication affecting the water body. Overlapping regions between classes, such as Class II and Class III, exhibit transitional zones that permit specific DO concentrations to be partially associated with multiple classes. A soft classification facilitates a gradual transition among water quality levels. As dissolved oxygen concentrations decline, the community composition shifts progressively toward higher classes, with Class V representing the most oxygen-depleted and polluted conditions.
Figure 13 presents various fuzzy membership functions for Classes I to V, encompassing TSS concentrations ranging from 0 to over 500 mg/L. The data points predominantly cluster in the Class I zone, suggesting that most TSS readings are low. This indicates that the water quality is predominantly favorable for suspended particles. The clustering indicates that the water bodies maintain transparent conditions advantageous for aquatic species and human activities. A limited number of data points are classified as Class II, with even fewer attaining higher classifications. This suggests that instances of elevated TSS are rare but do happen, which may indicate the occurrence of sporadic pollution events or specific issues at certain sampling locations. Low TSS levels (Class I) indicate minimal disturbance, which supports stable ecological processes.
Unlike other parameters (e.g., BOD or AN) where adjacent classes overlap and create superposing classes with shared membership zones, the TSS triangular functions are defined with discrete, non-overlapping ranges. This means each TSS value belongs exclusively to a single class without ambiguity. The absence of superposing classes simplifies interpretation for TSS but also highlights that transitions between classes are more abrupt compared to other water quality indicators. As TSS concentrations increase, membership shifts sequentially among the classes, with Class V indicating the highest levels of pollution at the extreme end of the scale. Intermittent elevated readings may correlate with stormwater runoff, industrial discharges, or erosion, all of which can temporarily increase TSS levels and necessitate control to prevent enduring consequences.
Figure 14 and
Figure 15 illustrate the WQI across various time periods through a scatter plot and a heatmap, respectively. Substantial variations in the WQI are evident throughout the entire examined period. The results indicate a persistent trend of inadequate water quality, with most measurements classified as Class IV and Class V. Class III indicates an intermediate quality level and is characterized by infrequency and irregularity, suggesting that improvements are often temporary. A potential correlation exists between the intermittent presence of Class III and seasonal variations or temporary measures that enhance water quality for limited durations. The ongoing presence of Class IV and Class V signifies a sustained issue with water conditions that remain below acceptable standards. Consequently, further investigation is required to ascertain the fundamental determinants, especially in areas experiencing a transition from higher to lower classes, such as the shift from Class III to Class IV or Class V. The heatmap facilitates the identification of prolonged intervals of elevated or diminished WQI by effectively illustrating consistent water quality periods through uninterrupted bands of color.
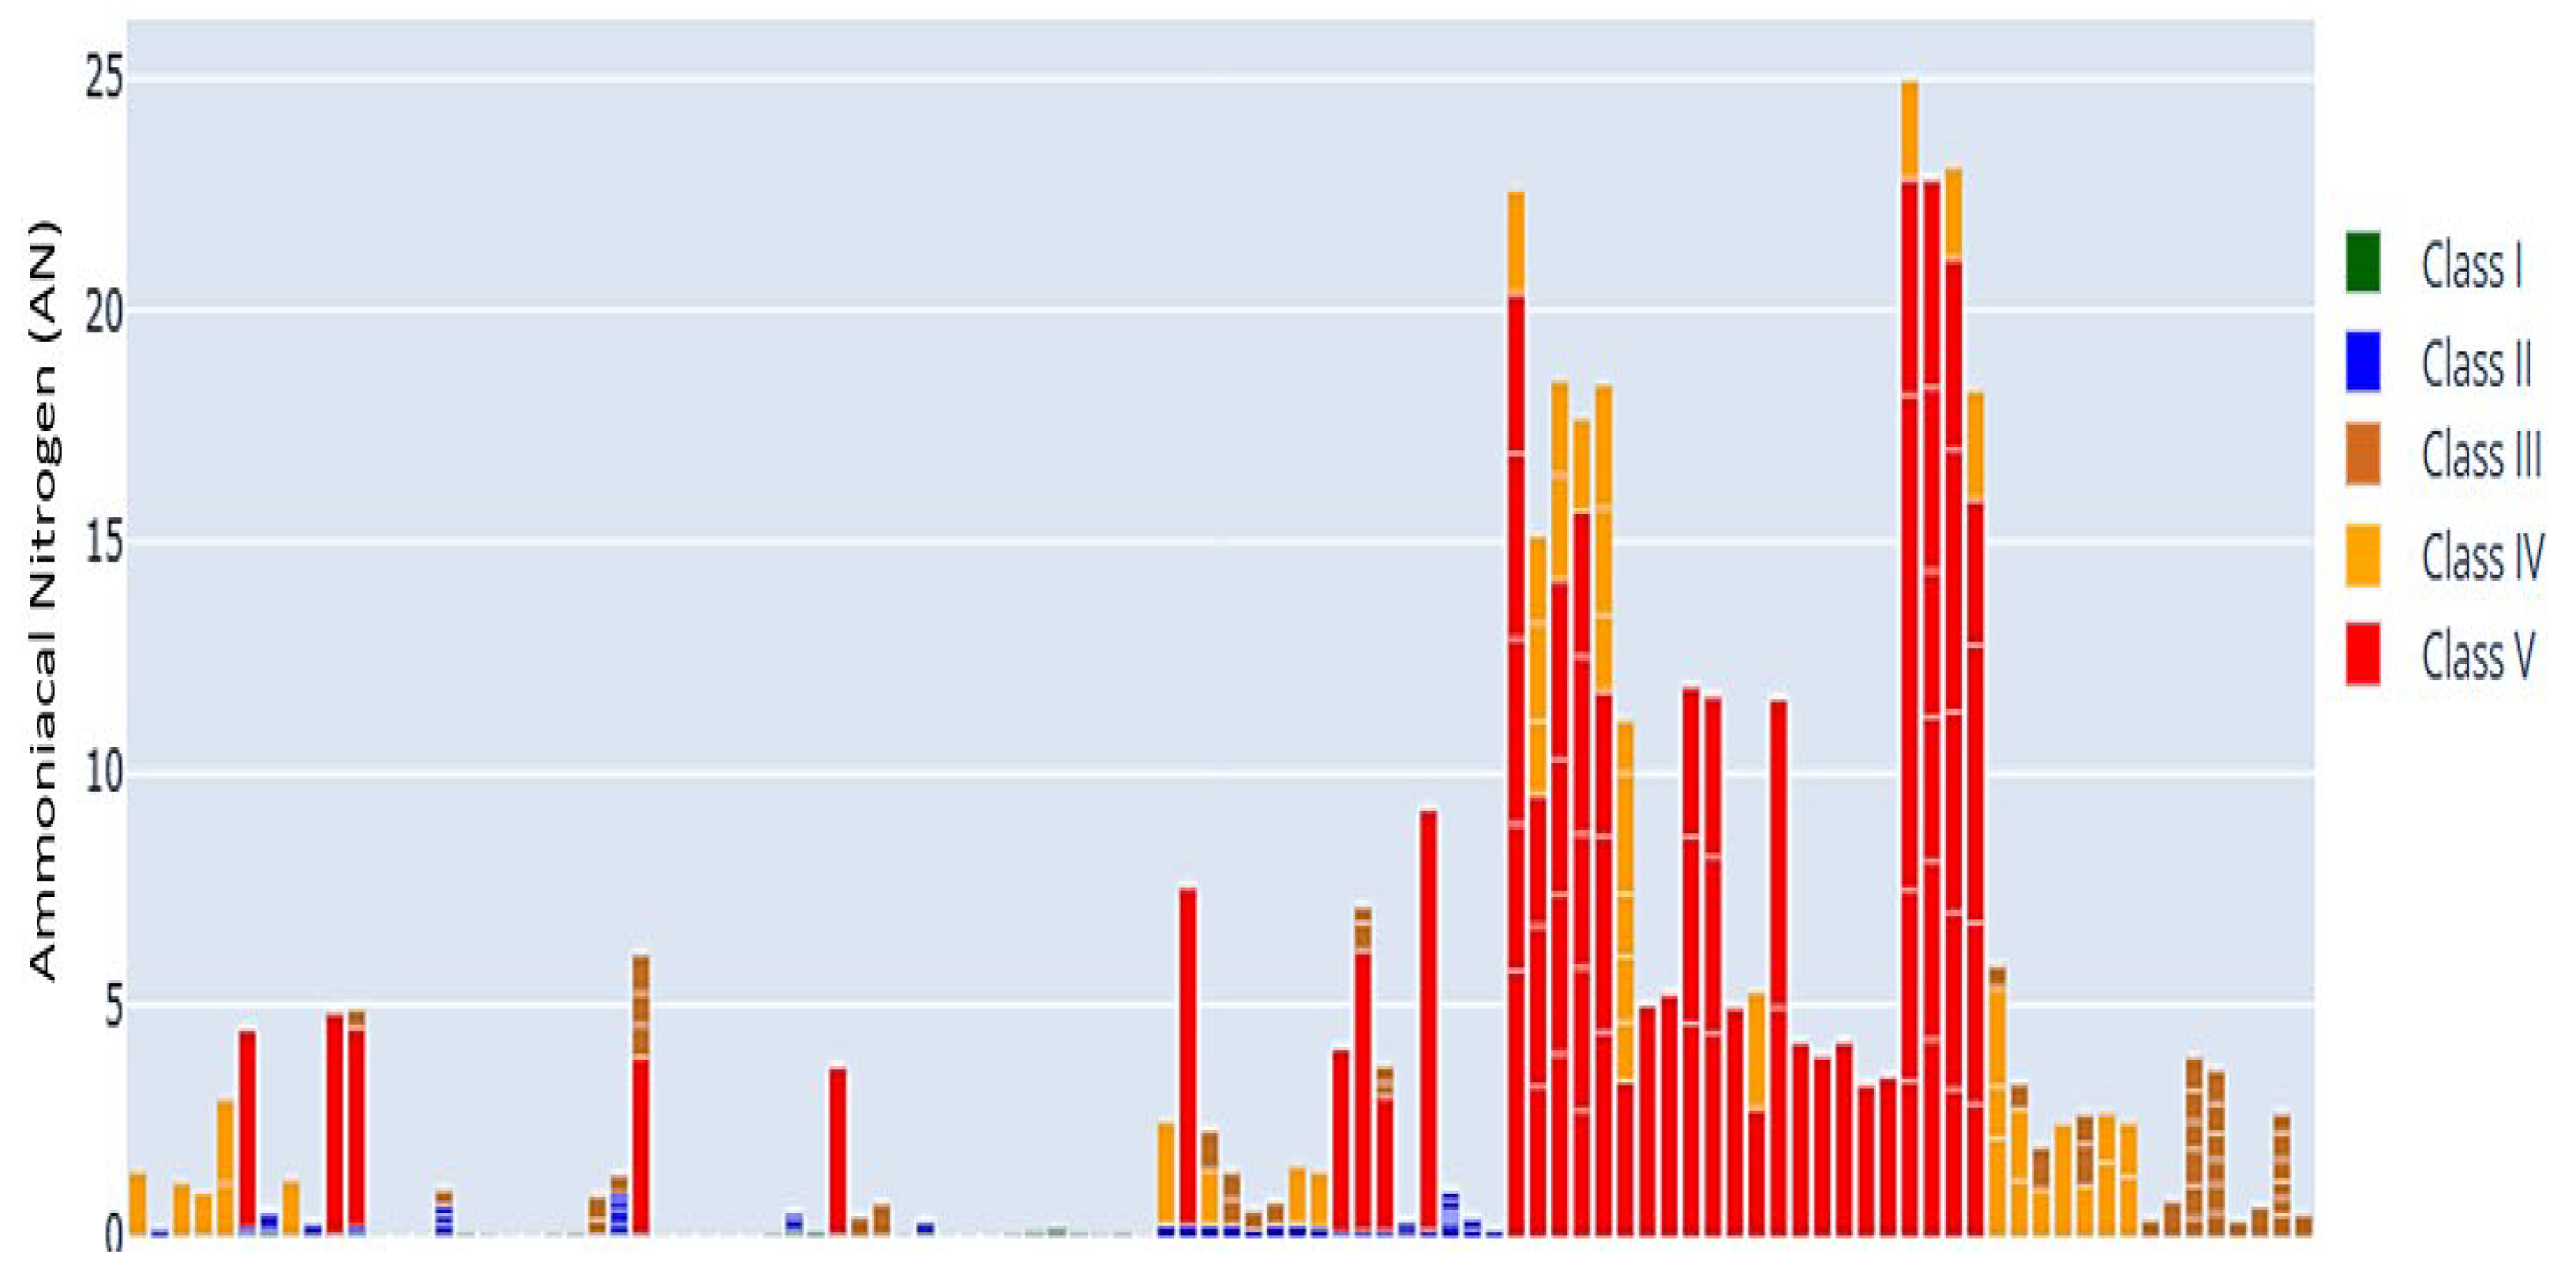
Figure 16,
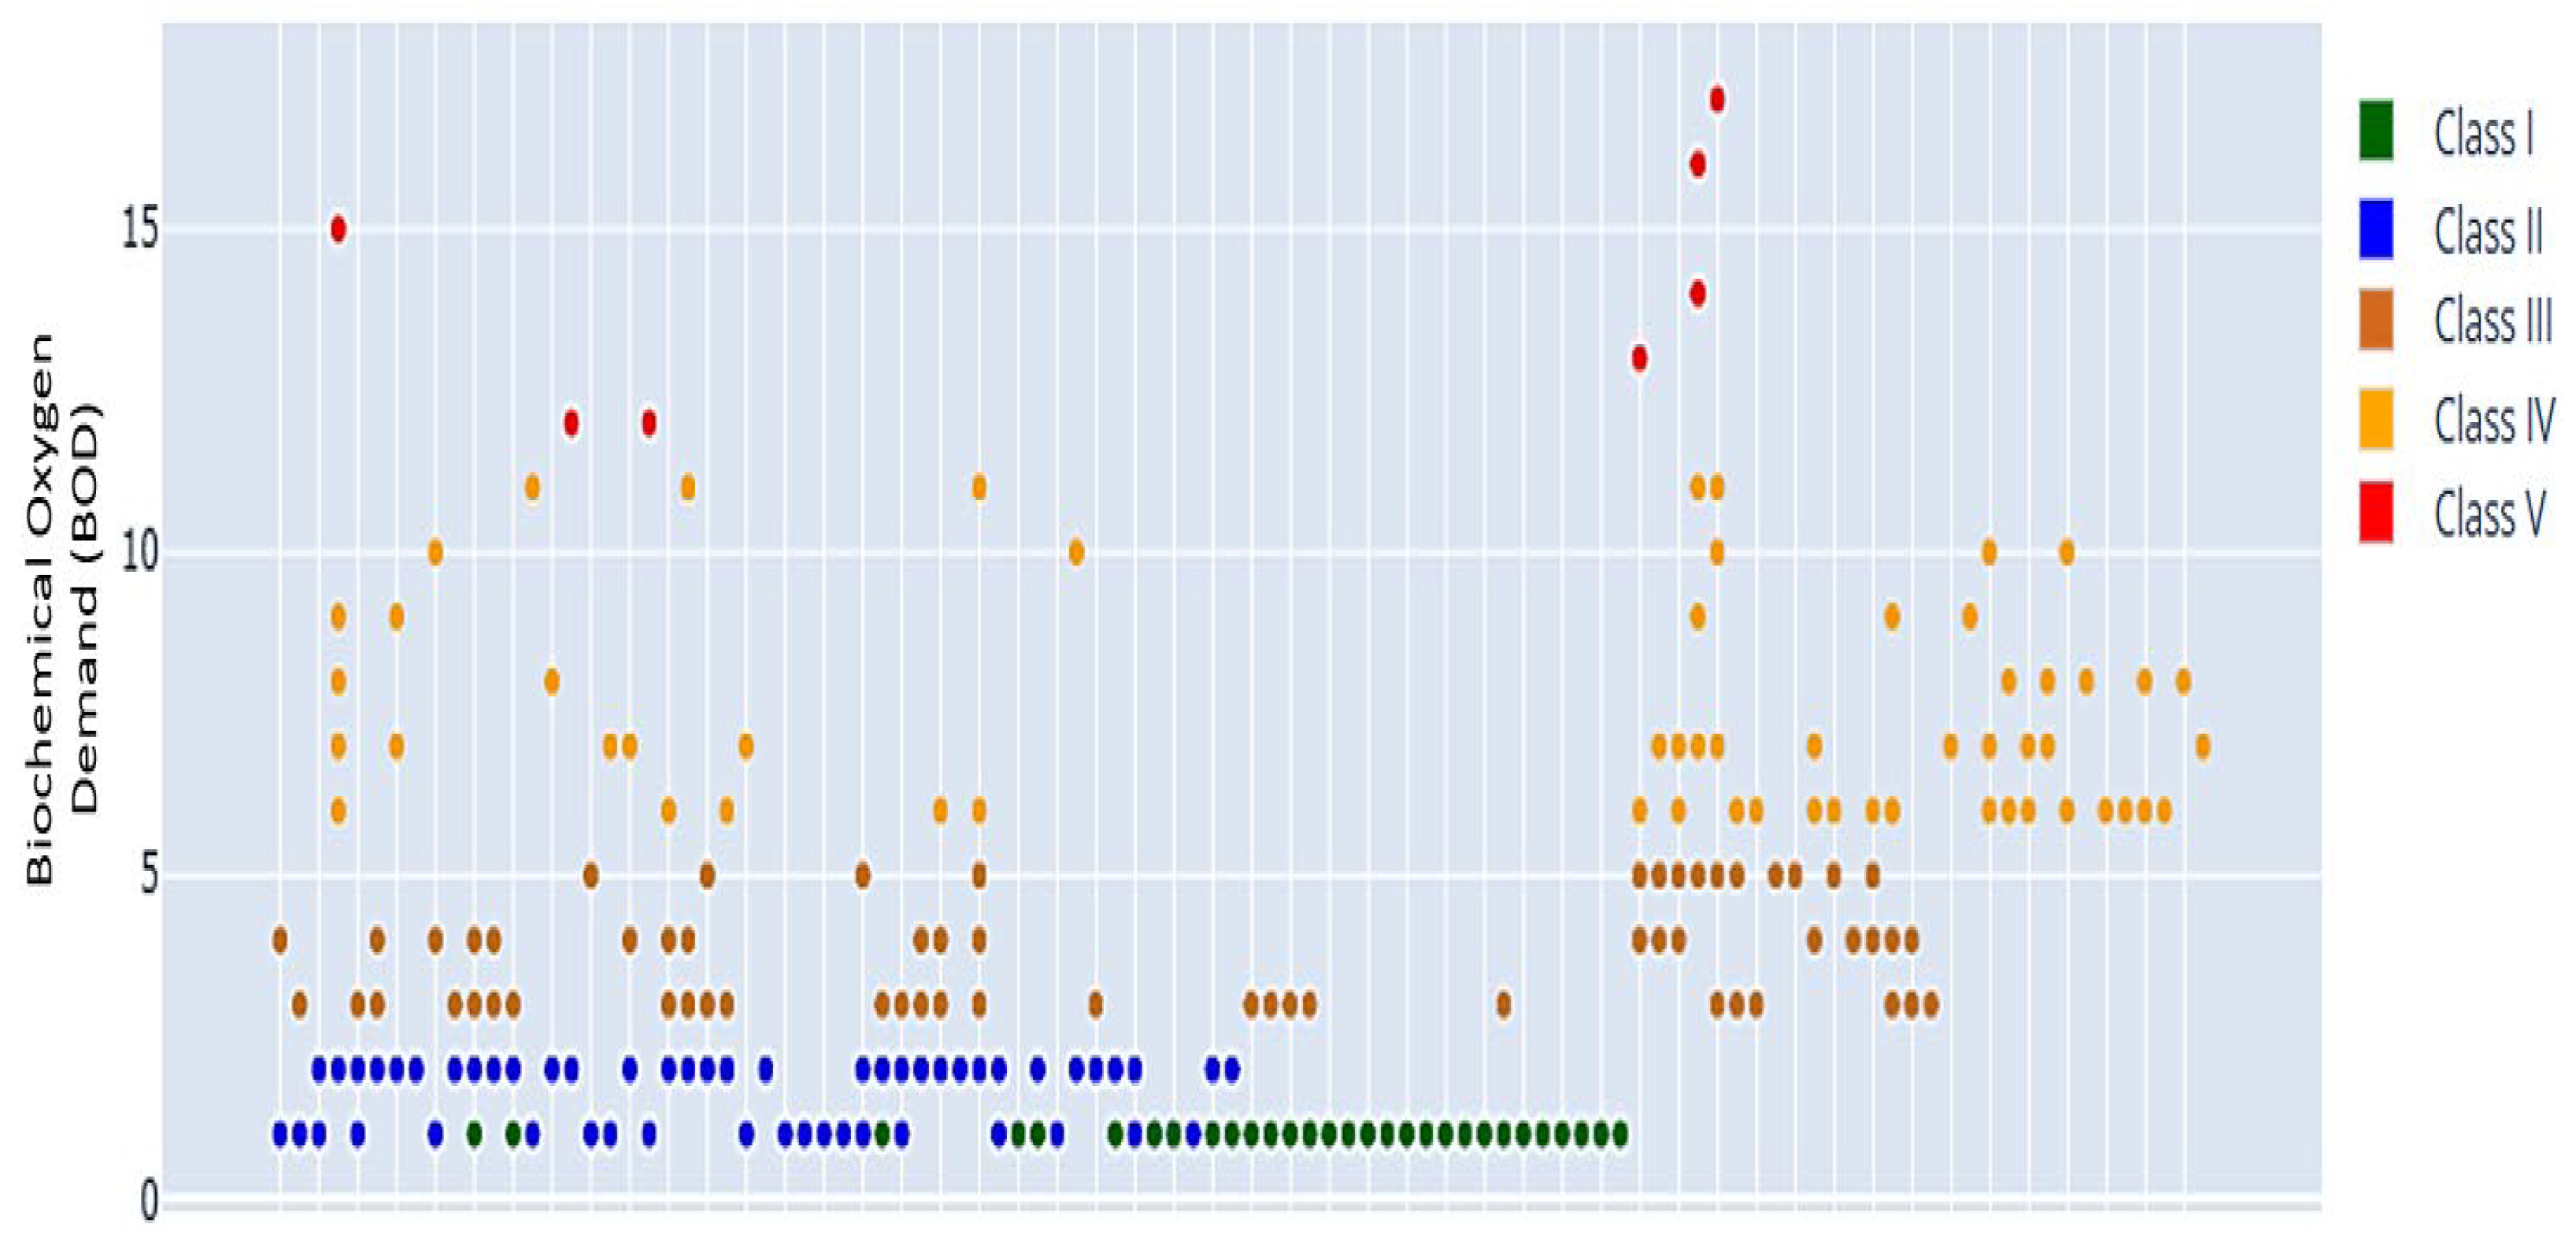
Figure 17,
Figure 18,
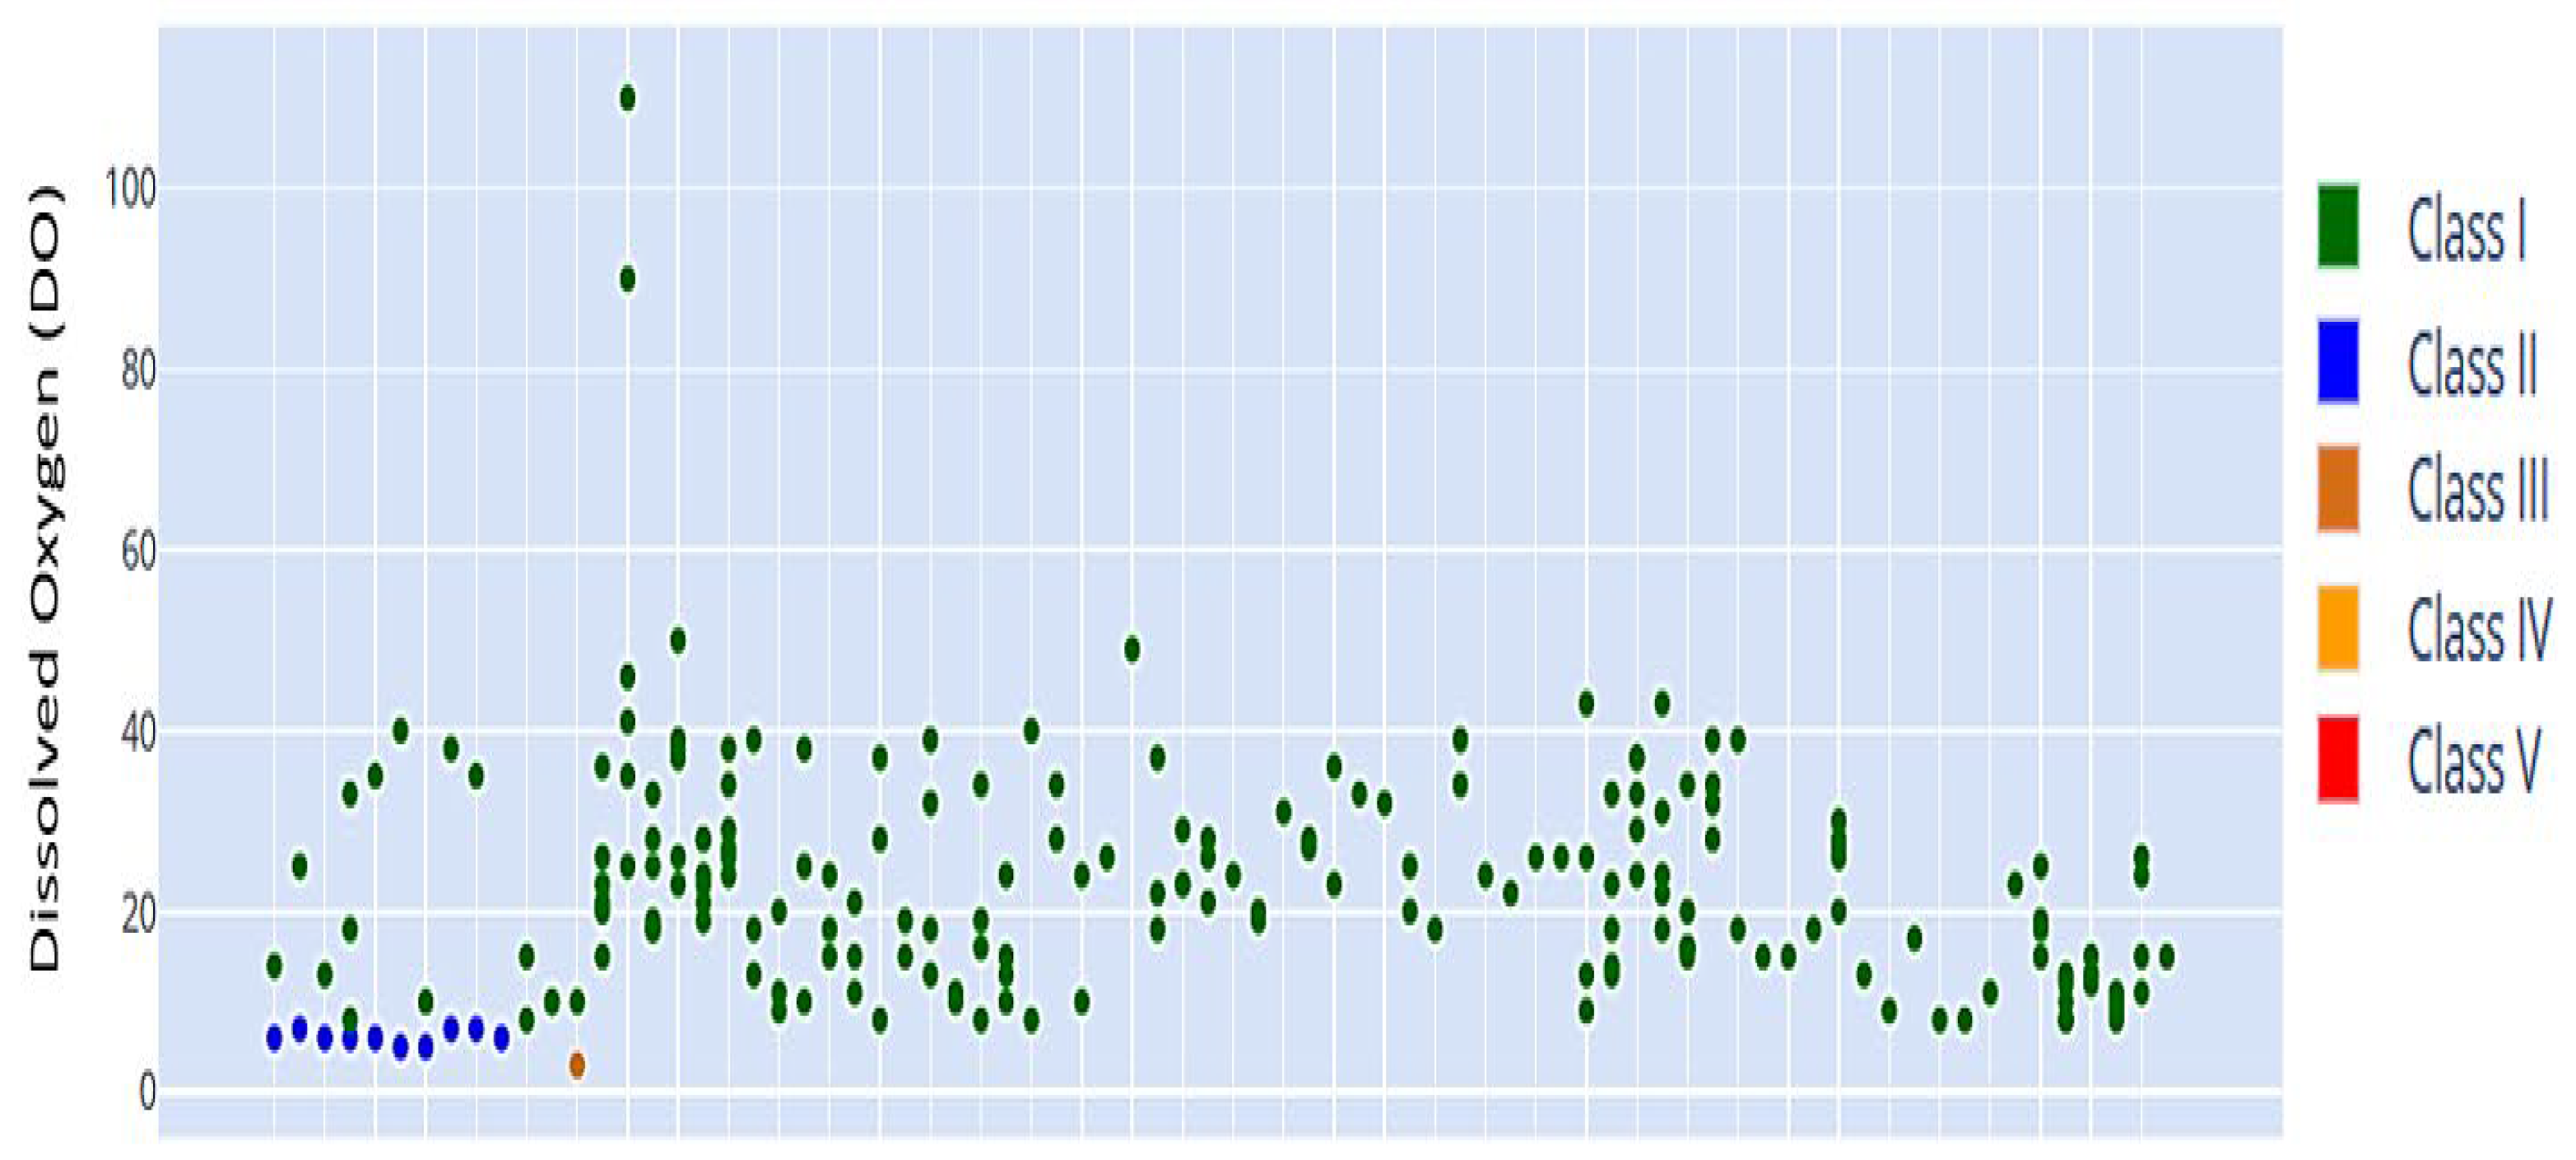
Figure 19,
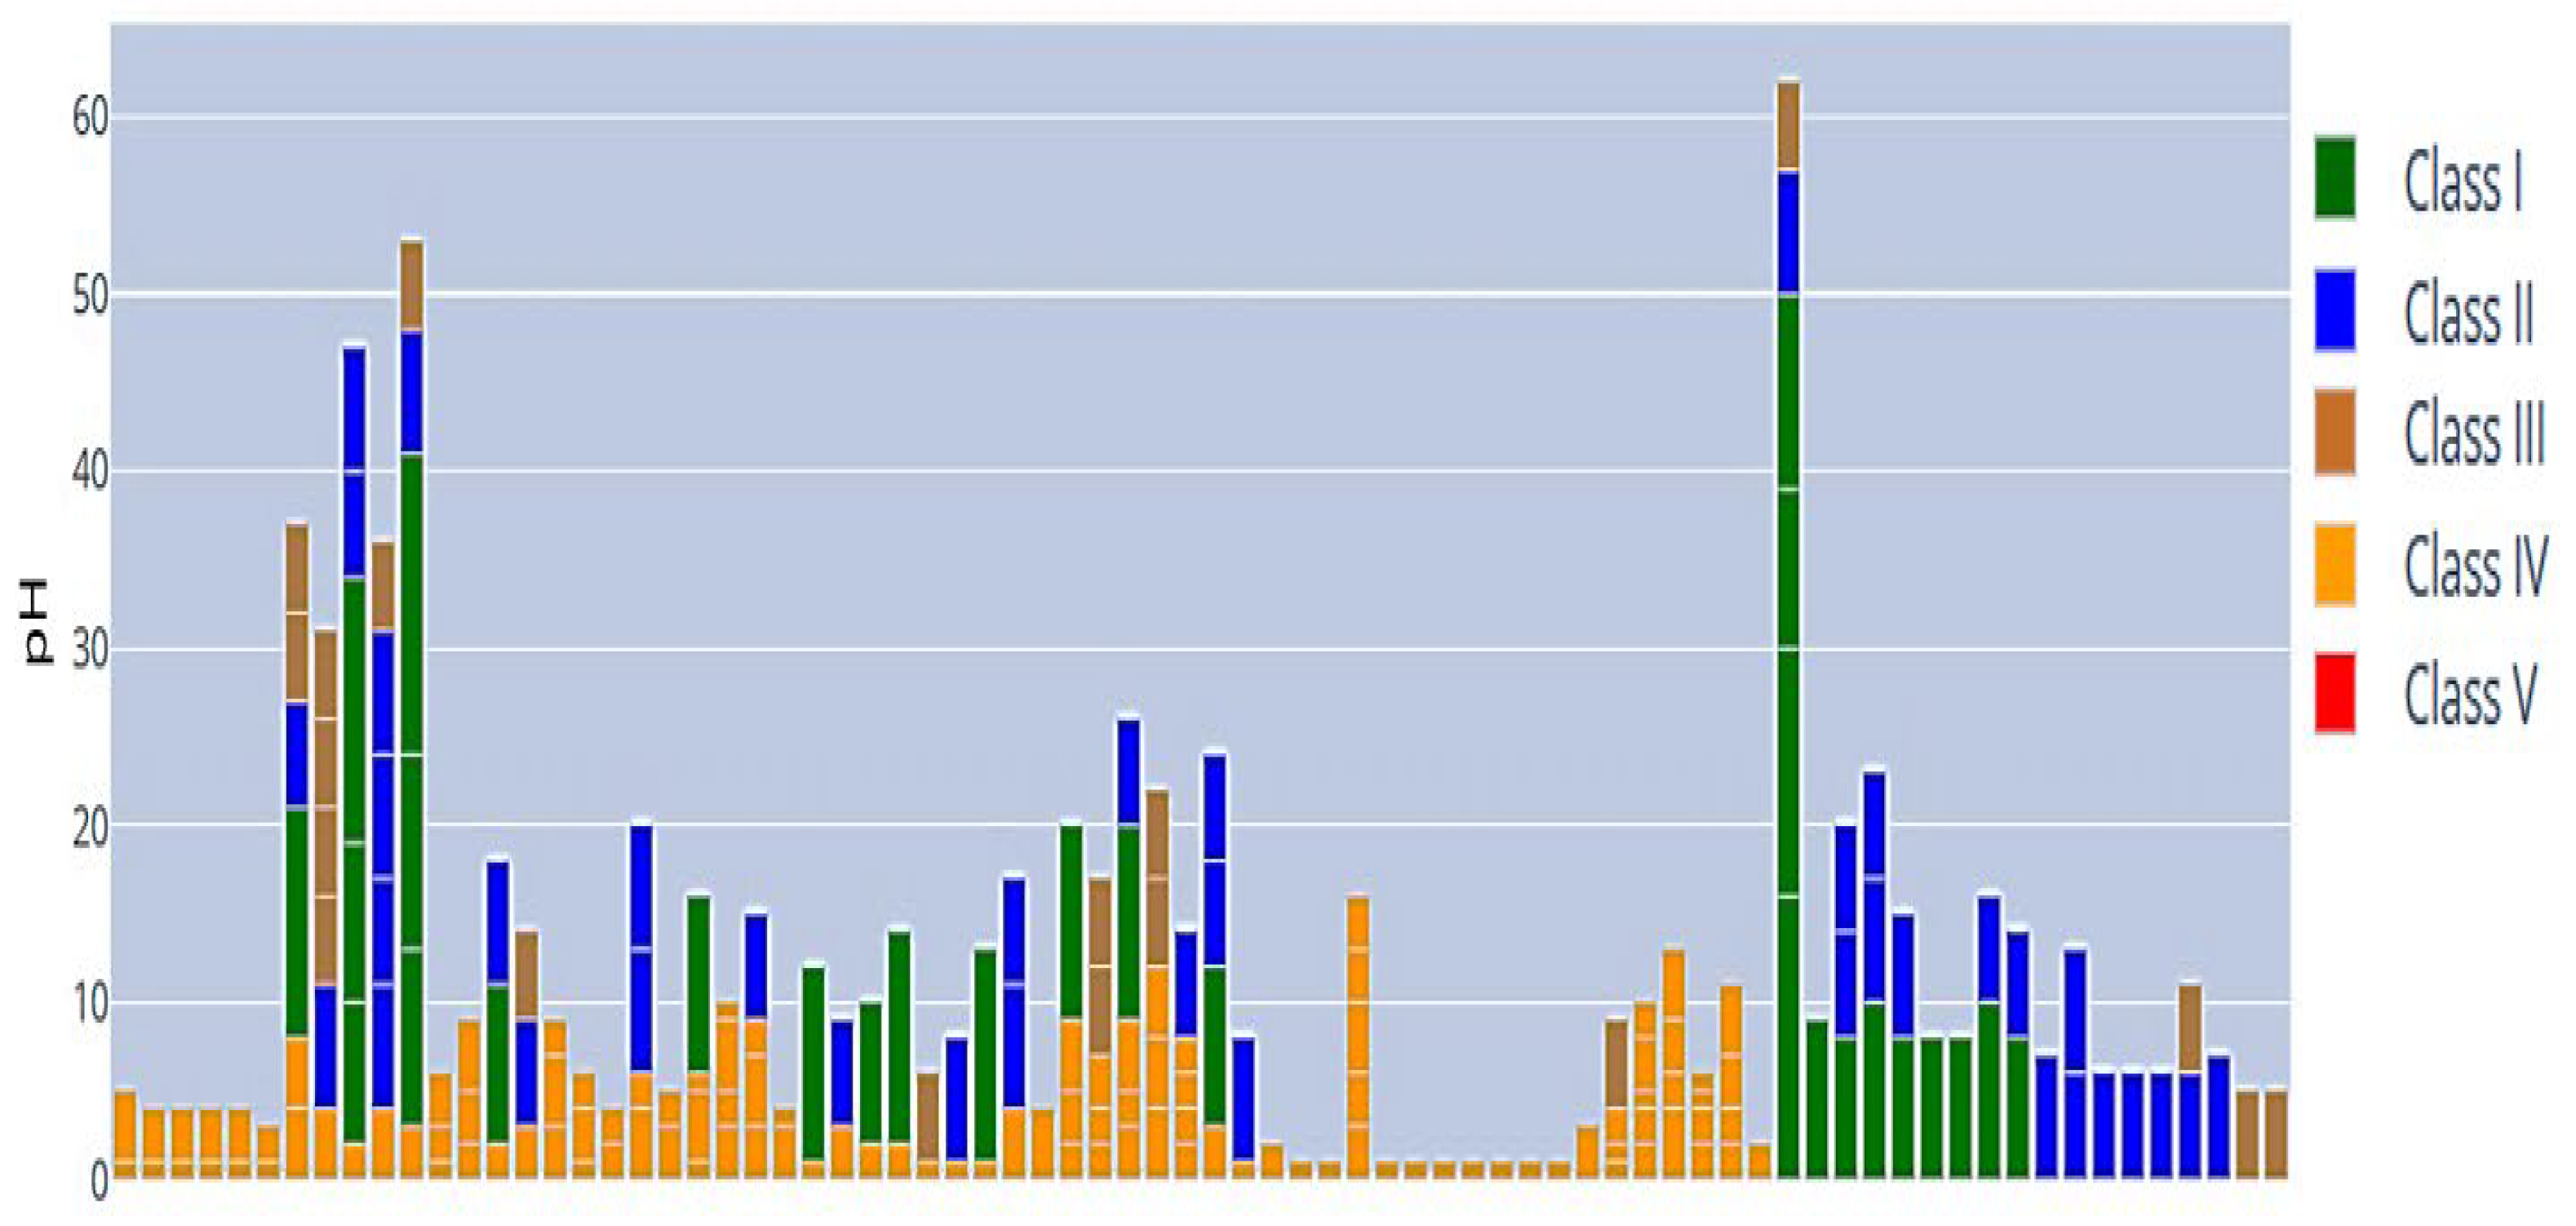
Figure 20 and
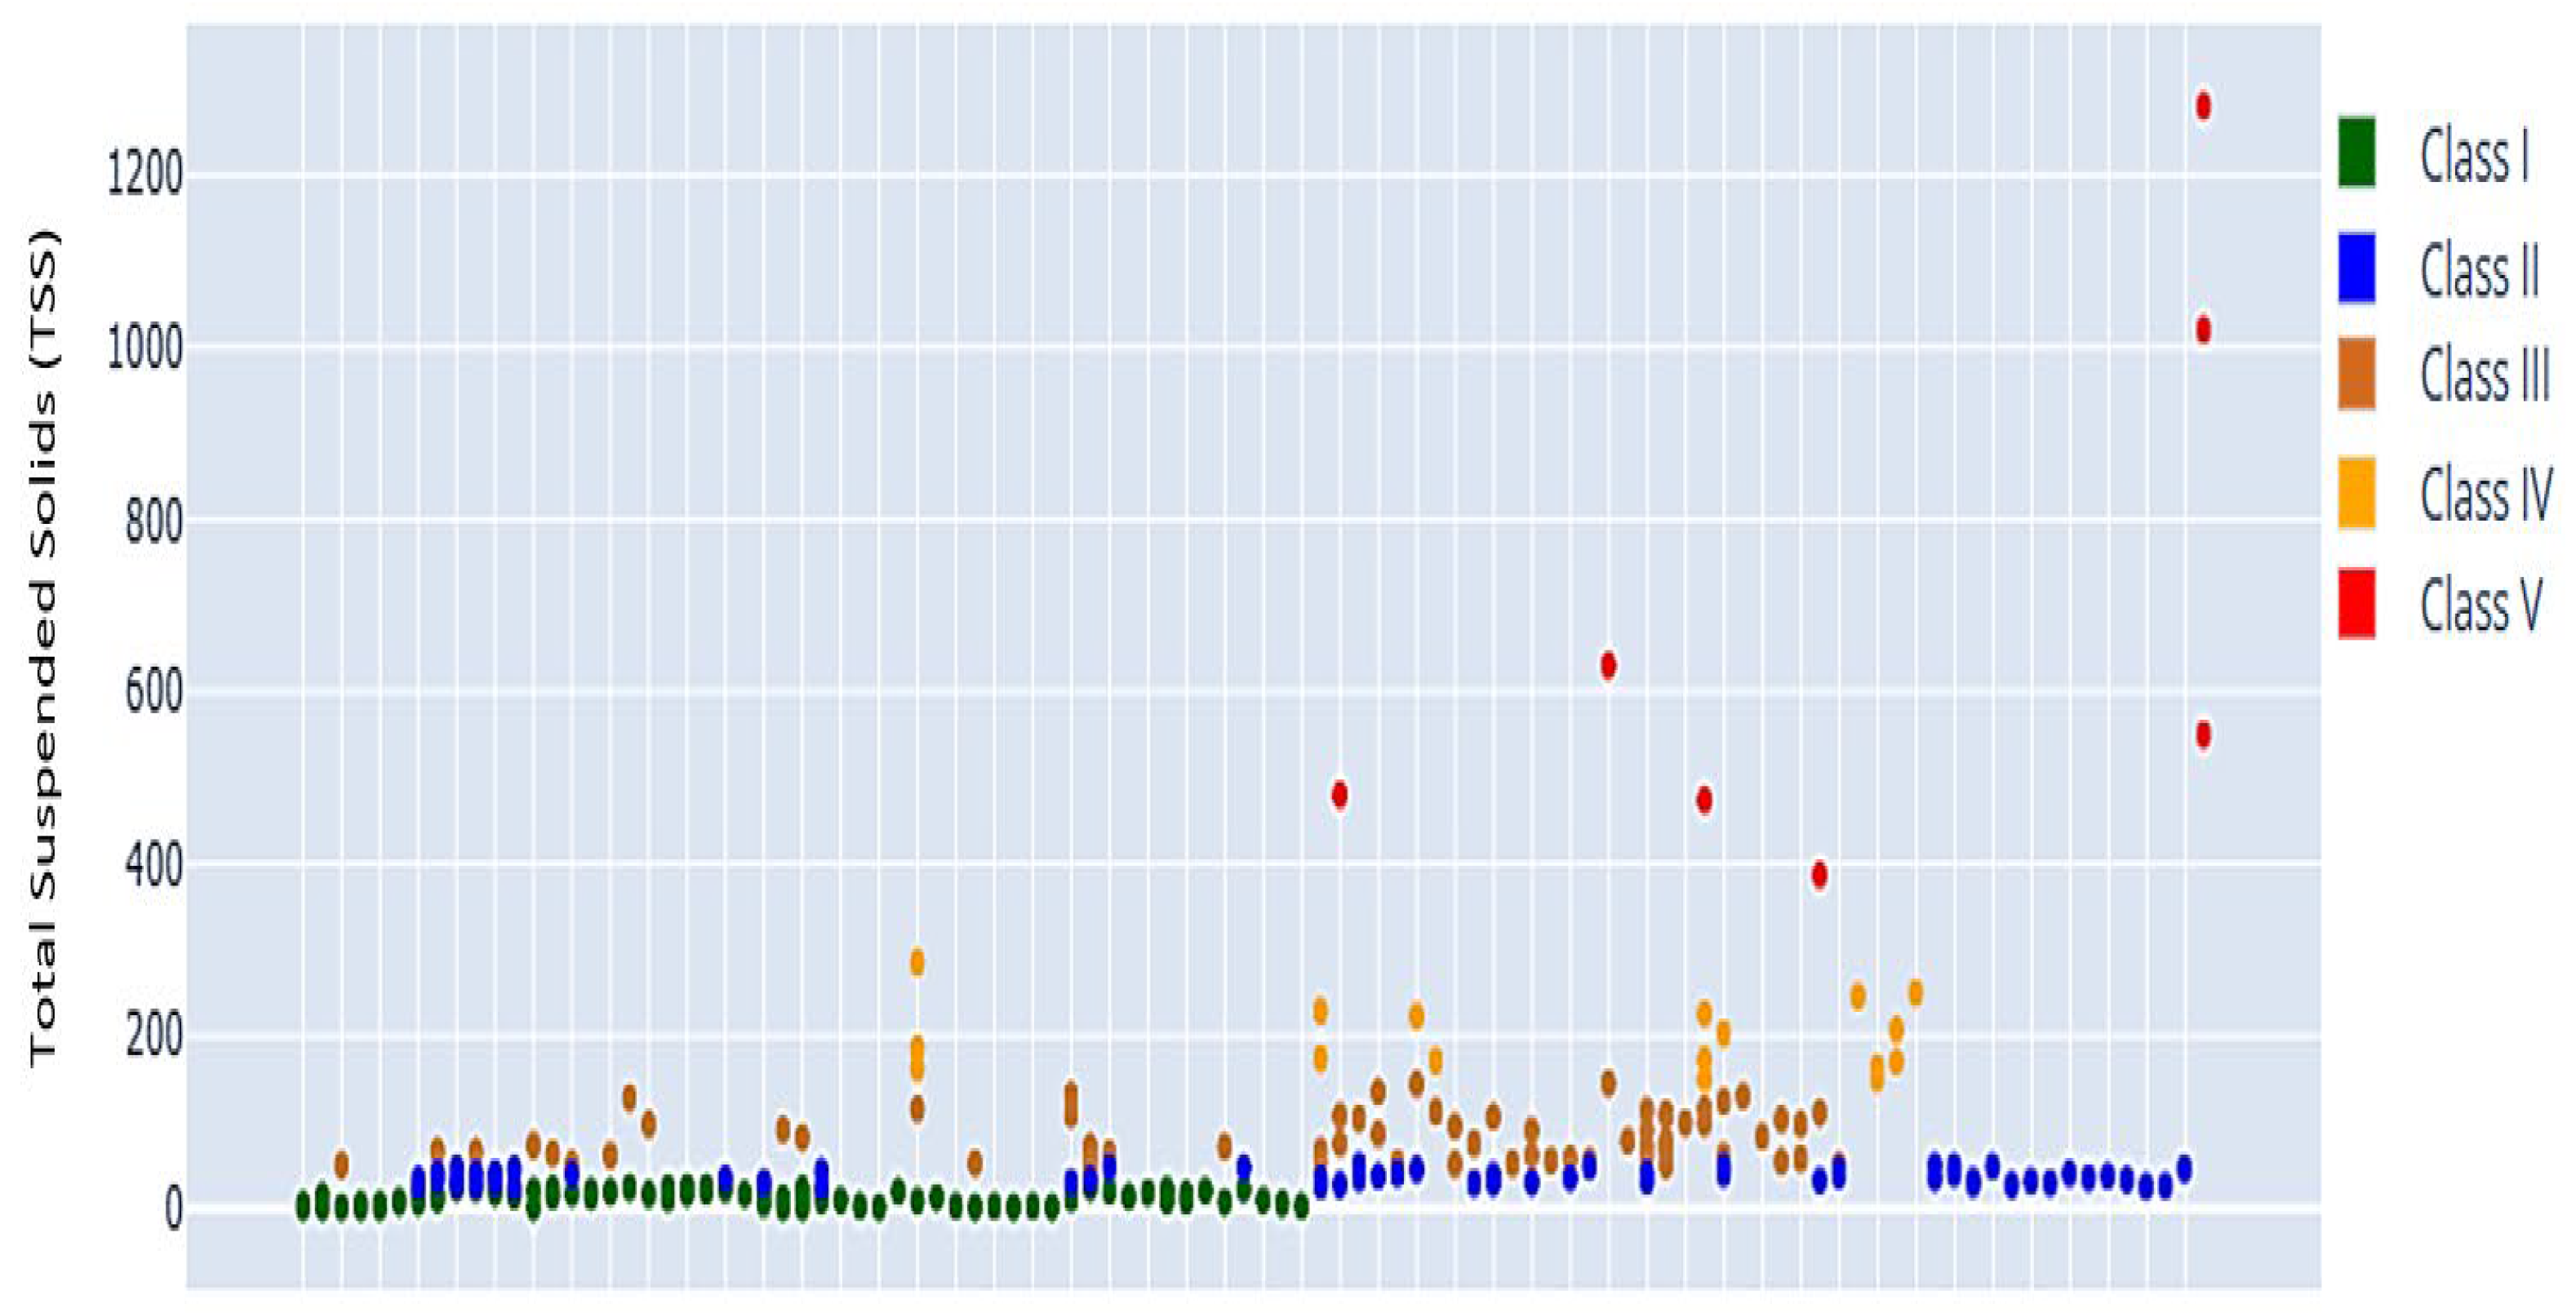
Figure 21 present a series of graphs that provide a comprehensive overview of temporal variations in six key water quality metrics: AN, BOD, COD, DO, pH, and TSS. Each graph employs a different visualization technique to highlight both parameter-specific patterns and their implications for water quality status. The bar graph of AN displays several prominent peaks, signifying periods of elevated ammoniacal nitrogen concentrations. These peaks represent pollution events where nitrogen exceeds acceptable ranges, with most values classified as Class V. This persistent problem indicates ongoing anthropogenic inputs, likely from untreated wastewater or agricultural runoff, underscoring nitrogen as a primary driver of water degradation. The BOD scatter plot, in contrast, demonstrates relatively stable levels, concentrated primarily within Class IV. While this stability suggests a consistent load of biodegradable organic material, the Class IV classification highlights a chronic stressor that may reduce oxygen availability for sensitive aquatic species.
The COD scatter plot reveals wider variability, with recurrent spikes in higher classes, reflecting intermittent surges of oxidizable pollutants. Such fluctuations point to episodic industrial discharges or stormwater runoff events, making COD a key indicator of acute stress. In comparison, most DO readings fall within Class I, confirming that the water body generally maintains oxygen conditions favorable for aquatic life. However, occasional declines into lower classes, though infrequent, signal that the system remains vulnerable to oxygen depletion during pollution pulses. The pH bar chart shows significant variation across Classes I to V, suggesting unstable acid–base balance influenced by multiple factors, including precipitation, effluent discharge, or seasonal changes. Finally, the TSS scatter plot indicates consistently low suspended solids (Class I), highlighting favorable conditions for water clarity and habitat quality.
Together, these visualizations reveal a mixed picture: certain parameters (DO and TSS) remain consistently favorable, while others (AN, COD, and pH) show recurring deviations that threaten ecological stability. This indicates that the system is not uniformly degraded but is instead shaped by parameter-specific stressors. In particular, the prevalence of Class V values for AN and the recurrent spikes in COD suggest that nutrient enrichment and chemical inputs are the dominant challenges, while stable BOD levels reflect chronic organic loading. From a management perspective, this analysis suggests that interventions should prioritize controlling nitrogen and COD sources while maintaining the conditions that currently support DO and TSS stability. These findings not only depict current water quality conditions but also highlight persistent problem areas, thereby setting the stage for targeted policy interventions and deeper investigation into pollution sources.

