Article

Importance Assessment of Distribution Network Nodes Based on an Improved MBCC-HITS Algorithm

1
Sichuan Shuneng Dianke Energy Technology Company Limited, Chengdu 610041, China
2
State Grid Corporation of Sichuan Province Research Institute of Electric Power Science, Chengdu 610041, China
3
School of Electrical Engineering, Xipu Campus of Southwest Jiaotong University, Chengdu 611756, China
*
Author to whom correspondence should be addressed.
Algorithms 2025, 18(9), 589; https://doi.org/10.3390/a18090589
Submission received: 12 August 2025 / Revised: 10 September 2025 / Accepted: 12 September 2025 / Published: 17 September 2025
(This article belongs to the Section Evolutionary Algorithms and Machine Learning)

Abstract

By accurately identifying important nodes in the distribution network and implementing priority protection measures or optimizing the network layout, a system’s anti-interference capability can be effectively enhanced while reducing the probability of failures. Inspired by the MBCC-HITS algorithm, this paper proposes an improved MBCC-HITS algorithm based on node degree centrality (DCHITS) for evaluating important nodes in distribution networks. Building upon the MBCC-HITS algorithm, the DCHITS algorithm incorporates node degree centrality to enhance the evaluation framework, supplementing the influence of topological structure factors on node importance assessment, thereby more accurately reflecting the actual conditions of the distribution network. In the IEEE 33 system, the DCHITS algorithm was compared with the node degree and node betweenness algorithms, as well as the MBCC-HITS algorithm, using two indicators: the scale of load loss and the maximum subgroup size. The results demonstrate that the DCHITS algorithm outperforms the others in both indicators. Specifically, compared to the MBCC-HITS algorithm, the scale of load loss increased by 0.55%, and the maximum subgroup size decreased by 8.21%. compared to the node degree and node betweenness algorithm, the scale of load loss increased by 6.63%, and the maximum subgroup size decreased by 5.38%. These findings indicate that the DCHITS algorithm is more rational and effective in identifying the important nodes in distribution networks.

1. Introduction

In recent years, extreme weather events such as typhoons, prolonged rain, snow, and freezing temperatures have become increasingly frequent [1,2,3]. Distribution network equipment and infrastructure are frequently exposed to natural disasters and extreme weather conditions may cause widespread damage to distribution network facilities, posing a significant threat and challenge to the safe and normal operation of the distribution network, leading to major power outages [4,5,6]. Research shows that the failure of a small number of important nodes in the power grid can cause a sharp decline in grid connectivity and stability [7], leading to functional failures across the entire grid. Therefore, it is necessary to accurately identify important nodes in the distribution grid and strengthen protection of these nodes in advance to ensure the normal and stable operation of the distribution grid [8].
To accurately identify important nodes in distribution networks, various assessment methods have been proposed from different perspectives in existing research. The study [9] employed node degree and node betweenness as fundamental topological indicators and determined their weights using the analytic hierarchy process; however, its analysis was largely confined to the topological structure of the network. Building on this, ref. [10] introduced a voltage sensitivity risk index to broaden the evaluation dimensions for node importance, though operational factors were still not fully incorporated. Further advancing the approach, ref. [11] integrated node degree, node betweenness, and multiple voltage vulnerability indicators from both structural and operational safety perspectives, thereby enhancing the systematicness of the assessment. Nevertheless, these methods primarily rely on complex network theory, abstracting the grid as an undirected graph, and fail to adequately account for dynamic operational elements, such as power flow, load, and generation sources [12]. To address this limitation, ref. [13] adapted the web ranking algorithm (MBCC-HITS) to power systems and modified it based on the grid power flow, load, and generation, significantly improving the practical relevance of the evaluation. However, this algorithm still insufficiently captures the topological characteristics of the power system [14], and thus requires further refinement and improvement. Ref. [15] adopted an improved K-shell hybrid degree decomposition method, integrating multiple models, such as information entropy, K-shell, kernel density estimation, Copula theory, and risk theory. However, it suffers from issues of excessive model complexity and slow computational efficiency.
Based on the MBCC-HITS algorithm, this paper introduces node degree centrality [16] to improve it and proposes an enhanced MBCC-HITS algorithm named DCHITS, which further incorporates the influence of the distribution network topology on the evaluation of important nodes, thereby improving the accuracy of assessment results. First, the DCHITS algorithm integrates the impact of the grid power flow, load, and power supply on nodes. Then, the node degree centrality value of each node in the distribution network is incorporated into the iterative formula of the algorithm, embedding the effect of the distribution system topology into the DCHITS framework. Finally, in the IEEE 33 system, the DCHITS algorithm is compared with the node degree and betweenness algorithm and the MBCC-HITS algorithm using performance indicators such as the scale of load loss and maximum subgroup size. The results demonstrate that the DCHITS algorithm can more accurately identify important nodes in distribution networks, verifying the rationality and effectiveness of the proposed algorithm.
This paper is organized as follows. In Section 2, we introduce the MBCC-HITS algorithm, briefly discuss the limitations of MBCC-HITS, and describe the improved DCHITS algorithm in detail. In Section 3, we list the detailed calculation process of the DCHITS algorithm. In Section 4, we introduce the evaluation indicators of the final experiments. In Section 5, some experiments are presented, and the conclusions are given in Section 6.

2. DCHITS Algorithm

The MBCC-HITS algorithm is first briefly described in Section 2.1 and then the DCHITS algorithm is described in Section 2.2.

2.1. MBCC-HITS Algorithm

Refs. [17,18] introduce the HITS algorithm and define the authoritative value y n and the hub value z n , which reflect the importance and hub nature of nodes, respectively. It is specified that the importance of a node R n is determined by the hub value and the authoritative value. The greater the value of R n , determined by Equation (1), the higher the importance of the node.
R n = y n + z n .
As a result of shortcomings, such as selecting different initial vectors in the original algorithm and that iterating the final authoritative value and hub value vectors may not be unique, the MBCC-HITS algorithm was proposed in ref. [19]. Suppose the node set S = 1 , 2 , 3 , , N and the directed graph adjacency matrix corresponding to the link relationship between nodes is H. Analyzing the matrix H H , the diagonal elements of the matrix are as follows:
( H H ) i i = i N H k i H k i = d ( i ) .
The non-diagonal elements of the matrix are as follows:
( H H ) i j = i N H k i H k j = C i j .
From the above analysis, the matrix can be written in the following form:
H H = D i n + C ,
where D i n = d i a g ( D i n ) , the diagonal elements are the number of incoming chains for each node, the diagonal elements in the matrix C: C i i = 0 , and the elements on the off-diagonal are C i j = ( H H ) i j . The authority value of each node is represented by (5).
y i = 1 λ d ( i ) y i + 1 λ j = 1 n C i j y j .
The MBCC-HITS algorithm proposes a weight allocation criterion based on the above assumptions. Assume that C i j is the number of nodes that cite both node i and j, and d ( i ) is the number of incoming links of node i. The proportion of the authority value assigned by node i to node j is:
w i j = C i j C i k + d ( i ) = C i j C i ,
where C i = C i k + d ( i ) . Define the proportion of authority values that node i assigns to itself as:
w i j = d i C i k + d ( i ) = d i C i .
The authority value of the node can be calculated using (8):
y i = W m j y m ,
Expressed in matrix form:
y = W T y , y = ( y 1 , y 2 , , y m ) .
In order to solve the problem that when the entry point of a certain node is 0, such that the calculation cannot obtain a convergent solution, the weight matrix is corrected as shown in (10):
W = D c 1 ( H T H + p e T ) ,
where D c = d i a g ( c ) , c = ( c 1 , c 2 , , c N ) , p = ( p 1 , p 2 , , p N ) , p i = 1 , d ( i ) = 0 0 , o t h e r w i s e .
To ensure the uniqueness of the solution, it is required that the directed topology graph corresponding to the set of web pages is strongly connected, i.e., the matrix is irreducible. Then, by adding a web page so that the web page links to all other web pages, the final modified weight matrix is as follows:
W = β D c 1 ( H T H + p e T ) + ( 1 β ) ( 1 / N ) e e T ,
where β is the damping coefficient, often taken as 0.85. The iterative formula for the authority value is shown in (12):
y k = β D c 1 ( H T H + p e T ) + ( 1 β ) ( 1 / N ) e e T y k 1 , n = 1 N ( y n k ) 2 = 1 .
Ref. [13] used the MBCC-HITS algorithm to evaluate the importance of nodes, and added grid flow, load, and power supply factors to improve the algorithm. The grid current is used as the weight between nodes, while load and power supply factors are integrated by adding nodes, so that the algorithm can be applicable to the evaluation of important nodes of the power grid. However, this improvement only focuses on the impact of the current on nodes, and does not consider the impact of the grid topology on nodes.

2.2. DCHITS Algorithm

On the basis of retaining the impact of the actual operating conditions of the power grid on nodes, the DCHITS algorithm adds the influence of the topological factors of the power grid system on nodes; that is, the algorithm includes the impact of these two factors on nodes, making the algorithm more accurate in judging the importance of nodes. In simple terms, the incorporation of node degree centrality in the DCHITS algorithm enables it to account for the influence of the topological structure of the distribution grid system, thereby making the evaluation of critical nodes more comprehensive.

2.2.1. Grid Topological Factor

The topology of the distribution network reflects the connectivity characteristics of the power system [10], especially in the distribution network. Due to the radial structure of the distribution network, there are more nodes with higher degrees of outage, i.e., there are nodes with more branches. Once these nodes are out of operation, it will lead to the loss of power supply to all the subsequent branch nodes. To demonstrate the importance of node degree centrality, the IEEE 13 system is used here as an illustrative example. As shown in Figure 1 for node 2 in the IEEE13 node system, when node 2 is decommissioned, all the three subsequent branches will fail, which will have a huge impact on this distribution network. Therefore, these nodes have a special importance in the distribution network.
Node degree centrality is a measure of the importance of a node in graph theory and network analysis, reflecting the ability of the node to interact with other nodes through direct connections. The degree centrality vector of each node of the distribution network system is added to the iterative formula for the authority value in (12), thus taking into account the influence of the local structure of the distribution network on the importance of the nodes of the system. The greater the degree centrality of a node, the more influence the node has in the overall structure, and the greater the influence of the node in the overall structure. The degree centrality of each node is calculated as shown in (13) [16]:
C i = k i Z 1 ,
where k i is the degree value of the node and Z is the number of nodes in the network. The greater the value of the degree centrality of a node, the more important it is in the network.
The iterative formula for the authority value after considering the centrality of the node degree is shown below:
y k = [ β D c 1 ( H T H + p e T ) + ( 1 β ) ( 1 / N ) e e T ] y k 1 C .
where C is the degree centrality vector of each node of the distribution system.
After calculating the authoritative value after convergence, the final hub value size can be calculated by (15):
z k = H y k 1

2.2.2. Grid Flow Factor

As a dynamic parameter that changes in real time during power system operation, the fluctuating characteristics of the tidal current will continue to play a role in the state assessment of important nodes. In order to quantitatively analyse the impact mechanism of this dynamic process on the system nodes, in this paper, we characterize the weight parameters of the connecting edges between nodes in terms of the absolute value of the branch currents. We also define the topological pointing of the edges in terms of the actual direction of the currents, so as to form the adjacency matrix H with the weights, whose elements are determined according to (16):
H i j = S i j , N o d e i i s c o n n e c t e d t o n o d e j v i a l i n e L i j , t h e p o w e r f l o w a p p a r e n t f l o w i s S i j 0 , N o l i n e c o n n e c t i o n f r o m n o d e i t o n o d e j .

2.2.3. Load and Power Supply Factor

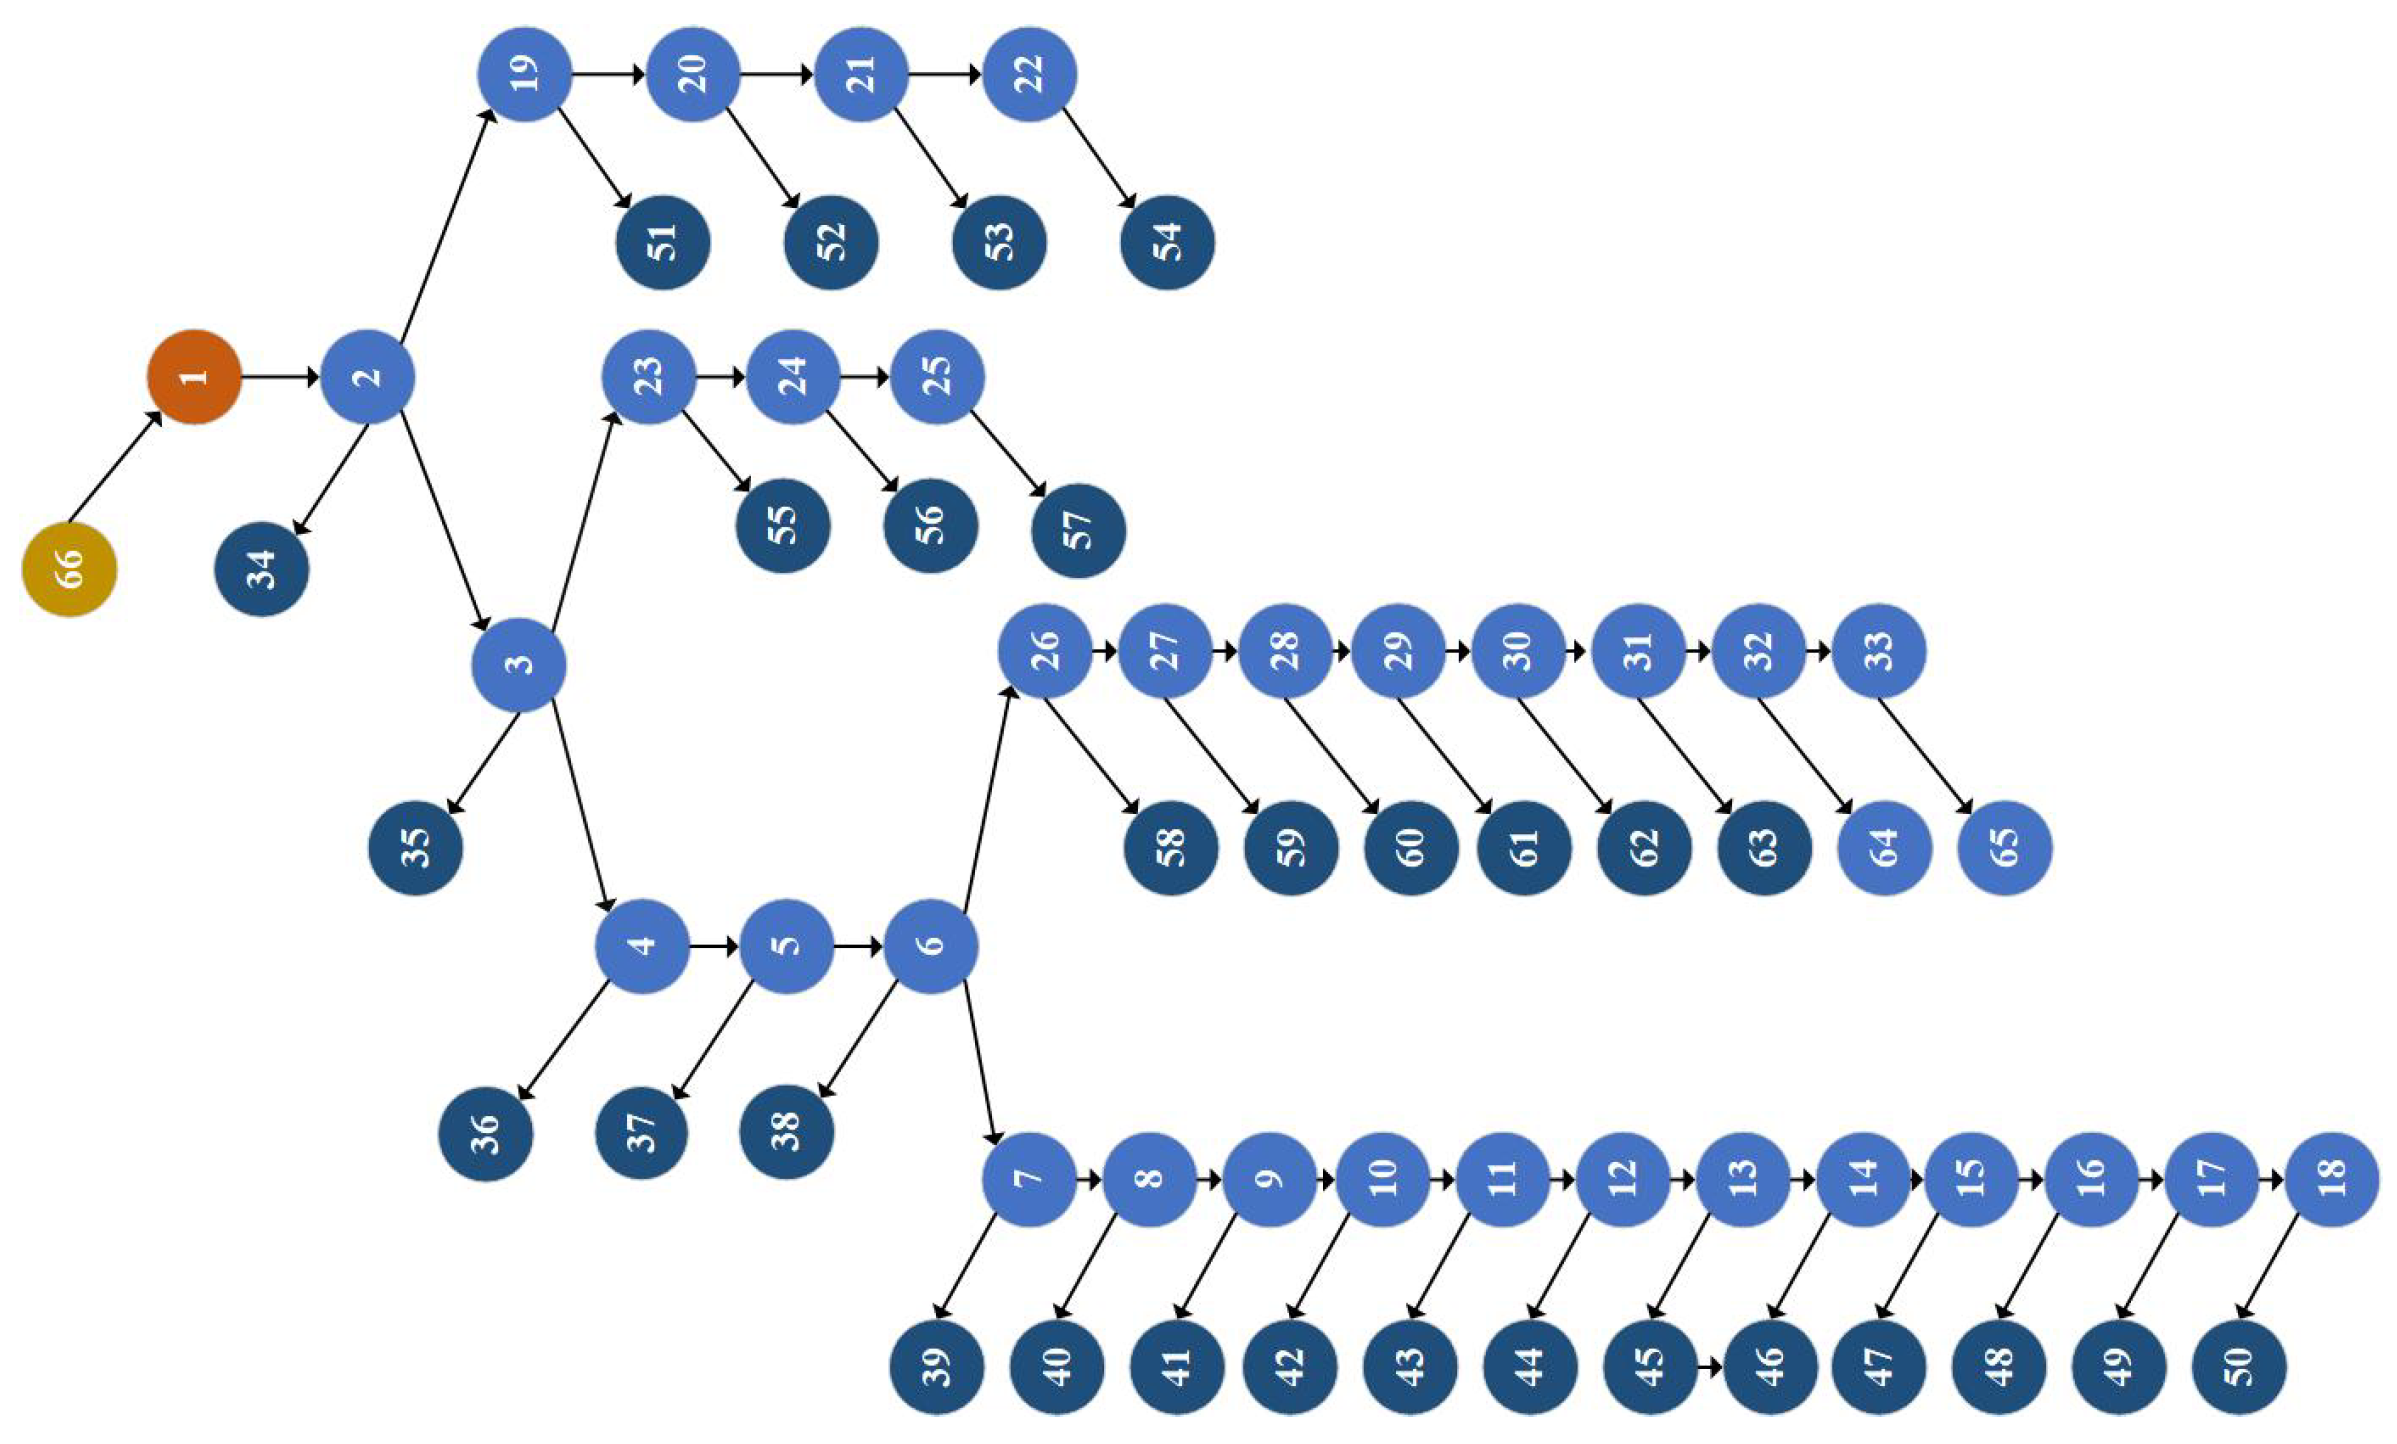
To consider the impact of the load as well as power source on the important nodes of the distribution network, another load and power source node is introduced in each of the load and power source nodes, respectively. The introduced load node edge weight is the load capacity of the corresponding load, and similarly, the introduced power source node edge weight is the generation capacity of the corresponding power source node. After the added node processing, the node out degree can be increased so that the load size and power supply capacity are considered as part of the weights. For newly added nodes, their importance is removed from the final ranking result.

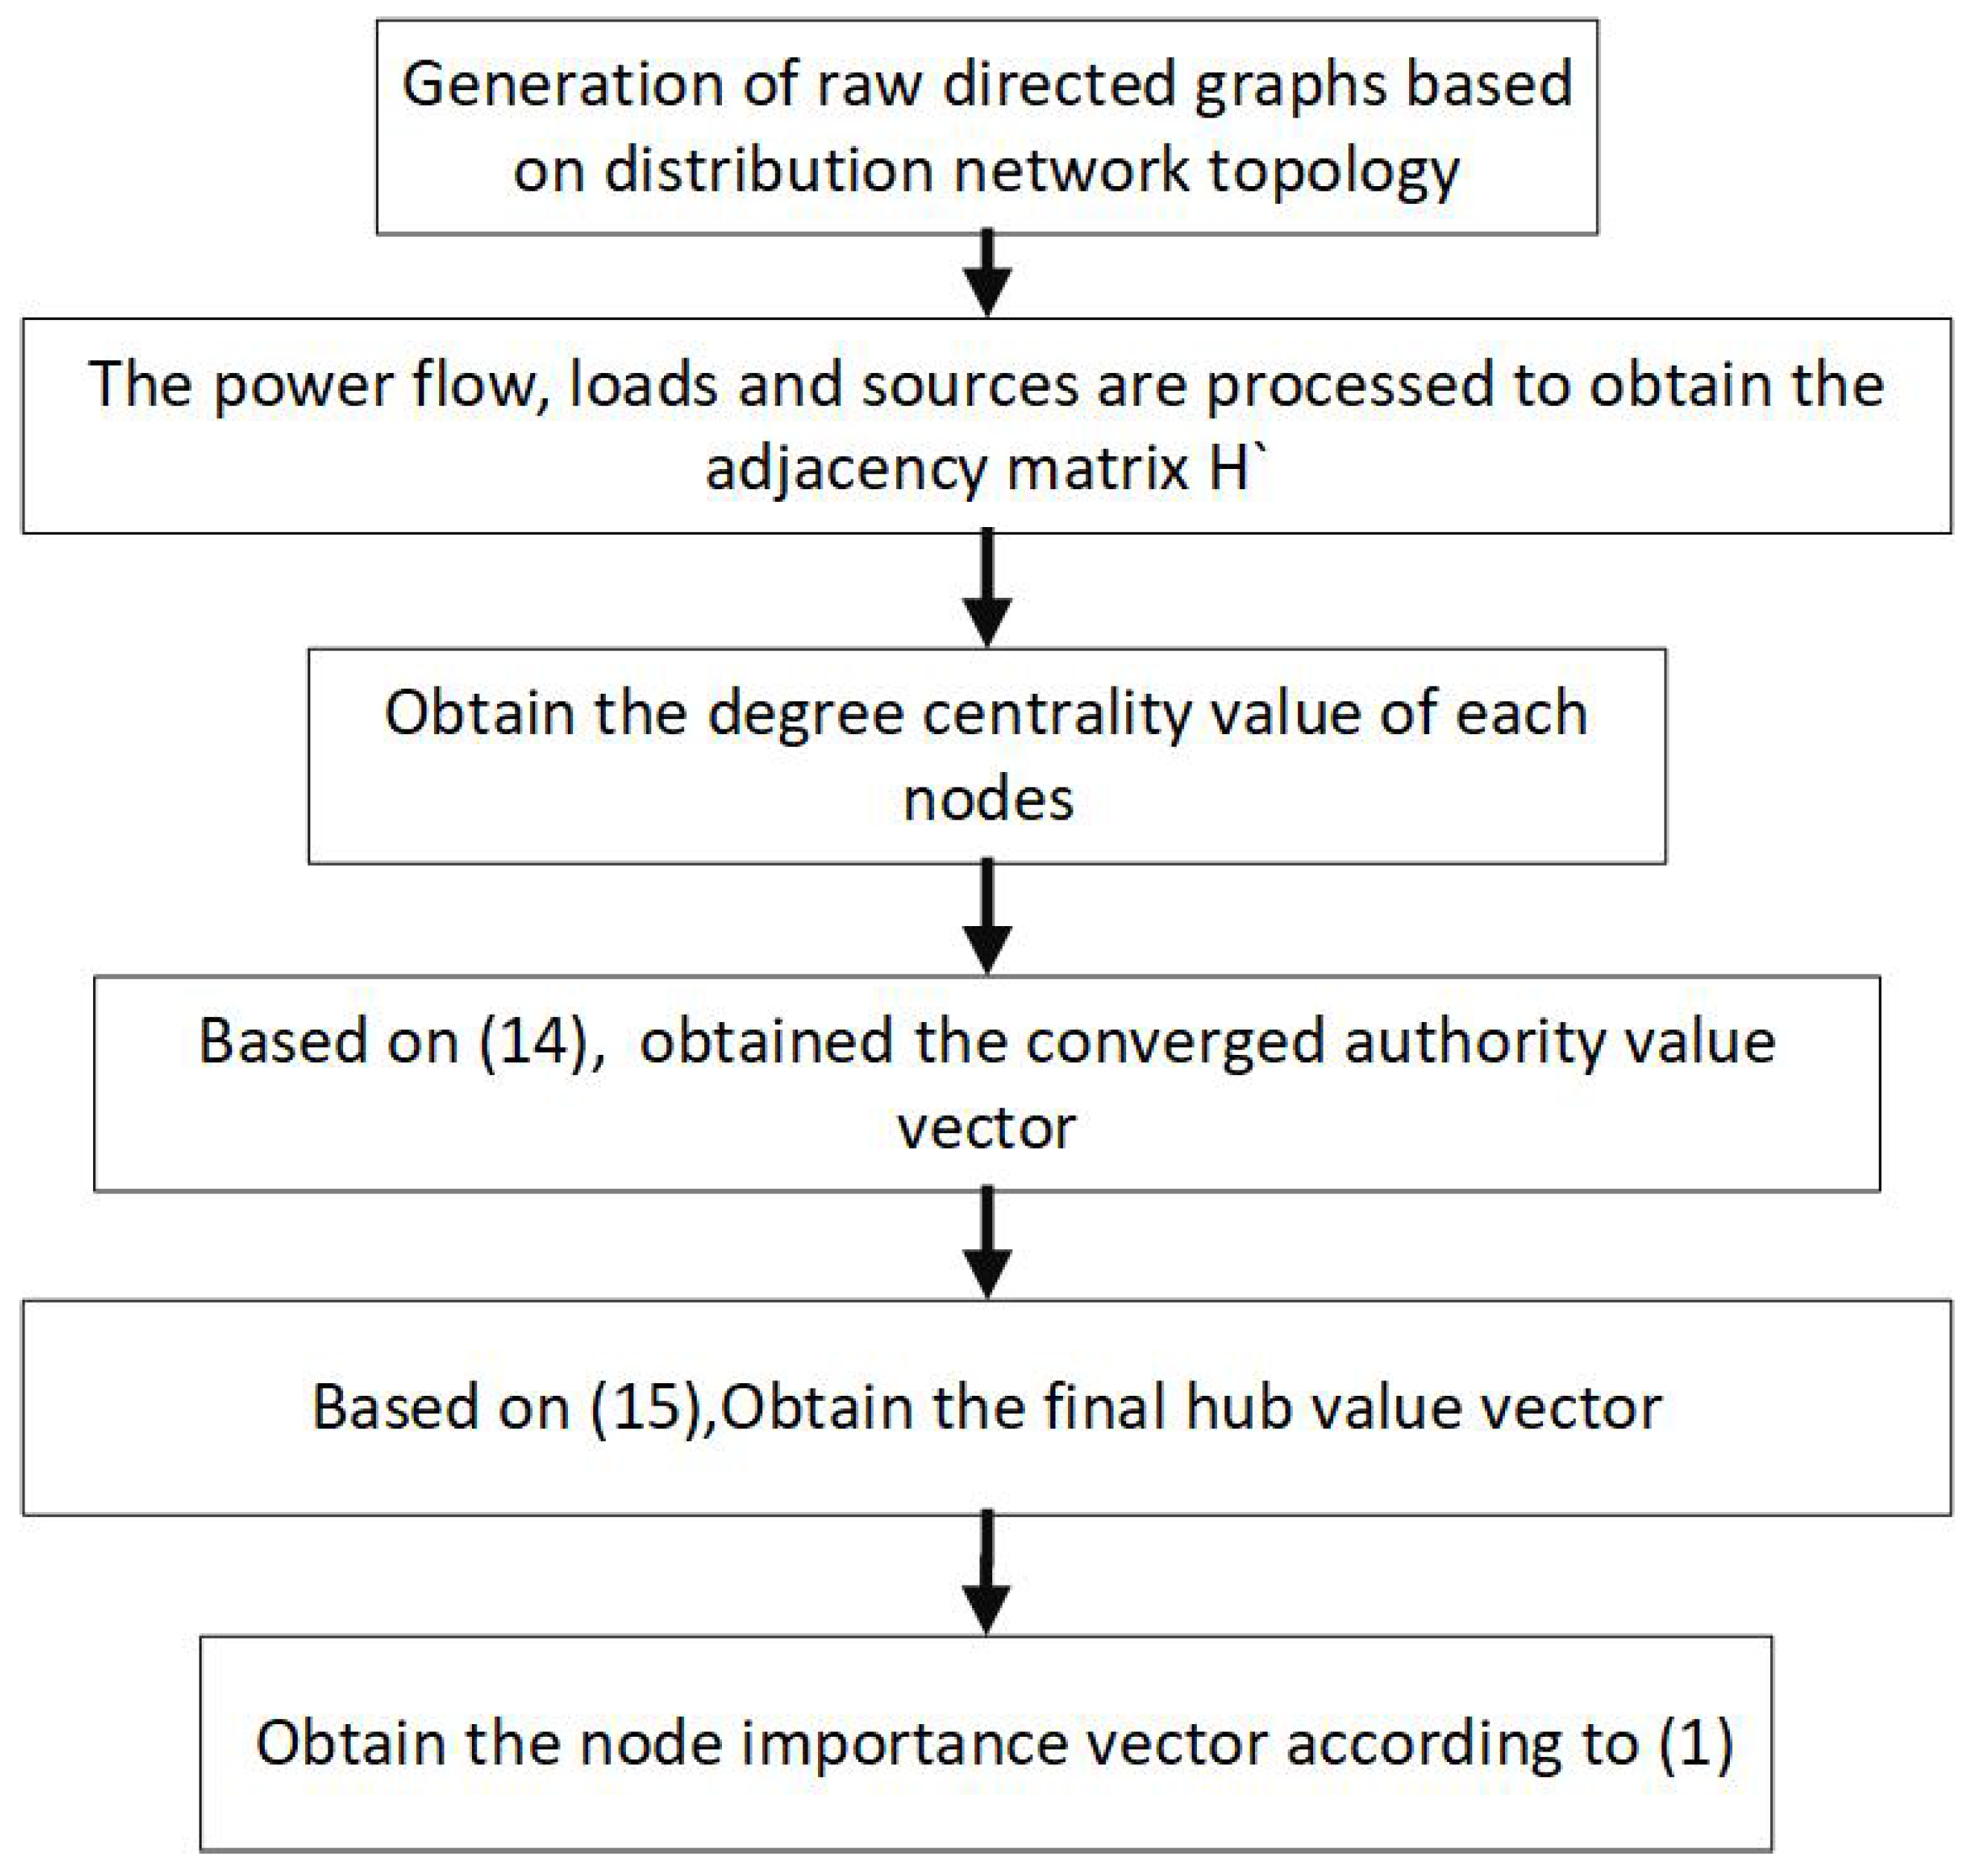
3. DCHITS Algorithm Evaluation Process

Based on the above content, the DCHITS algorithm calculation process is obtained.
  • Obtain the initial directed graph based on the topology of the power system;
  • Add power and load nodes to the diagram and obtain the adjacency matrix H’ according to (16);
  • According to (13), the degree centrality vector of each node is obtained;
  • The converged authority value vector is obtained by iterating according to (14), which is the final authority value vector;
  • Substitute the converged authority values into Equation (15) to obtain the final hub value vector;
  • According to (1), the final authority value is added to the hub value to obtain the final result
The computational process of distribution network node importance assessment is shown in Figure 2.
According to the steps in Figure 2, the node importance of a certain distribution network system is determined. Here, taking the IEEE33 node system as an example, the detailed steps are as follows:
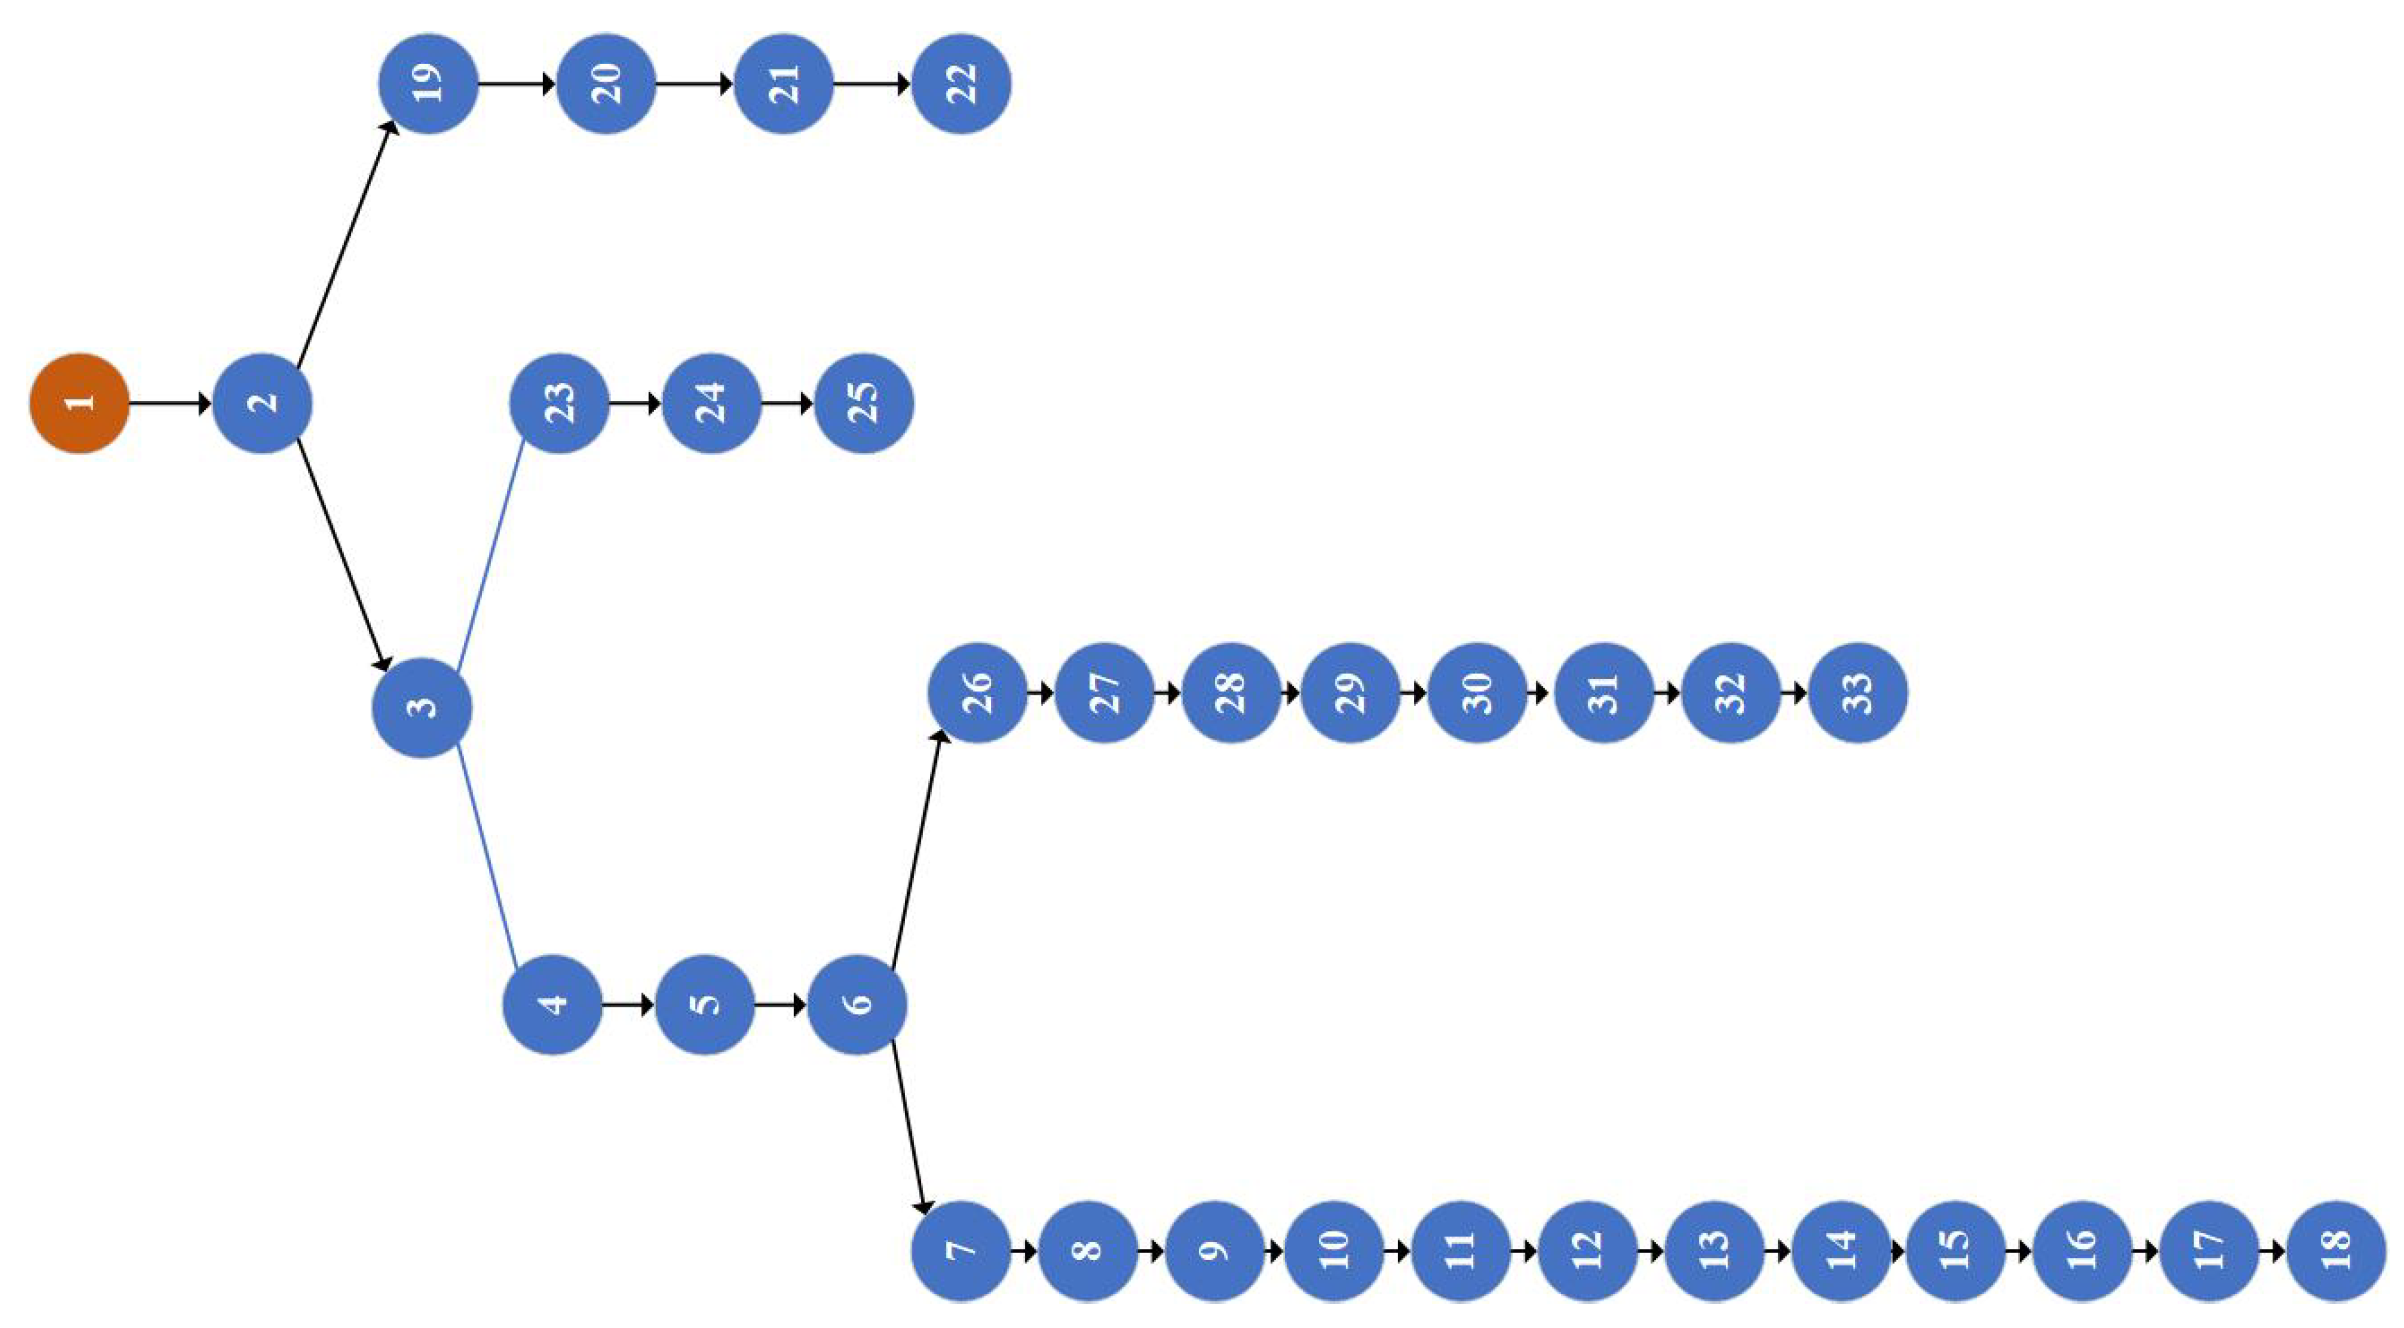
  • Abstract the directed topology diagram of the IEEE33 node system shown in Figure 3. Among them, node 1 is a power supply node, and node 2 to node 33 are all load nodes;
    Figure 3. IEEE33 node system directed topology diagram.
    Figure 3. IEEE33 node system directed topology diagram.
    Algorithms 18 00589 g003
  • The directed topology graph shown in Figure 4 is obtained by adding the power nodes and load nodes and the corresponding adjacency matrix H’ can be further obtained from this topology graph;
    Figure 4. IEEE33 node system directed topology diagram.
    Figure 4. IEEE33 node system directed topology diagram.
    Algorithms 18 00589 g004
  • The degree centrality vector is obtained for each node of the system based on the degree centrality formula and the directed topology graph after adding power and negative nodes, denoted as C;
    C = [ 0.0308 , 0.0615 , 0.0615 , 0.0462 , 0.0462 , 0.0615 0.0462 , , 0.0462 11 , 0.0308 , 0.0462 , , 0.0462 3 , 0.0308 , 0.0462 , 0.0462 , 0.0308 , 0.0462 , , 0.0462 7 , 0.0308 , 0.0154 , , 0.0154 33 ] .
  • The final authority and hub value vectors are obtained through (14) and (15), respectively, and are summed to obtain the results of the importance assessment of each node of the IEEE33 node system.

4. Evaluation Indicators

This paper adopts two indexes of the scale of load loss and maximum subgroup size [20] to verify the correctness of the final result.

4.1. The Scale of Load Loss

The scale of load loss is used to measure the ability of the grid to meet the load demand after a fault or attack. For any disconnected subsystem, the lost load size can be calculated by the following equation:
L = D i C , D i > C i 0 , D i C i ,
L O L = 1 D i = 1 s L i ,
where C i and D i are the generator output and load demand of the subsystems, respectively. Equation (18) is used to determine the lost load size of a subsystem after attacking a node, where D i is the load demand of the whole power system before there is no attacking node. L O L is the total lost load size according to Equation (19), where s is the number of subsystems after attacking a certain node. A large value of L O L implies that the node being attacked is more important.

4.2. The Maximum Subgroup Size

The maximum subgroup size, on the other hand, represents the impact of the node on the power system in terms of the topology of the system. The maximum subgroup size of a given system can be obtained from the following equation:
R = N N ,
where N and N are the number of nodes contained in the largest subgroups before and after a node of the attacking system, respectively, and R is the maximum subgroup size of a node of the system after it has been attacked. The smaller R is, the more significant is the attack on a node.

5. Experimental Results and Analysis

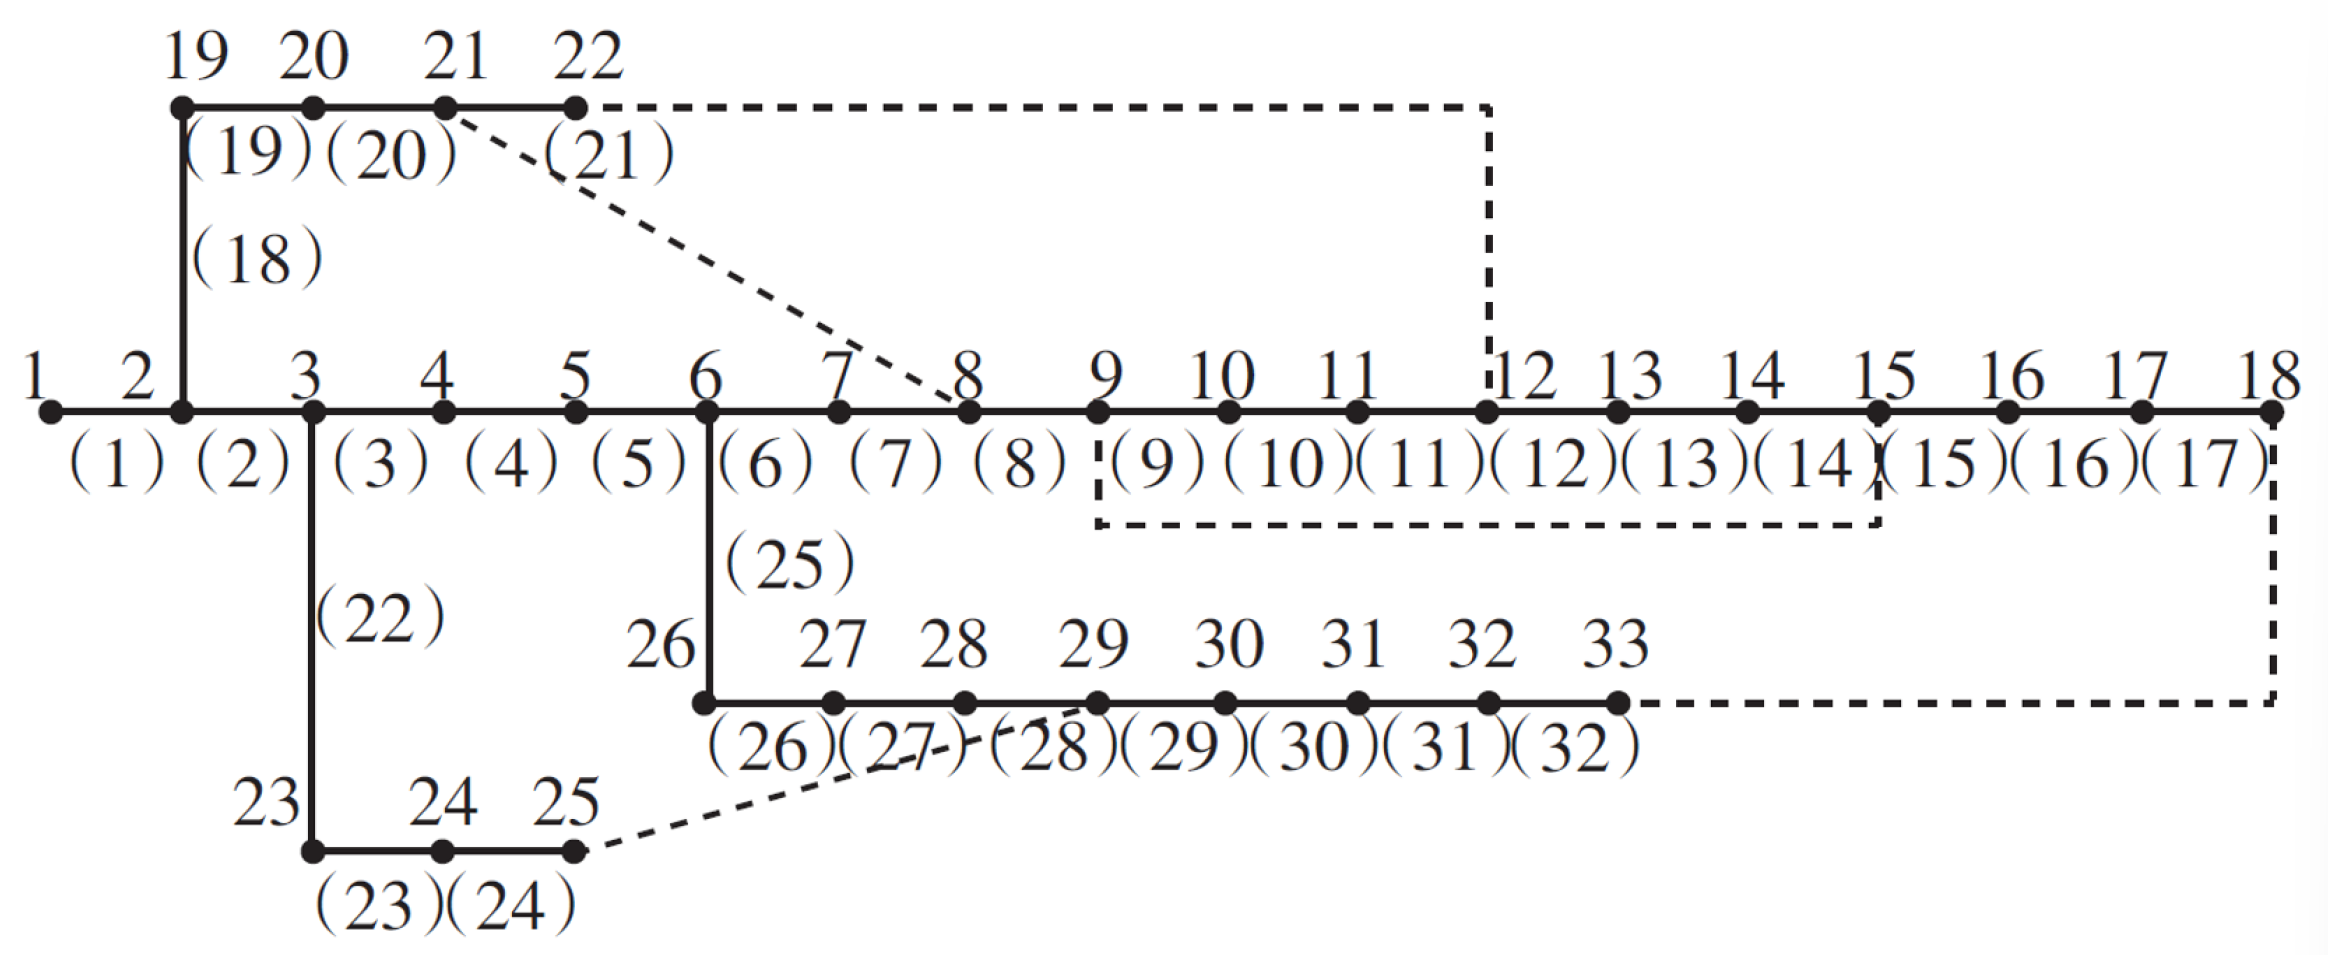
In this paper, the IEEE33 node system is used for simulation, which comprises a 10 kV network with 33 nodes, 32 branches, 5 contact switch branches, 12.66 kV reference voltage at the first end of the power network, and 10MV-A three-phase reference power value. The specific structure is shown in Figure 5. In Figure 5, apart from node 1, which is a supply node, nodes 2 through 33 are all load nodes.
According to the previous content, the comprehensive ranking results of the importance of each node in the IEEE33 node system calculated are shown in Table 1, and the nodes are sorted from large to small according to the R n value.
To validate the effectiveness of the algorithm proposed in this paper, we compared the results of the node importance ranking for the IEEE 33 distribution network system using the method proposed in this paper with those obtained using the methods described in refs. [9,13]. The results calculated by the three methods are shown in Table 2. To present the experimental results more clearly, we refer to the DCHITS algorithm as Method 1, the MBCC-HITS algorithm as Method 2, and the node degree and node betweenness algorithm as Method 3.
As can be seen from Table 2, among the calculation results of the three methods, the top nine ranked nodes are the same. At the same time, according to the IEEE33 node system topology shown in Figure 5, it can be seen that the top nine nodes are nodes with more degrees in the distribution system or nodes located in the upstream of the power transport, which indicates that Method 1 is able to accurately identify the nodes that are extremely important in the distribution network system.
For the node ranked 10th, both Method 1 and Method 2 identified Node 27, while Method 3 identified Node 24. On the one hand, according to the topology of the IEEE33 node system in Figure 5, it can be seen that node 24 is located at the end of this feeder, and is much less important than node 27 in terms of topology. On the other hand, from the point of view of the load loss, the amount of load loss caused when node 24 encounters a failure to withdraw from the operation is also much less than that of node 27, and thus, the importance of node 24 is ranked as no. 10, which is unreasonable. In Method 1 and Method 2, node 27 is ranked 10th in terms of importance, which is more reasonable, both in terms of topology and the load loss caused by failing out of operation. Furthermore, according to Table 2, it is more reasonable to rank the importance of node 24 as 23rd in Method 1.
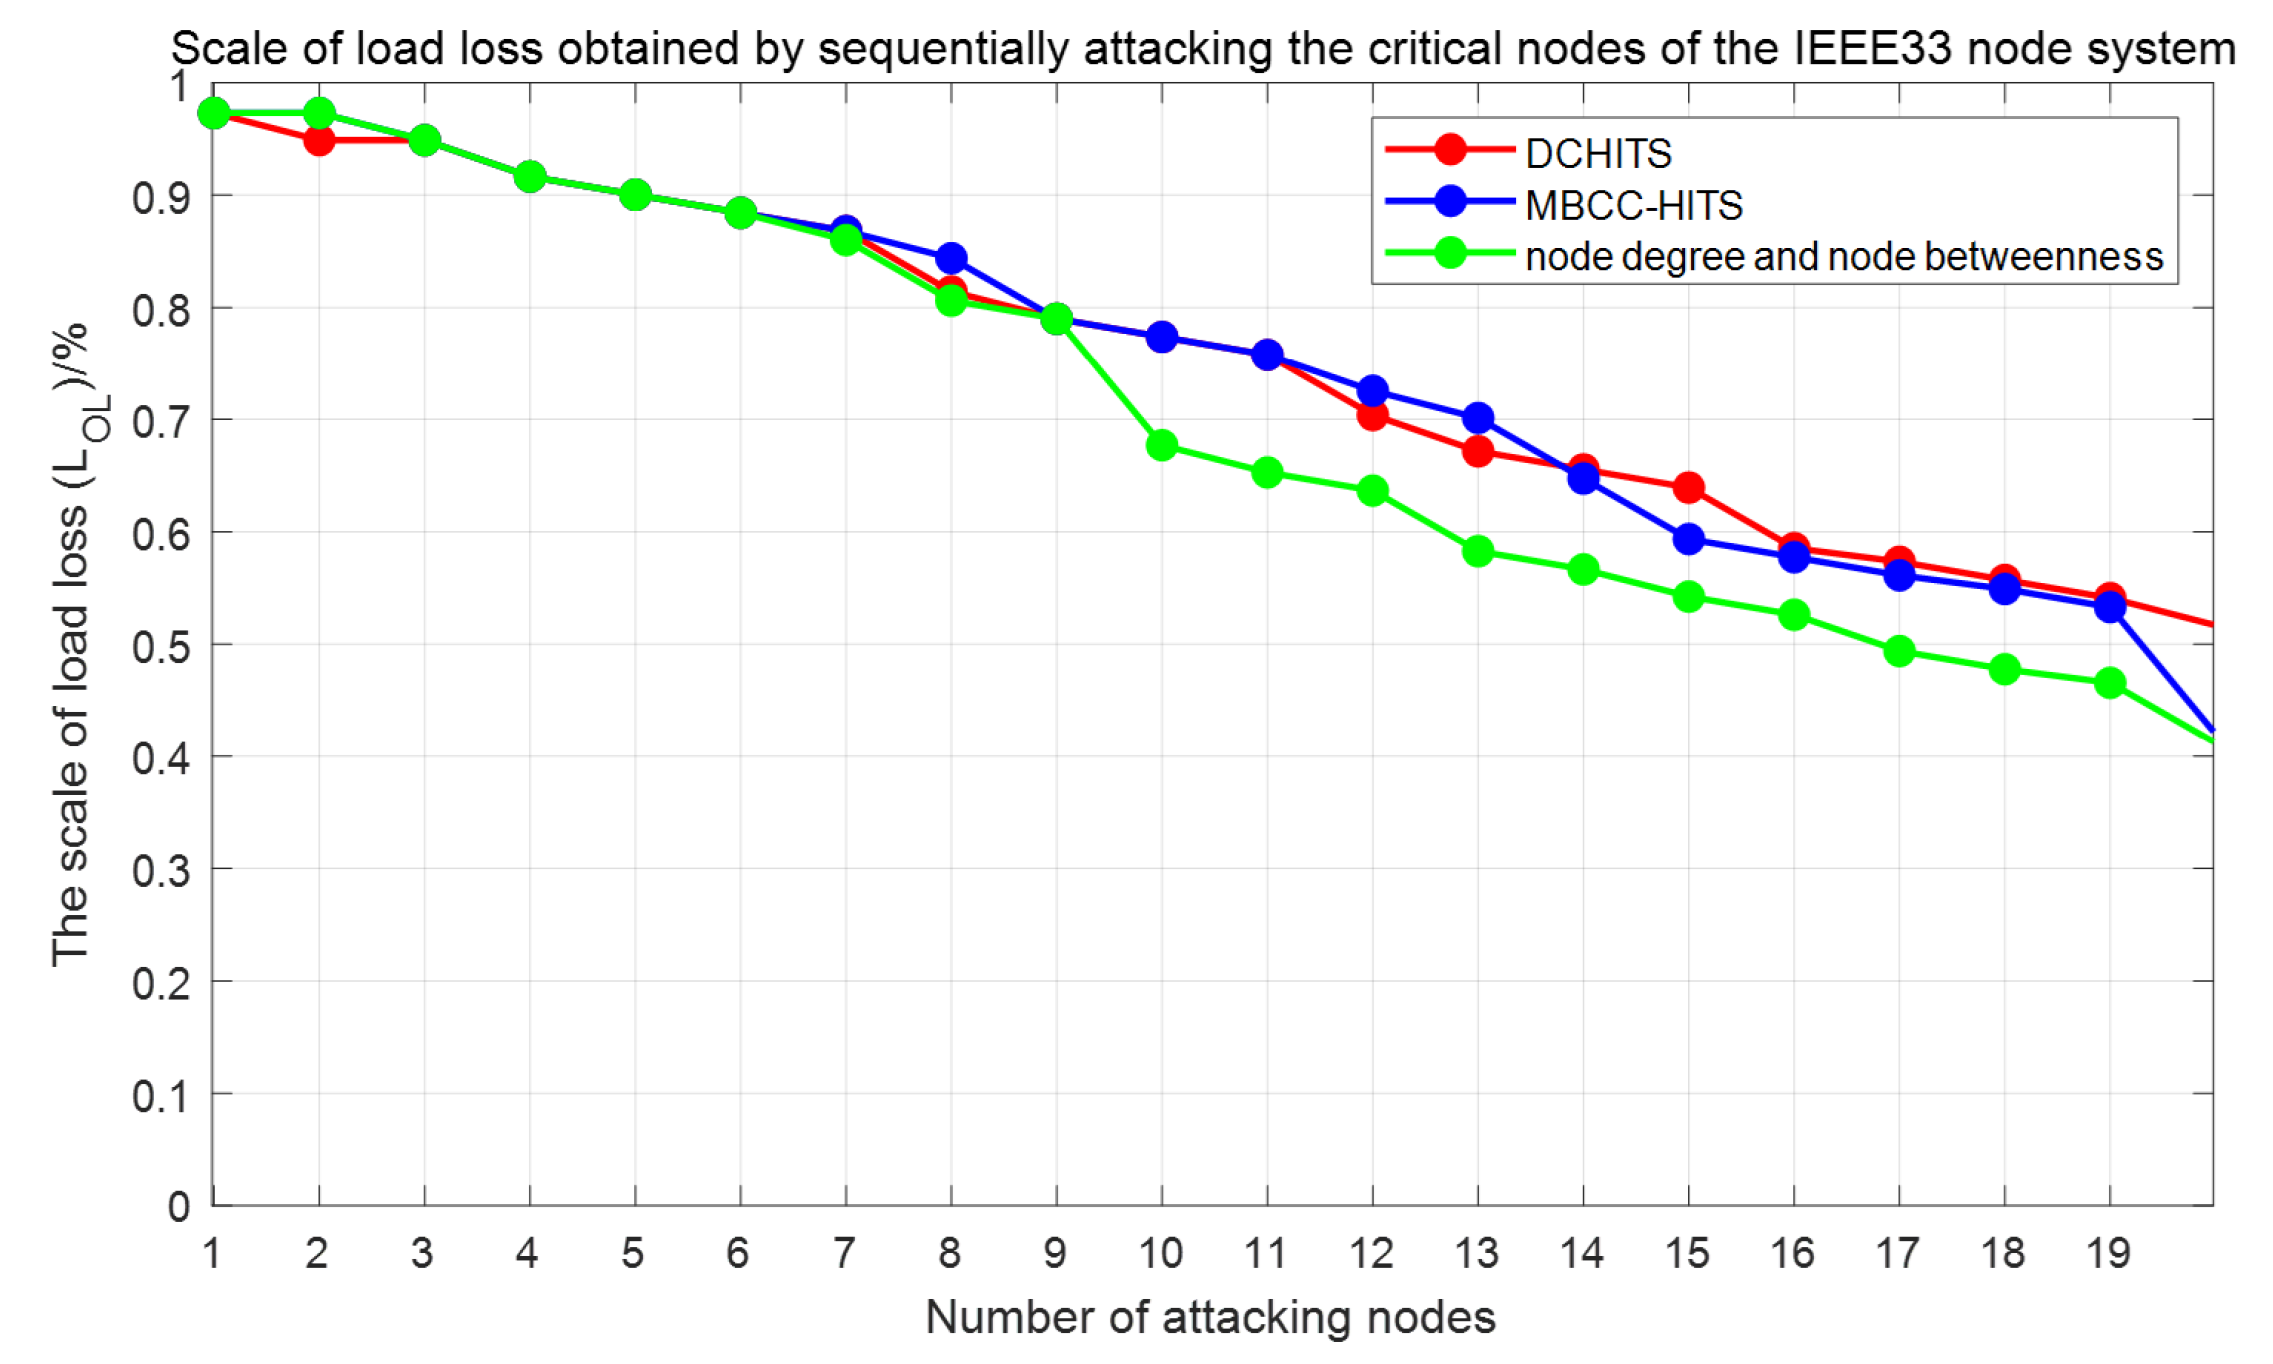
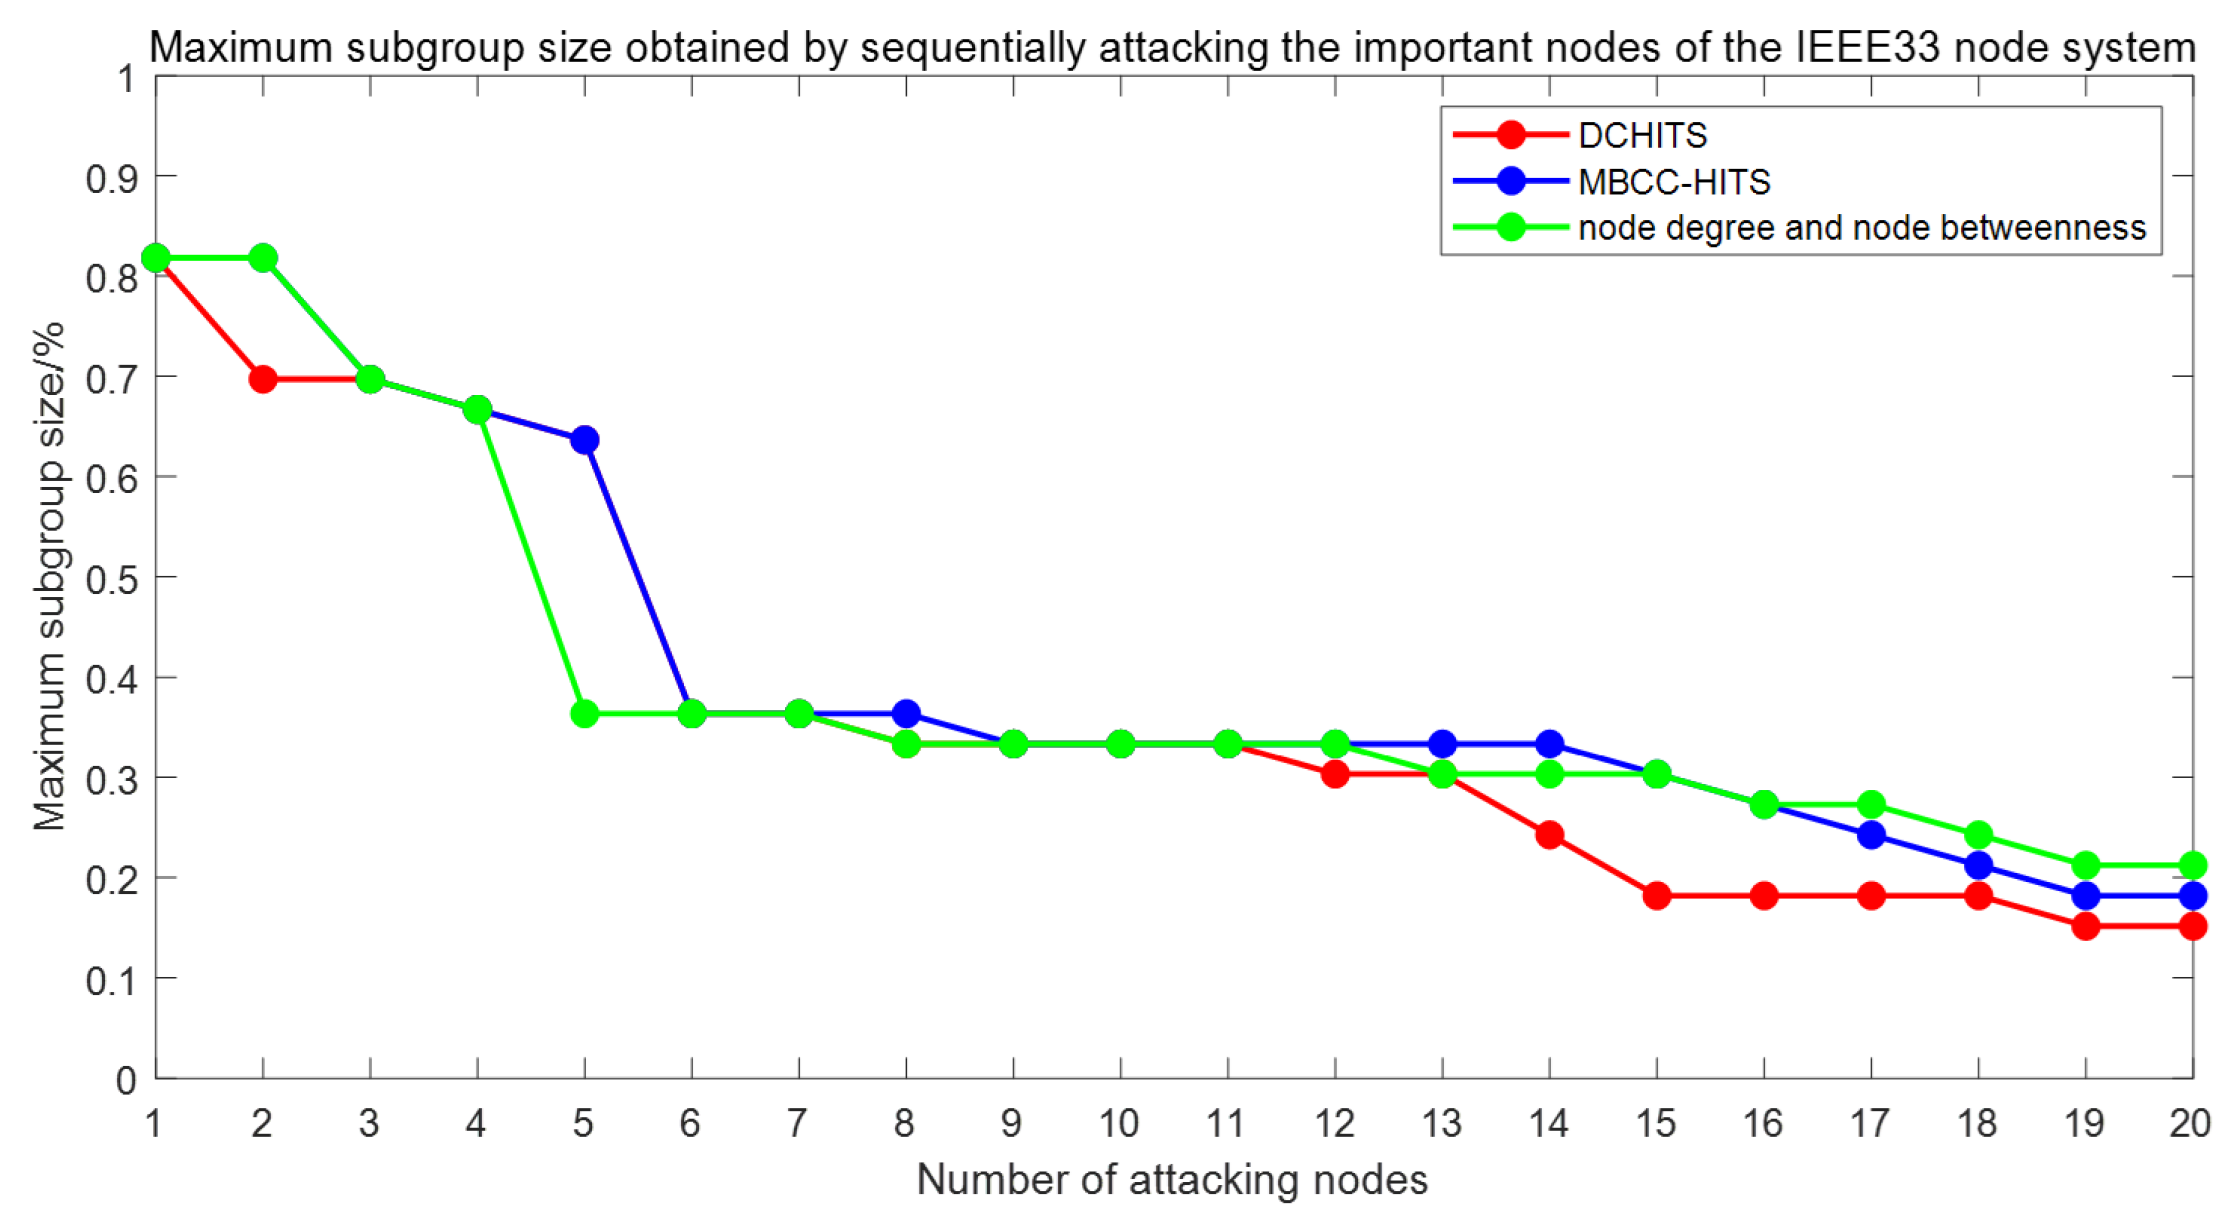
By sequentially attacking the top 20 important nodes identified by Method 1 and calculating the scale of load loss, the red curve shown in Figure 6 was obtained. Similarly, sequential attacks on the top 20 important nodes from Method 2 yielded the blue curve in Figure 6; while attacking the top 20 important nodes from Method 3 resulted in the green curve presented in Figure 6. A larger scale of load loss indicates that more loads cannot be supplied with power, demonstrating that the attacked nodes are more important. As can be observed from Figure 6, the curves of the three methods essentially coincide and remain consistent before the number of attacked nodes reaches 7. However, when the number of attacked nodes exceeds 7, the curve of Method 3 is significantly lower than those of Method 1 and Method 2. Furthermore, the curve of Method 1 gradually surpasses that of Method 2 in the latter segment. Quantitative calculations indicate that the load loss obtained by Method 1 increased by 0.55% compared to Method 2, and by 6.63% compared to Method 3. This indicates that Method 1 demonstrates superiority over Method 2 and Method 3 in terms of topological structure. By sequentially attacking the top 20 important nodes identified by Method 1 and calculating the maximum subgroup size, the red curve shown in Figure 7 was obtained. Similarly, sequential attacks on the top 20 important nodes from Method 2 yielded the blue curve in Figure 7, while attacking the top 20 important nodes from Method 3 resulted in the green curve presented in Figure 7. A smaller maximum subgroup size indicates that the attacked nodes are more important from a topological perspective. As shown in Figure 7, the blue curve obtained from Method 2 is generally higher than the red curve from Method 1, except for some overlapping segments. The green curve from Method 3 remains higher than or is coincident with the red curve from Method 1 for most cases, except when the number of attacked nodes is 2, where it briefly exceeds the red curve. Quantitative calculations indicate that the maximum subgroup size obtained by Method 1 was reduced by 8.21% compared to Method 2, and by 5.38% compared to Method 3. This indicates that Method 1 is superior to Method 2 and Method 3 in terms of the maximum subgroup size metric.
Based on the combined analysis of the scale of load loss and maximum subgroup size results, both Method 1 and Method 2 demonstrate superior performance over Method 3 in identifying the critical nodes in distribution networks. Furthermore, since the DCHITS algorithm incorporates node degree centrality on the basis of the MBCC-HITS algorithm to account for the influence of system topological structure, it exhibits greater rationality compared to the MBCC-HITS algorithm.

6. Conclusions

Aiming at the problem of the evaluation of important nodes in distribution networks, the DCHITS algorithm was designed, inspired by the MBCC-HITS algorithm. The DCHITS algorithm comprehensively considers the influence of factors such as the topological structure and power flow of the distribution network system on nodes, thereby more closely reflecting the actual operational characteristics of distribution systems. In the IEEE 33 system, the DCHITS algorithm and the control algorithm were quantitatively analyzed using the metrics of the scale of load loss and maximum subgroup size, leading to the following conclusions:
The DCHITS algorithm has advantages over the traditional node degree and node betweenness algorithm in terms of the size of load loss and maximum subgroup size. In the node attack experiment, the DCHITS algorithm achieved a 6.63% increase in the scale of load loss compared to the node degree and node betweenness algorithm, while reducing the maximum subgroup size by 5.38%. These results demonstrate that the DCHITS algorithm exhibits higher precision in identifying critical nodes.
Compared with the MBCC-HITS algorithm, the DCHITS algorithm has an obvious advantage in the maximum subgroup size index in the case of similar scale of load loss index. It achieved a 0.55% increase in the scale of load loss and an 8.21% reduction in the maximum subgroup size, which indicates that the DCHITS algorithm is more suitable for the node importance assessment of distribution networks.

Author Contributions

Conceptualization, H.R.; investigation, T.Z.; software, W.Z.; writing–original draft preparation J.W. and Z.C. All authors have read and agreed to the published version of the manuscript.

Funding

Research and Application of Safety Evaluation Technology for Power Infrastructure in Service of Urban Resilience Enhancement.

Data Availability Statement

The algorithm code is published at the following URL: https://github.com/zhangweitbeaast-cmyk/DCHITS (accessed on 12 August 2025).

Conflicts of Interest

Authors Jie Wu and Zhengwei Chang were employed by the company State Grid Corporation of Sichuan Province Research Institute of Electric Power Science. Author Tingting Zeng was employed by the company Sichuan Shuneng Dianke Energy Technology Company Limited. The remaining authors declare that the research was conducted in the absence of any commercial or financial relationships that could be construed as a potential conflict of interest.

References

  1. Lu, G.; Deng, J.; Wang, Y.H.; Cao, J.; Yue, Y.F. Analysis of Power System Affected by Extreme Weather and Its Adaptive Strategy. Power Gener. Technol. 2021, 42, 751–764. [Google Scholar] [CrossRef]
  2. Pan, L.; Hu, Y.; Yang, J.; Wei, X.; Yang, X. Research on the Risk Resilience Assessment of Distribution Network Under Typhoon Weather. Microcomput. Appl. 2024, 40, 247–256. [Google Scholar]
  3. Chen, B.; Liao, J. Technology for Improving Distribution Network Disaster-Prevention Capabilities for Intercurrent Natural Disasters Areas Under Extreme Weather: Review and Prospect. Electr. Power Constr. 2025, 46, 107–121. [Google Scholar]
  4. Wang, L.; Tang, J.; Huang, Y.; Wang, K.; Jian, Z. Risk zone assessment of rainstorm induced waterlogging associated outage of distribution system with consideration of micro-topography. J. Electr. Power Sci. Technol. 2024, 39, 84–92. [Google Scholar] [CrossRef]
  5. Ruan, Q.; Xie, W.; Xu, Y.; Hua, B.; Song, P.; He, J.; Zhang, Q. Concept and key features of resilient power grids. Proc. CSEE 2020, 40, 6773–6784. [Google Scholar] [CrossRef]
  6. Li, L.; An, Z.; Zhang, S.; Xiao, Z.; Li, Z. Research and prospect on key technologies of resilient power grid. Electr. Meas. Instrum. 2024, 61, 8–16. [Google Scholar] [CrossRef]
  7. Albert, R.; Albert, I.; Nakarado, G.L. Structural vulnerability of the North American power grid. Phys. Rev. E 2004, 69, 025103. [Google Scholar] [CrossRef] [PubMed]
  8. Yu, Q.; Ying, Q.; Cao, N.; He, J.; Sun, W.; Zhang, X. Risk Assessment of Online Public Opinion on Power Grid Outage Incidents Based on Attribute Mathematical Theory. Power Syst. Technol. 2025, 49, 719–726. [Google Scholar] [CrossRef]
  9. Shi, W. Study of Distribution Network Vulnerability Assessment Method Based on Distribution Information. Proc. CSU-EPSA 2018, 30, 125–131. [Google Scholar] [CrossRef]
  10. Ju, J.; Zhao, J.; Yang, K. Identification of key nodes in distribution networks considering data-driven power flow model. Water Resour. Hydropower Eng. 2023, 54, 26–36. [Google Scholar] [CrossRef]
  11. Li, Y. Research on Vulnerability Assessment Method of Distribution Network. Master’s Thesis, Shandong University of Technology, Zibo, China, 2022. [Google Scholar] [CrossRef]
  12. Liu, W. Research and Application of Distribution Network Reliability Considering Distributed Generation. Master’s Thesis, Guangdong University of Technology, Guangzhou, China, 2020. [Google Scholar] [CrossRef]
  13. Wang, H.; Shan, Z.; Ying, G. Evaluation method of node importance for power grid considering inflow and outflow power. J. Mod. Power Syst. Clean Energy 2017, 5, 696–703. [Google Scholar] [CrossRef]
  14. Geng, J.; Sun, X.; Song, H.; Qu, Y. Important node evaluation algorithm for electrical power system inspired by internet thinking. J. Natl. Univ. Def. Technol. 2023, 45, 211–218. [Google Scholar] [CrossRef]
  15. Duan, H.; Guo, C.; Chen, F. Assessment of vulnerable nodes in active distribution networks based on improved K-shell mixed degree decomposition method. J. Electr. Power Sci. Technol. 2025, 40, 67–76. [Google Scholar] [CrossRef]
  16. Yan, H.; Ma, G.; Qian, Y. Degree-Centrality Based Feature Selection. Data Collect. Process. 2019, 34, 312–321. [Google Scholar] [CrossRef]
  17. Gibson, D.; Kleinberg, J.; Raghavan, P. Inferring web communities from link topology. In Proceedings of the Ninth ACM Conference on Hypertext and Hypermedia, Pittsburgh, PA, USA, 20–24 June 2019; Volume 1998, pp. 225–234. [Google Scholar] [CrossRef]
  18. Kleinberg, J.M. Authoritative sources in a hyperlinked environment. J. ACM (JACM) 1999, 46, 604–632. [Google Scholar] [CrossRef]
  19. Yue, X.; Zhu, T.H. A Model Based on Cocitation for Web Information Retrieval. Math. Probl. Eng. 2014, 2014, 418605. [Google Scholar] [CrossRef]
  20. Wang, K.; Zhang, B.; Zhang, Z.; Yin, X.; Wang, B. An electical betweenness approach for vulnerability assessment of power grids considering the capacity of generators and load. Phys. A Stat. Mech. Appl. 2011, 390, 4692–4701. [Google Scholar] [CrossRef]
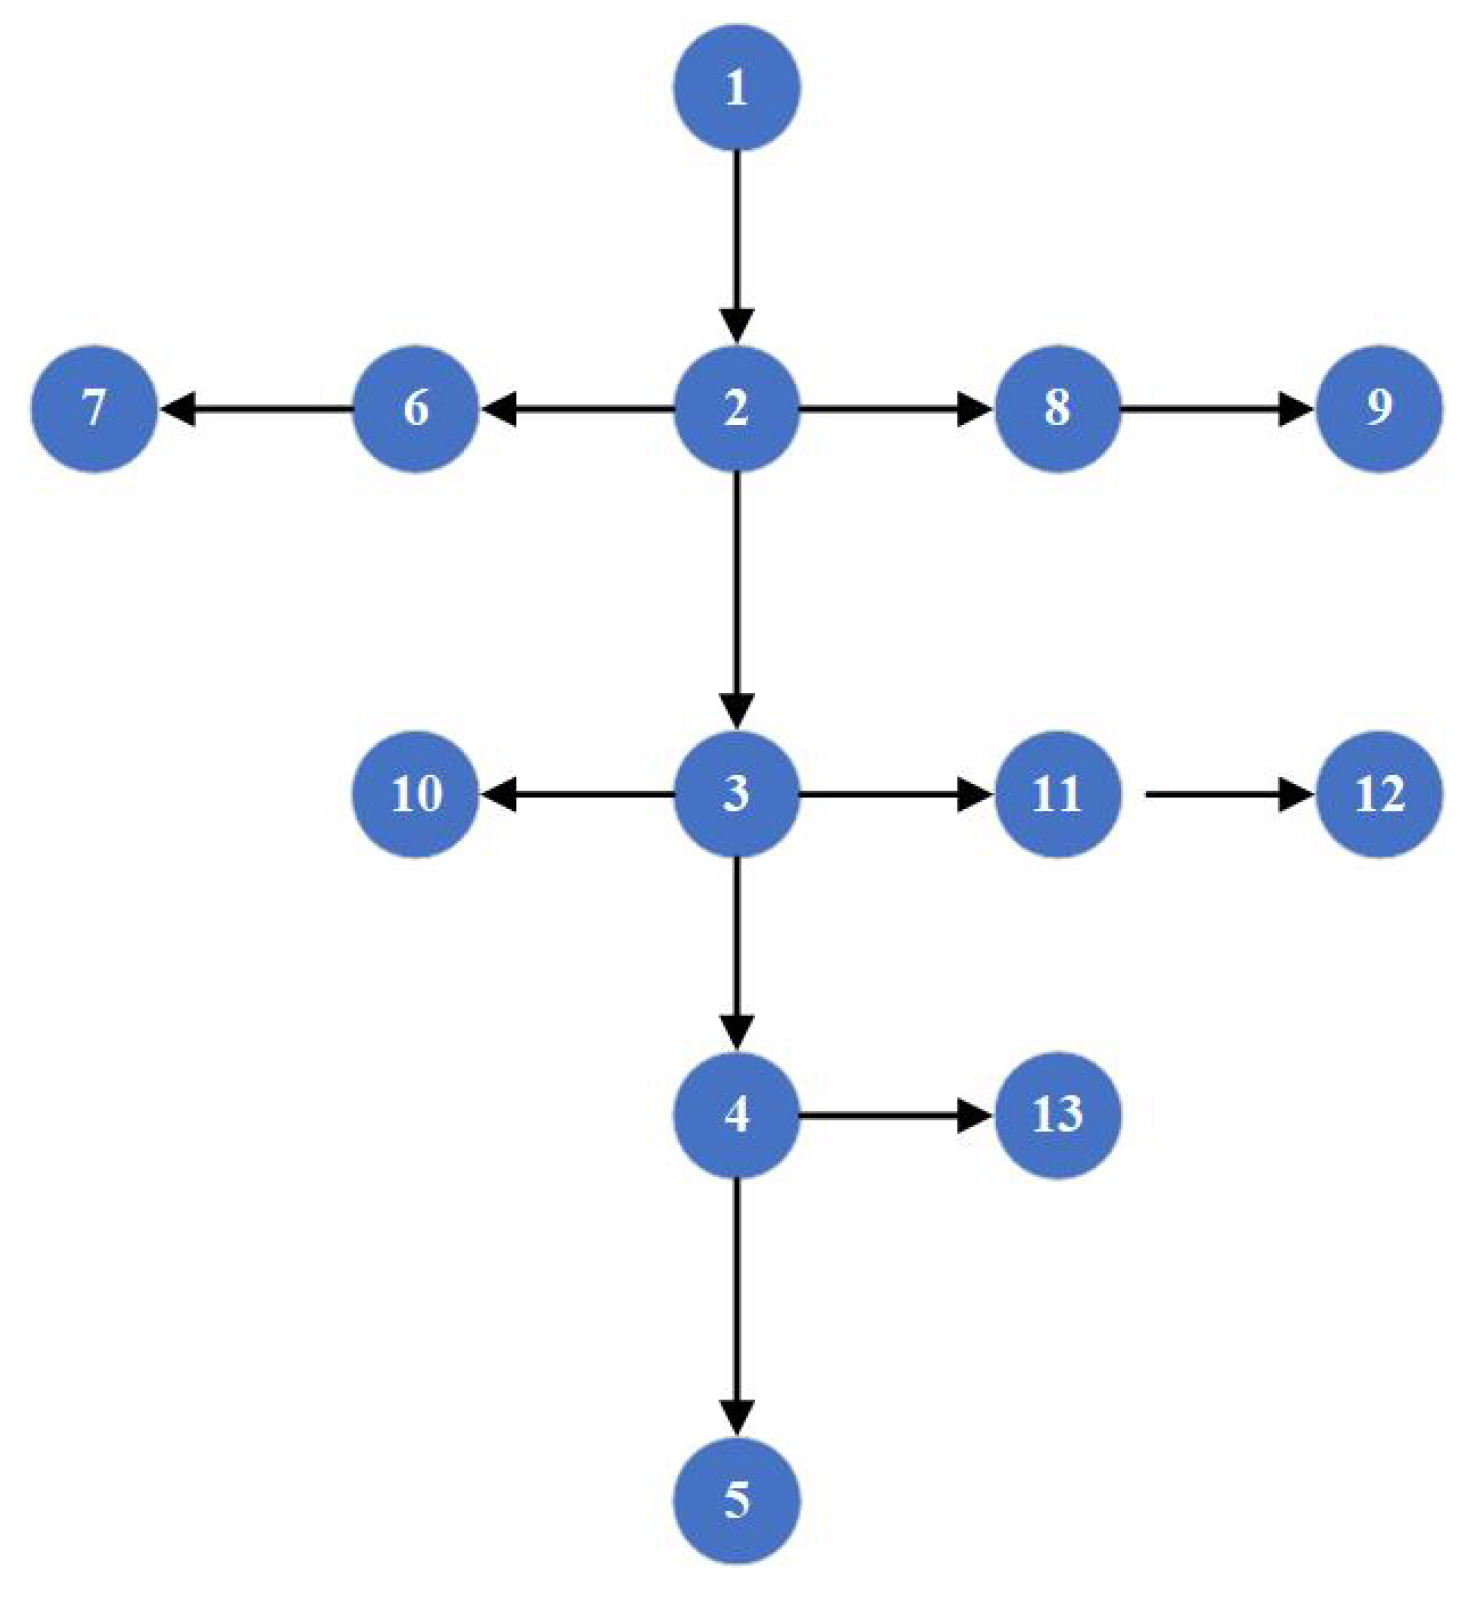
Figure 1. IEEE13 node system directed topology diagram.
Algorithms 18 00589 g001
Figure 2. Calculation process for distribution network node importance assessment.
Algorithms 18 00589 g002
Figure 5. IEEE33 node system architecture diagram.
Algorithms 18 00589 g005
Figure 6. Scale of load loss obtained by sequentially attacking the important nodes of the IEEE33 node system.
Algorithms 18 00589 g006
Figure 7. Maximum subgroup size obtained by sequentially attacking the important nodes of the IEEE33 node system.
Algorithms 18 00589 g007
Table 1. Results of calculating the node importance of the IEEE33 node system based on DCHITS.
Node Number R n Ranking
21.00631
30.90862
10.80473
40.66614
50.55255
60.44196
260.23467
70.20188
230.19519
270.180210
280.163311
80.145512
290.119113
100.108114
120.090315
300.090116
110.079617
90.071218
130.070819
190.063120
140.053721
150.048522
240.042123
160.036824
310.028725
200.028526
170.023727
320.021528
210.015629
250.013030
180.006831
220.006732
330.005033
Table 2. Comparison of node importance results of different methods.
RankingDCHITSMBCC-HITSNode Degree and Node Betweenness
1222
2311
3133
4444
5556
6665
7262323
87267
923726
10272724
11282819
1282927
1329198
14103028
1512820
161699
17171029
18181110
19191211
20202430
Disclaimer/Publisher’s Note: The statements, opinions and data contained in all publications are solely those of the individual author(s) and contributor(s) and not of MDPI and/or the editor(s). MDPI and/or the editor(s) disclaim responsibility for any injury to people or property resulting from any ideas, methods, instructions or products referred to in the content.