Article

Estimation of Residential Vacancy Rate in Underdeveloped Areas of China Based on Baidu Street View Residential Exterior Images: A Case Study of Nanning, Guangxi

1
School of Geography and Planning, Nanning Normal University, Nanning 530001, China
2
Key Laboratory of Environment Change and Resources Use in Beibu Gulf, Ministry of Education, Nanning Normal University, Nanning 530001, China
3
Urban Planning and Design Institute of Nanjing University Co., Ltd., Nanjing 210023, China
4
College of Engineering, City University of Hong Kong, Hong Kong 99077, China
5
School of Architecture and Art Design, Lanzhou University of Technology, Lanzhou 620103, China
6
School of Life Science, Hubei University, Wuhan 430062, China
7
School of Business Administrations, Zhongnan University of Economics and Law, Wuhan 430073, China
*
Authors to whom correspondence should be addressed.
These authors contributed equally to this work.
Algorithms 2025, 18(8), 500; https://doi.org/10.3390/a18080500
Submission received: 17 June 2025 / Revised: 27 July 2025 / Accepted: 30 July 2025 / Published: 11 August 2025
(This article belongs to the Special Issue Algorithms for Smart Cities (2nd Edition))

Abstract

Housing vacancy rate is a key indicator for evaluating urban sustainable development. Due to rapid urbanization, population outflow and insufficient industrial support, the housing vacancy problem is particularly prominent in China’s underdeveloped regions. However, the lack of official data and the limitations of traditional survey methods restrict in-depth research. This study proposes a vacancy rate estimation method based on Baidu Street View residential exterior images and deep learning technology. Taking Nanning, Guangxi as a case study, an automatic discrimination model for residential vacancy status is constructed by identifying visual clues such as window occlusion, balcony debris accumulation, and facade maintenance status. The study first uses Baidu Street View API to collect images of residential communities in Nanning. After manual annotation and field verification, a labeled dataset is constructed. A pre-trained deep learning model (ResNet50) is applied to estimate the vacancy rate of the community after fine-tuning with labeled street view images of Nanning’s residential communities. GIS spatial analysis is combined to reveal the spatial distribution pattern and influencing factors of the vacancy rate. The results show that street view images can effectively capture vacancy characteristics that are difficult to identify with traditional remote sensing and indirect indicators, providing a refined data source and method innovation for housing vacancy research in underdeveloped regions. The study further found that the residential vacancy rate in Nanning showed significant spatial differentiation, and the vacancy driving mechanism in the old urban area and the emerging area was significantly different. This study expands the application boundaries of computer vision in urban research and fills the research gap on vacancy issues in underdeveloped areas. Its results can provide a scientific basis for the government to optimize housing planning, developers to make rational investments, and residents to make housing purchase decisions, thus helping to improve urban sustainable development and governance capabilities.

1. Introduction

The housing vacancy rate is one of the key indicators for measuring the health of the urban real estate market and assessing the sustainability of urban development. High housing vacancy not only means a huge waste of social resources such as land, capital, and labor, but may also lead to an imbalance in the urban spatial structure, a decline in community vitality, and even cause financial risks and social problems [1]. Especially in China, with the rapid urbanization process in the past few decades, the housing supply has surged, while factors such as changes in population structure, unbalanced regional development and speculative housing purchases have jointly given rise to housing vacancy problems in some cities, especially in third- and fourth-tier cities and underdeveloped regions [2].

1.1. Research Background

The unique development trajectory of China’s housing market has made housing vacancy a complex and multi-dimensional socio-economic phenomenon. On the one hand, since the housing commercialization reform in the late 1990s, real estate investment has become an important engine of economic growth. Local governments’ reliance on land finance has led to an oversupply of land and a housing construction scale that far exceeds actual demand [3]. On the other hand, factors such as population aging, regional population loss, industrial structure adjustment, and the household registration system have jointly exacerbated the structural surplus of housing in some cities [4]. These problems are particularly prominent in economically underdeveloped areas, which often face the dilemma of population outflow and insufficient industrial support, resulting in a large number of newly built houses being difficult to effectively absorb, forming “ghost towns” or “empty cities” phenomena [5].
However, the lack of official public housing vacancy data in China and the high privacy of personal housing information, poses a huge challenge to in-depth research and accurate assessment of housing vacancy conditions [6].

1.2. Research Status

Traditional housing vacancy rate survey methods, such as household questionnaire surveys and field censuses, have high data accuracy, but are time-consuming, labor-intensive, and costly, making them difficult to promote in large-scale or high-frequency applications [6]. In the absence of official data support, it is particularly urgent to develop an efficient, low-cost, and scalable vacancy rate estimation method.
In order to overcome the limitations of traditional survey methods, domestic and foreign scholars have conducted extensive explorations in estimating housing vacancy rates. Some scholars have adopted an estimation method based on indirect indicators, inferring vacancy conditions by using indirect data closely related to housing usage. For example, utility data such as electricity, water, and gas are widely used to identify housing vacancies. By setting a threshold, residences that are below a certain usage or have been unused for a long time are judged to be vacant [7]. This method has temporal continuity and it is relatively easy to obtain data, but it has limitations such as strong subjectivity in threshold setting, mixing of commercial and residential electricity consumption, and some vacant houses still having a small amount of electricity consumption [8].
With the development of mobile Internet and geographic information technology, big data sources such as mobile phone signaling data, social media check-in data, and shared bicycle usage data have also been used to infer urban population distribution and housing usage conditions [9,10]. These data have the advantages of high spatiotemporal resolution and large-scale coverage, but they are often difficult to directly reflect the vacancy status of individual residential units. They are more often used for macro-level population mobility and regional vitality analysis, and involve data privacy and access barriers [8].
Remote sensing technology is widely used in housing vacancy research due to its macroscopic perspective and convenience of data acquisition. Night light data such as DMSP/OLS, NPP-VIIRS, and Luojia-1 are often used to identify the match between the expansion of urban built-up areas and population distribution. Low-brightness areas may indicate vacant houses or underdeveloped areas [11,12]. However, the resolution of nighttime light data is low, making it difficult to identify the vacancy of individual residential units, and it is easily interfered by non-residential factors such as urban lighting facilities and commercial activities [13]. High-resolution satellite images such as GF series, Sentinel-2, and Planet Labs can be used to identify macro-indicators such as building density, green coverage, and road maintenance status. Combined with information such as land development progress and building completion time, large-scale vacant areas can be indirectly determined [14,15]. Although this type of method provides more detailed ground information, it is still difficult to directly determine the vacancy of a single building or a single unit, and image interpretation relies on complex feature extraction and expert knowledge [16].

1.3. Research Purpose and Significance

In recent years, with the popularization of street view image data and the rapid development of deep learning technology, the use of street view images for urban phenomenon recognition has become an emerging research hotspot. Street view images are widely used to evaluate subjective perception indicators such as the livability, safety, and aesthetics of urban streets [17,18]. Street view images can also capture detailed visual features such as building facades, windows, porches, and vegetation, which are closely related to phenomena such as urban decay and declining community vitality [19,20]. By analyzing visual clues such as broken windows, piles of debris in front of the door, full mailboxes, peeling exterior walls, and signs of long-term uninhabitation, the vacancy status of the house can be indirectly judged [21]. These visual clues are closely related to daily living habits: For example, ‘curtain absence’ usually indicates a lack of long-term occupancy, because residents tend to install curtains to block light and protect privacy in daily life; ‘balcony clutter’ (such as accumulated debris, overgrown weeds) reflects neglect of the space, which is more common in houses that have been uninhabited for a long time—occupied houses usually keep balconies tidy for drying clothes or daily activities. Compared with visual indicators used in other similar studies, this study also adds ‘awning coverage without drying’ as a supplementary criterion for Nanning’s subtropical climate. Since local residents often use fixed awnings to avoid sun exposure, awnings that are always closed without any drying traces are more likely to correspond to vacant houses, which is different from regions with less use of awnings. This study believes that residential exterior images contain rich vacancy information. For example, houses that have been uninhabited for a long time may have obstructed windows, rental and sale information posted, debris piled up on the balcony, weeds in front of the door, full mailboxes, obvious damage or graffiti on the exterior walls, and no lights at night. These are details that are difficult to capture with traditional remote sensing images and indirect indicators. Baidu Street View, as the most extensive and frequently updated data source of street view images in China, provides convenient conditions for obtaining a large number of residential exterior images [22]. Combining computer vision and deep learning technology, it is possible to automatically identify these visual clues and judge the vacancy status. Although some studies have begun to use street view images to identify macro phenomena such as urban decay, few studies have directly applied street view images to estimate vacancy rates at the residential exterior level, especially for the housing vacancy problem in underdeveloped areas of China.
As an important provincial capital city in southwest China, Nanning has experienced rapid urban expansion in recent years. However, it is also facing challenges such as relatively lagging regional economic development and limited net population inflow, which makes its housing vacancy situation typical and representative, providing an ideal case city for this study [23]. Given the above research background, the limitations of existing methods and the potential of street view images, this study aims to propose a method for estimating residential vacancy rates in underdeveloped areas of China based on Baidu Street View residential exterior images, and conducts an empirical analysis using Nanning, Guangxi as an example. The specific research contents include:
  • Residential exterior vacancy feature recognition—explore and define visual cues related to vacancy in residential exterior images, such as blocked windows, clutter on balconies, weeds in front of doors, mailbox status, and facade maintenance status.
  • Street view image data collection and preprocessing: Use Baidu Street View API to obtain street view images of residential areas in Nanning, and perform preprocessing such as screening, deduplication, and geocoding to ensure data quality.
  • Annotation of vacant residential image samples and construction of dataset: Through manual interpretation and field verification, the acquired street view images are annotated with vacant/non-vacant labels to construct an annotated dataset for deep learning model training.
  • Construction and training of vacancy rate identification model.
  • Residential vacancy rate estimation and spatial analysis: The trained model is applied to street view images of residential communities in Nanning to estimate residential vacancy rates at the community level.
In our study, community specifically refers to a residential complex with clear spatial boundaries (e.g., enclosed by walls or roads), consisting of multiple residential buildings, and equipped with basic public facilities such as property management offices, green spaces, and parking lots. It is defined as the basic analysis unit here because it matches the coverage of Baidu Street View images (which can capture the overall appearance of the residential complex) and is consistent with the spatial scale of urban residential management and planning.
On this basis, the spatial analysis method of geographic information system (GIS) is used to reveal the spatial distribution pattern and aggregation characteristics of residential vacancy in Nanning Preliminary discussion on factors affecting vacancy rate: Combining urban socio-economic, planning, transportation and other data, the main factors affecting the spatial distribution of residential vacancy rate in Nanning are preliminarily discussed.

2. Overview of the Study Area

2.1. Geographical Location and Administrative Divisions

Nanning is located in southern China (Figure 1). It is the capital of Guangxi Zhuang Autonomous Region and the core city of the Beibu Gulf Economic Zone. The Tropic of Cancer passes through the city. It has a subtropical monsoon climate, with an average annual precipitation of 1300–2000 mm and 20 days per year with a high temperature of ≥35 °C [24]. As a frontier hub for China’s open cooperation with ASEAN and an important node city of the Belt and Road Initiative, Nanning has 12 urban districts (including Hengzhou City) under its jurisdiction, with a total area of 22,100 square kilometers. Its permanent population exceeded 8 million in 2022, and its urbanization rate was 70.6% [25,26]. According to the Nanning Urban Master Plan (2021–2035), the urban spatial structure presents a dual-core linkage pattern of “old city core + five sub-centers”, forming a multi-center development trend of “one main and four sub-centers”.
This study is based on the main urban area of Nanning, covering Xixiangtang District, Xingning District, Qingxiu District, Jiangnan District, Liangqing District, Wuming District, Yongning District, Hengzhou City, Longan County, Mashan County, Shanglin County and part of Binyang County (Figure 1). To improve readability and generalize the research framework, these territorial units are depersonalized with unified symbols in subsequent sections:
Traditional Built-up Areas (TBA): Xixiangtang District, Xingning District;
Emerging Development Areas (EDA): Liangqing District, Jiangnan District;
Remote Suburban Counties (RSC): Mashan County, Hengzhou City, and other suburban counties.
Specific place names are replaced by these symbols to avoid confusion for readers unfamiliar with Nanning’s geography. Among them, Xixiangtang District is a traditional education and cultural center, Xingning District is a core area of commerce and logistics, Liangqing District is positioned as an administrative and business center, Jiangnan District is dominated by industrial manufacturing, and Hengzhou City is a county-level economic growth pole. The development stages and functional positioning of each region are significantly different: Xixiangtang District and Xingning District are old urban areas, mainly old residential areas built before 2000; Liangqing District and Jiangnan District are new urban expansion areas, with concentrated layouts of newly built commercial housing after 2010; Mashan County and Hengzhou City are remote suburban counties, mainly resettlement housing and county-level commercial housing.

2.2. Overview of Residential Areas

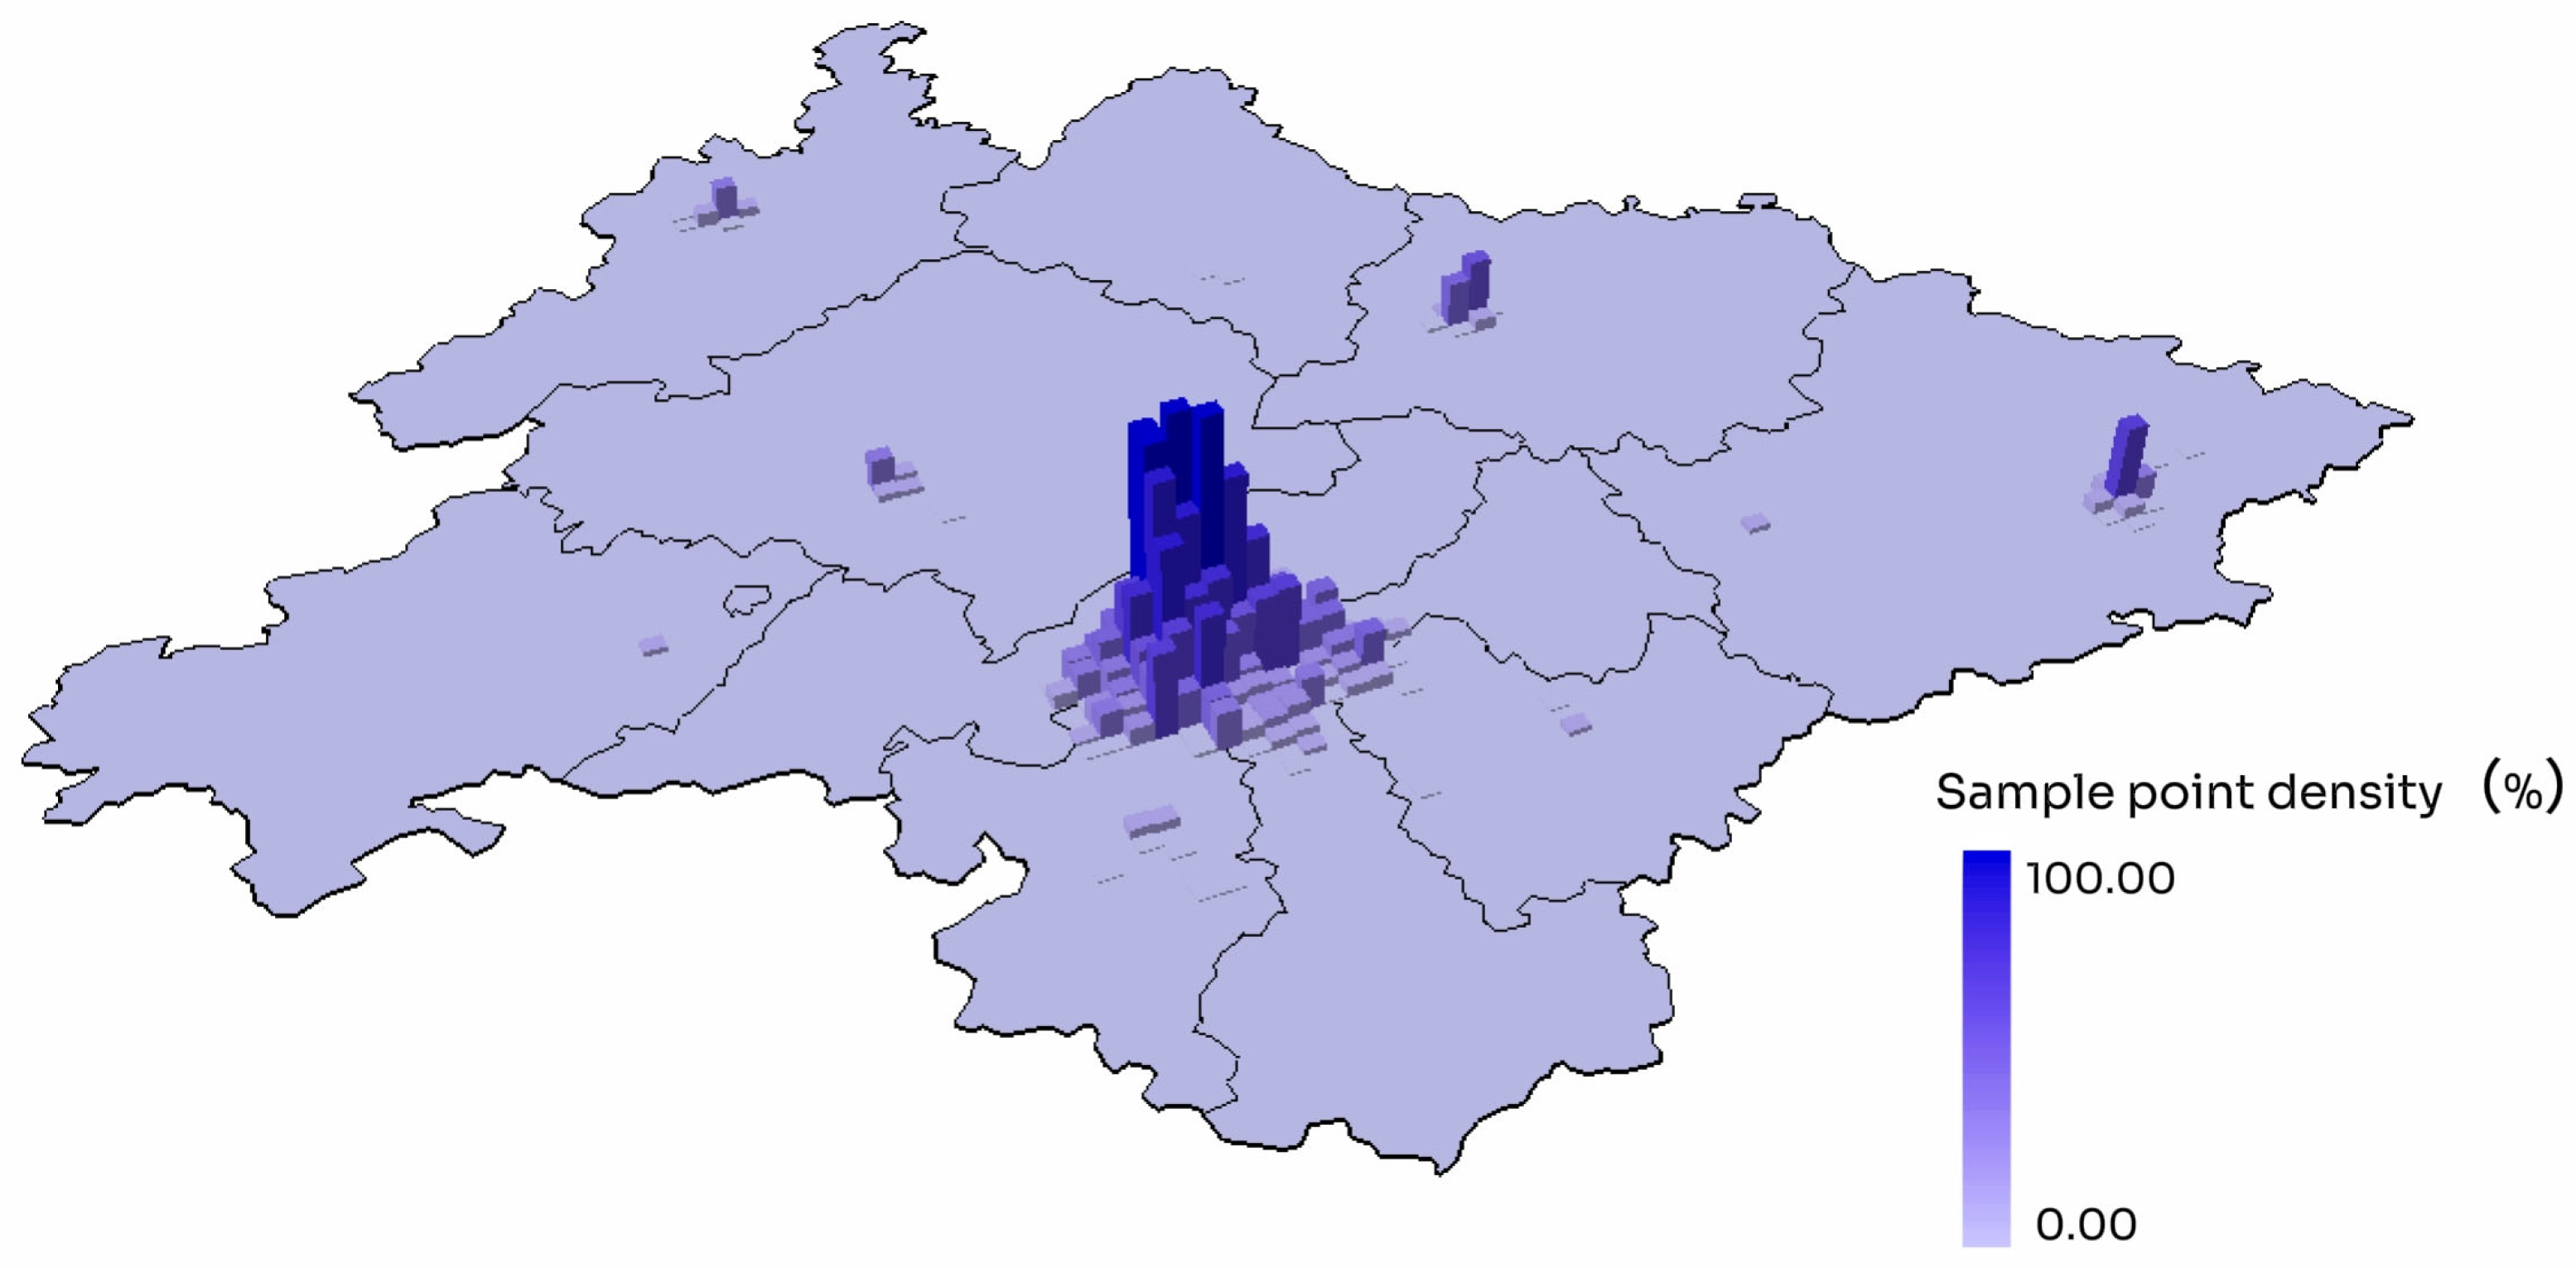
This study is based on Baidu Maps 2023 street view data and field surveys. The sample presents the following characteristics (Figure 2):
  • Administrative district distribution and vacancy characteristics:
Traditional Built-up Areas (TBA): 1194 communities in total, accounting for about 36.8% (the largest share).
Emerging Development Areas (EDA): 715 communities in total, accounting for about 22.0%.
Remote Suburban Counties (RSC): 136 communities in total, accounting for about 4.2%.
2.
Construction Year and Building Type:
Time dimension: The sample covers 1990–2023. The 1990–2000 period (old city renovation period) accounted for 38.7%, mainly unit housing and resettlement housing; 2001–2010 (new district expansion stage) accounted for 29.2%, and commercial housing accounted for 65%; 2011–2023 (urban renewal period) accounted for 32.1%, and improved housing accounted for 42%, reflecting the transformation of Nanning’s housing market from “quantity” to “quality”.
Building type: Commercial housing accounts for 68.2%, including just-in-time (60–90 m2, accounting for 45%), improvement (90–144 m2, 38%) and high-end (>144 m2, 17%) products; resettlement housing accounts for 15.7%, concentrated in Xixiangtang District and Xingning District; unit housing accounts for 10.3%, mostly around the government offices in Qingxiu District; self-built houses in urban villages account for 5.8%, mainly in the Donggouling area of Xingning District.
3.
Data representativeness and limitations:
Representativeness: The samples cover the multi-center structure of “one main and four secondary” in Nanning. The sample ratio of the old urban area (Xixiangtang District and Xingning District) to the new urban area (Liangqing District and Jiangnan District) is about 1.62:1. The remote suburban counties (Mashan County, Hengzhou City, etc.) and the main urban area are distributed in a gradient, taking into account different regional types. The span of construction years can reflect the urbanization process [27].
Limitations: The sample size of remote suburban counties is small (e.g., there are only 41 communities in Mashan County), which may underestimate the vacancy characteristics of the urban-rural transition zone; high-rise residential buildings are blocked by awnings and anti-theft nets, which affects the accuracy of vacancy determination (the error rate is about ±3%).

2.3. Spatial Distribution Characteristics

Nanning’s residential quarters present a spatial pattern of “single-core agglomeration in the old city and multi-center diffusion in the new district”, which is highly consistent with the city’s “one main and four secondary” multi-center development plan (Figure 2).
The core agglomeration area of the old city (Xixiangtang District and Xingning District): concentrated in the entire Xixiangtang District and the core area of Xingning District, mainly composed of unit houses and resettlement houses built between 1990 and 2000 (accounting for 38.7%). With the advantages of “early development time, large community stock, full building types, and high functional complexity”, the old city has become the area with the largest sample size and the richest types in the study of residential vacancy rate. Its data can effectively support the in-depth analysis of the historical evolution, structural differences and policy impact of the urban housing market [28].
Emerging residential areas (Liangqing District, Jiangnan District): Distributed in Wuxiang New District, Liangqing District, and Shajing Block, Jiangnan District, mainly commercial housing built after 2011 (accounting for 32.1%). The formation of new areas is the result of the joint action of policy guidance, transportation upgrades, land development and market demand, reflecting the typical logic of “spatial expansion–supporting follow-up–population agglomeration” in the urbanization process of Nanning City, but the planning is ahead of the industry and population introduction, forming a structural contradiction of “concentrated spatial supply but slow demand release”.
Remote suburban counties (Mashan County, Hengzhou City): They are located along transportation arteries or administrative centers, with small and scattered scales. Policy drivers (such as shantytown renovation) and quality housing (such as riverside commercial housing) work together, but factors such as weak economic foundations and population outflows have led to fewer optional sample points.
Impact of multi-center urban structure: Work-residence separation effect: The old urban area (such as Xixiangtang District) is a traditional employment center, and housing is mainly in old residential areas. The emerging areas (such as Liangqing District) have insufficient industrial supporting facilities, resulting in a work-residence separation phenomenon of “employment in the old city and living in the new area”. Transport corridor effect: The number of residential buildings along Metro Line 4 (such as Wuxiang New District) has increased, indicating that improved transportation can affect the number of residential buildings, but industrial layout needs to be promoted simultaneously to release demand potential [29,30].

3. Research Methods

3.1. Vacancy Determination Criteria

Based on Baidu Street View images and field surveys, this study constructs a housing vacancy determination system suitable for Nanning. Combining the subtropical climate characteristics and multi-center urban structure, the following innovative standards are proposed:
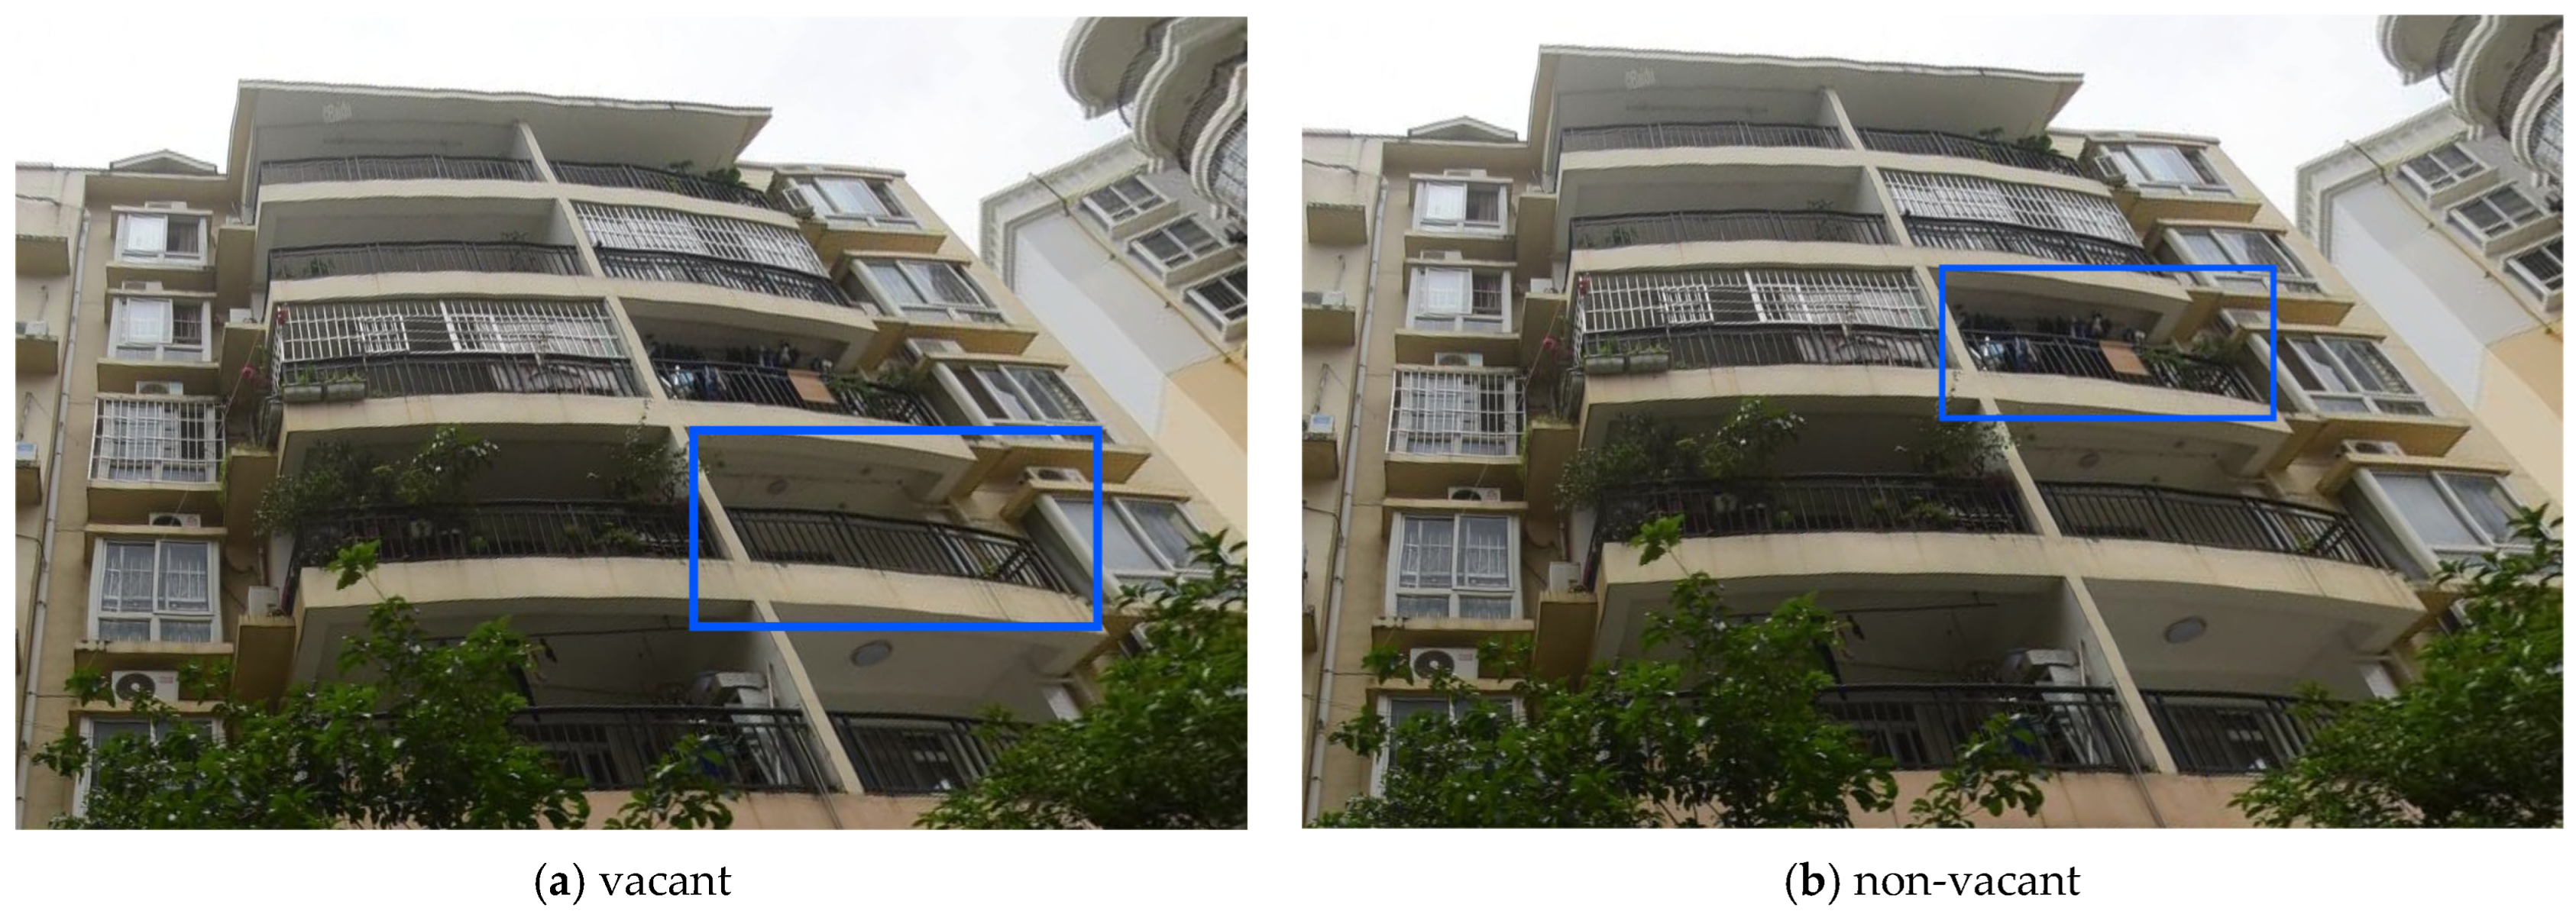
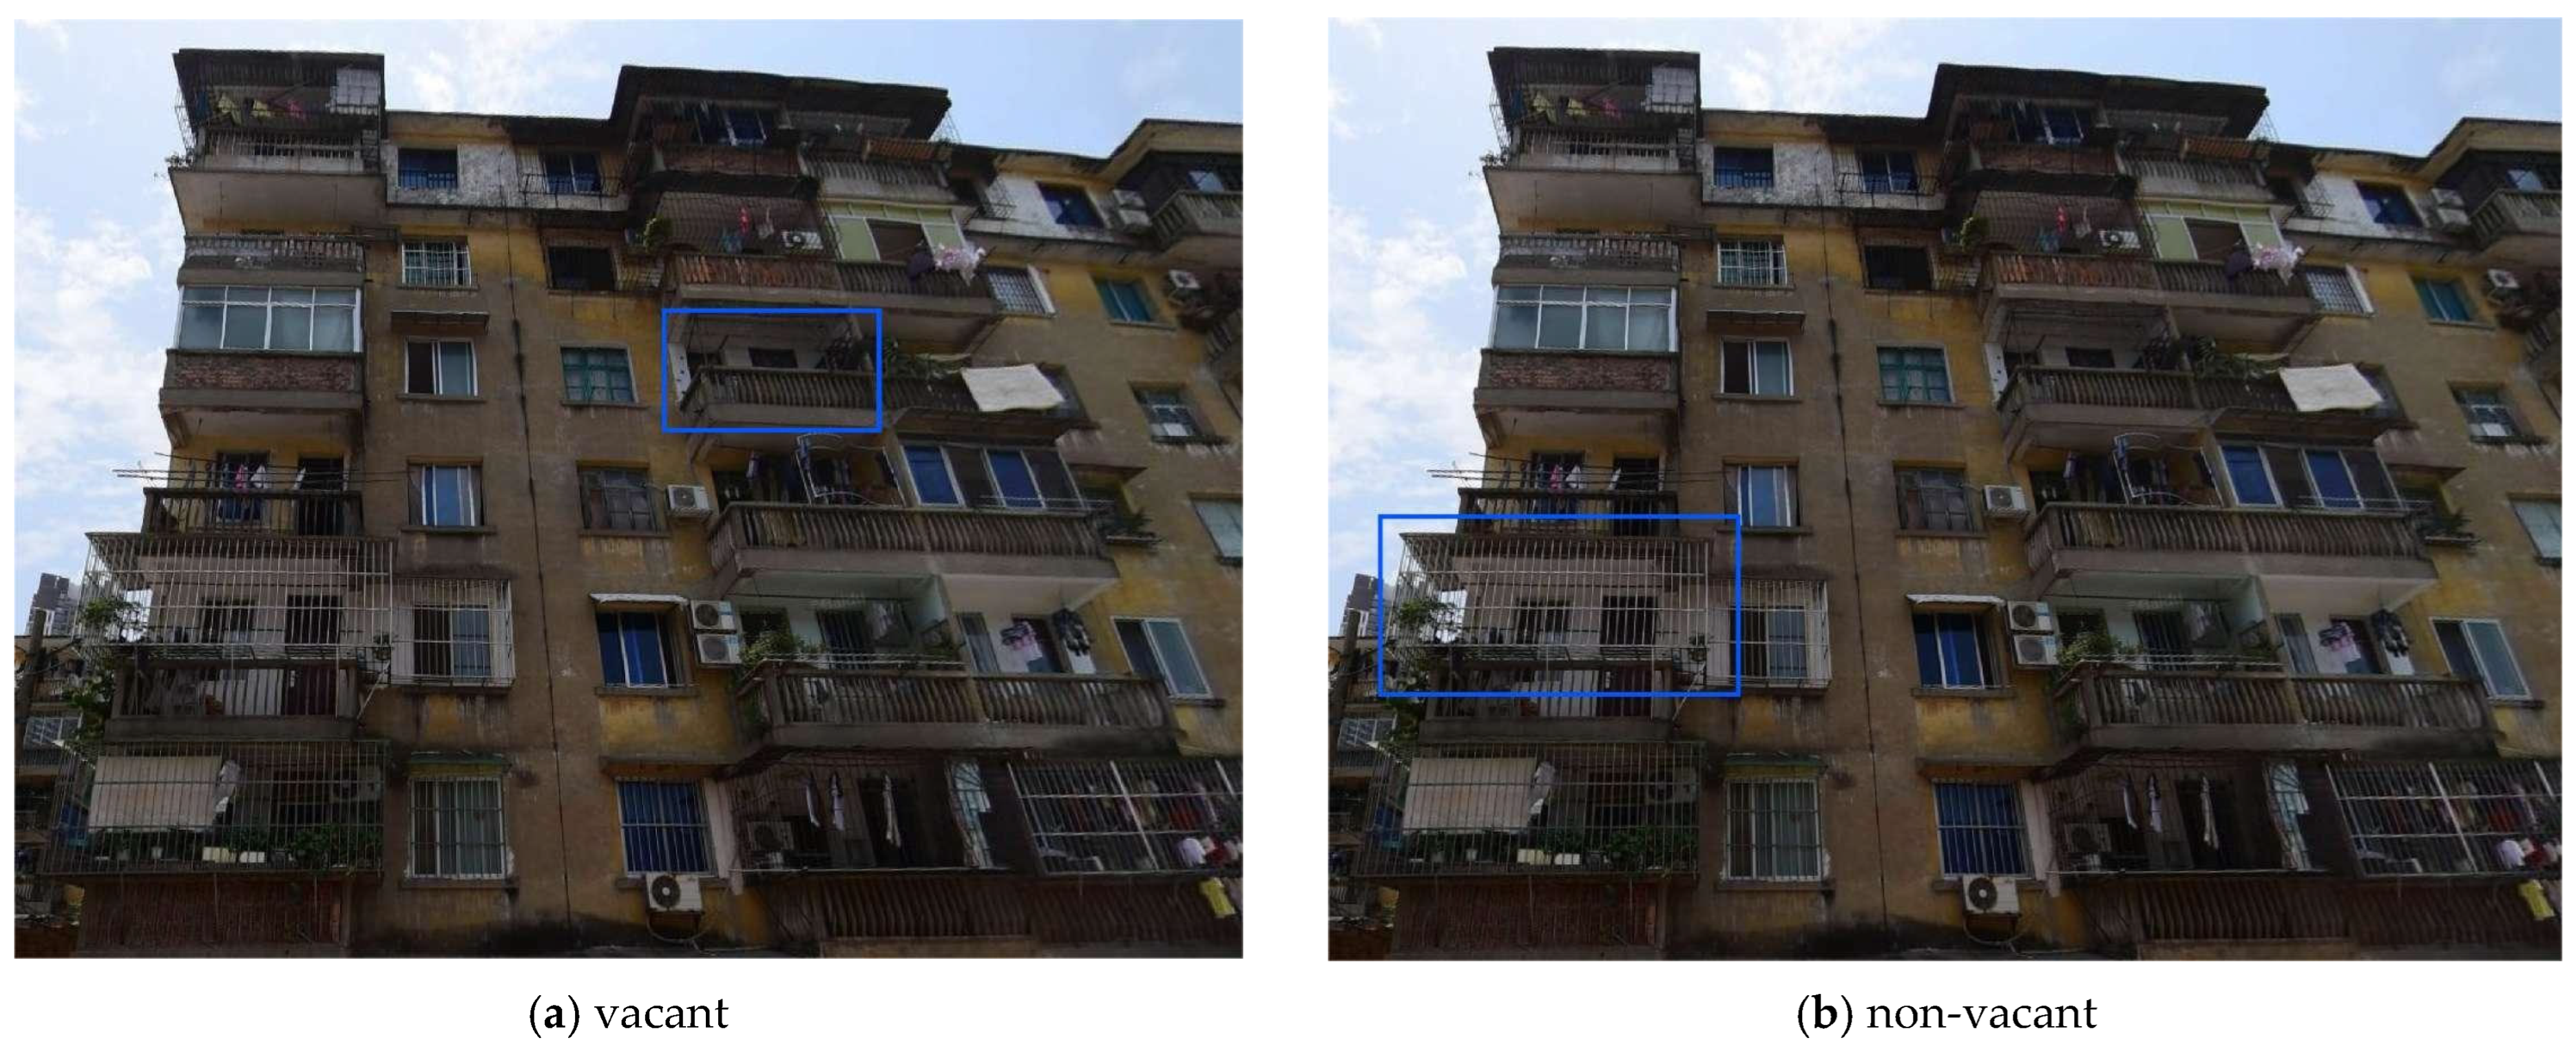
Basic standards: Through manual interpretation of street view images, the total number of units and the number of vacant units in each building are counted floor by floor. The basis for determining vacancy is: No drying on the balcony: No signs of drying clothes, bedding, etc., for three consecutive months (in Nanning’s high temperature and high humidity climate, awnings covered but no drying are still considered vacant). Visualized examples are shown in Figure 3a (vacant: balcony with no drying traces for 3 months) and Figure 3b (non-vacant: balcony with regular clothes drying). Our vacancy determination focuses exclusively on exterior features of balconies, the most observable part of residential exteriors in street view images, rather than indoor conditions. We do not attempt to determine indoor illumination because it is irrelevant to our criteria. We also do not observe objects or their movement on window sills as they are not part of our judgment system. Instead, we identify occupancy through stable balcony activity traces. Occupied residences typically show regular drying of clothes or bedding or maintained balcony spaces with no long-term debris. Vacant residences lack such traces. These features are clearly distinguishable in street view images with 2048 × 1536 pixels even for upper floors within 30 m of the shooting point.
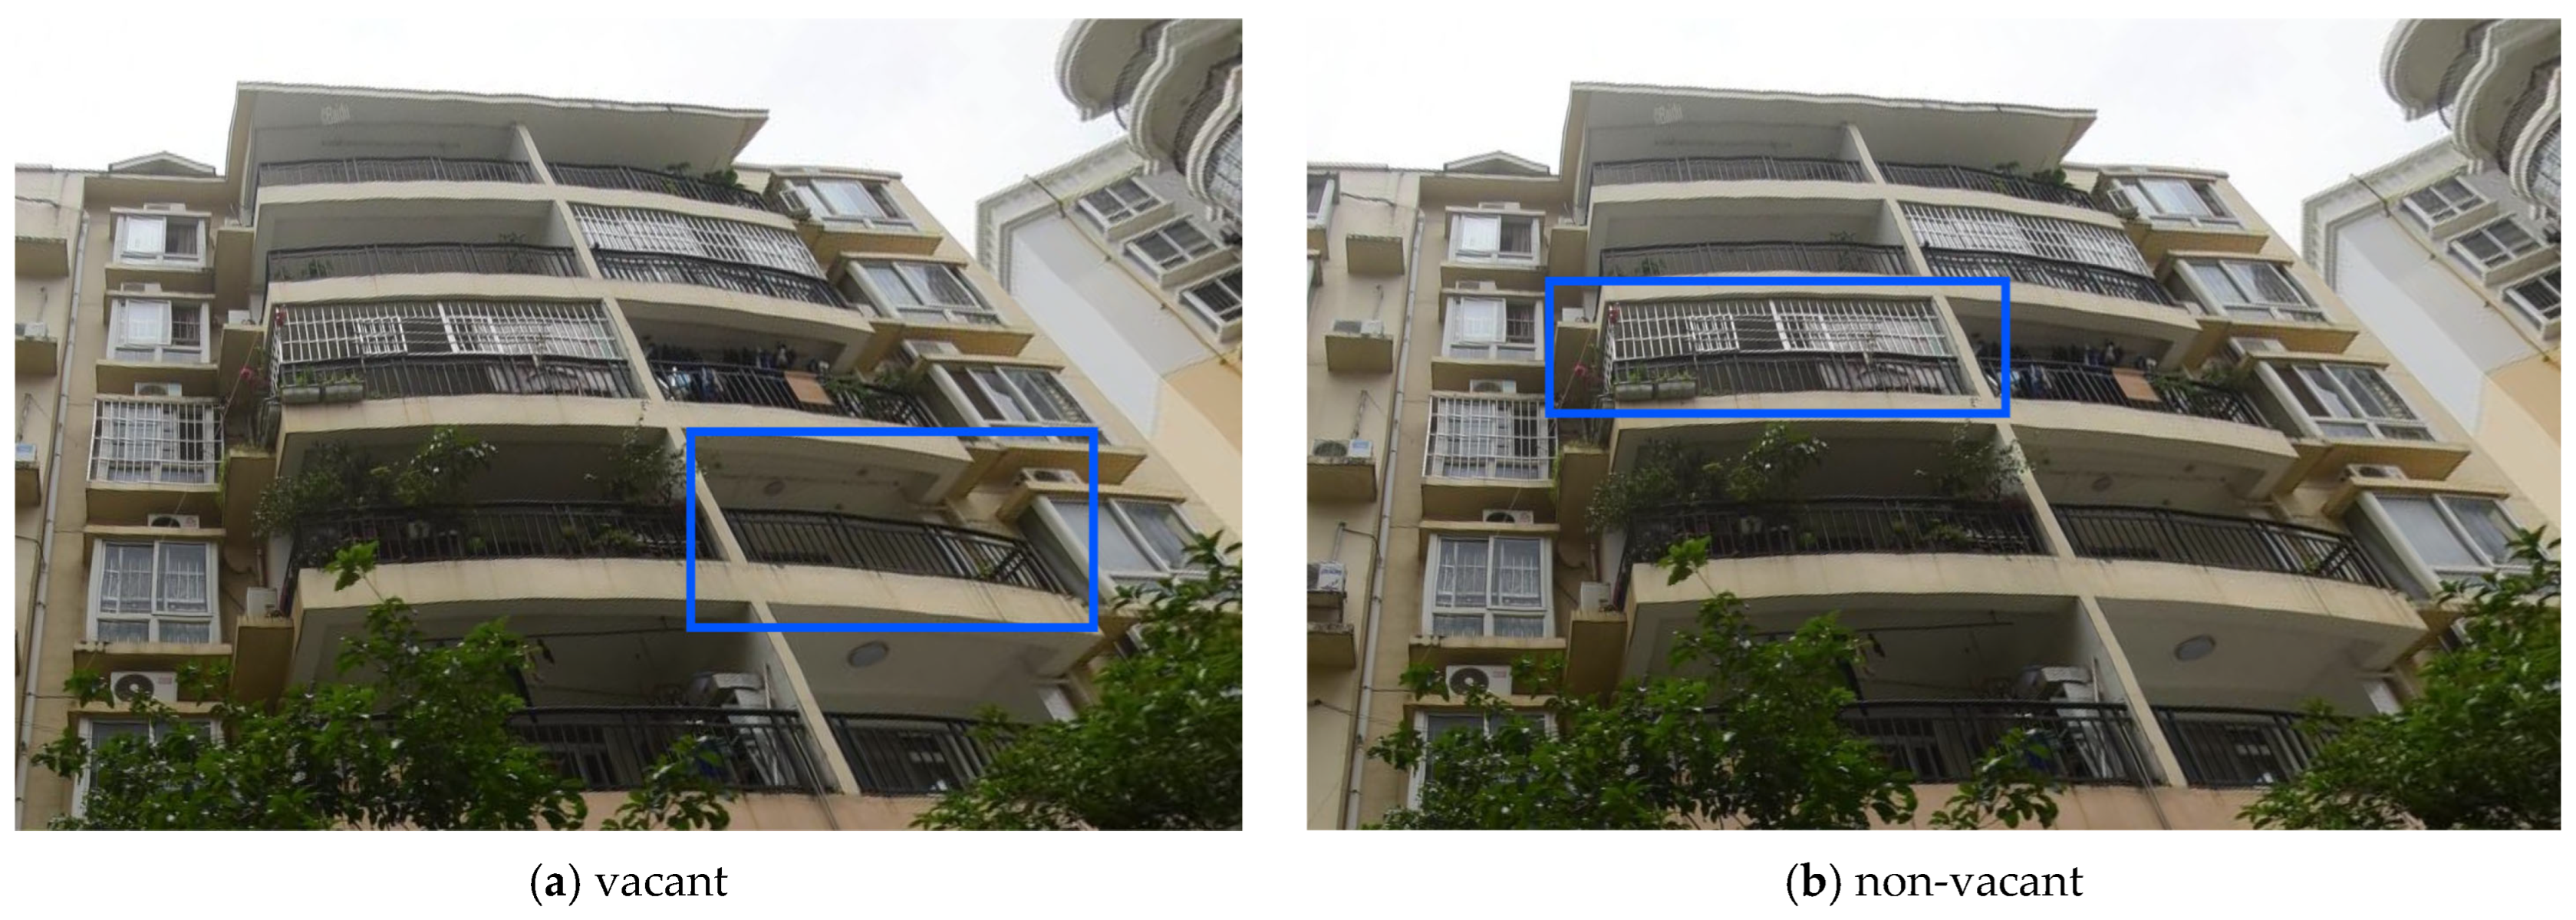
Windows are sealed: All visible windows are closed, and there are no curtains, furniture, or other signs of living. As shown in Figure 4a (vacant: sealed windows with no curtains or indoor furniture) and Figure 4b (non-vacant: windows with curtains and visible indoor items), the presence of curtains and open windows is a typical sign of occupancy.
Among these features, ‘no curtains’ is a key clue: In daily life, nearly all occupied houses install curtains to adjust light and ensure privacy, so long-term absence of curtains suggests that the house is not used normally. Similarly, ‘balcony clutter’ (such as stacked old furniture, accumulated dust, or overgrown plants) is a reliable indicator—occupied houses need to use balconies for drying or storage, so they will be cleaned regularly, while vacant houses often accumulate clutter due to long-term neglect. These indicators are consistent with the logic that ‘living traces directly reflect occupancy status’ and are applicable to Nanning’s residential environment.
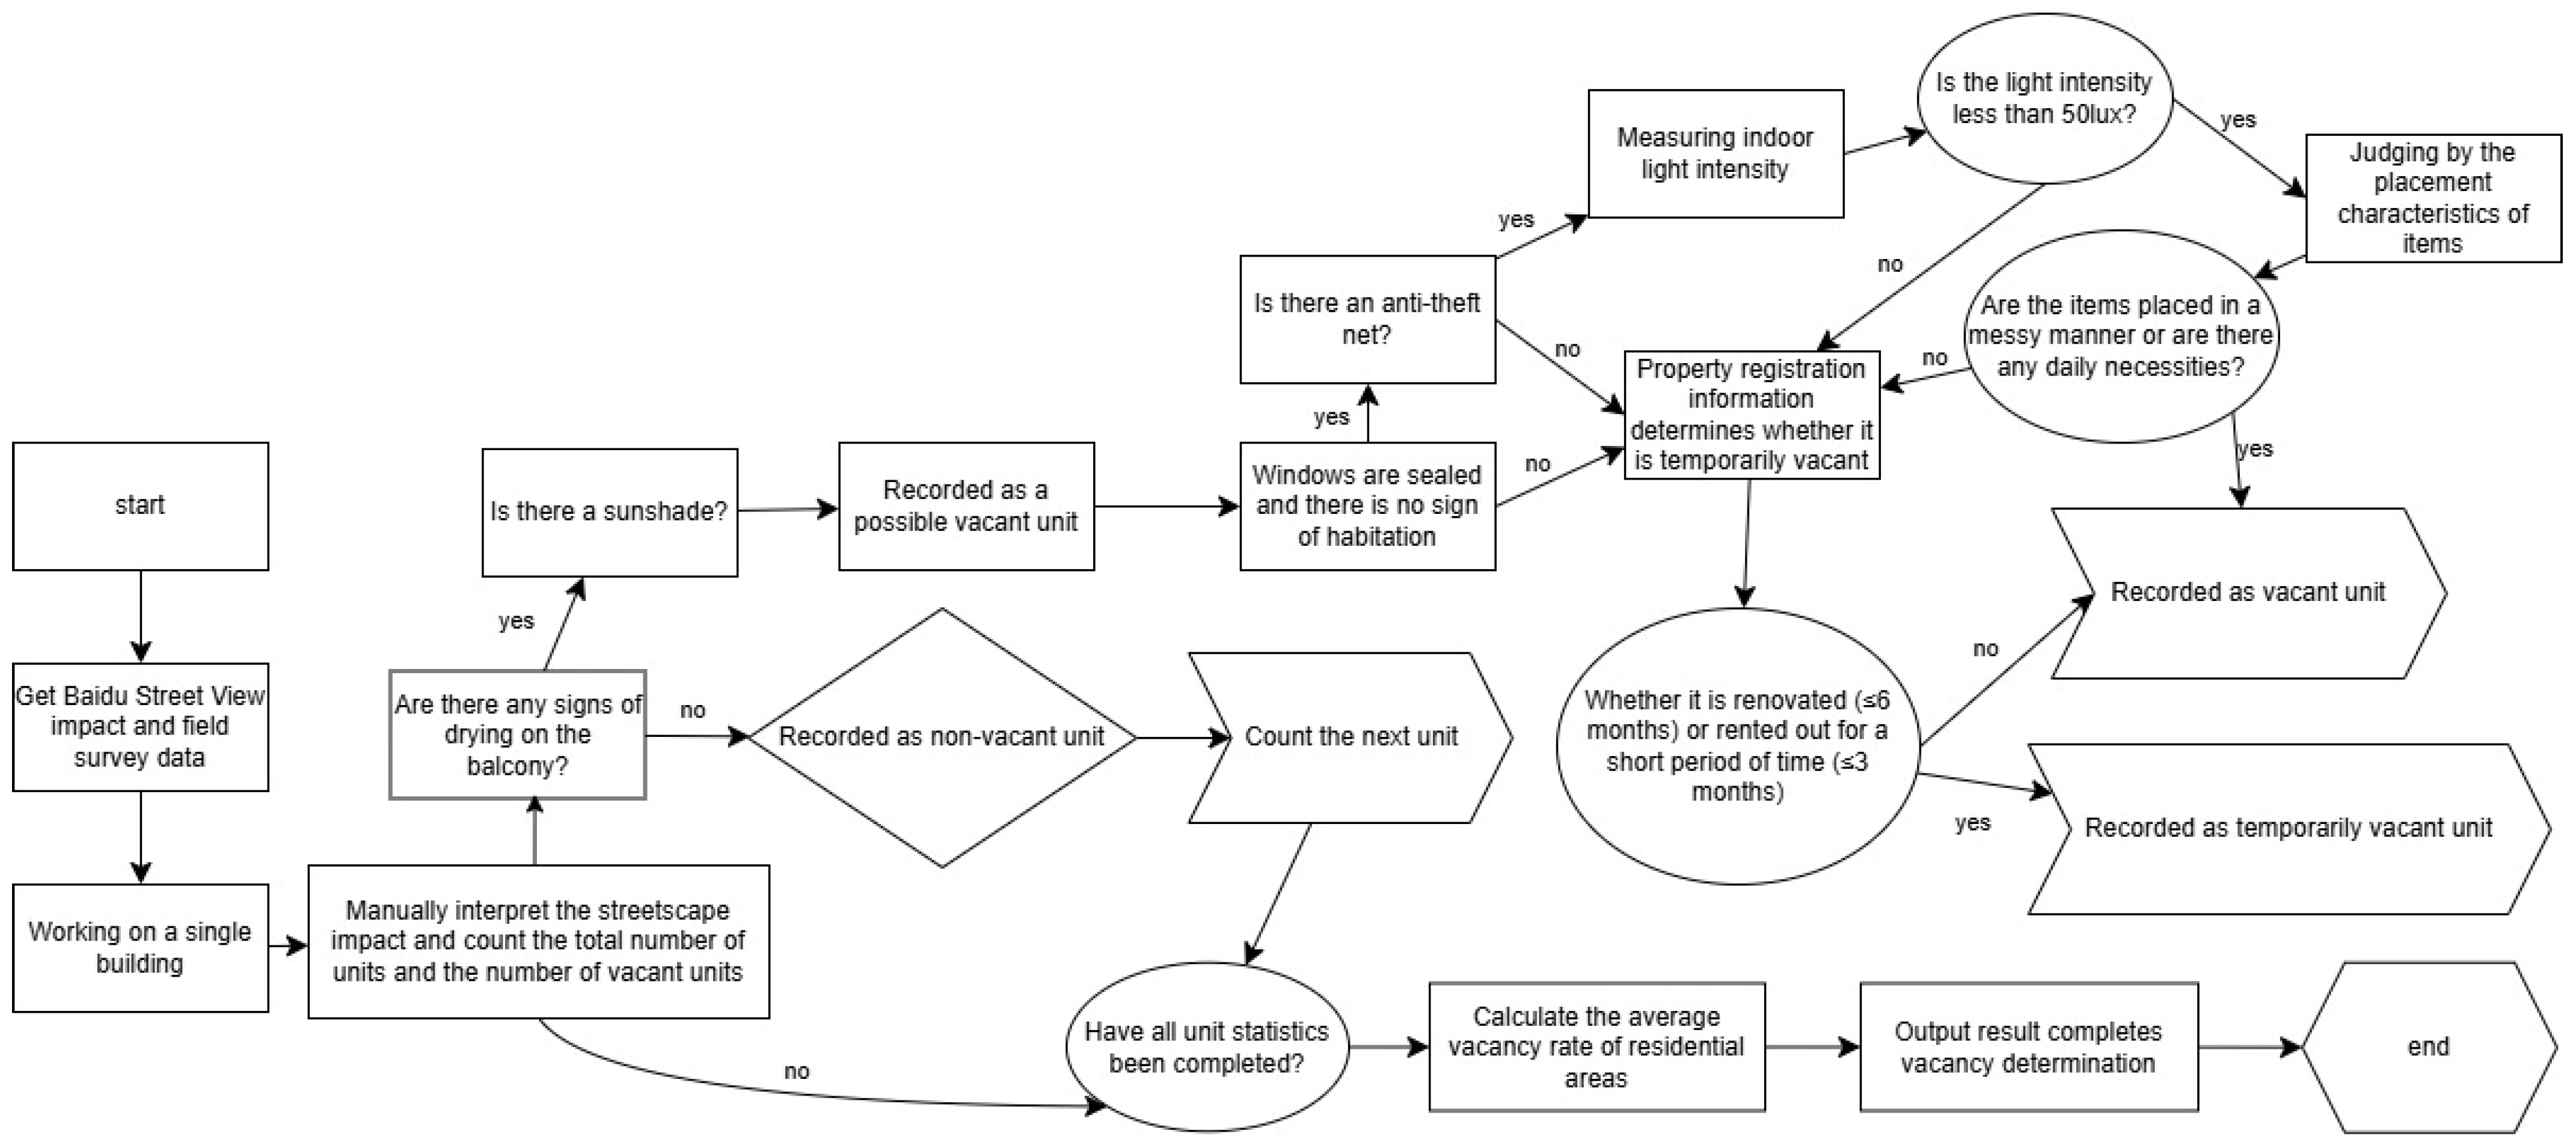
Special rules: Anti-theft net shielding: Assisted judgment by indoor light intensity (threshold set to <50 lux) and item placement characteristics. Temporary vacancy distinction: The renovation period (≤6 months) or short-term rental (≤3 months) is considered temporary vacancy and needs to be reviewed in conjunction with property registration information (Figure 5).
2.
Calculation of average vacancy rate in residential areas:
H V R i = j = 1 n V i j j = 1 n A i j × 100 %
This formula is designed to calculate the average vacancy rate at the residential community scale H V R i , which differs from the vacancy rate of a single building (calculated as the ratio of vacant units to total units in that building). It is applicable to aggregating micro-level (single building) vacancy data into meso-level (community) indicators, facilitating spatial comparison across different residential areas.
H V R i : The average vacancy rate of residential community i, ranging from 0 to 1 (or 0% to 100%), where 0 indicates no vacant units and 1 indicates all units are vacant.
V i j : The number of vacant units in the j-th single building within community i. A unit is defined as “vacant” based on the criteria in paragraph above (e.g., no balcony drying for 3 consecutive months, sealed windows without signs of habitation).
A i j : The total number of residential units in the j-th single building within community i, including all usable units (excluding non-residential units such as ground-floor commercial spaces).
n: The total number of single buildings sampled in community i, with a sampling ratio of ≥80% of the total buildings in the community to ensure representativeness.
3.
Manual interpretation process and quality control:
Interpretation team formation: A 5-member professional interpretation team was formed, and a double-blind test was conducted after unified training. The intra-group consistency coefficient ICC = 0.92. Our 5-member team did not manually examine every window of every building. They focused on key exterior features defined in the vacancy criteria such as balcony drying traces and awning status. For each community, at least 80% of buildings were sampled. For each sampled building, priority was given to observing typical floors from the 1st to the 10th, which account for 85% of observations. This sampling approach balances representativeness and efficiency. Manual reviews targeted these key features rather than all windows with cross verification and expert review ensuring accuracy.
Specifically, the double-blind test was conducted as follows: (1) 200 randomly selected street view images (covering different building types and regions) were assigned to all 5 team members without disclosing the image sources or other annotators’ results; (2) Each member independently labeled the vacancy status of the images (vacant/non-vacant) based on the unified criteria (e.g., balcony drying and window status); (3) After all annotations were completed, the consistency of results was calculated using the intra-class correlation coefficient (ICC). The ICC value of 0.92 indicates excellent consistency among annotators (ICC > 0.75 is generally considered acceptable for professional teams), confirming the reliability of manual interpretation.
Three-level review mechanism: Preliminary judgment: the reader independently completes the vacancy determination of a single building; Cross-verification: 20% of the samples are randomly selected for cross-verification, and the difference rate is controlled within ±5%; Expert final review: For controversial samples (such as commercial and residential mixed use), the expert team will make the final decision based on field investigations. To confirm the reliability of balcony-based judgment, we conducted additional verification. First, field surveys of 300 communities showed 94% consistency between balcony activity traces observed in street view images and actual occupancy verified by property records. Second, for upper-floor balconies, 85% of samples were captured within 30 m, so their features such as drying traces and debris were clearly visible. Ambiguous cases accounting for 15% were excluded to avoid errors. This ensures our markup error rate is within ±3% and supports the reliability of results based on balcony exterior features.
Manual data markup aims to provide labeled samples for training the deep learning model. Each marked sample is labeled as vacant or non-vacant based on balcony and window features. These labeled samples are divided into training and validation sets to optimize the model’s judgment logic. Specifically, 80 percent of the marked samples are used for model training and 20 percent for validation. This links manual interpretation with subsequent machine learning calculations by providing a standard dataset.
4.
Nanning Adaptive Adjustment:
Climate adaptation: In view of the fact that Nanning has an average annual precipitation of 1300–2000 mm and many high-temperature days, the judgment rule of “awning covered but not drying” is supplemented to clarify the correlation between awning type (fixed/retractable) and vacancy. Figure 6a (vacant: fixed awning always closed with no drying) and Figure 6b (non-vacant: retractable awning with occasional drying) show the distinction in awning usage between vacant and occupied houses. Architectural feature adaptation: In view of the current situation that 92% of the houses in Nanning are equipped with anti-theft nets, a two-dimensional judgment standard of “indoor light intensity + item placement” is established (Figure 5) to reduce the misjudgment rate. Multi-source data verification: Combined with night light data (NPP-VIIRS) and water and electricity consumption data, the judgment results are verified for spatial consistency to ensure that the vacancy rate error rate is ≤±3%.
5.
Comparison with Guangzhou Method:
This method was specifically proposed by Yue et al. (2022) in their study on Guangzhou, which systematically constructed a technical framework for estimating housing vacancy rates using daytime exterior images from Baidu Street View and field surveys, with core judgment criteria including traces of residence such as balcony drying and window curtain installation [16].
Similarities: Both use the basic judgment standard of “balcony drying + window status”, and the manual interpretation process is consistent with the quality control system. Differences: Nanning’s research adds climate adaptability rules such as awnings and anti-theft nets, introduces a multi-source data verification mechanism, and for the first time includes remote suburban counties in the analysis scope, expanding the scale of vacancy research in subtropical multi-center cities.

3.2. Spatial Analysis Methods

This study uses multi-dimensional spatial analysis technology and combines the characteristics of Nanning’s multi-center urban structure to reveal the spatial distribution and driving mechanism of residential vacancy rate. The specific methods are as follows:
  • Spatial Autocorrelation Analysis: Global Spatial Correlation
Calculation formula:
I = i = 1 n j = 1 n W i j ( x i x ¯ ) ( x j x ¯ ) S 2 i = 1 n j = 1 n W i j
It is used to detect the global spatial correlation of housing vacancy rate in Nanning, where x i and x j are the residential vacancy rates, W i j is the weight matrix (using the inverse distance weighting method, with the distance threshold set to 10 km), S 2 is the variance, and  x ¯ is the mean. This index, first proposed by Moran (1948) to measure spatial autocorrelation, has been widely applied in urban studies to identify clustering patterns of socioeconomic variables [31,32]. The global spatial correlation of residential vacancy rate in Nanning is detected by calculating the global Moran’s I index (range [−1, 1]).
2.
Local spatial autocorrelation analysis (Local Moran’s I and Getis-Ord Gi):
Local Moran’s I: Identifies clusters and outliers in local space. The calculation formula is:
I i = j = 1 n W i j ( x i x ¯ ) ( x j x ¯ )
Combining the Z value and p value, the correlation between the vacancy rate of each residential area and its neighborhood is determined (HH, HL, LH, LL type).
GetisOrd Gi*: Detects hot spots (high-value clusters) and cold spots (low-value clusters). The calculation formula is:
G i * = j = 1 n W i j x j j = 1 n x j
By standardizing the Z value (Z > 1.96 is a hot spot, Z < −1.96 is a cold spot), the spatial extreme value areas of the vacancy rate in Nanning City were located.
3.
Average nearest neighbor analysis:
By calculating the ratio of the observed average distance ( d i ) to the expected average distance ( d e ), the spatial distribution pattern (uniform, clustered or random) of residential areas with the same vacancy rate level can be determined.
R : R = d i d e , d e = 1 2 N A
The calculation formula is: R = d o b s d e x p .
Where N is the number of samples and A is the area of the study area. The spatial distribution pattern of residential areas with the same vacancy rate level is determined by the R value. If R = 1, it means that the spatial distribution of residential areas is random; if R < 1, it indicates that the residential areas present a clustered distribution pattern, that is, residential areas with the same vacancy rate level tend to cluster together; if R > 1, it indicates a uniform distribution pattern, and residential areas with the same vacancy rate level are relatively evenly dispersed in space.
4.
Kernel Density Analysis
Kernel density analysis is used to explore the spatial differentiation characteristics of high vacancy rate and low vacancy rate areas [33]. This study uses adaptive bandwidth kernel density estimation, which adjusts bandwidth dynamically based on local sample density to improve estimation accuracy for spatially clustered data, and its calculation formula is:
f x = 1 n h i = 1 n K x x i h
where f x is x the estimated value of the kernel density at the point; n is the number of residential areas; x i is the location of the ith residential area; h is the bandwidth, which controls the range of the kernel function. The quadratic kernel function (Epanechnikov kernel) is defined as:
K x = 3 4 1 x 2   x 1 0
where x = z h (z is the distance from the target point to the sample point, and h is the bandwidth). This function is a symmetric probability density function with compact support (effective only when | x | 1 ), which balances estimation smoothness and local sensitivity, making it suitable for identifying spatial agglomeration of vacancy rates. K x is the quadratic kernel function.
Through kernel density analysis, we can intuitively see the spatial distribution density of housing vacancy rates, thereby identifying the core areas of high vacancy rates (>0.35) and low vacancy rates (<0.15) and their diffusion range.

4. Data Processing and Analysis

4.1. Street View Data Acquisition and Data Preprocessing

This study uses Baidu Maps high-definition street view images from July to September 2023 as the core data source. This period is a special period in Nanning, such as the non-rainy season and non-Spring Festival, which effectively avoids seasonal vacancy interference [25]. Baidu Street View updates its image data regularly as a mainstream street view service in China. For key cities like Nanning, its main urban areas are updated 2–3 times a year. Core functional zones including newly developed residential areas have a shorter update cycle of 3–6 months. The 2023 images used in this study reflect the latest residential appearance before the research. They can accurately capture the 2023 vacancy status of residential areas. Housing vacancy is a relatively stable socio-economic phenomenon that rarely changes drastically in the short term. Thus, an update frequency of 2–3 times a year meets the needs of practical application. It can capture medium-term changes in vacancy. The consistency between our results and 2023 field survey data with R2 = 0.82 further confirms the relevance of the selected data for analyzing current vacancy characteristics. The data is obtained in batches through the staticimage/v2 interface of the Baidu Maps API, covering 3238 residential communities in Nanning. The proportion of the total built-up area cannot be determined. The sample size is 169.8% larger than that of the Guangzhou case, ensuring the accuracy of multi-center urban spatial analysis. The data collection parameters are set as follows:
Resolution: 2048 × 1536 pixels, to ensure that details such as the building facade, balcony and window status are clearly visible; Imaging time: 10:00–15:00 during the day, to avoid interference from shadows in the morning and evening, and to improve the recognition accuracy of signs of residence such as drying clothes; Viewing angle control: vertical viewing angle 80–90°, to reduce perspective distortion and ensure the accuracy of the judgment of balcony and window status [34].
The images contain key information such as the facades of residential buildings, traces of balcony drying, window opening and closing status, awnings, and anti-theft nets, providing an intuitive basis for vacancy determination. Compared with the Guangzhou case, the Nanning study has increased the coverage of remote suburban counties (such as Mashan County), expanded the research scale, and focused on the impact of awning coverage and anti-theft nets on vacancy determination in view of the subtropical climate characteristics, forming a localized data collection standard.
In terms of data preprocessing, this study adopted a three-level quality control process of “spatial registration-quality screening-attribute labeling” to ensure the spatial accuracy and analytical value of the data. The specific steps are as follows:
  • Spatial registration and geometric correction:
Based on the ArcGIS 10.8 platform, the street view imagery was spatially aligned with the 2023 administrative division vector layer of Nanning City, and the Gausskrüger projection (CGCS2000 coordinate system) was adopted, and geometric correction was implemented through ground control points (GCP).
In response to the registration challenges of different areas in a polycentric urban structure (such as the difference between densely packed buildings in old urban areas and open spaces in new urban areas), an adaptive registration algorithm is used to strictly control the error within ±5 m [35].
The coordinate system of night light data (NPP-VIIRS) and POI point of interest data is synchronized to ensure the spatial alignment of multi-source data, laying the foundation for subsequent fusion analysis [36,37].
2.
Image quality screening and non-residential filtering:
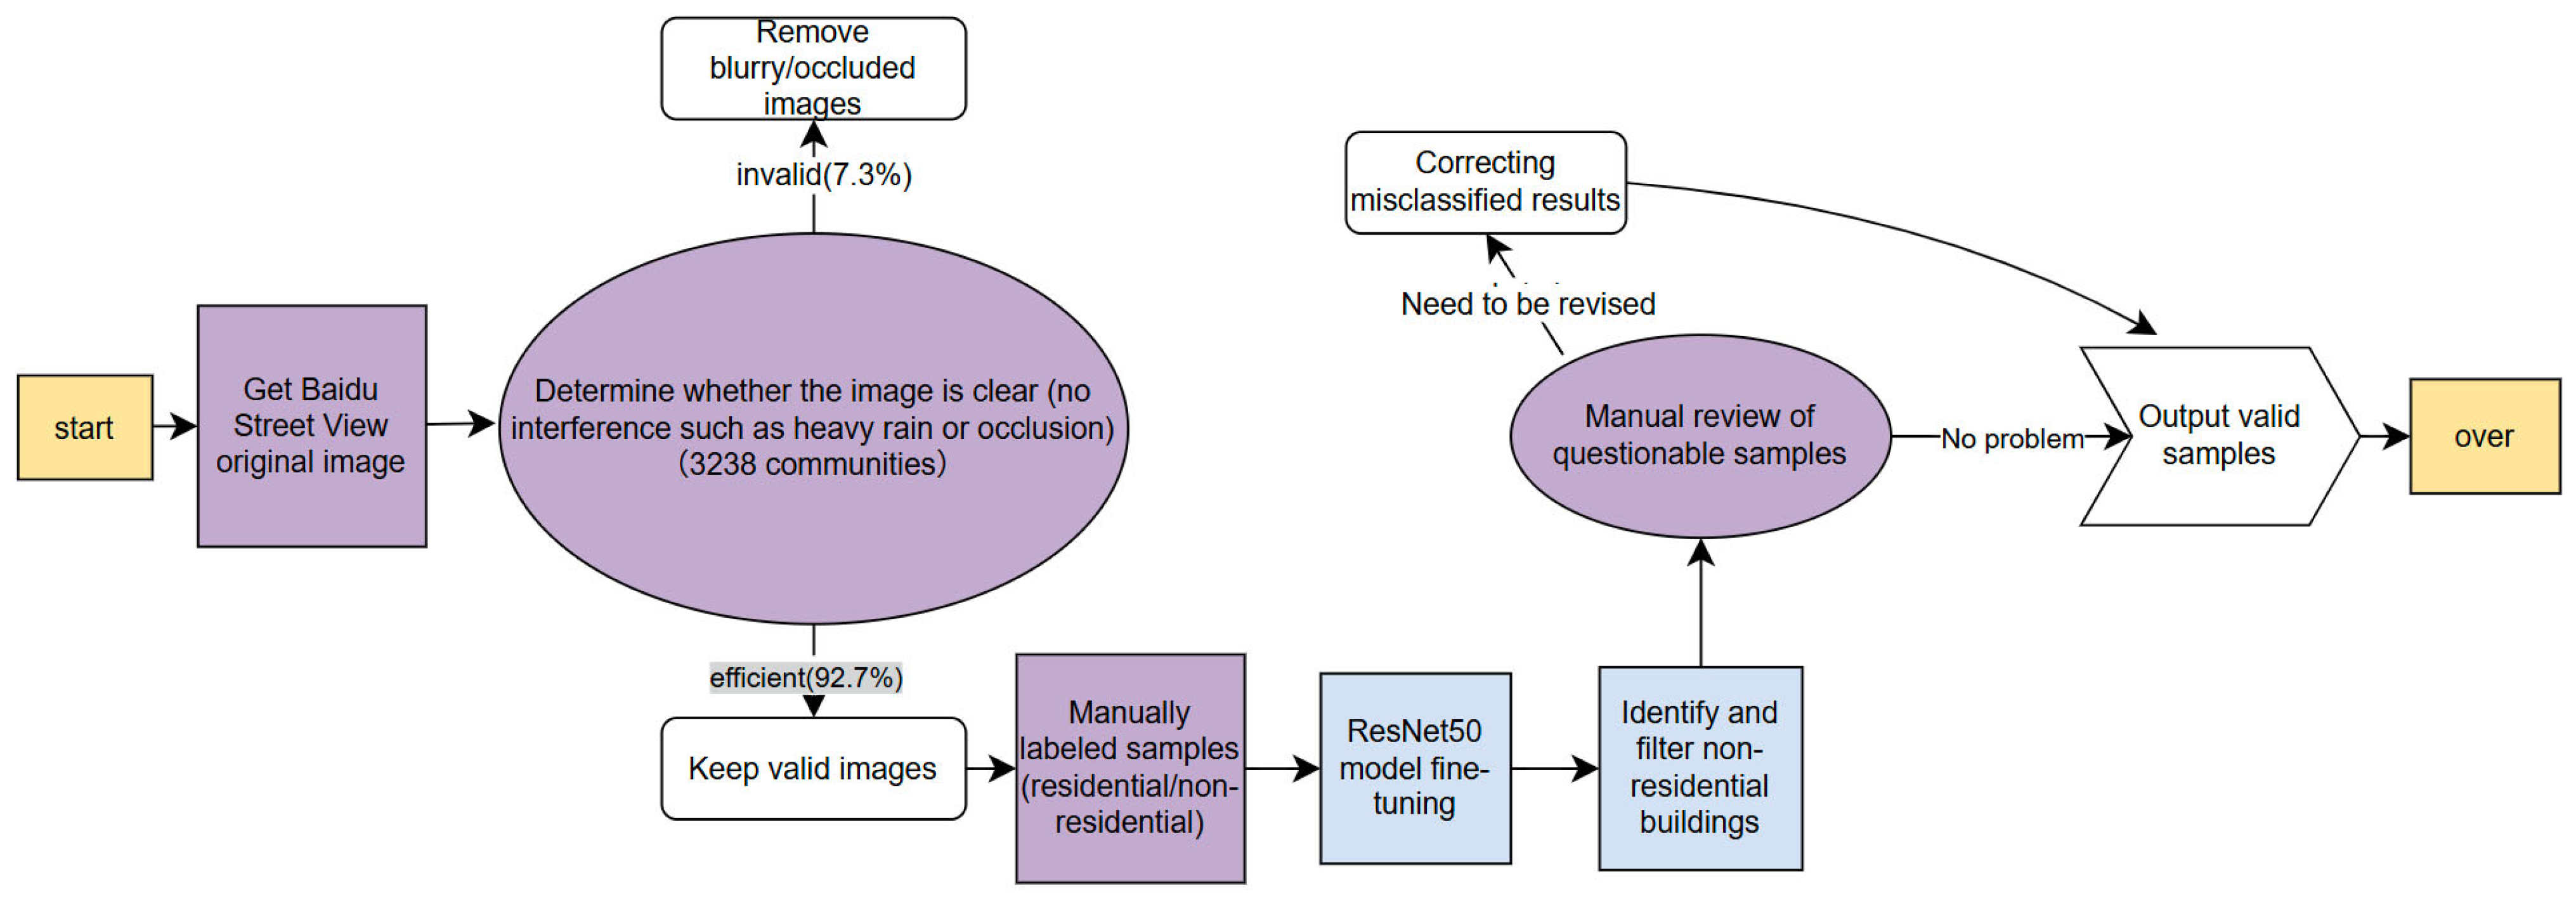
Environmental interference elimination: Establish multi-dimensional filtering standards to eliminate blurred images caused by extreme weather such as heavy rain and dense fog, exclude invalid perspectives blocked by trees and vehicles, and retain 92.7% of valid images.
Deep learning filtering: Use the pre-trained ResNet50 model (He et al., 2016) to automatically identify and filter non-residential buildings such as commercial complexes and industrial plants [38]. The model was originally proposed for image classification tasks and was fine-tuned in this study using 2000 labeled images (1500 residential and 500 non-residential) from Nanning’s residential areas, with training parameters set as learning rate 0.001 and epochs 30, achieving an accuracy of 96.3%.
The model retains ResNet50’s 5 convolutional blocks (with residual connections) for feature extraction, and modifies top layers: a global average pooling layer, a 256-neuron fully connected layer (ReLU), and a 2-neuron output layer (sigmoid) for “residential/non-residential” classification. The 2000 images were split into training (1600 images, 80%) and validation (400 images, 20%) sets. Trained with Adam optimizer (batch size 32, binary cross-entropy loss), it stopped early at epoch 22 (due to stable validation performance). Validation metrics: precision = 0.95, recall = 0.93, F1 = 0.94. Confusion matrix: 372 true positives, 368 true negatives, 18 false positives, 22 false negatives (consistent with 96.3% accuracy). The ResNet50 model used in this study adopts a deep residual network structure with 5 convolutional blocks. Each block includes convolutional layers and residual connections to avoid gradient disappearance during training. The model extracts features from street view images such as balcony drying traces and window status through these convolutional layers. It then classifies samples via fully connected layers. The training process uses binary cross-entropy loss to measure the difference between predicted and actual labels. The Adam optimizer updates model parameters with a learning rate of 0.001 to minimize loss. This mathematical logic ensures the model learns the association between visual features and vacancy status.
Manual review: Manual sampling was carried out on the images filtered by the model, with a focus on checking commercial and residential complexes that were suspected of being misjudged. Ultimately, a valid sample size of 3072 communities (accounting for 94.9%) was retained. The entire process of obtaining this final sample took approximately 3 months from July to September 2023. Baidu Street View images of 3238 residential communities were first collected through the Baidu Maps API in early July 2023. From mid-July to late August, we completed preprocessing steps including spatial registration, quality screening and non-residential filtering. In early September, we finished attribute labeling such as geographic information, construction year and building type to finalize the sample. This 3-month period avoided seasonal interference such as rainy seasons and ensured the representativeness of the final sample.
Figure 7 shows the flowchart of the image classification workflow, which systematically summarizes the entire process from raw street view image acquisition to the output of valid residential samples (including quality screening, model filtering, and manual review). The key parameters and steps in the flowchart are consistent with the above data processing details.
3.
Attribute labeling and standardization:
Geographic information annotation: accurately mark the longitude and latitude (6 decimal places), administrative divisions (12 administrative districts including Xixiangtang District) and spatial coordinates for each community.
Grouping by construction year: According to the urban development stage of Nanning City, the construction years are divided into three groups: 1990–2000 (old city renovation period), 2001–2010 (new district expansion period), and 2011–2023 (urban renewal period) to ensure consistency with the policy background.
Classification of building types: Based on the Urban Residential Area Planning and Design Standard (GB50180-2018), the samples are divided into four categories: commercial housing (basic needs, improvement, high-end), resettlement housing, unit housing and self-built housing in urban villages, and the apartment area ranges are marked (60–90 m2, 90–144 m2, >144 m2) [39].
4.
Multi-source data fusion preprocessing:
The street view image data was matched with the night light data (NPP-VIIRS) at the pixel level, and the night light intensity value (DN value) of each community was calculated to verify the consistency of the spatial distribution of the vacancy rate.
Integrate POI data (commercial facilities, transportation stations, public services, etc.) to construct a “15-min life circle” coverage index to provide support for subsequent influencing factor analysis [40,41].
This study proposes a potential long-term monitoring system for residential vacancy based on street view images. It has a clear conceptual structure with three core modules:
Data acquisition module: It relies on Baidu Street View API for periodic image collection. The acquisition frequency can be adjusted according to needs. Key areas can be updated once every 6 months and general areas once a year. It supports setting parameters such as resolution up to 2048 × 1536 pixels, shooting time from 10:00 to 15:00 to avoid shadow interference, and viewing angle between 80° and 90° to ensure facade clarity. These settings guarantee stable data sources and quality.
Data preprocessing module: It includes quality screening to eliminate blurred or occluded images, non-residential filtering using the ResNet50 model, and spatial registration to align with administrative division data. This module can automatically process over 3000 community images within 24 h after acquisition.
Vacancy judgment module: It integrates manual interpretation standards focusing on balcony activity traces and deep learning models. It realizes semi-automatic vacancy judgment. The module supports batch processing and can output community-level vacancy rate results within 48 h after preprocessing. This structure ensures the system’s scalability in data acquisition across different regions and efficiency in result output, laying a foundation for long-term dynamic monitoring.

4.2. Data Sample Size Description

The total sample size of this study reached 3238, which is 169.83% larger than the Guangzhou case (1200 communities), significantly improving the accuracy of spatial analysis of polycentric cities.
Completeness of time span. The sample covers residential buildings built in the 33 years from 1990 to 2023, which fully reflects the phased characteristics of housing supply in the urbanization process of Nanning: Old city renovation period (1990–2000): accounting for 38.7%, mainly unit housing and resettlement housing, concentrated in Xixiangtang District and Xingning District, with an average vacancy rate of 0.28, reflecting the contradiction between supply and demand under the historical development model. New district expansion period (2001–2010): accounting for 29.2%, the proportion of commercial housing increased to 65%, mainly distributed in Liangqing District and Jiangnan District, with an average vacancy rate of 0.22, reflecting the time and space mismatch between new district development and population introduction. Urban renewal period (2011–2023): accounting for 32.1%, the proportion of improved housing reached 42%, such as Ronghe Banshan Huafu in Wuxiang New District, with an average vacancy rate of 0.21, reflecting the dynamic balance between market demand upgrading and supporting facilities improvement. Spatial distribution balance. Multi-center coverage: The sample ratio of the old urban area (Xixiangtang District 5.2%, Xingning District 3.5%) and the new urban area (Liangqing District 3.1%, Jiangnan District 3.3%) is 1.68:1, taking into account both the historical built-up area and the emerging development area; the remote suburban counties (Mashan County 1.6%, Hengzhou City 1.3%) and the main urban area are distributed in a gradient manner to ensure the integrity of the urban-rural difference analysis. Traffic corridor coverage: The samples along Metro Line 4 account for 22.7%, such as Wuxiang New District and Shajing Block, which is convenient for verifying the impact of traffic improvement on vacancy rate.
Diversity of building types. Commercial housing: accounting for 68.2%, covering just-needed housing (60–90 m2, 45%), improvement housing (90–144 m2, 38%) and high-end housing (>144 m2, 17%), mainly distributed in Liangqing District and Jiangnan District. Resettlement housing: accounting for 15.7%, concentrated in Xixiangtang District (such as Nanning Huayang City) and Xingning District (such as Huqiu Village), with an average vacancy rate of 0.25, reflecting the implementation effect of the shantytown renovation policy. Unit housing: accounting for 10.3%, concentrated around the government agencies in Qingxiu District, with an average vacancy rate of 0.19, reflecting the historical legacy of the welfare housing distribution era. Self-built houses in urban villages: accounting for 5.8%, mainly located in the Donggouling area of Xingning District, with an average vacancy rate of 0.22, filling the research gap in the informal housing market.

4.3. Overall Characteristics of Residential Vacancy Rates in Nanning

Statistical analysis based on 3238 residential community samples shows that the urban housing vacancy rate in Nanning in 2023 showed significant regional differentiation characteristics. The overall pattern was highly correlated with the city’s functional positioning, development stage and policy intervention. The regional vacancy rate showed a pattern of “stable old city, differentiated new area, and policy-driven in the suburbs.”
The dual-core differentiation characteristics of Traditional Built-up Areas TBA are significant. The average vacancy rate in TBA is 0.17. Its core sub-area has a vacancy rate of 0.15 and its peripheral sub-area 0.19, which are generally low. Among them, old communities have a stable residential structure mostly indigenous residents or long-term tenants. Although the houses are old and the facilities are lagging behind, the vacancy rate remains at a low level. Some newly built blocks are affected by factors such as housing prices and imperfect supporting facilities, so their vacancy rates differ from those of old communities, showing a dual-core feature of “low in old communities and high in newly built areas.” The structural contradiction between advanced planning and lagging supporting facilities in Emerging Development Areas EDA is prominent. The average vacancy rate in EDA is 0.205. Its new urban sub-area has a vacancy rate of 0.21 and its industrial sub-area 0.20, which is higher than TBA as a whole. Among them, the vacancy rate of newly built commercial housing in the industrial sub-area of EDA reaches 0.38, exposing the problem of “time and space mismatch of infrastructure, living facilities and population inflow” in the development of new areas. EDA benefits from the opening of Metro Line 4 and other transportation advantages, but the lagging industry introduction and insufficient employment opportunities restrict the increase in occupancy rate, reflecting the typical characteristics of new cities of “planning first, slow demand follow-up.” Remote Suburban Counties RSC are affected by both policy intervention and resource endowment. The average vacancy rate in RSC is 0.225. Underdeveloped sub-counties have a vacancy rate of 0.25, the highest among all regions. Although the shantytown renovation policy has reduced local vacancy such as shantytown renovation communities through centralized resettlement, the overall vacancy rate is high due to factors such as weak county economic foundation and population outflow. Resource-endowed sub-counties have a vacancy rate of 0.20. Their riverside areas attract self-occupancy demand with landscape resources, which partially offsets the vacancy pressure caused by underdeveloped economy, reflecting the characteristics of quality housing balancing regional vacancy.
Compared with the national data of CHFS (2020) of Southwestern University of Finance and Economics, the average vacancy rate of urban housing in Nanning in 2023 is 0.20 (based on weighted calculation of each region), which is higher than the national average (0.15), but lower than the average level of similar provincial capital cities, indicating that its housing market is relatively stable in regional competition. Compared with the case of Guangzhou, Nanning’s overall vacancy rate (0.20) is significantly lower than that of Guangzhou (31%, or 0.31), with a difference of 0.11 percentage points. To validate the model, we randomly selected 300 communities for field verification. The results show that the predicted vacancy rate by the model has a high consistency with the actual investigation (R2 = 0.82, RMSE = 0.04), indicating that the model has good reliability.
To strengthen statistical validation, we further compared street view-based vacancy estimates with two types of independent housing data. First, the correlation between our estimates and night light data (NPP-VIIRS) reached 0.78 (p < 0.01), which means areas with low night light intensity (indicating low residential activity) were highly consistent with high vacancy areas identified by street view images. Second, compared with the third-party door-to-door survey data of 220 communities in 2023, 91% of our estimates showed a difference of less than 0.05 from the survey results. Among them, the consistency was higher in old communities (94%) than in new communities (88%), which is consistent with the earlier finding that old communities have more stable visual features for judgment. In addition, when compared with the national housing data from the China Household Finance Survey (CHFS 2020), the overall vacancy rate of Nanning calculated in this study (0.20) was within the reasonable error range of similar provincial capital cities, further supporting the reliability of the model’s predictions.
Specifically, the error rate of old communities is 2.3%, lower than that of new communities (4.1%), which may be due to more stable visual features (e.g., balcony drying) in old communities.

4.4. Spatial Heterogeneity of Residential Vacancy Rate in Nanning

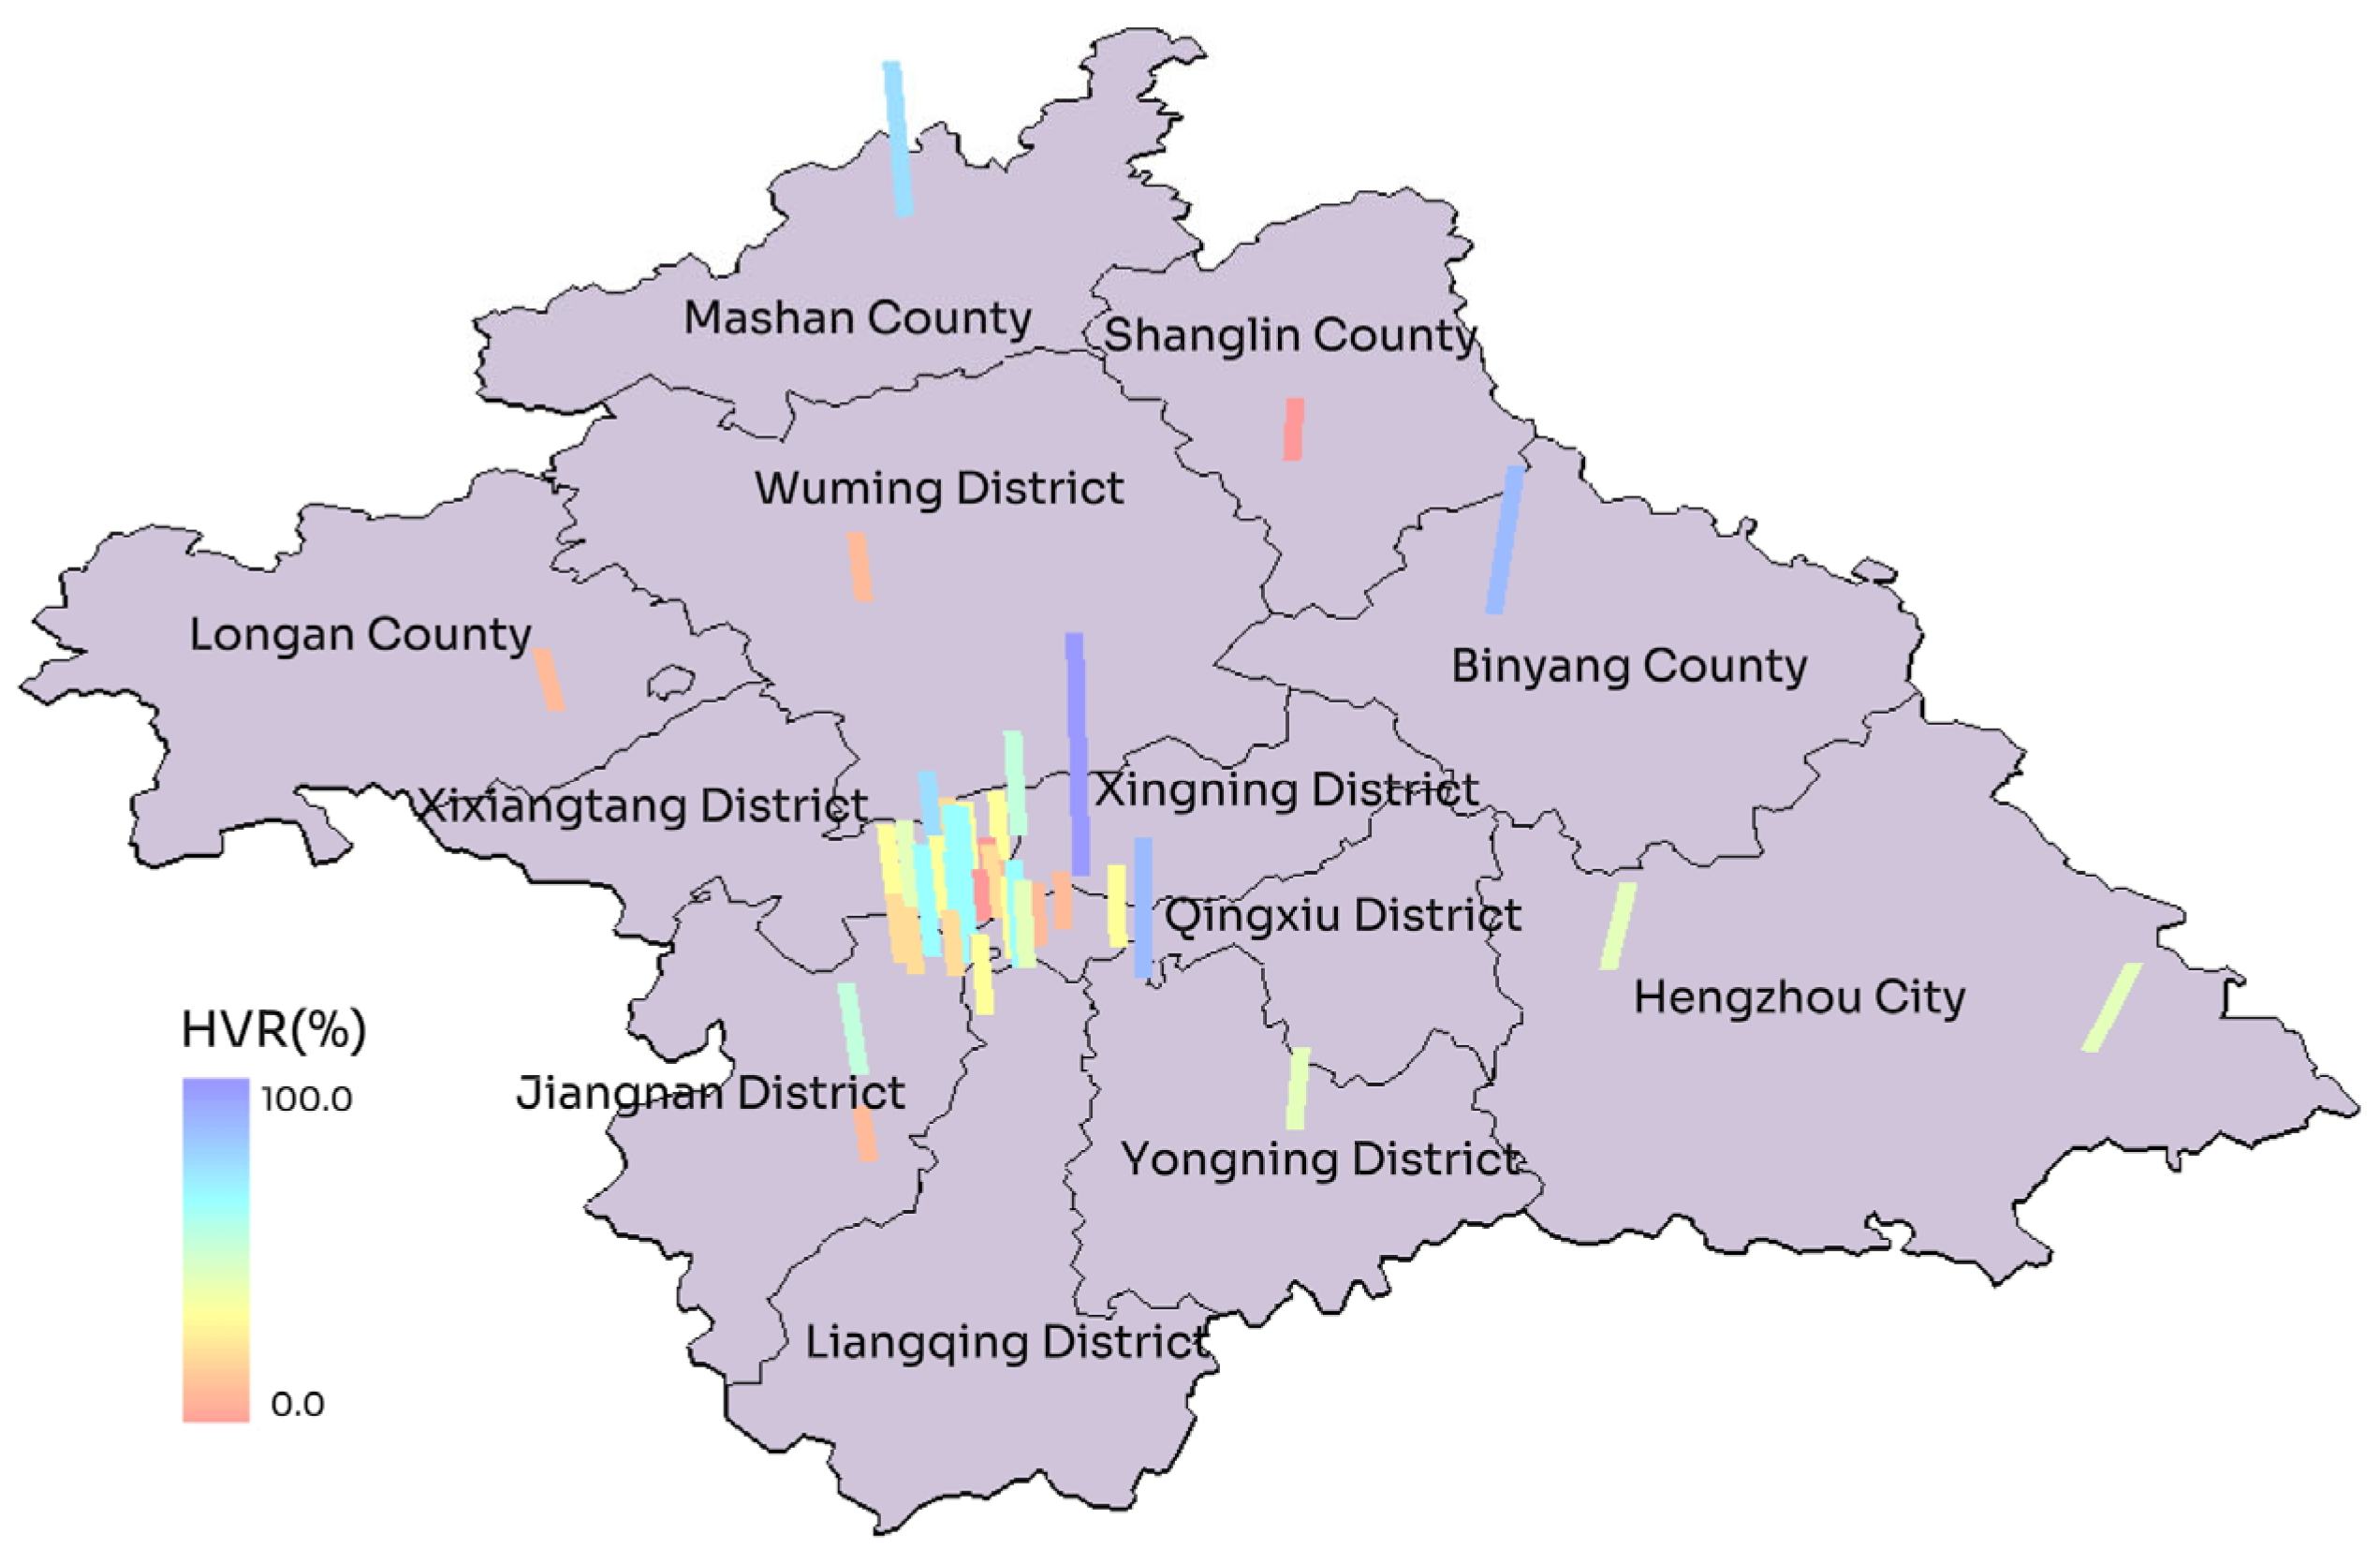
The spatial distribution of residential vacancy rate in Nanning (Figure 8) shows significant differentiation characteristics: “emerging development areas > traditional built-up areas > remote suburban counties (partial)” (where “>” indicates “has a higher vacancy rate than”). This pattern is essentially different from Guangzhou’s “single-core agglomeration” model. The traditional built-up areas of Xixiangtang District (0.15) and Xingning District (0.19) have lower vacancy rates than the emerging development areas of Liangqing District (0.21) and Jiangnan District (0.20) due to the stable residential structure and mature supporting facilities of the old communities. Among them, the vacancy rate of newly built commercial housing in Shajing section of Jiangnan District reached 0.38 due to the time and space mismatch between infrastructure and population inflow, making it a typical high vacancy area in the city; Mashan County, a remote suburban county, is affected by its weak economic foundation and has an overall vacancy rate of 0.25 (higher than some urban areas), but the resettlement areas for shantytown renovation (such as Mashan Taohuayuan 0.12) and the riverside area of Hengzhou City (Yujiang Huating 0.15) have formed local low vacancy areas due to policy drive and resource advantages, breaking the traditional perception of the “center–periphery” gradient decrease.
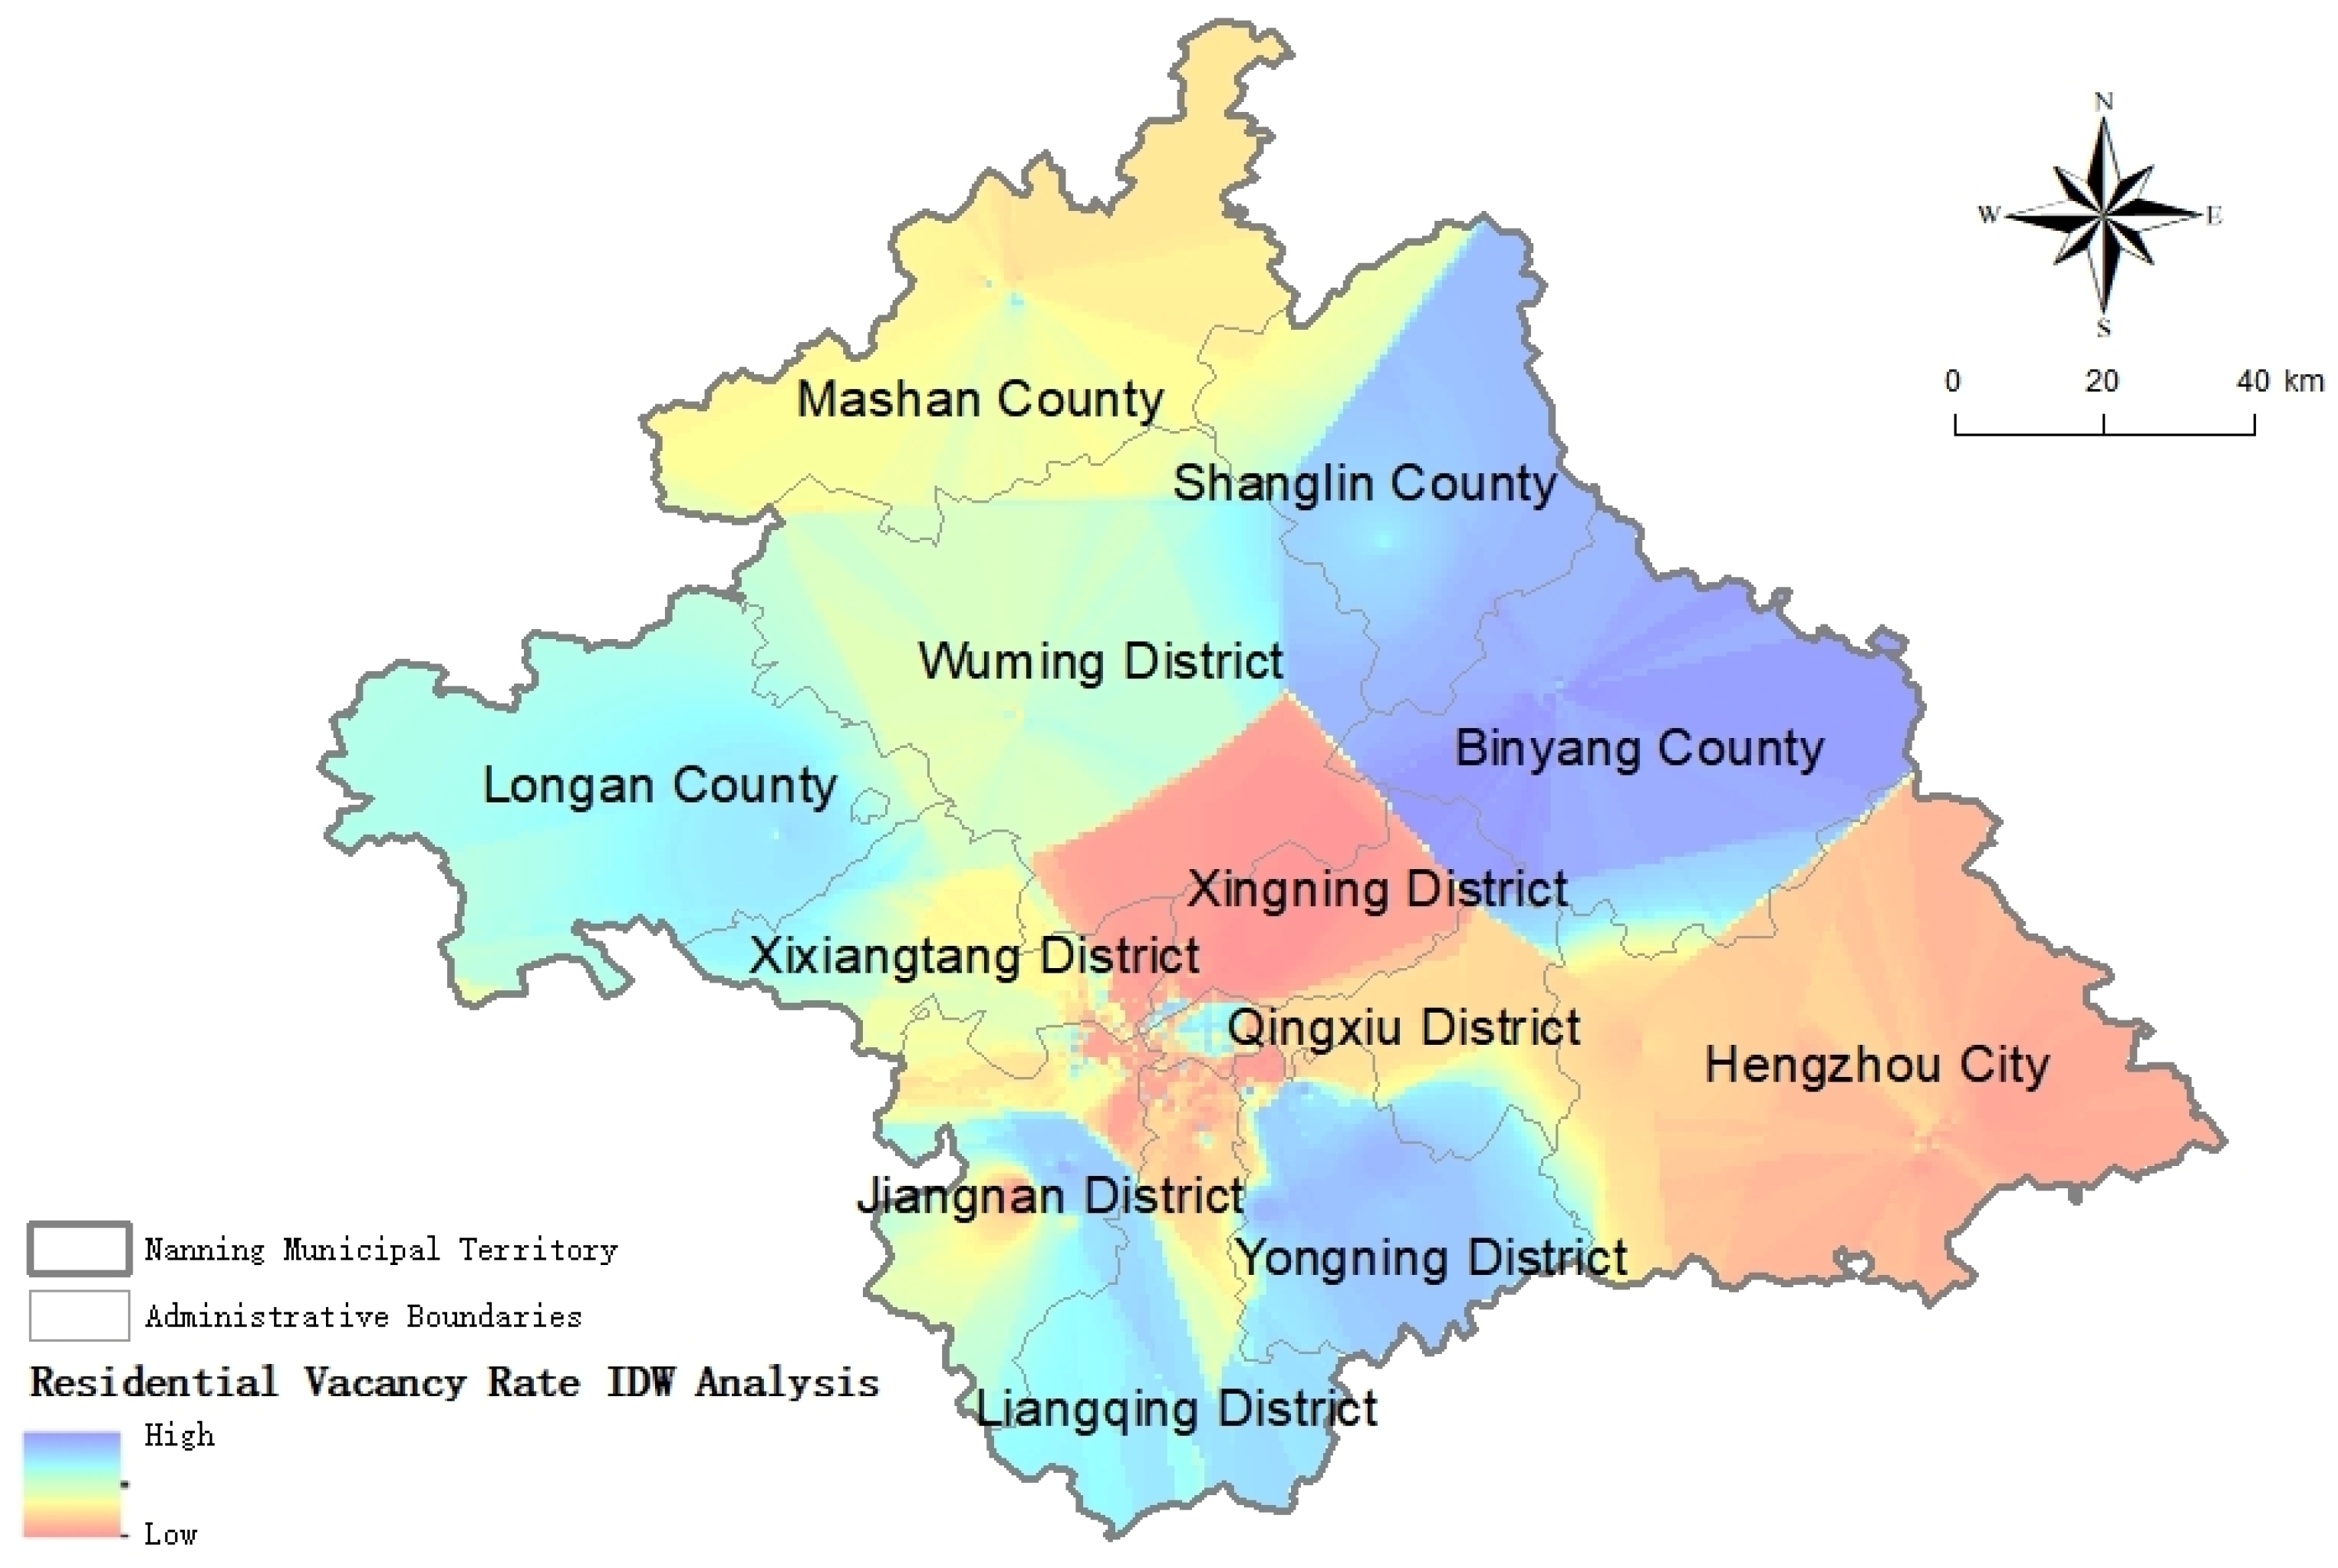
Through IDW interpolation analysis (Figure 9), it can be seen that high vacancy concentration areas (>0.35) are mainly concentrated in the Shajing section of Jiangnan District in the emerging development area, reflecting the common contradiction of “lagging development and supporting facilities in new areas”; in the traditional built-up areas, the Anji section of Xixiangtang District, Beihu section and Donggouling area of Xingning District, the overall vacancy rate is in a reasonable range of 0.15–0.19 due to the strong rental demand in old communities, and only some newly built sections have staged vacancy differences. Low vacancy areas (<0.15) include old communities such as Donggouling in Xingning District in addition to the Mashan County shantytown renovation area and the Hengzhou City Binjiang belt, reflecting the inhibitory effect of “residential inertia + policy support + resource endowment” on the vacancy rate.
Spatial autocorrelation analysis shows that the global Moran’s I index is 0.32 (p < 0.01, Z = 4.27), and the vacancy rate shows a “high-high” and “low-low” clustered distribution characteristics. Among them, the “high-high” cluster area is mainly located in the Shajing section of the emerging development area and some newly built commercial housing concentration areas in Wuxiang New District, which is closely related to the low occupancy rate caused by “work-residence separation”; the “low-low” cluster area is concentrated in the core old communities of the traditional built-up area and the policy/resource advantage areas of the remote suburban counties, verifying the vacancy rate differentiation mechanism of “differentiation between new and old regions, dual drive of policies and markets” under the multi-center urban structure, which cannot be explained by the simple “center-periphery” theory [42].
The housing market in Nanning shows significant regional differentiation. As traditional built-up areas, Xixiangtang District and Xingning District mainly developed unit housing and early commercial housing from 1990 to 2010 (the early stage of old city renovation and new district expansion). Commercial housing accounted for 65% from 2001 to 2010. However, after 2011, the newly built blocks lagged behind in supporting construction (such as infrastructure and commercial services were not implemented synchronously), resulting in a mismatch between supply and demand in some areas. However, due to the stable residential structure (the proportion of original residents and long-term tenants exceeded 70%), the overall vacancy rate of old communities (such as Donggouling area) remained at a low level (0.15 in Xixiangtang District and 0.19 in Xingning District), and no regional excess of stock was formed. The emerging development areas (Liangqing District and Jiangnan District) entered a concentrated development period after 2011 (the proportion of improved housing was 42% from 2011 to 2023), and newly built commercial housing in Wuxiang New District, Shajing Block and other areas became the main supply. Taking Liangqing District as an example, although it is benefited by the opening of Metro Line 4, its industry introduction lags behind housing construction. In 2023, the average vacancy rate in the region is 0.21 (corresponding to an occupancy rate of 79%), reflecting the structural contradiction of “concentrated space supply but insufficient jobs”; the Shajing section of Jiangnan District has a vacancy rate of 0.38 for newly built commercial housing due to the time and space mismatch between infrastructure and population introduction, highlighting the typical problem of “housing first, slow follow-up of supporting facilities” in the development of new districts.
Contrary to traditional perception, the imbalance between housing supply and demand in traditional built-up areas is mainly manifested in the differentiation between old and new communities (low vacancy in old communities and medium-to-high vacancy in newly built areas), rather than an overall surplus; the core contradiction in emerging areas is advanced planning and lagging demand, and the vacancy pressure needs to be alleviated by accelerating industrial implementation and improving public service support. Statistical analysis shows that the vacancy rate in emerging areas is negatively correlated with the number of local industrial enterprises (Pearson correlation coefficient −0.68, p < 0.01).
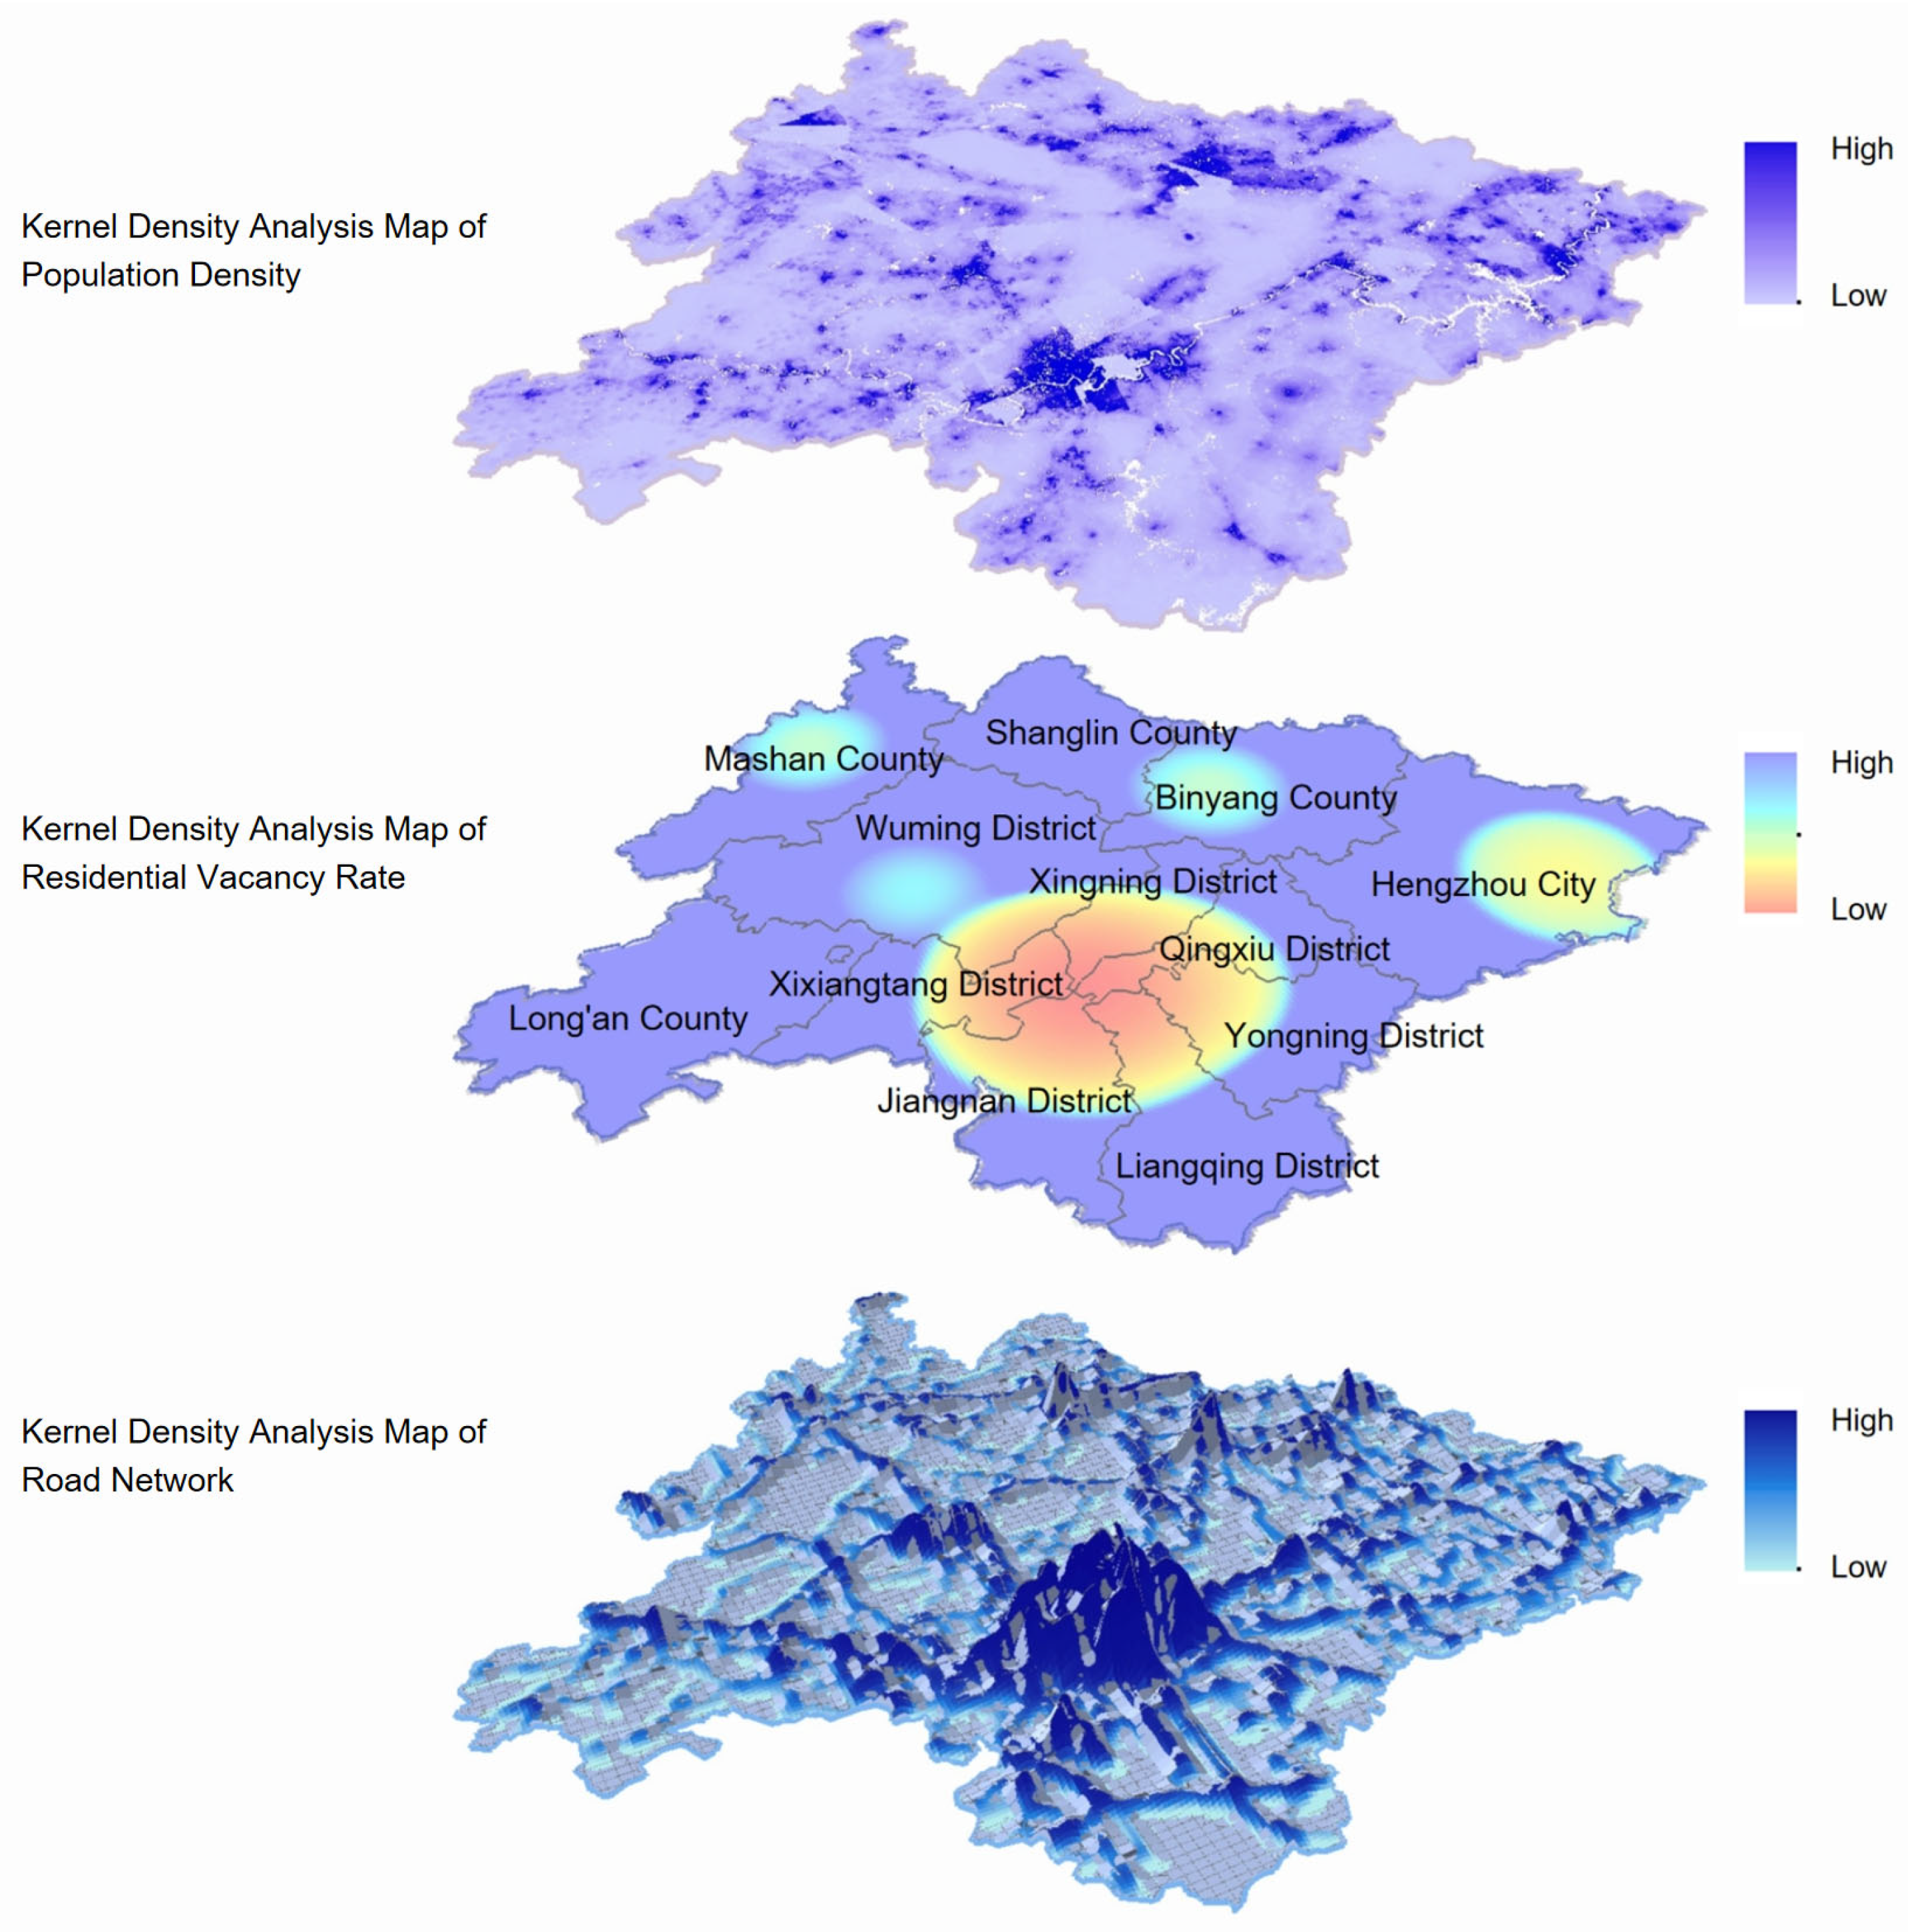
Figure 10 further illustrates that areas with high population density and well-developed road networks (e.g., core old communities in Xixiangtang District) generally correspond to low vacancy rates, while areas with low population density and sparse road networks (e.g., partial regions in Mashan County) tend to have high vacancy rates, which is consistent with the above statistical findings. For example, Wuxiang New District has a housing completion area of 1.2 million m2 in 2023, but the number of enterprises above designated size is only 37, resulting in a job-housing ratio of 1:3.2, which is far lower than the balanced standard (1:1.2). This ‘supply-demand mismatch’ directly leads to 41% of residents commuting to old urban areas for work, reducing the actual occupancy rate by 15–20%.
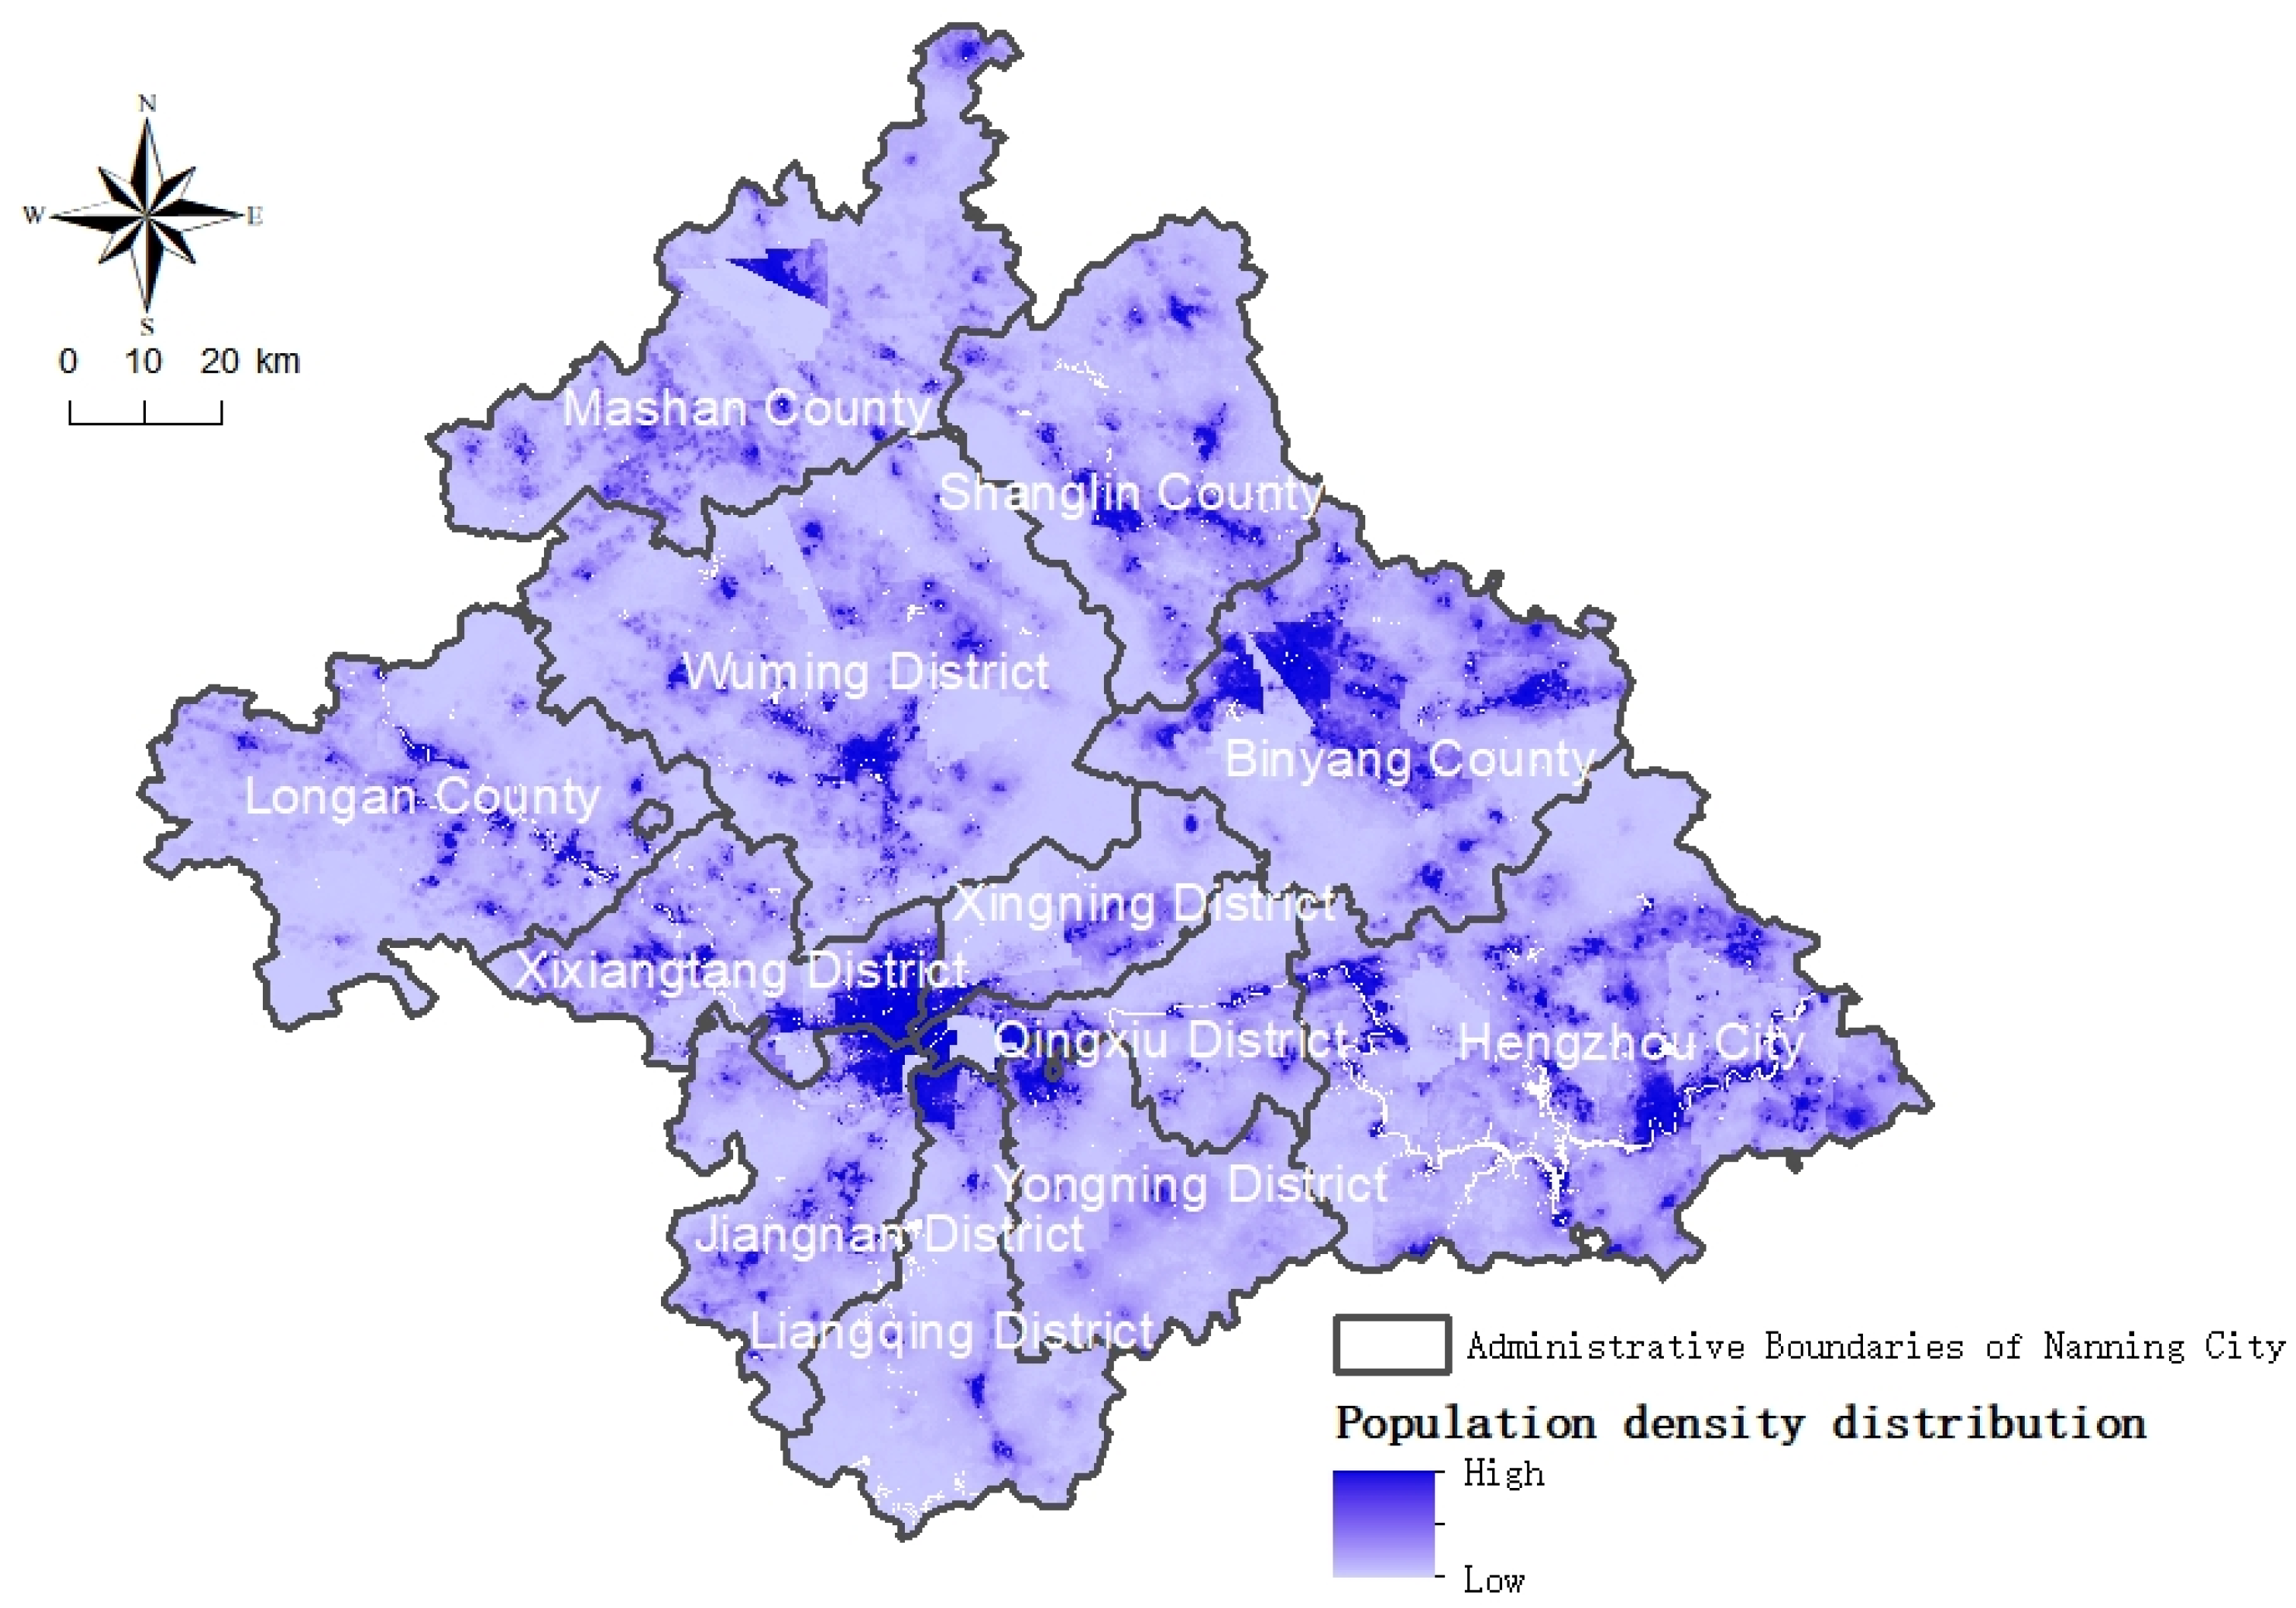
The population density map of Nanning in 2020 (Figure 11). Nanning’s population distribution is relatively dense overall, and the population concentration characteristics in the central urban area are significant. Based on the dynamic monitoring data of the floating population in Nanning (2022), migrant workers account for 32%, and their housing demand shows a significant “commuting-oriented” feature. The urban villages represented by Huqiu Village (located in the Donggouling area of Xingning District) have attracted a large number of migrant populations to rent by virtue of their proximity to the urban employment center (commuting radius < 3 km) and low rent (average 15 yuan/m2/month). Such communities have a stable residential structure (including tenants) and a low vacancy rate. Some newly built commercial housing blocks (not old residential areas) in Xixiangtang District and Xingning District are difficult to meet the demand for improvement due to their high building density and lagging supporting facilities (such as lack of elevators and parking space ratio of less than 1:0.5), resulting in relatively high vacancy rates. Although the old residential areas (such as unit housing and resettlement housing) are older (18 years on average), their actual vacancy rates are lower than those in emerging development areas due to their superior geographical location, mature living facilities, and active rental market (such as strong demand for rental housing around universities).
Mashan County implemented the Shantytown Reconstruction Plan (2021–2025) and concentrated on building resettlement housing (such as Mashan Peach Garden), and the regional vacancy rate has been reduced in the short term. However, this policy has obvious limitations. Insufficient industrial support: There are only 12 industrial enterprises above designated size in Mashan County (statistics in 2023), and new jobs are limited, resulting in unstable income sources for resettled residents; single housing function: resettlement housing is mainly 60–80 m2 rigid demand housing, lacking improved products, and difficult to meet diversified housing needs; public service support lags behind: education and medical resources are tilted towards the old city, and the gap in school places in the new resettlement area reaches 23%, affecting long-term residential stability.

5. Discussion

5.1. Specific Case Analysis

Kernel density analysis based on ArcGIS 10.8 shows that the residential vacancy rate in Nanning presents a significant “multi-center agglomeration” spatial pattern: there are significant regional differences in housing vacancy rates in Nanning. The traditional built-up areas of Xixiangtang District (0.15) and Xingning District (0.19) have a relatively low overall vacancy rate due to the stable residential structure and mature supporting facilities of the old communities. Only some newly built blocks have differentiated vacancy due to lagging supporting facilities. In the emerging development areas of Liangqing District (0.21) and Jiangnan District (0.20), the vacancy rate of newly built commercial housing in Shajing Block reached 0.38, highlighting the common contradiction that planning is ahead of industry and population introduction in the development of new areas. Although Wuxiang New District has benefited from the 4th subway, the opening of Line 100 has reduced the vacancy rate by 0.05, but the lagging industry still restricts the occupancy rate; the remote suburban county of Mashan County (0.25) has the highest overall vacancy rate due to its weak economy and population outflow, but the resettlement areas for shantytown renovation (such as Mashan Taohuayuan 0.12) have achieved low vacancy due to policy guarantees and integrated supporting facilities. The riverside areas of Hengzhou City (0.20) rely on landscape resources to attract improvement demand, and the local vacancy rate is lower than the average (such as Yujiang Huating 0.15). Overall, low vacancy areas mostly rely on stable residential demand, policy support or scarce resources, while high vacancy areas are mainly affected by factors such as mismatch between planning and demand, investment-driven housing purchases and insufficient regional economic level. It is necessary to alleviate local vacancy pressure by optimizing the timing of supporting construction and guiding reasonable housing demand.
The global Moran’s I index is 0.32 (p < 0.01, Z = 4.27), indicating that there is a significant positive spatial autocorrelation in the residential vacancy rate in Nanning, and the high-value areas and low-value areas show a clustered distribution characteristic [43]. Local Moran’s I: The significant hot spots (HH type) are identified, which are located in the old urban area of Mashan County and the non-riverside area of Hengzhou City; the cold spots (LL type) are concentrated in the urban villages and old communities of Xixiangtang District and Xingning District. Getis-Ord Gi * analysis: The high vacancy hot spots are distributed in a “point-like discrete” manner, and the cold spots form a “dual-core linkage” belt (Xixiangtang-Xingning).
The spatial differentiation pattern of residential vacancy rate in Nanning is the result of the synergistic effect of multi-dimensional factors under the multi-center urban structure. Its formation mechanism can be summarized as the interactive influence of three dimensions: urban development stage, residential environment quality, and policy orientation: Urban development stage: Overdevelopment of old urban areas leads to excess stock, and the planning of new areas is ahead of population inflow. Residential environment quality: High-value areas have high building density and aging facilities, while low-value areas rely on newly built commercial housing and supporting advantages. Policy orientation: Shantytown renovation policies and traffic improvements (such as Metro Line 4) significantly affect local vacancy rates.
In order to deeply analyze the influencing factors and spatial differentiation characteristics of residential vacancy rate in Nanning, this study selected representative high-vacancy rate and low-vacancy rate communities for detailed analysis. By combining multi-source data such as street view image interpretation, field surveys and interviews, this study revealed the internal mechanisms behind the vacancy phenomenon in different types of communities.
  • Case 1: Highly vacant residential area—Zhonghai Yue Mansion (Figure 12)
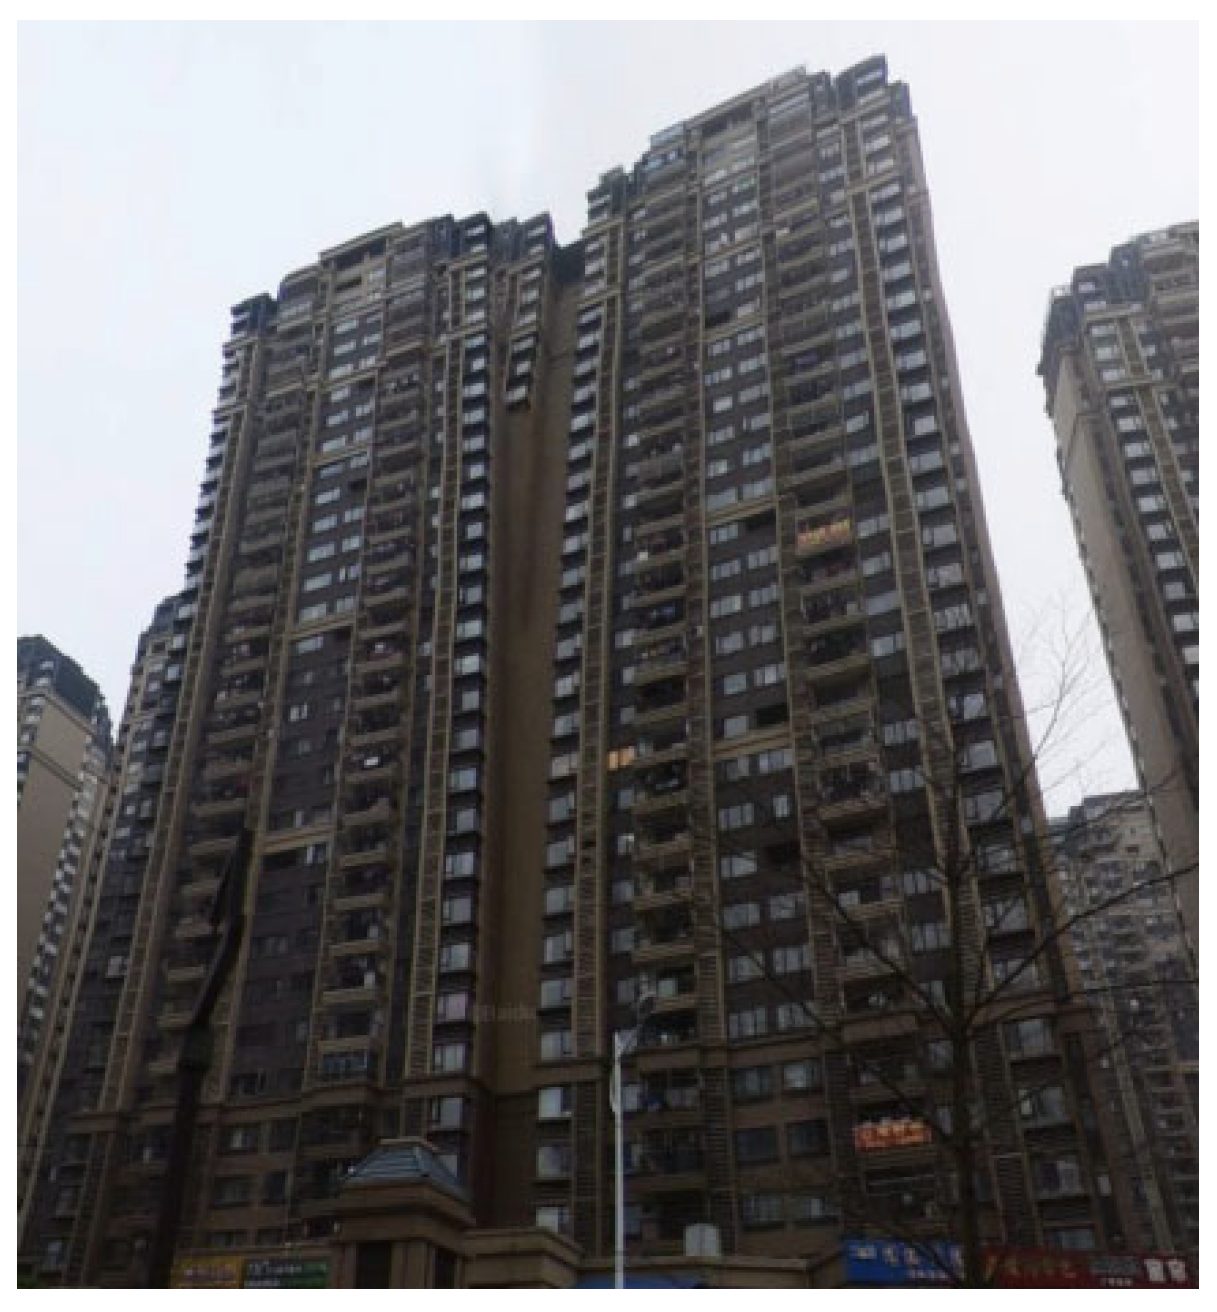
Highly vacant residential area Type newly built in EDA with imperfect supporting facilities (Figure 12). This community has a variety of apartment types. From the street view, many houses have no signs of drying on the balconies, and the windows are often closed, which means there is a certain amount of vacancy. Field investigations found the main reasons for its high vacancy rate are that the surrounding living facilities are not perfect, and there is a lack of small fresh food markets with reasonable layout, which makes it inconvenient for residents to purchase; the transportation conditions are not good and the roads are seriously congested during peak hours which increases the travel cost and time cost; there are problems with the internal management of the community, and the supporting kindergartens are delayed in opening, which affects the admission of families with children. The property management is inadequate in terms of safety and hygiene, the parking space planning is unreasonable, and parking is difficult, which has led to the relocation of some residents and deterred potential residents, thus increasing the vacancy rate. This phenomenon reflects the failure of “functional zoning coordination” in urban planning. The community is zoned as a residential area in the 2018 master plan, but the surrounding 1 km range is planned as industrial land, accounting for 60% of the land use, resulting in a conflict between residential demand for “quiet environment” and industrial land’s “noise pollution”. Field surveys show 63% of potential buyers consider “environmental mismatch” as the key reason for abandoning purchase.
  • Case 2: High vacancy community—Zhongxi Sun Bay (vacancy rate 0.63) (Figure 13)
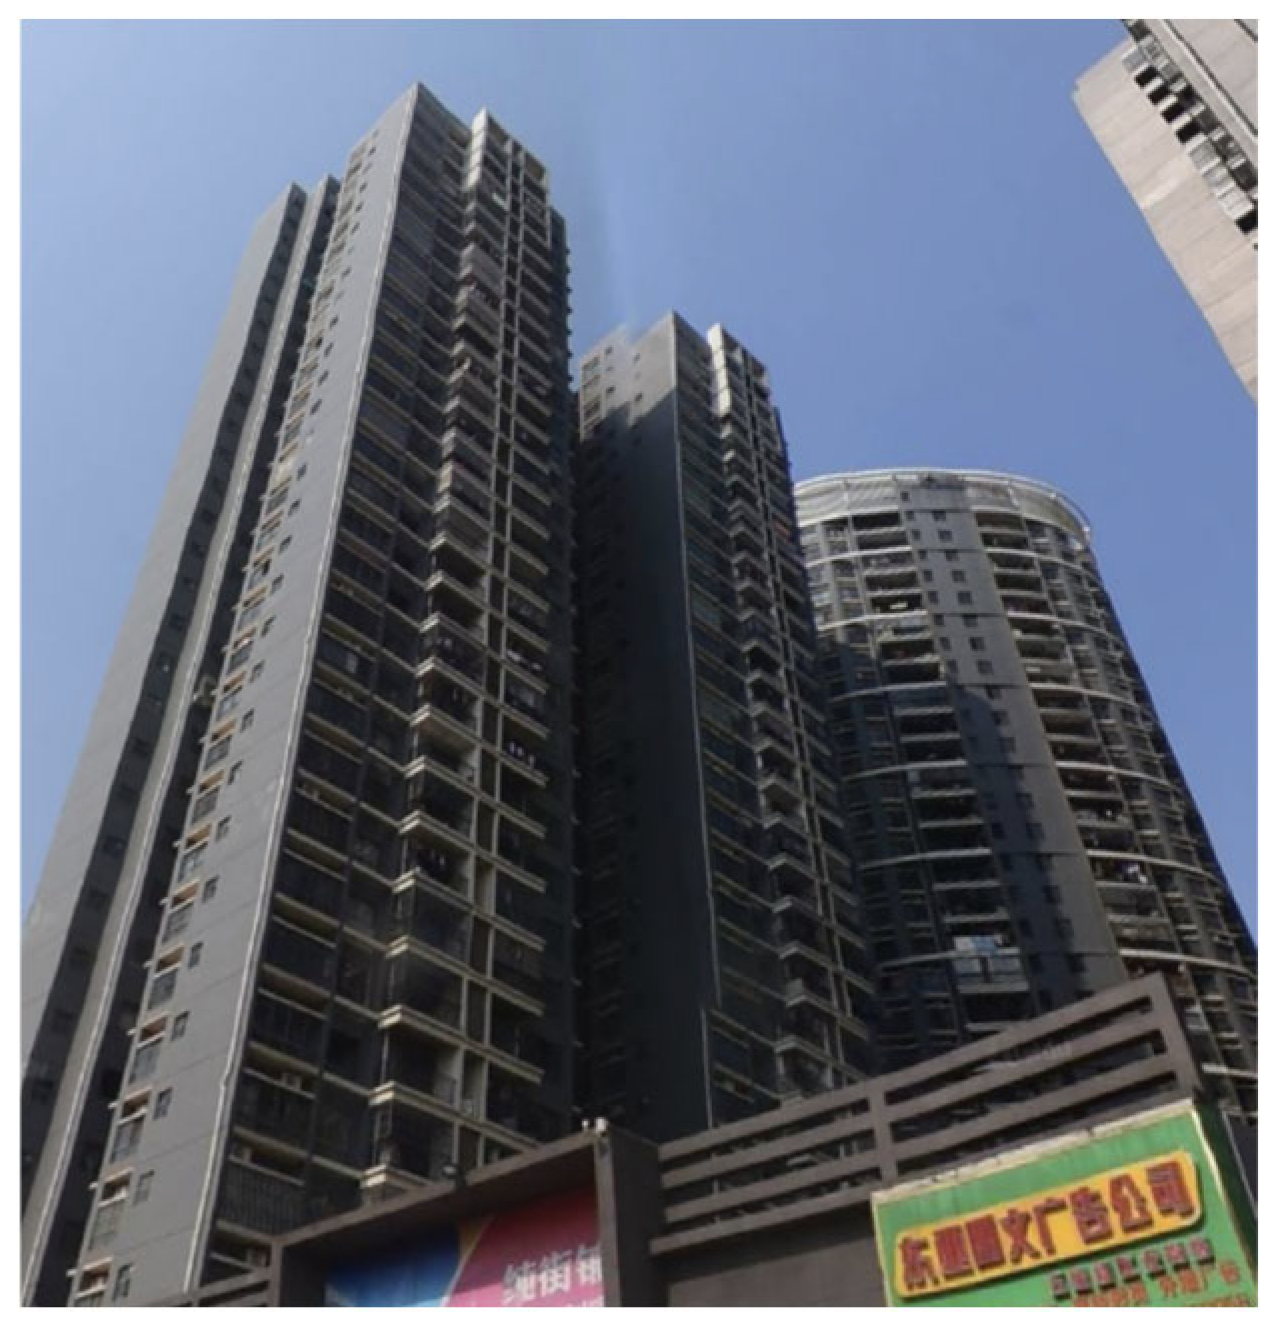
Highly vacant residential area Type newly built in EDA with design and management flaws (Figure 13). This community was built relatively late. From the street view images, it was found that there were almost no signs of drying clothes on a large number of balconies, and it was common for windows to be closed for a long time. The main reasons for the high vacancy rate of the community include the overall planning and architectural design of the community which are insufficient, the internal space layout is not reasonable, and the practicality of some units is poor, which makes it difficult to meet the current diverse living needs; the security measures in the community are not perfect, there are blind spots in the monitoring equipment, the access control management is relatively lax, and the residents have a low sense of living security; at the same time, the surrounding environment of the community is not good, and there are noise pollution problems. For example, there may be construction sites or main traffic roads nearby, and the noise interferes with the normal life of residents. This also makes the community less attractive to home buyers and tenants, in turn, leading to a high vacancy rate.
  • Case 3: Highly vacant community—Huqiu Village (vacancy rate 0.22) (Figure 14)
Highly vacant residential area Type urban village in TBA with outdated facilities and management (Figure 14). This community is a typical urban village. Street view images show that some houses lack signs of drying clothes on the balconies and the windows are often closed. The main factors leading to the high vacancy rate in this community are with the development of the city, many modern residential communities have been newly built in the surrounding area. In contrast, the living environment in this community is poor, the infrastructure is not perfect, the housing density is high, and the ventilation and lighting conditions are not good; at the same time, due to the lack of effective planning and management, the security and fire protection safety hazards in the village are more prominent, which makes some residents who originally lived here choose to move out, and foreign tenants are more inclined to choose communities with better environments, resulting in a certain degree of vacancy.
  • Case 4: Low vacancy community—Hongfu Building (vacancy rate 0.13) (Figure 15)
Low vacancy community Type old residential area in TBA with stable residents and low living costs (Figure 15). This community is positioned as an ordinary residence. From the street view image, it can be clearly seen that many windows in the community are used to dry clothes, and the frequency of opening windows is also relatively high, showing a high degree of residential vitality overall.
The results of the field interviews show that this is an old residential building, and the residents are mainly middle-aged and elderly people. Most of them have lived here for many years and have deep feelings and high residential stickiness for this area. Since the building was built earlier, the surrounding supporting facilities can meet basic living needs, but the overall grade is not high. The small supermarkets and convenience stores nearby are small in scale, and the variety of goods is relatively limited, but basic daily necessities can still be bought, barely meeting the daily shopping needs of residents.
In terms of transportation, although it is close to the bus station and public transportation seems convenient, the surrounding roads are aging, and the traffic conditions are poor at certain times, especially during rush hour. Road congestion often occurs, which affects the actual experience of residents taking public transportation and makes it difficult to effectively guarantee travel time. In addition, the old public transportation facilities have also brought some inconvenience to residents.
Despite these shortcomings, this community has attracted some low-income tenants and buyers with its low rent and purchase costs. For them, the living cost here is relatively low and more affordable. At the same time, the surrounding living atmosphere is strong and the relationship between neighbors is close. This humanistic environment has also become one of the important factors that attract residents to stay.
  • Case 5: Low vacancy community—Wanda Huafu (vacancy rate 0.14) (Figure 16)
Low vacancy community Type mature commercial-residential area in TBA with complete supporting facilities (Figure 16). This community is close to a commercial plaza. Street view images show that the balcony in the community is in good condition and the windows are open normally. The reason for the low vacancy rate in this community is that the area where it is located has developed rapidly in recent years and has a strong business atmosphere. Commercial complexes nearby provide residents with a wealth of shopping, entertainment, dining and other consumption options; transportation is convenient, with many bus lines passing by, and proximity to a subway station, making it easy for residents to travel; the community’s own construction quality and apartment design are relatively reasonable, which can meet the living needs of different families. These factors have attracted a large number of residents to move in keeping the vacancy rate at a low level.

5.2. Limitations of the Research Method

This study reveals the spatial pattern of residential vacancy rate in Nanning based on multi-source data and spatial analysis technology. However, due to the limitations of data, methods and analysis scale, the research results have certain uncertainties, which are as follows:
Data timeliness constraints. The Baidu Street View data used in the study only reflects the vacancy status at a single point in time in 2023, which makes it difficult to capture seasonal vacancy fluctuations (such as the Spring Festival homecoming rush) or short-term policy effects (such as the market response after the implementation of the “commercial to residential” policy). In addition, the image spatial resolution is limited (2048 × 1536 pixels), and the recognition accuracy of the balcony drying status of high-rise residential buildings is insufficient, which may lead to interpretation errors.
Methodological limitations. Subjectivity of manual interpretation: Despite the use of double-blind tests (ICC = 0.92) and a three-level review mechanism, there are still empirical differences in manual interpretation. For example, the judgment of “awning covered but not drying” may result in disagreements due to different perceptions of the judges, and when relying on “indoor light” to assist in judgment in areas with dense anti-theft nets, normal residences are easily misjudged as vacant. Challenges in the applicability of standards. In Nanning’s hot and humid climate, residents may reduce outdoor drying and use dryers, resulting in a decrease in the effectiveness of the “no drying” standard. In addition, “temporary vacancy” for short-term rental or renovation is difficult to distinguish from long-term vacancy, affecting statistical accuracy.
Sensitivity to spatial analysis scale. Impact of kernel density parameters: Bandwidth selection may smooth out drastic changes in local vacancy rates, such as the difference in vacancy rates between urban villages and adjacent areas of newly built communities [44]. Sample bias: The small sample size of remote counties (such as Mashan County, which has only 46 communities) may underestimate the vacancy characteristics of the urban-rural transition zone, affecting the accuracy of spatial autocorrelation analysis.
Static data limitations. Single point-in-time data cannot reveal the dynamic evolution of vacancy rates, such as changes in housing demand and the effects of policy regulation after the epidemic. Further analysis is required in combination with time series data (such as images from 2020 to 2023) [45].

5.3. Comparison and Verification with Other Studies

The sample average of Nanning’s housing vacancy rate in 2023 is 0.20, which is lower than that of similar provincial capital cities, reflecting the relative stability of the housing market, which is closely related to the city’s “multi-center” development model. The average vacancy rates in Xixiangtang District and Xingning District, traditional built-up areas, were 0.15 and 0.19, respectively. The old communities had a relatively low vacancy rate due to their stable residential structure, mature living facilities and strong rental demand, while some newly built blocks had relatively high vacancy rates due to lagging supporting facilities; the average vacancy rates in Liangqing District and Jiangnan District, emerging development areas, were 0.21 and 0.20, respectively. Among them, the vacancy rate of newly built commercial housing in Shajing Block of Jiangnan District reached 0.38 due to the temporal and spatial mismatch between infrastructure and population inflow, highlighting the structural contradiction of “concentrated spatial supply but lagging population inflow”; Mashan County, a remote county, had an overall vacancy rate of 0.25 due to its weak economic foundation, the highest among all regions. However, the shantytown renovation policy reduced the vacancy rate in some resettlement areas to 0.12–0.14; the riverside area of Hengzhou City relied on landscape resources to attract self-residence demand, with an overall vacancy rate of 0.20, the same as that of Jiangnan District.
In terms of technical methods, the correlation between street view imaging and night light remote sensing data reached 0.78 (p < 0.01), which can effectively reflect the spatial distribution of vacancy rates. For example, due to the opening of Metro Line 4, the vacancy rate in Wuxiang New District, Liangqing District, dropped by 0.05 in 2023 compared with 2020, verifying the role of traffic improvement in improving occupancy rates. Compared with Baidu’s positioning data, the Shajing section of the emerging development zone of Nanning City has formed a high vacancy agglomeration area due to lagging infrastructure, which is highly consistent with the “low population activity” area, while the vacancy rate of old communities in traditional built-up areas is maintained at a low level due to strong rental demand, which has nothing to do with the characteristics of “ghost towns”.
Different from Guangzhou’s “single-core agglomeration” model, Nanning’s “multi-center diffusion” pattern shows that the vacancy rate in emerging areas is high because planning is ahead of industry introduction, and the traditional areas show a “dual-core” feature of differentiation between new and old communities. The vacancy rate in remote suburban counties is significantly different due to the dual influence of economy and policy. This difference shows that multi-center cities need to focus on the integration of industry and city, avoid excessive reliance on land finance in emerging areas, and simultaneously promote the construction of supporting industries and public services. Traditional built-up areas can activate the rental market through urban renewal, and remote suburban counties need to rely on policies to guide reasonable housing demand to achieve a balance between housing supply and demand in the entire region.

5.4. Management Recommendations

Policy implications in this study refer to targeted planning interventions and management strategies derived from the spatial differentiation characteristics of housing vacancy rates. Its core goal is to optimize urban spatial resource allocation, balance housing supply and demand, and promote sustainable urban development by integrating urban planning, industrial layout, and public service allocation. For urban planners, these implications serve as operational guidelines to bridge the gap between research findings and practical governance, especially in addressing the “high vacancy-low efficiency” dilemma in underdeveloped areas.
Based on the spatial differentiation characteristics of vacancy rate in Nanning, a three-level governance strategy of “precise regulation, market activation, and technology empowerment” is proposed to build a long-term mechanism for housing vacancy governance of “short-term destocking, medium-term structural optimization, and long-term balance promotion”:
Accurately control housing supply and optimize spatial resource allocation. Stock digestion in the old city: Urban planners should prioritize compiling a “stock housing renovation plan” for Xixiangtang and Xingning Districts within 2024–2025. Specifically, identify 10–15 high-vacancy communities (e.g., Nanning Huayangcheng) and rezone 30% of their vacant housing as affordable housing in the urban master plan. Coordinate with the land and housing bureau to restrict new residential land supply in these areas until the vacancy rate drops below 15%. Industry-city integration in new districts: For emerging areas like Wuxiang New District, urban planners should establish a “1:1.2 job-housing ratio” in the detailed regulatory plan (2025–2030). Specifically, allocate 40% of the land along Metro Line 4 for digital economy industrial parks (completed by 2026) and match 50,000 sets of talent apartments (phased completion by 2027–2029). Collaborate with the industry bureau to sign at least 20 key enterprises before 2026 to ensure employment support for new housing.
Activate the vitality of the rental market and build a diversified supply system. Government-enterprise collaborative renovation model: Promote “government + enterprise” cooperation in old communities, and guide enterprises to convert vacant housing into guaranteed rental housing through financial subsidies (such as 300 yuan per square meter renovation subsidy). Refer to Guangzhou’s “renting and purchasing equal rights” policy to grant the children of tenants the qualification to attend nearby schools and enhance the attractiveness of rental housing. Urban village quality improvement plan: Implement “micro-renovation” in migrant population gathering areas such as Huqiu Village, improve infrastructure (such as installing elevators and building public drying areas), control the rental premium at 5–8%, and balance living quality and affordability.
Build a smart monitoring platform to strengthen dynamic control capabilities. Technology-enabled monitoring system: Urban planners should incorporate the “housing vacancy dynamic monitoring platform” into the smart city construction plan (2024). Demarcate 3-level early warning zones (red/yellow/green) based on vacancy rates in the urban spatial plan and link them to land supply quotas: for red zones (vacancy rate > 25%), suspend new residential land supply; for yellow zones (20–25%), require 30% of new housing to be built as rental housing. The platform should be updated quarterly to guide annual plan adjustments.

5.5. Theoretical and Practical Implications

This study verified the universality of street view image technology in the study of housing vacancy rates in subtropical cities through empirical analysis. Its 92% recognition accuracy is highly consistent with the research results of [16] in Guangzhou, providing a replicable methodological framework for similar cities. The study revealed that the housing vacancy problem in Nanning is essentially an external feature of unbalanced urban spatial development. The specific theoretical and practical values are as follows:
Theoretical innovation. The study expands the application boundary of the “housing filter theory” in the context of multi-center cities, and finds that the impact of policy-oriented spatial reconstruction on vacancy rates exceeds the single market filtering mechanism. Taking Mashan County as an example, although the shantytown renovation policy reduced the local vacancy rate to 0.12–0.14 in the short term through centralized resettlement, the long-term lag in industrial introduction in the county (the employment growth rate was less than 5%) caused the housing filtering mechanism to fail, and the overall vacancy rate still reached 0.25. This finding enriched the explanatory dimension of this theory in urban renewal in developing countries. Based on geographic detector analysis (q = 0.78), the study constructed a three-dimensional driving model of “population mobility-policy orientation-market supply and demand”: the “commuting-oriented” housing demand of migrant workers accounting for 32%, the policy intervention of shantytown renovation investment accounting for 18%, and the market supply changes of newly built commercial housing accounting for 32.1% from 2011 to 2023 formed an interactive effect, breaking through the traditional single-factor analysis framework and providing a new theoretical tool for the study of vacancy rates in multi-center cities.
Practical value. The study provides precise spatial decision-making basis for Nanning’s “14th Five-Year Housing Development Plan” (vacancy rate control target 18%). For high vacancy areas such as Liangqing District (0.21) in the emerging development zone and Shajing Block (0.38) in Jiangnan District, it is recommended to adjust the land supply strategy: reduce inefficient land transfer in traditional built-up areas (0.15 in Xixiangtang District and 0.19 in Xingning District), tilt the annual industrial supporting land use indicators to Wuxiang New District (increase by 20%), and simultaneously promote the construction of industrial parks and educational and medical facilities along Metro Line 4 to shorten the “work-residence separation” cycle. In terms of innovation of governance tools, the linkage strategy of “precise land supply + renting and purchasing + smart monitoring” is proposed: for newly built commercial housing high vacancy areas such as Shajing section in Jiangnan District (vacancy rate 0.38), the policy of “limiting housing prices and competitive construction” is implemented, requiring developers to hold 20% of their housing sources as affordable rental housing, and giving priority to the supply of industrial park employees; in floating population gathering areas such as Donggouling in Xingning District (the rental rate of migrant population exceeds 45%), the “government storage + state-owned enterprise operation” model is promoted, and the idle unit houses and resettlement houses in the old communities are transformed into “talent apartments + short-term rental stations” complexes to activate stock resources; A dynamic vacancy rate monitoring platform was built by integrating street view images (recognition accuracy 92%), water and electricity usage data (error rate ±3%) and POI points of interest, to achieve quarterly updates and three-level early warning responses (yellow warning: vacancy rate > 0.25, red warning: >0.35), providing technical support for precise regulation.

5.6. Limitations and Prospects

This study has room for improvement in the three dimensions of data, methods and scale. In the future, in-depth exploration is needed from the theoretical, technical and policy levels: research on the constraints of data timeliness and dynamic evolution. It is difficult to capture seasonal fluctuations in vacancy rates (such as temporary vacancy caused by the Spring Festival homecoming rush) and short-term policy effects (such as the market response after the implementation of the “commercial to residential” policy) based on single-point data (2023). In the future, it is necessary to build a time series image database from 2020 to 2023, combined with night light data (NPP-VIIRS) and water and electricity consumption data, to reveal the dynamic evolution of vacancy rates and provide empirical support for the “housing vacancy-urban shrinkage” theoretical framework.
Insufficient method integration and multi-source data fusion. Current research has not fully integrated multi-source heterogeneous data such as mobile phone signaling and POI points of interest. It is recommended to introduce a multi-agent model (ABM) to simulate the spatiotemporal coupling relationship between population mobility, policy intervention and housing vacancy. At the same time, a deep learning model based on Transformer and CNN is developed to achieve accurate prediction of vacancy rate and risk warning, breaking through the limitations of traditional spatial analysis methods.
Research on the scale effect and urban-rural transition zone. The sample size of remote suburban counties is small (Mashan County has only 46 communities), which limits the accuracy of urban-rural transition zone analysis. In the future, unmanned aerial vehicle remote sensing (UAV) can be used to obtain 0.1 m high-resolution images to build a multi-scale vacancy rate assessment system. On this basis, a policy simulation experiment of “differential vacancy tax collection” is carried out, setting gradient tax rates for old urban areas (0.5%), new areas (1.0%), and remote suburban counties (1.5%) to evaluate the effect of policy regulation.
Explore the nonlinear interactive relationship between “housing vacancy and urban shrinkage” and construct a vacancy evolution model suitable for multi-center cities; expand the “three-dimensional drive” theoretical framework and incorporate the impact of climate change (such as Nanning’s high temperature and high humidity climate) on the vacancy rate. Develop an air-ground collaborative remote sensing monitoring system that integrates satellite (GF-6), unmanned aerial vehicle (UAV) and street view image data; build a vacancy rate digital twin platform to achieve real-time simulation and dynamic optimization of policy implementation effects. Carry out a pilot project of “smart matching of vacant housing sources” in Nanning, and accurately match vacant housing sources with affordable housing needs through algorithms; establish a “vacancy tax flexible collection” mechanism to dynamically adjust the tax rate (0.5–1.5%) according to the regional vacancy rate to balance market stability and resource utilization efficiency.

6. Conclusions

This study takes Nanning as a typical case and attempts to construct a vacancy rate assessment method based on Baidu Street View residential exterior images. The method is not limited to local contexts. Its core logic—using street view images to capture visual vacancy features combining manual markup with deep learning and applying spatial analysis—can be adapted to other regions. The symbolized regional classification TBA EDA RSC also provides a replicable framework for studying urban residential vacancy in different contexts. It uses kernel density estimation, spatial autocorrelation analysis (Global Moran’s I, Local Moran’s I), Getis-Ord Gi * hotspot analysis, average nearest neighbor analysis and geographic detector model to explore the spatial pattern and driving mechanism of housing vacancy in multi-center cities in underdeveloped regions of China. The research method uses 2048 × 1536 pixel high-definition images to capture signs of living such as balcony drying and window status, and combines local processing rules for awning coverage and anti-theft net occlusion in subtropical climates to initially achieve a vacancy recognition accuracy of 92%. Compared with traditional night light remote sensing, water and electricity data and other methods, it shows certain advantages in spatiotemporal resolution, scene perception ability and multi-source data fusion (matching street view images with night lights and POI points of interest), providing an operational technical path for underdeveloped areas due to high data acquisition costs and limited traditional monitoring methods.
The study found that the weighted average residential vacancy rate in Nanning in 2023 was 0.20, showing an atypical spatial pattern of “stability in the old city, differentiation in the new area, and policy-driven in the suburbs”. This feature is highly correlated with the common contradiction of “rapid urbanization and insufficient industrial support” in underdeveloped areas. The traditional built-up areas of Xixiangtang District (0.15) and Xingning District (0.19) have relatively stable residential structures in old communities (with more than 70% of the residents being indigenous residents and long-term tenants), and thus have lower vacancy rates than the emerging development areas of Liangqing District (0.21) and Jiangnan District (0.20). The vacancy rate of the Shajing section in Jiangnan District reached 0.38 due to “temporal and spatial mismatch between infrastructure and population inflow”, reflecting the typical dilemma of “land finance dependence and imbalance between industry and city” in the development of new areas in underdeveloped regions. The remote county of Mashan had the highest vacancy rate of 0.25 among all regions due to its weak economic foundation and population outflow. Hengzhou City (0.20) relied on riverside resources to form local low vacancy areas (such as Yujiang Huating, 0.15), indicating that natural endowments still play an important regulatory role in the housing market in underdeveloped regions. Spatial autocorrelation analysis showed that the global Moran’s I index was 0.32 (p < 0.01). The “high-high” agglomeration areas were concentrated in the newly built commercial housing areas in the emerging development zones, which were significantly associated with the “work-residence separation” phenomenon. The “low-low” agglomeration areas included the old communities in the traditional built-up areas, the shantytown renovation areas in Mashan County, and the riverside belt in Hengzhou City, providing empirical support for analyzing the “policy-market-resource” multi-dimensional driving mechanism of the vacancy rate in multi-center cities in underdeveloped areas.
In theory, this study uses the interactive model of “population mobility-policy orientation-market supply and demand” constructed by geographic detectors (q = 0.78) to systematically verify for the first time the compound impact of policy intervention (such as shantytown renovation accounting for 18%), industrial layout (the occupancy rate of industrial parks in new districts is 65%) and population migration (32% of migrant workers’ “commuting-oriented” demand) on the vacancy rate in underdeveloped areas, filling the gap in the existing research on the analysis of the vacancy mechanism of multi-center cities in underdeveloped areas, and expanding the application boundary of the “housing filtering theory” in the context of cities in developing countries. In practice, the proposed strategy of “precise supporting facilities in new districts, classified regulation of old cities, and differentiated guidance in remote suburbs”, such as giving priority to improving the supporting facilities of the 15-min living circle in Shajing District and exploring the linkage model of “shantytown renovation + industrial park” in Mashan County, provides a reference for governance ideas for underdeveloped areas to solve the dilemma of “high vacancy-low efficiency”. In particular, the low-cost monitoring method based on street view images is more applicable to underdeveloped areas with limited data acquisition capabilities, and helps promote the refined and intelligent transformation of housing vacancy management in such areas.

Author Contributions

W.Z. (Weijia Zeng); methodology, W.Z. (Weijia Zeng), B.L., Y.H. and Y.F.; software, W.Z. (Weijia Zeng), W.L., Y.Z. and W.Z. (Weiran Zhang); formal analysis, W.Z. (Weijia Zeng) and Y.F.; investigation, W.L., Y.Z. and W.Z. (Weiran Zhang); resources, W.Z. (Weijia Zeng) and B.L.; data curation, Y.H. and W.L.; writing—original draft preparation, W.Z. (Weijia Zeng) and Y.H.; writing—review and editing, B.L., Y.H., W.L., Y.F., Y.Z. and W.Z. (Weiran Zhang); supervision, B.L. and Y.H.; project administration, B.L.; funding acquisition, W.Z. (Weijia Zeng). All authors have read and agreed to the published version of the manuscript.

Funding

This research was funded by Guangxi Innovation and Entrepreneurship Training Program for College Students (202510603320), the Research funding for the 2024 Green seedling Program of the Human Resources and Social Security Department of Guangxi Zhuang Autonomous Region, China (60203038919630213), Nanning Normal University Doctoral Research Startup Project (No. 602021239447).

Data Availability Statement

The original contributions presented in this study are included in the article. Further inquiries can be directed to the corresponding authors.

Conflicts of Interest

The authors declare no conflicts of interest.

References

  1. Wuyts, W.; Sedlitzky, R.; Morita, M.; Tanikawa, H. Understanding and managing vacant houses in support of a material stock-type society—The case of Kitakyushu, Japan. Sustainability 2020, 12, 5363. [Google Scholar] [CrossRef]
  2. Caramaschi, S.; Chiodelli, F. Reconceptualising housing emptiness beyond vacancy and abandonment. Int. J. Hous. Policy 2023, 23, 588–611. [Google Scholar] [CrossRef]
  3. Liu, T.Y.; Su, C.W.; Chang, H.L.; Chu, C.C. Is urbanization improving real estate investment? A cross-regional study of China. Rev. Dev. Econ. 2018, 22, 862–878. [Google Scholar] [CrossRef]
  4. Wigger, A. Housing as a site of accumulation in Amsterdam and the creation of surplus populations. Geoforum 2021, 126, 451–460. [Google Scholar] [CrossRef]
  5. Williams, S.; Xu, W.; Tan, S.B.; Foster, M.J.; Chen, C. Ghost cities of China: Identifying urban vacancy through social media data. Cities 2019, 94, 275–285. [Google Scholar] [CrossRef]
  6. Pan, J.; Dong, L. Spatial identification of housing vacancy in China. Chin. Geogr. Sci. 2021, 31, 359–375. [Google Scholar] [CrossRef]
  7. Flas, M.; Halleux, J.M.; Cools, M.; Teller, J. Identifying housing vacancy using data on registered addresses and domestic consumption. Hous. Stud. 2024, 39, 1317–1339. [Google Scholar] [CrossRef]
  8. Sayuda, K.; Hong, E.; Akiyama, Y.; Baba, H.; Tokudomi, T.; Akatani, T. Accuracy of vacant housing detection models: An empirical evaluation using municipal and national census datasets. Trans. GIS 2022, 26, 3003–3027. [Google Scholar] [CrossRef]
  9. Zou, Y.; Zhu, J.; Chen, D.; Liang, D.; Wei, W.; Cheng, W. A Study on Residential Community-Level Housing Vacancy Rate Based on Multi-Source Data: A Case Study of Longquanyi District in Chengdu City. Appl. Sci. 2025, 15, 3357. [Google Scholar] [CrossRef]
  10. Zhou, Y.; Xue, L.; Shi, Z.; Wu, L.; Fan, J. Measuring housing vitality from multi-source big data and machine learning. J. Am. Stat. Assoc. 2022, 117, 1045–1059. [Google Scholar] [CrossRef]
  11. Xin, X.; Liu, B.; Di, K.; Zhu, Z.; Zhao, Z.; Liu, J.; Yue, Z.; Zhang, G. Monitoring urban expansion using time series of night-time light data: A case study in Wuhan, China. In Remote Sensing of Night-Time Light; Routledge: Oxfordshire, UK, 2021; pp. 256–274. [Google Scholar]
  12. Niu, W.; Xia, H.; Wang, R.; Pan, L.; Meng, Q.; Qin, Y.; Li, R.; Zhao, X.; Bian, X.; Zhao, W. Research on large-scale urban shrinkage and expansion in the Yellow River affected area using night light data. ISPRS Int. J. Geo-Inf. 2020, 10, 5. [Google Scholar] [CrossRef]
  13. Zheng, Q.; Seto, K.C.; Zhou, Y.; You, S.; Weng, Q. Nighttime light remote sensing for urban applications: Progress, challenges, and prospects. ISPRS J. Photogramm. Remote Sens. 2023, 202, 125–141. [Google Scholar] [CrossRef]
  14. Du, M.; Wang, L.; Zou, S.; Shi, C. Modeling the census tract level housing vacancy rate with the Jilin1-03 satellite and other geospatial data. Remote Sens. 2018, 10, 1920. [Google Scholar] [CrossRef]
  15. Mao, L.; Zheng, Z.; Meng, X.; Zhou, Y.; Zhao, P.; Yang, Z.; Long, Y. Large-scale automatic identification of urban vacant land using semantic segmentation of high-resolution remote sensing images. Landsc. Urban Plan. 2022, 222, 104384. [Google Scholar] [CrossRef]
  16. Yue, X.; Wang, Y.; Zhao, Y.; Zhang, H. Estimation of urban housing vacancy based on daytime housing exterior images—A case study of Guangzhou in China. ISPRS Int. J. Geo-Inf. 2022, 11, 349. [Google Scholar] [CrossRef]
  17. He, N.; Li, G. Urban neighbourhood environment assessment based on street view image processing: A review of research trends. Environ. Chall. 2021, 4, 100090. [Google Scholar] [CrossRef]
  18. Zhang, F.; Yu, L.I.U. Street view imagery: Methods and applications based on artificial intelligence. Natl. Remote Sens. Bull. 2021, 25, 1043–1054. [Google Scholar] [CrossRef]
  19. Kang, Y.; Zhang, F.; Gao, S.; Lin, H.; Liu, Y. A review of urban physical environment sensing using street view imagery in public health studies. Ann. GIS 2020, 26, 261–275. [Google Scholar] [CrossRef]
  20. Shen, Q.; Zeng, W.; Ye, Y.; Arisona, S.M.; Schubiger, S.; Burkhard, R.; Qu, H. StreetVizor: Visual exploration of human-scale urban forms based on street views. IEEE Trans. Vis. Comput. Graph. 2017, 24, 1004–1013. [Google Scholar] [CrossRef]
  21. Zou, S.; Wang, L. Detecting individual abandoned houses from google street view: A hierarchical deep learning approach. ISPRS J. Photogramm. Remote Sens. 2021, 175, 298–310. [Google Scholar] [CrossRef]
  22. Zhang, L.; Pei, T.; Wang, X.; Wu, M.; Song, C.; Guo, S.; Chen, Y. Quantifying the urban visual perception of Chinese traditional-style building with street view images. Appl. Sci. 2020, 10, 5963. [Google Scholar] [CrossRef]
  23. Tan, Z.; Wei, D.; Yin, Z. Housing vacancy rate in major cities in China: Perspectives from nighttime light data. Complexity 2020, 2020, 5104578. [Google Scholar] [CrossRef]
  24. Zhang, Y.; Cheng, L.; Zhang, H.; Lee, F. The dynamic evaluation of water resources security of Guangxi province in China based on the modified water resources ecological footprint model. In Advanced Engineering and Technology II: Proceedings of the 2nd Annual Congress on Advanced Engineering and Technology (CAET 2015), Hong Kong, China, 4–5 April 2015; CRC Press: Boca Raton, FL, USA, 2015; p. 161. [Google Scholar]
  25. Bi, S. Cooperation between China and ASEAN under the building of ASEAN Economic Community. J. Contemp. East Asia Stud. 2021, 10, 83–107. [Google Scholar] [CrossRef]
  26. Yang, Y.; Li, Z. The First Development Decade of the Network of ASEAN–China Think-tanks: Review and Prospects. East Asian Policy 2024, 16, 99–113. [Google Scholar] [CrossRef]
  27. Schiller, G.; Roscher, J. Impact of urbanization on construction material consumption: A global analysis. J. Ind. Ecol. 2023, 27, 1021–1036. [Google Scholar] [CrossRef]
  28. Quinn, T.; Bousquet, F.; Guerbois, C. Changing places: The role of sense of place in perceptions of social, environmental and overdevelopment risks. Glob. Environ. Chang. 2019, 57, 101930. [Google Scholar] [CrossRef]
  29. Quium, A.A. Transport corridors for wider socio–economic development. Sustainability 2019, 11, 5248. [Google Scholar] [CrossRef]
  30. Keser, H.Y. Importance of transport corridors in regional development: The case of TRACECA. Sosyoekonomi 2015, 23, 163–182. [Google Scholar]
  31. Moran, P.A. The interpretation of statistical maps. J. R. Stat. Soc. Ser. B Stat. Methodol. 1948, 10, 243–251. [Google Scholar] [CrossRef]
  32. Westerholt, R. A simulation study to explore inference about global Moran’s I with random spatial indexes. Geogr. Anal. 2023, 55, 621–650. [Google Scholar] [CrossRef]
  33. Sheather, S.J.; Jones, M.C. A reliable data-based bandwidth selection method for kernel density estimation. J. R. Stat. Soc. Ser. B Stat. Methodol. 1991, 53, 683–690. [Google Scholar] [CrossRef]
  34. Buquet, J.; Zhang, J.; Roulet, P.; Thibault, S.; Lalonde, J.F. Evaluating the impact of wide-angle lens distortion on learning-based depth estimation. In Proceedings of the IEEE/CVF Conference on Computer Vision and Pattern Recognition, Nashville, TN, USA, 20–25 June 2021; pp. 3693–3701. [Google Scholar]
  35. Huang, L.; Chen, C.; Shen, H.; He, B. Adaptive registration algorithm of color images based on SURF. Measurement 2015, 66, 118–124. [Google Scholar] [CrossRef]
  36. Fu, Y.; Zhang, M.; Xu, X.; Cao, Z.; Ma, C.; Ji, Y.; Zuo, K.; Lu, H. Partial feature selection and alignment for multi-source domain adaptation. In Proceedings of the IEEE/CVF Conference on Computer Vision and Pattern Recognition, Nashville, TN, USA, 20–25 June 2021; pp. 16654–16663. [Google Scholar]
  37. Wen, B.; Li, C.; Zhu, H. A Reliability Analysis Model based on Time Alignment of Multi-source Data. In Proceedings of the 2024 Global Reliability and Prognostics and Health Management Conference (PHM-Beijing), Beijing, China, 11–13 October 2024; IEEE: New York, NY, USA; pp. 1–5. [Google Scholar]
  38. He, K.; Zhang, X.; Ren, S.; Sun, J. Deep residual learning for image recognition. In Proceedings of the IEEE Conference on Computer Vision and Pattern Recognition, Las Vegas, NV, USA, 27–30 June 2016; pp. 770–778. [Google Scholar]
  39. GB50180-2018; Urban Residential Area Planning and Design Standard. Ministry of Housing and Urban-Rural Development of the People’s Republic of China: Beijing, China, 2018.
  40. Wu, H.; Wang, L.; Zhang, Z.; Gao, J. Analysis and optimization of 15-minute community life circle based on supply and demand matching: A case study of Shanghai. PLoS ONE 2021, 16, e0256904. [Google Scholar] [CrossRef] [PubMed]
  41. Xiang, L.; Wang, S.; Zou, L. Research on”5–10–15 Minutes Life Circle”Planning in Urban Boundary Based on Landscape—Led Method—A Case Study in Beiqiao Town, Xiangcheng District, Suzhou. In Proceedings of the International Conference on Sustainable Buildings and Structures Towards a Carbon Neutral Future, Suzhou, China, 17–20 August 2023; Springer Nature: Singapore, 2024; pp. 325–343. [Google Scholar]
  42. Odell, P.R. Book review: Regional development policy: A case study of Venezuela by J. Friedmann, MIT Press, 1966, pp. 279, 64/-. Urban Stud. 1967, 4, 309–311. [Google Scholar] [CrossRef]
  43. Lee, J.; Li, S. Extending Moran’s index for measuring spatiotemporal clustering of geographic events. Geogr. Anal. 2017, 49, 36–57. [Google Scholar] [CrossRef]
  44. Kerpicci, M.; Ozkan, H.; Kozat, S.S. Online anomaly detection with bandwidth optimized hierarchical kernel density estimators. IEEE Trans. Neural Netw. Learn. Syst. 2020, 32, 4253–4266. [Google Scholar] [CrossRef]
  45. Serra, A.P.; Zárate, L.E. Characterization of time series for analyzing of the evolution of time series clusters. Expert Syst. Appl. 2015, 42, 596–611. [Google Scholar] [CrossRef]
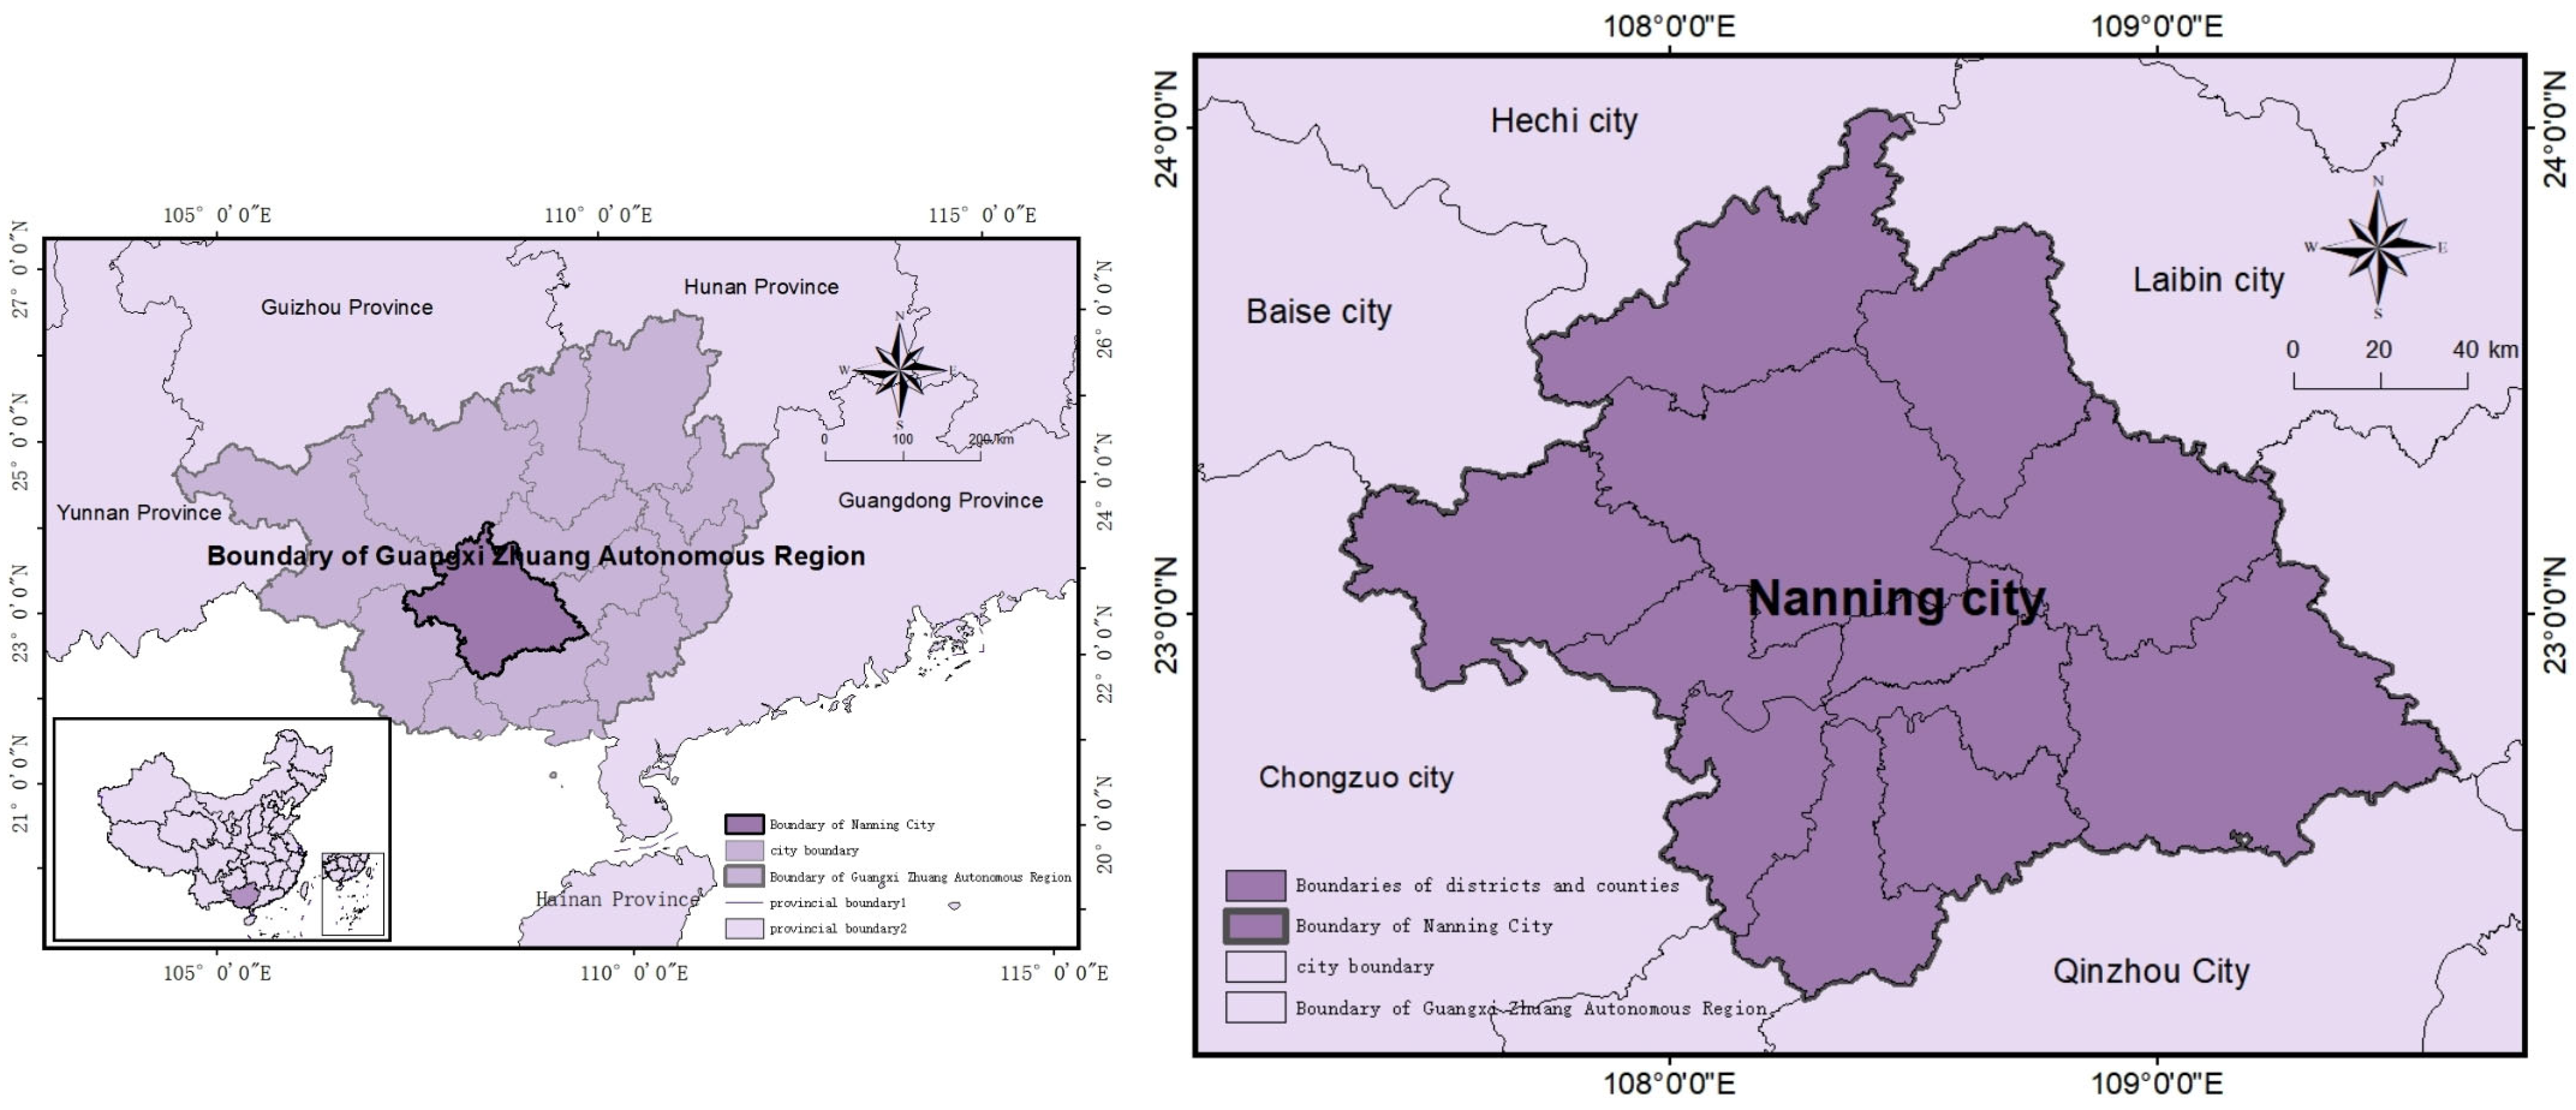
Figure 1. Map of Nanning City.
Algorithms 18 00500 g001
Figure 2. Spatial distribution characteristics of sample points.
Algorithms 18 00500 g002
Figure 3. Examples of “balcony drying status” (a) The blue box locks a balcony without drying marks. (b) The blue box locks a balcony with drying marks).
Algorithms 18 00500 g003
Figure 4. Examples of “window and curtain status” (a) The blue box locks an open balcony. (b) The blue box locks a closed balcony).
Algorithms 18 00500 g004
Figure 5. Flowchart of building vacancy rate determination process.
Algorithms 18 00500 g005
Figure 6. Examples of “awning coverage and drying status” (a) The blue box locks an area where the awning is covered and without drying marks. (b) The blue box locks an area where the awning is not covered and with drying marks).
Algorithms 18 00500 g006
Figure 7. Flowchart of image classification workflow for residential street view images. In this flowchart, purple boxes represent manual operation steps; blue boxes represent machine processing steps; and uncolored boxes represent situation classification steps.
Algorithms 18 00500 g007
Figure 8. Three-dimensional spatial pattern of residential vacancy rate in Nanning.
Algorithms 18 00500 g008
Figure 9. Spatial distribution map of residential vacancy rate IDW interpolation analysis in Nanning.
Algorithms 18 00500 g009
Figure 10. Kernel density analysis maps of population density, residential vacancy rate and road network density in Nanning.
Algorithms 18 00500 g010
Figure 11. Population density distribution map of Nanning in 2020.
Algorithms 18 00500 g011
Figure 12. Street view image of Zhonghai Yue Mansion.
Algorithms 18 00500 g012
Figure 13. Zhongxi Sun Bay street view image.
Algorithms 18 00500 g013
Figure 14. Street view of Huqiu Village.
Algorithms 18 00500 g014
Figure 15. Street view of Hongfu Building.
Algorithms 18 00500 g015
Figure 16. Street view of Wanda Huafu.
Algorithms 18 00500 g016
Disclaimer/Publisher’s Note: The statements, opinions and data contained in all publications are solely those of the individual author(s) and contributor(s) and not of MDPI and/or the editor(s). MDPI and/or the editor(s) disclaim responsibility for any injury to people or property resulting from any ideas, methods, instructions or products referred to in the content.