Article

SPL-YOLOv8: A Lightweight Method for Rape Flower Cluster Detection and Counting Based on YOLOv8n

by
Yue Fang
,
Chenbo Yang
,
Jie Li
and
Jingmin Tu
*
Hubei Key Laboratory for High-Efficiency Utilization of Solar Energy and Operation Control of Energy Storage System, Hubei University of Technology, Wuhan 430068, China
*
Author to whom correspondence should be addressed.
Algorithms 2025, 18(7), 428; https://doi.org/10.3390/a18070428
Submission received: 23 April 2025 / Revised: 9 July 2025 / Accepted: 9 July 2025 / Published: 11 July 2025
(This article belongs to the Section Analysis of Algorithms and Complexity Theory)

Abstract

The flowering stage is a critical phase in the growth of rapeseed crops, and non-destructive, high-throughput quantitative analysis of rape flower clusters in field environments holds significant importance for rapeseed breeding. However, detecting and counting rape flower clusters remains challenging in complex field conditions due to their small size, severe overlapping and occlusion, and the large parameter sizes of existing models. To address these challenges, this study proposes a lightweight rape flower clusters detection model, SPL-YOLOv8. First, the model introduces StarNet as a lightweight backbone network for efficient feature extraction, significantly reducing computational complexity and parameter counts. Second, a feature fusion module (C2f-Star) is integrated into the backbone to enhance the feature representation capability of the neck through expanded spatial dimensions, mitigating the impact of occluded regions on detection performance. Additionally, a lightweight Partial Group Convolution Detection Head (PGCD) is proposed, which employs Partial Convolution combined with Group Normalization to enable multi-scale feature interaction. By incorporating additional learnable parameters, the PGCD enhances the detection and localization of small targets. Finally, channel pruning based on the Layer-Adaptive Magnitude-based Pruning (LAMP) score is applied to reduce model parameters and runtime memory. Experimental results on the Rapeseed Flower-Raceme Benchmark (RFRB) demonstrate that the SPL-YOLOv8n-prune model achieves a detection accuracy of 92.2% in Average Precision (AP50), comparable to SOTA methods, while reducing the giga floating point operations per second (GFLOPs) and parameters by 86.4% and 95.4%, respectively. The model size is only 0.5 MB and the real-time frame rate is 171 fps. The proposed model effectively detects rape flower clusters with minimal computational overhead, offering technical support for yield prediction and elite cultivar selection in rapeseed breeding.

1. Introduction

Rapeseed (Brassica napus L.), a globally vital oilseed crop, serves as a primary source of edible vegetable oil and plant protein, holding significant agricultural importance. China, the world’s leading rapeseed producer, contributes approximately 30% of the global cultivation area and total output [1]. However, escalating demand has driven external dependence rates to nearly 70%, posing substantial risks to national food security and exacerbating the supply-demand imbalance for vegetable oils [2]. Cultivating elite rapeseed varieties is critical for enhancing yield and addressing these challenges, underscoring the urgency for advanced breeding strategies to ensure sustainable agricultural productivity.
Field-based phenotypic analysis plays a critical role in evaluating plant performance during crop breeding [3,4]. High-throughput phenotyping enables timely and accurate acquisition of growth and developmental data, facilitating optimized field management decisions for rapeseed.
Rapeseed yield is dominated by three factors: seed number per pod, pod number and grain weight. Pod retention rate at maturity is one of the key influencing factors [5], and pod retention rate is mainly restricted by flowering time and inflorescence number [6]. Therefore, the flowering time of rapeseed had a significant effect on yield [7,8]. Although some studies have determined the correlation between the duration of flowering stage [9], the density of full flowering stage [10], and the canopy coverage rate with seed yield and quality [11], there is a lack of methods to accurately quantify rapeseed inflorescence clusters. Traditional field counting relies on manual observation, which is inefficient and subjective. In the field of breeding and yield prediction, accurate counting of rapeseed inflorescences is very critical, especially in the density of full flowering stage, the number of inflorescences and flowering time directly affect the pod retention rate and then affect the yield. Therefore, in order to improve the accuracy of breeding and provide a reliable basis for yield prediction models, it is urgent to develop automated and non-destructive techniques for inflorescence quantification.
The application of satellite remote sensing technology in agriculture has become a trend [12]. It can acquire multi-spectral crop information over large areas at different times and spaces without damaging crop structures, and is widely used in precision agriculture, yield prediction, and other fields [13,14]. It has also been successfully applied to rapeseed monitoring. For example, D’Andrimont [10] et al. combined optical and radar images captured by satellites to estimate flowering time, while Han [9] et al. used Landsat-8 and Sentinel-1/2 to monitor flowering characteristics. Sun [15] et al. extracted traits from multi-spectral and LiDAR data to predict wheat yield and grain protein content. However, the low spatial resolution and temporal frequency of satellite images limit their development in precision agriculture, potentially leading to missed flowering times and difficulties in counting small objects such as rapeseed inflorescences from low-resolution images. Although multi-spectral data can provide extensive plant information and aid in phenotypic analysis, its acquisition is heavily influenced by weather conditions. The inconsistent flowering times of different rapeseed varieties and the rapid changes in rapeseed flower conditions in the field further limit the feasibility of multi-spectral data collection. Therefore, a convenient and high-throughput method for rapeseed inflorescence counting is crucial for rapeseed breeding.
Unmanned aerial vehicle (UAV) RGB imaging technology has become a research and application hotspot due to its flexibility, real-time capability, and high resolution [16,17]. Counting methods based on density estimation are widely used in these studies. They count objects by estimating their density in images. For example, Xue’s [18] TasselNetV2++ uses a dual-branch network with multi-scale feature fusion to enhance feature extraction across various scenarios. This method achieved an RMSE reduction of over 8.0% on datasets including soybean seedlings, wheat spikes, corn ears, and sorghum heads. These techniques don’t require precise detection and localization of each object, giving them an advantage when dealing with densely distributed targets. However, they lack information on the position of counted objects, which means they can’t reflect the geometric information of targets like wheat spikes. This limits their application in precision agriculture.
To solve this problem, detection-based counting methods have gained research attention. These methods count objects by precisely detecting and locating them, providing additional positional and geometric information. For instance, Zhang [19] evaluated the SwinT-YOLO method on a corn tassel dataset, achieving a detection accuracy of 95.11% and demonstrating its potential for real-time corn tassel detection in field conditions. Bai [20] used UAV RGB images to count rice plants, Yadav [21] identified volunteer cotton plants in cornfields via UAV RGB imagery, Zheng [22] successfully detected and counted citrus trees using a UAV platform, and Qian [23] developed a multi-scale feature enhancement network for wheat spike detection and counting in complex scenes, constructing a dense wheat spike dataset with UAV-acquired data. Against the backdrop of continuous advancements in computer vision technology and the growing demand for precision agriculture applications, research on rape flower clusters monitoring and counting has achieved significant progress [7]. Currently, automatic recognition and counting of rapeseed flower clusters have been successfully realized. However, existing models have revealed a critical issue in practical applications: their high complexity has not yet met lightweight standards. As a result, these models require substantial computational resources for deployment and operation, limiting their widespread adoption in agricultural settings.
Detecting rape flower clusters in UAV orthophoto mosaics presents challenges due to their small size, which provides insufficient feature information for recognition. Frequent occlusion between rapeseed inflorescences often leads to missed detections and inaccurate localization [7]. Field edge computing devices have limited processing power, making it crucial to balance computational cost and real-time monitoring capabilities. Scholars have extensively studied lightweight detection technologies for crop phenotyping in large-field environments. The YOLOv8 [24] model stands out for its exceptional accuracy and rapid detection speed, capable of recognizing multiple object types in high-resolution images. Inspired by this, this paper proposes the SPL-YOLOv8 detection model (where “SPL” represents the initials of the three improvements in the model: “S” for “StarNet”, “P” for “PGCD”, and “L” for “Lamp”). The model significantly enhances the efficiency of rapeseed inflorescence detection through three key strategies by making major improvements to the backbone and neck of the YOLOv8 network. The main contributions of this paper are as follows:
(1) StarNet lightweight backbone network is proposed: as the backbone network of the model, StarNet significantly reduces the computational complexity and the amount of parameters by optimizing the network structure, while maintaining efficient feature extraction ability, which provides a strong basic support for subsequent detection tasks.
(2) Design C2f-Star feature fusion module: by extending the spatial dimension of features, the C2f-Star module enhances the feature expression ability, effectively reduces the impact of occlusion and overlap on detection performance, and significantly improves the adaptability and robustness of the model in complex scenes.
(3) PGCD lightweight detection head is proposed: the PGCD detection head combines partial convolution and group normalization technology to achieve efficient interaction of multi-scale features, which significantly improves the detection and localization ability of small objects (such as rape flower clusters). At the same time, the model performance is further optimized by introducing a small number of learnable parameters.

2. Data and Methods

2.1. Dataset

2.1.1. Dataset Construction

The dataset used in this study is the Rape Flower Rectangular Box (RFRB [7]) dataset, which was constructed through the following process: Firstly, images were captured by a Phantom 4 Pro V2.0 unmanned aerial vehicle (UAV) from February to May 2021 over experimental fields in Wuhan, Hubei Province, China. The experimental fields were planted with winter rapeseed and consisted of 252 small plots, each with an area of either 8 m2 (2 m × 4 m) or 6 m2 (2 m × 3 m), all managed under the same field management regime. The images were acquired between 11:00 and 13:00 under natural light conditions, with a fixed flight height, a flight speed of 1.9 m/s, and overlap rates of 75% for both the flight path and side overlaps to obtain high-quality images of rapeseed flower clusters.
Figure 1 illustrates the distribution of the center points (x, y), widths, and heights of the rectangular boxes. The center points (x, y) are relatively uniformly distributed across the image, indicating a lack of distinct target concentration areas and a more dispersed distribution. The widths and heights are predominantly concentrated within smaller numerical ranges, with the heights exhibiting a near-normal distribution around a mean value, while the widths have a broader distribution but are still predominantly small. This suggests that the dataset contains targets of varying sizes, with most being relatively small and randomly positioned without significant spatial clustering. The collected images underwent screening and preprocessing. Images of poor quality due to incident light effects were removed. The remaining images were stitched together based on the geographic location of the site to form a site image with a resolution of 40,485 × 27,129. Plot images with resolutions ranging from 606 × 1105 to 672 × 1266 were then cropped according to actual ground dimensions. Rapeseed flower clusters were annotated using the rectangular box annotation technique with the open-source annotation tool LabelImg, resulting in the RFRB dataset. The minimum and maximum number of rapeseed flower clusters in the dataset were 8 and 686, respectively, with a median of 297 and a mean of 310. To enhance data diversity, brightness and contrast adjustments were applied to the images to simulate the effects of different weather conditions on image brightness.

2.1.2. Dataset Splitting

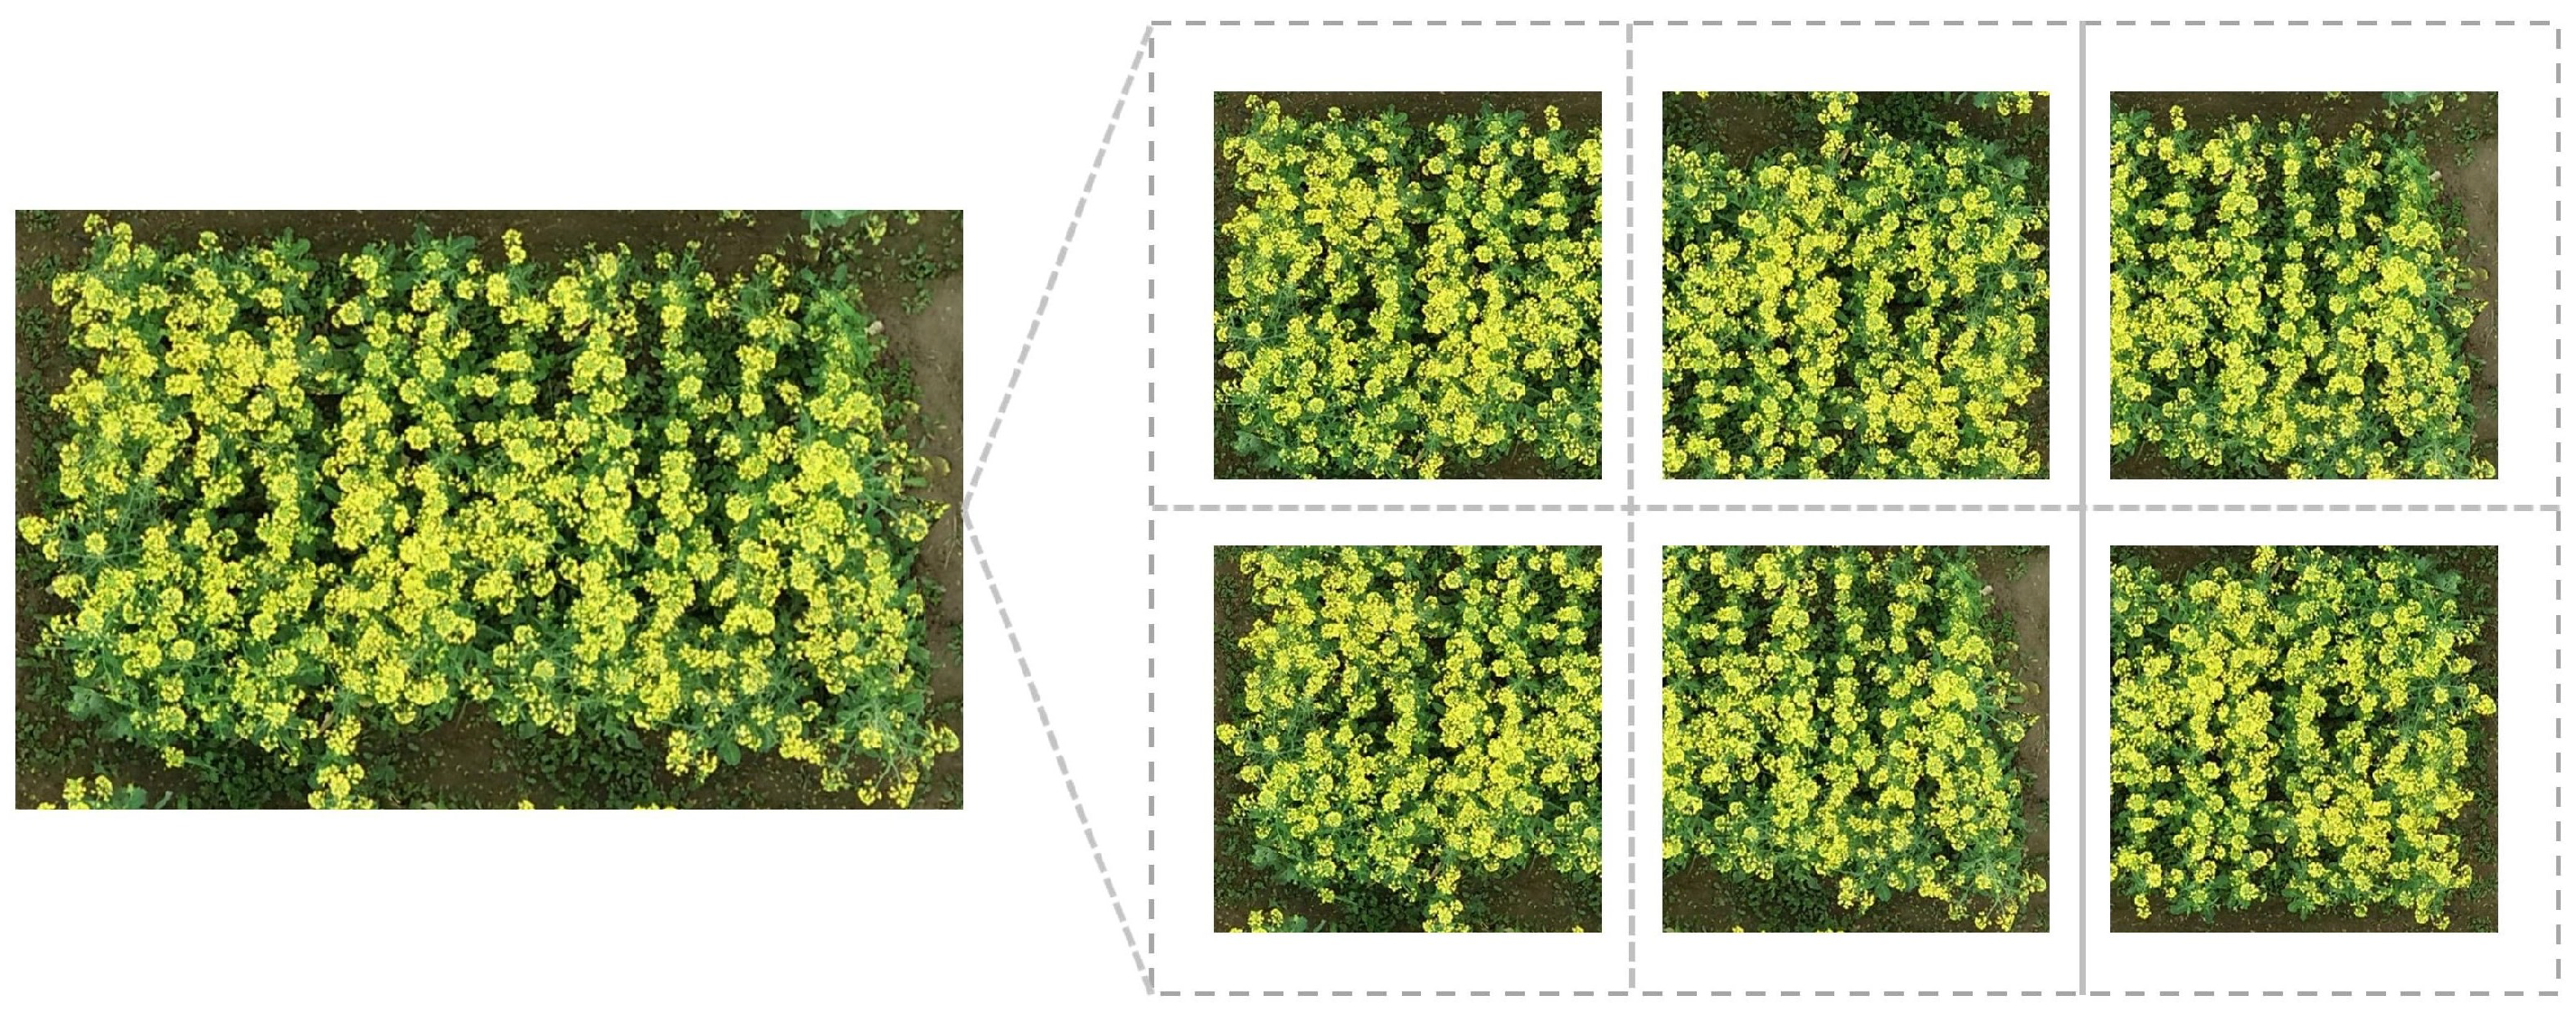
When using the original dataset for training and validation, the detection results fell short of expectations. Analysis revealed the following issues: When capturing images at longer distances, rapeseed flower clusters occupy a smaller proportion of the total image pixels. Moreover, when images taken from longer distances are input into the model, those larger than 640 × 640 pixels are compressed to 640 × 640, reducing the visible rapeseed flower pixels. Additionally, variations in plot sizes within the original dataset lead to inconsistent image dimensions and an imbalanced data distribution. To solve this problem, we first randomly divided the original data set into training, validation, and test sets with a 7:2:1 ratio, and then expanded each partitioned data set into the following overlapping 640 × 640 pixel blocks. This approach can balance the class data, increase the sample size to prevent overfitting, and enhance the generalization ability of the model across different regions. The augmented dataset labels are illustrated in Figure 2.

2.2. Methods

2.2.1. YOLOv8 Network

YOLOv8n [24], the most lightweight version of the YOLOv8 series, is designed for efficient object detection in resource-constrained environments. Its network architecture, optimized and simplified while retaining the core strengths of YOLOv8, achieves an optimal balance between speed and accuracy. Typically set to an input size of 640 × 640 pixels, YOLOv8n can process standard-resolution image data for various applications. For feature extraction, it uses a highly efficient convolutional neural network architecture with carefully designed convolutional and pooling layers to extract and fuse features across different scales, ensuring accurate object identification and localization. Despite its relatively simple structure, YOLOv8n delivers satisfactory detection performance, especially in real-time applications with strict computational and speed requirements. Additionally, it is highly scalable and can be further optimized and customized for different object detection tasks.

2.2.2. Overall Architecture of the SPL-YOLOv8 Model

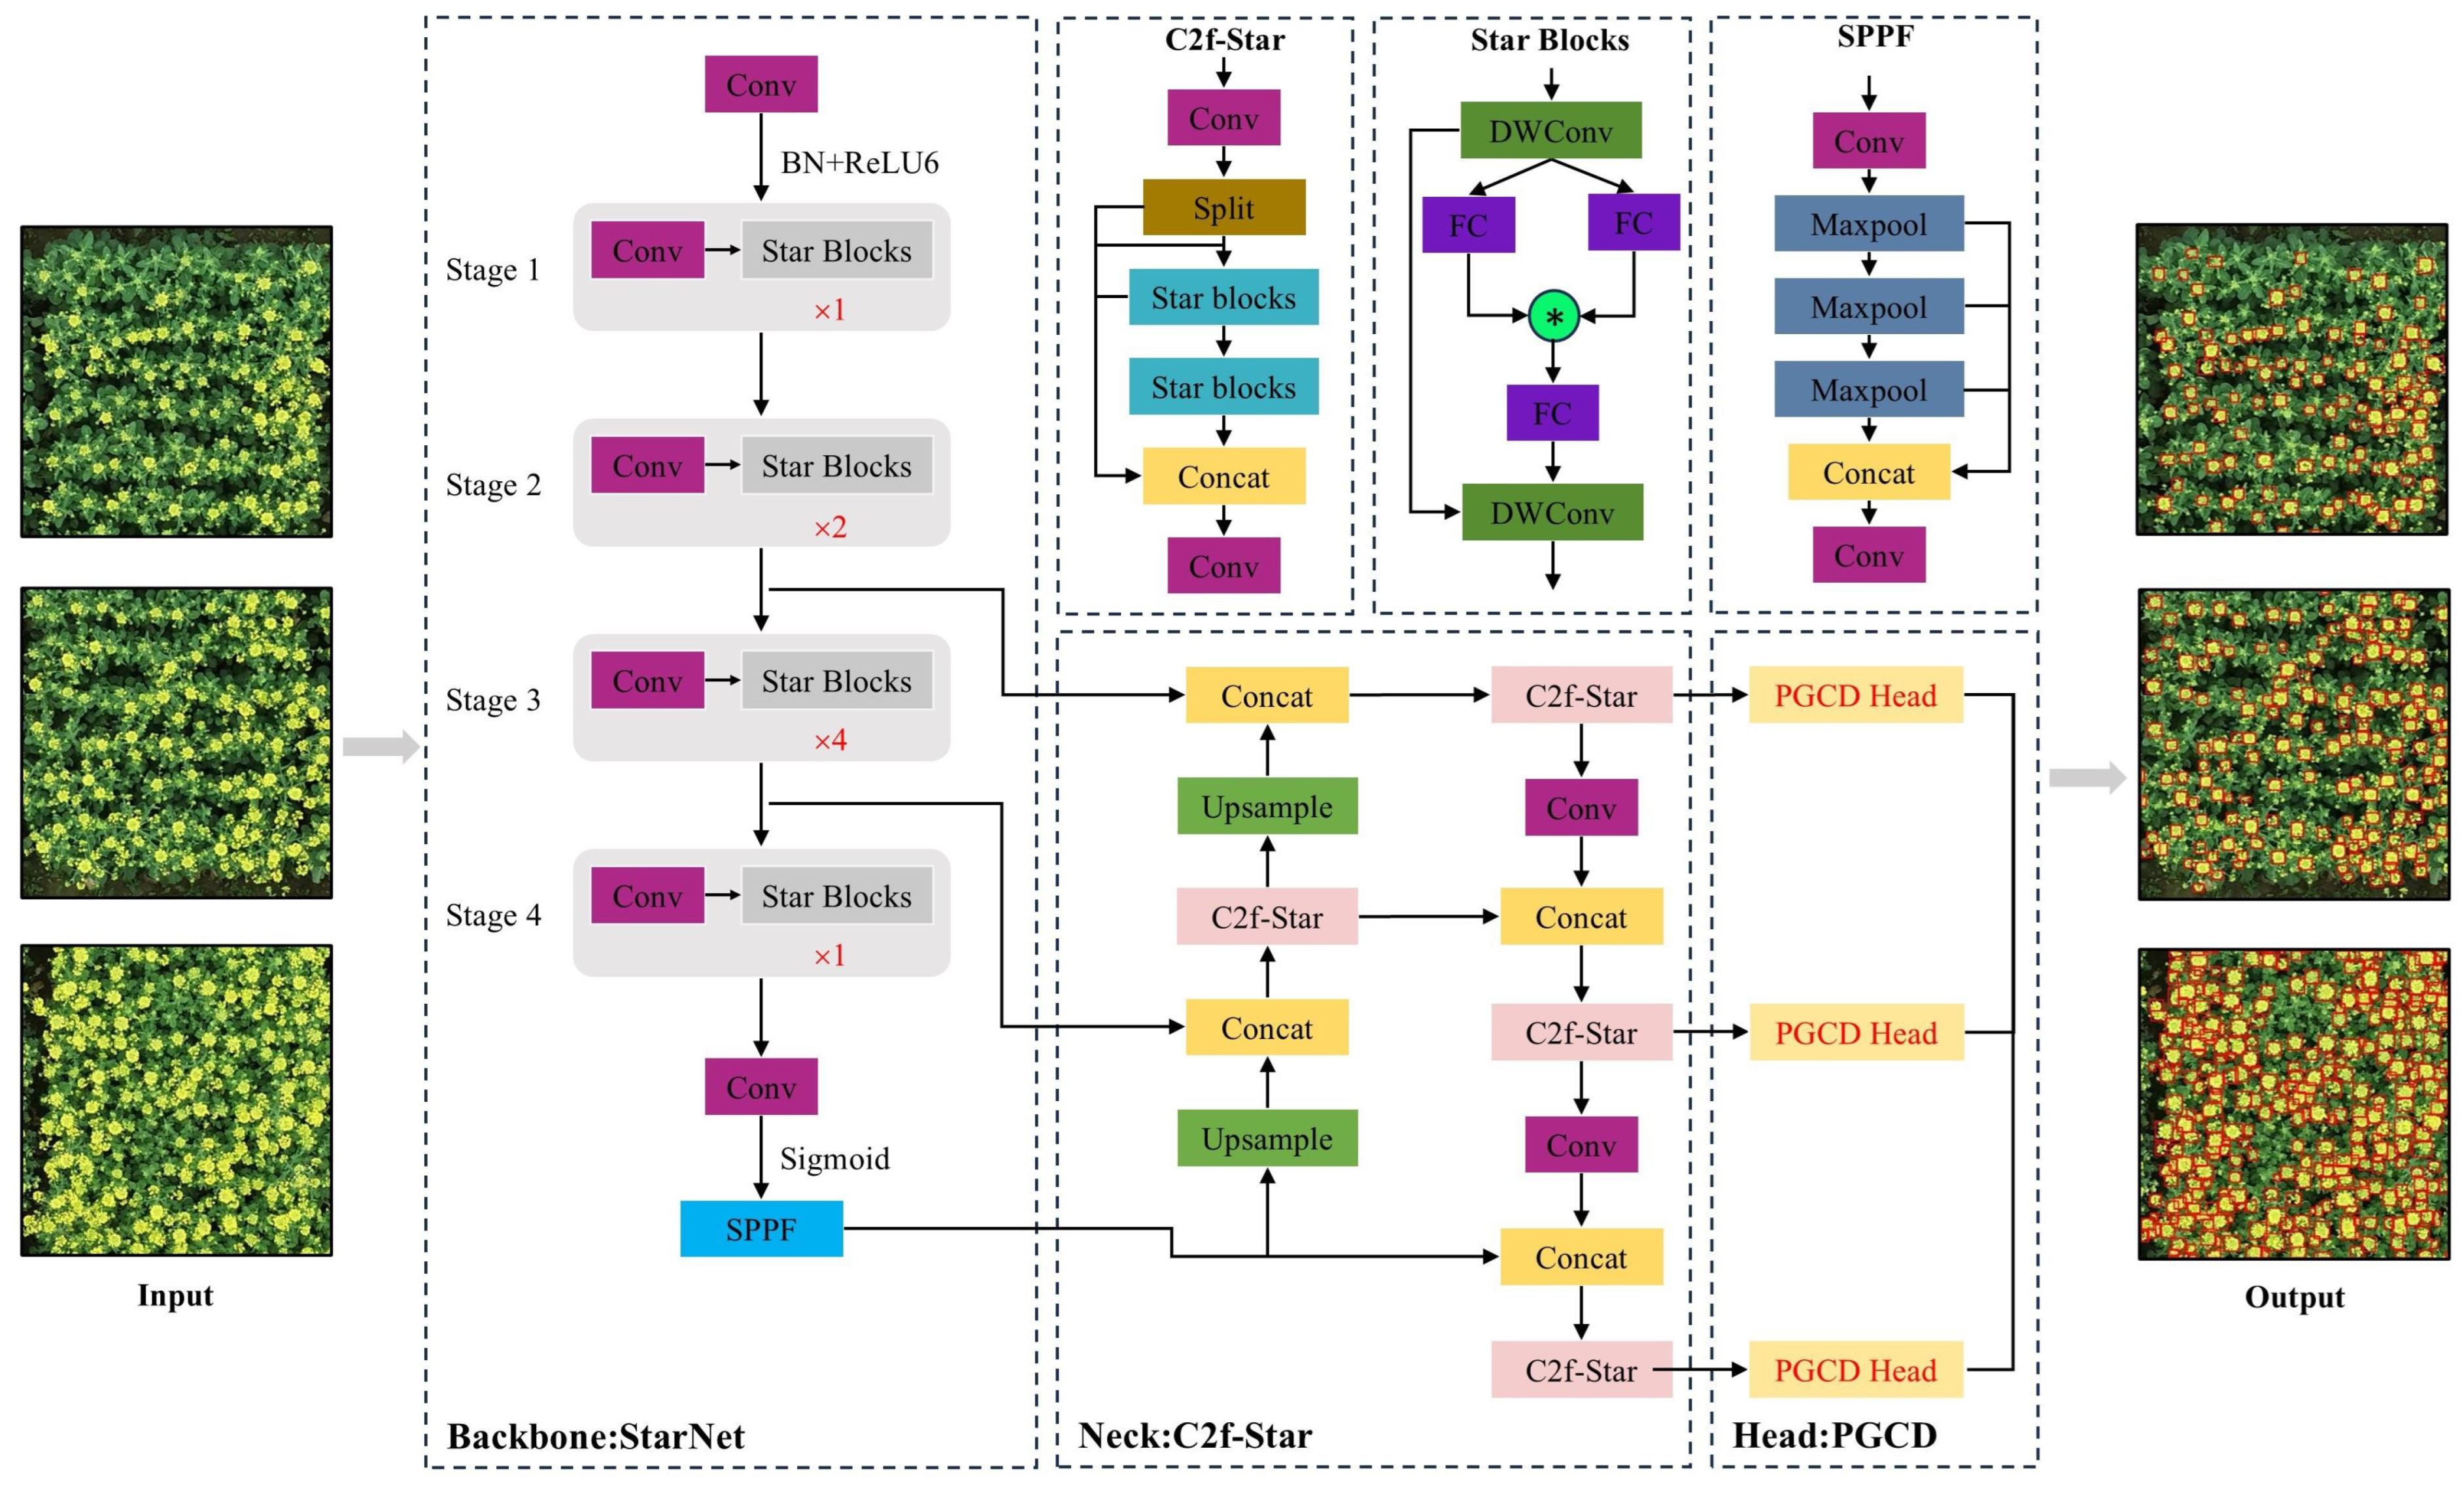
YOLOV8 has shown high detection performance on many datasets. However, the detection performance of YOLOV8 is not very good on the dataset of rape flower with dense distribution, severe occlusion and small target characteristics. To solve this problem and improve the performance of rape flower detection and counting, we choose to improve YOLOV8 based on it and design SPL-YOLOV8. The SPL-YOLOv8 network consists of a backbone network, a spatially enhanced Neck network, and a shared detail-enhanced convolutional detection head.
First, StarNet [25] is introduced as the backbone network, efficiently extracting target features while significantly reducing computational complexity and parameter count. Second, the C2f-Star [26] module is used to increase the feature space dimension, enhancing the Neck’s feature extraction capabilities and improving detection accuracy, particularly in dense areas with severe occlusion. Finally, to better capture small targets like rapeseed flowers, a lightweight shared detail-enhanced convolutional detection head is proposed. This head uses Partial Conv combined with Group Normalization for multi-scale feature interaction, increasing learnable parameters to improve detection and localization of small objects. Figure 3 illustrates the overall structure of the SPL-YOLOV8 network.

2.2.3. StarNet Backbone Network

The backbone network is a crucial component of the model, significantly impacting parameter count and performance. YOLO models are renowned for their efficiency and accuracy in object detection tasks, thanks to their backbone networks that combine linear projections, non-linear activation functions, and self-attention mechanisms. However, these networks often suffer from high computational complexity and reduced efficiency. To address this, we selected the novel StarNet [25] backbone network. StarNet innovatively uses star-shaped operations to efficiently fuse and interact feature maps, enhancing feature attention and extraction without significantly increasing computations. This makes it superior to traditional self-attention mechanisms that involve complex matrix operations. Star-shaped operations in StarNet fuse features through element-wise multiplication of two linearly transformed features, as shown in the formula below:
O star = W 1 T X W 2 T X W = W B X = X I
In the equations: O star is the result after the star operation, W is the weight matrix of the linear layer, B is the bias of the linear layer, X is the input, ∗ denotes the star operation. Based on Equation (1), we define ω 1 , ω 2 , x R ( c + 1 ) × 1 , where c is the number of input channels. The star operation can then be further expressed as:
w 1 T x w 2 T x
= i = 1 d + 1 w 1 i x i j = 1 d + 1 w 2 j x j
= i = 1 d + 1 j = 1 d + 1 w 1 i w 2 j x i x j
= α ( 1 , 1 ) x 1 x 1 + + α ( 4 , 5 ) x 4 x 5 + + α ( d + 1 , d + 1 ) x d + 1 x d + 1
where i and j are channel subscripts, and α ( i , j ) is the coefficient corresponding to the i-th and j-th channels, defined as follows:
α ( m , n ) = ω 1 i ω 2 j , i = j ω 1 i ω 2 j + ω 1 j ω 2 i , i j
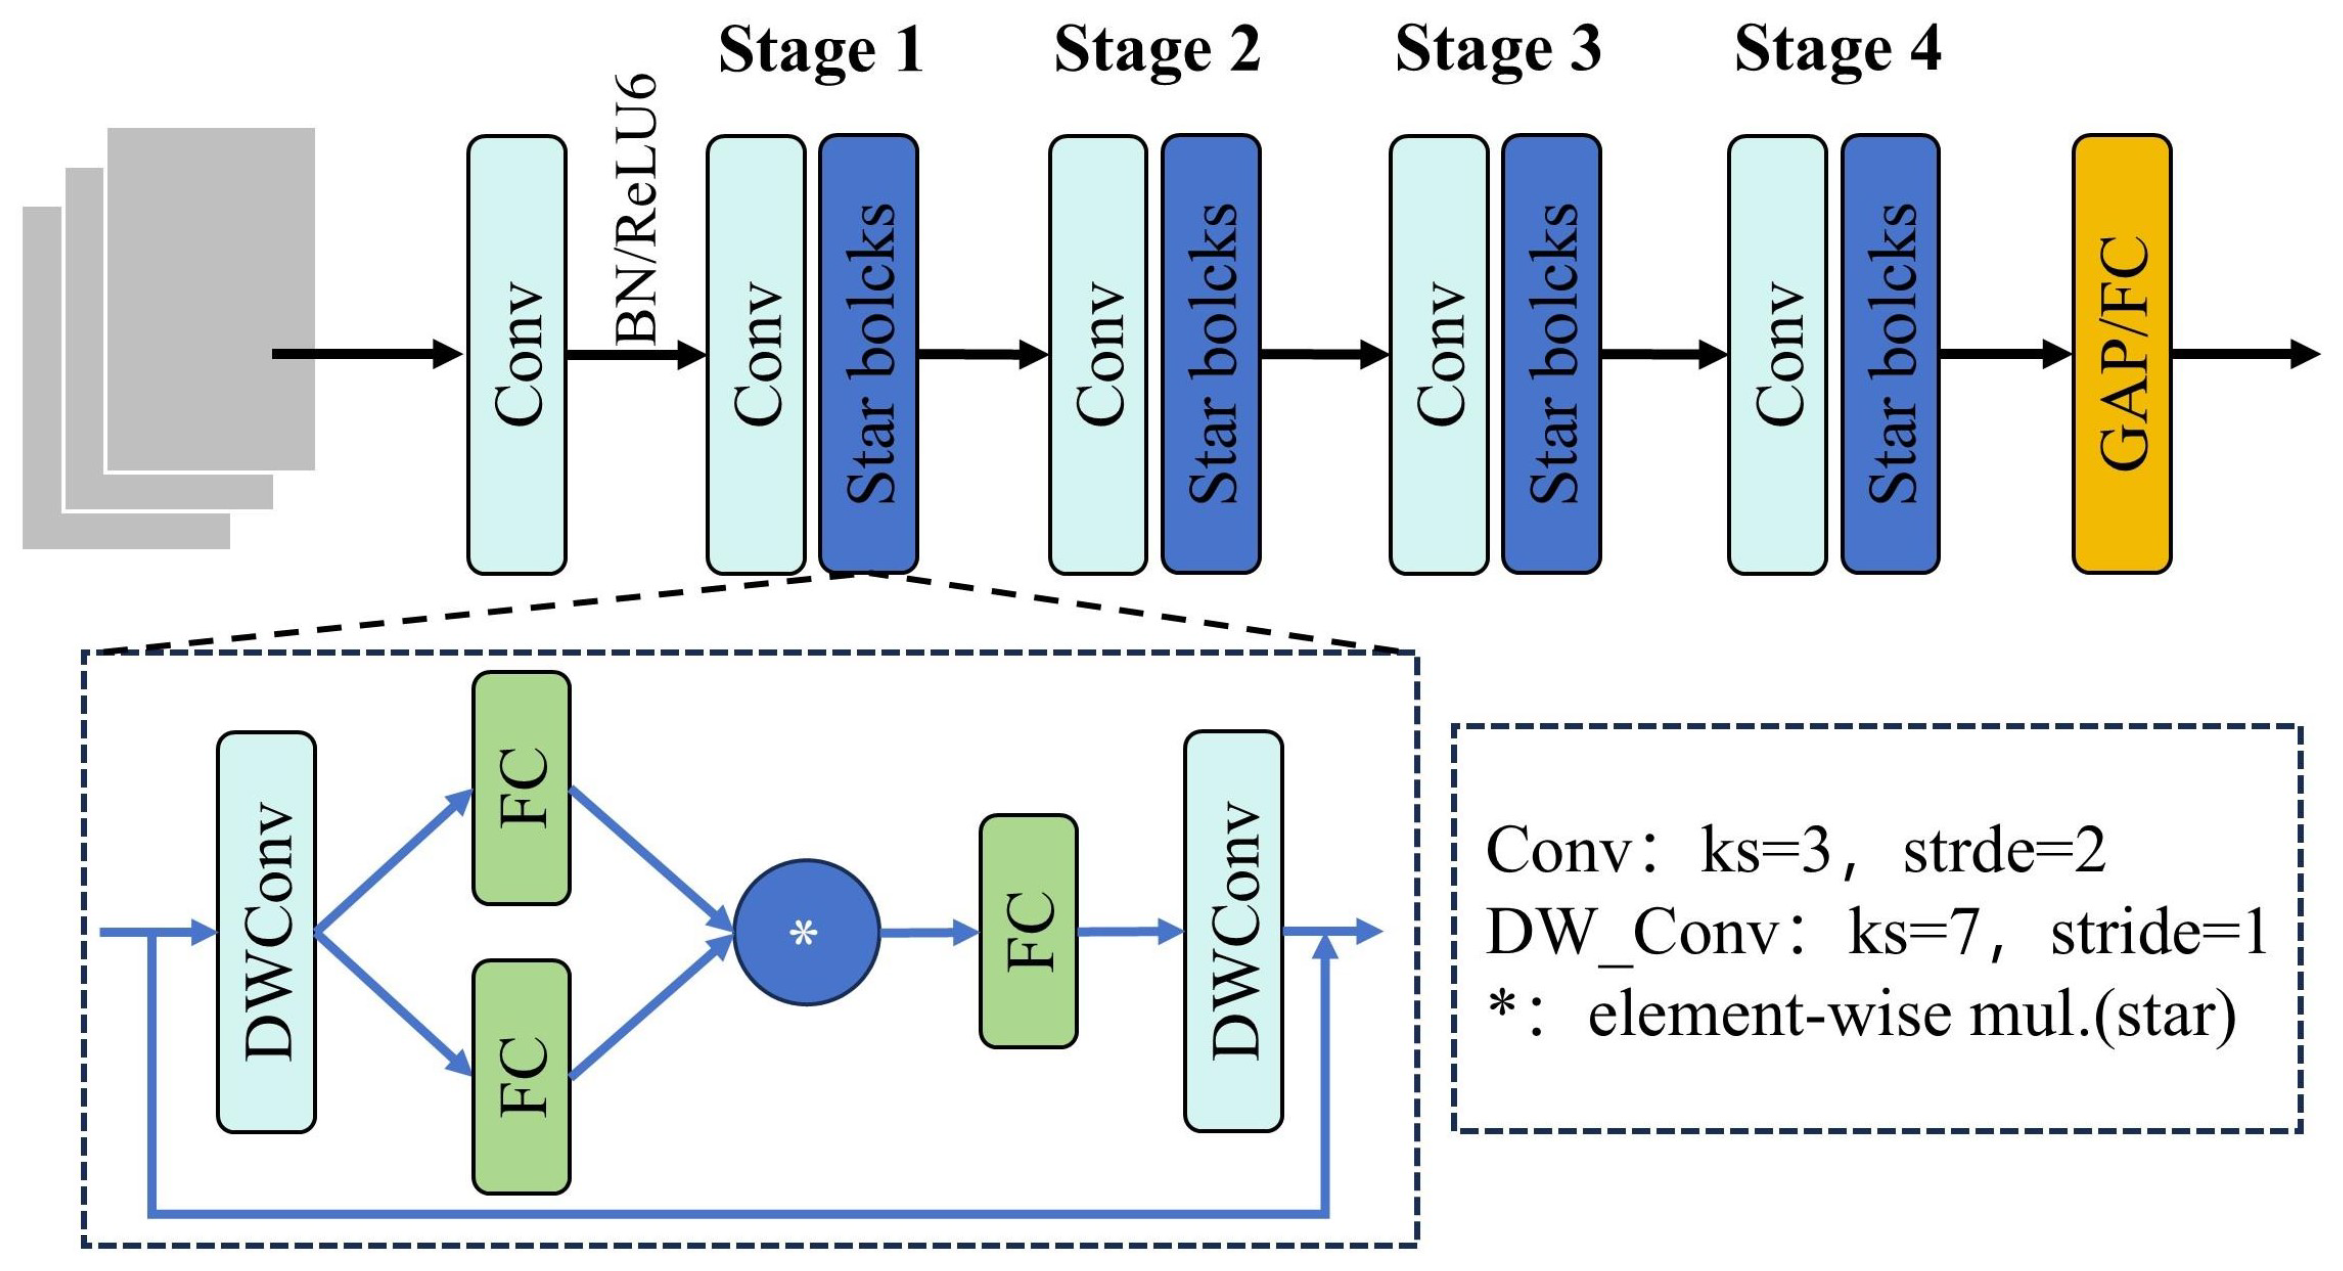
StarNet [25] adopts a four-level hierarchical structure, where each level uses convolutional layers for downsampling and Star Blocks for feature extraction. The overall structure is shown in Figure 4. Star Blocks first employ depthwise convolution (DWConv) for initial feature extraction, followed by batch normalization, resulting in two feature maps with doubled width and a channel expansion factor of 4. After applying the ReLU activation function, the feature maps are fed into the second DWConv for further feature extraction, producing the output feature maps. Compared to traditional convolution, DWConv divides the convolution operation into two steps: performing convolution on each channel of the input data and then element-wise summing the results of these channels to obtain the output. This approach effectively reduces the number of parameters and computational cost, further enhancing the training and inference processes of the model.

2.2.4. C2f-Star Module

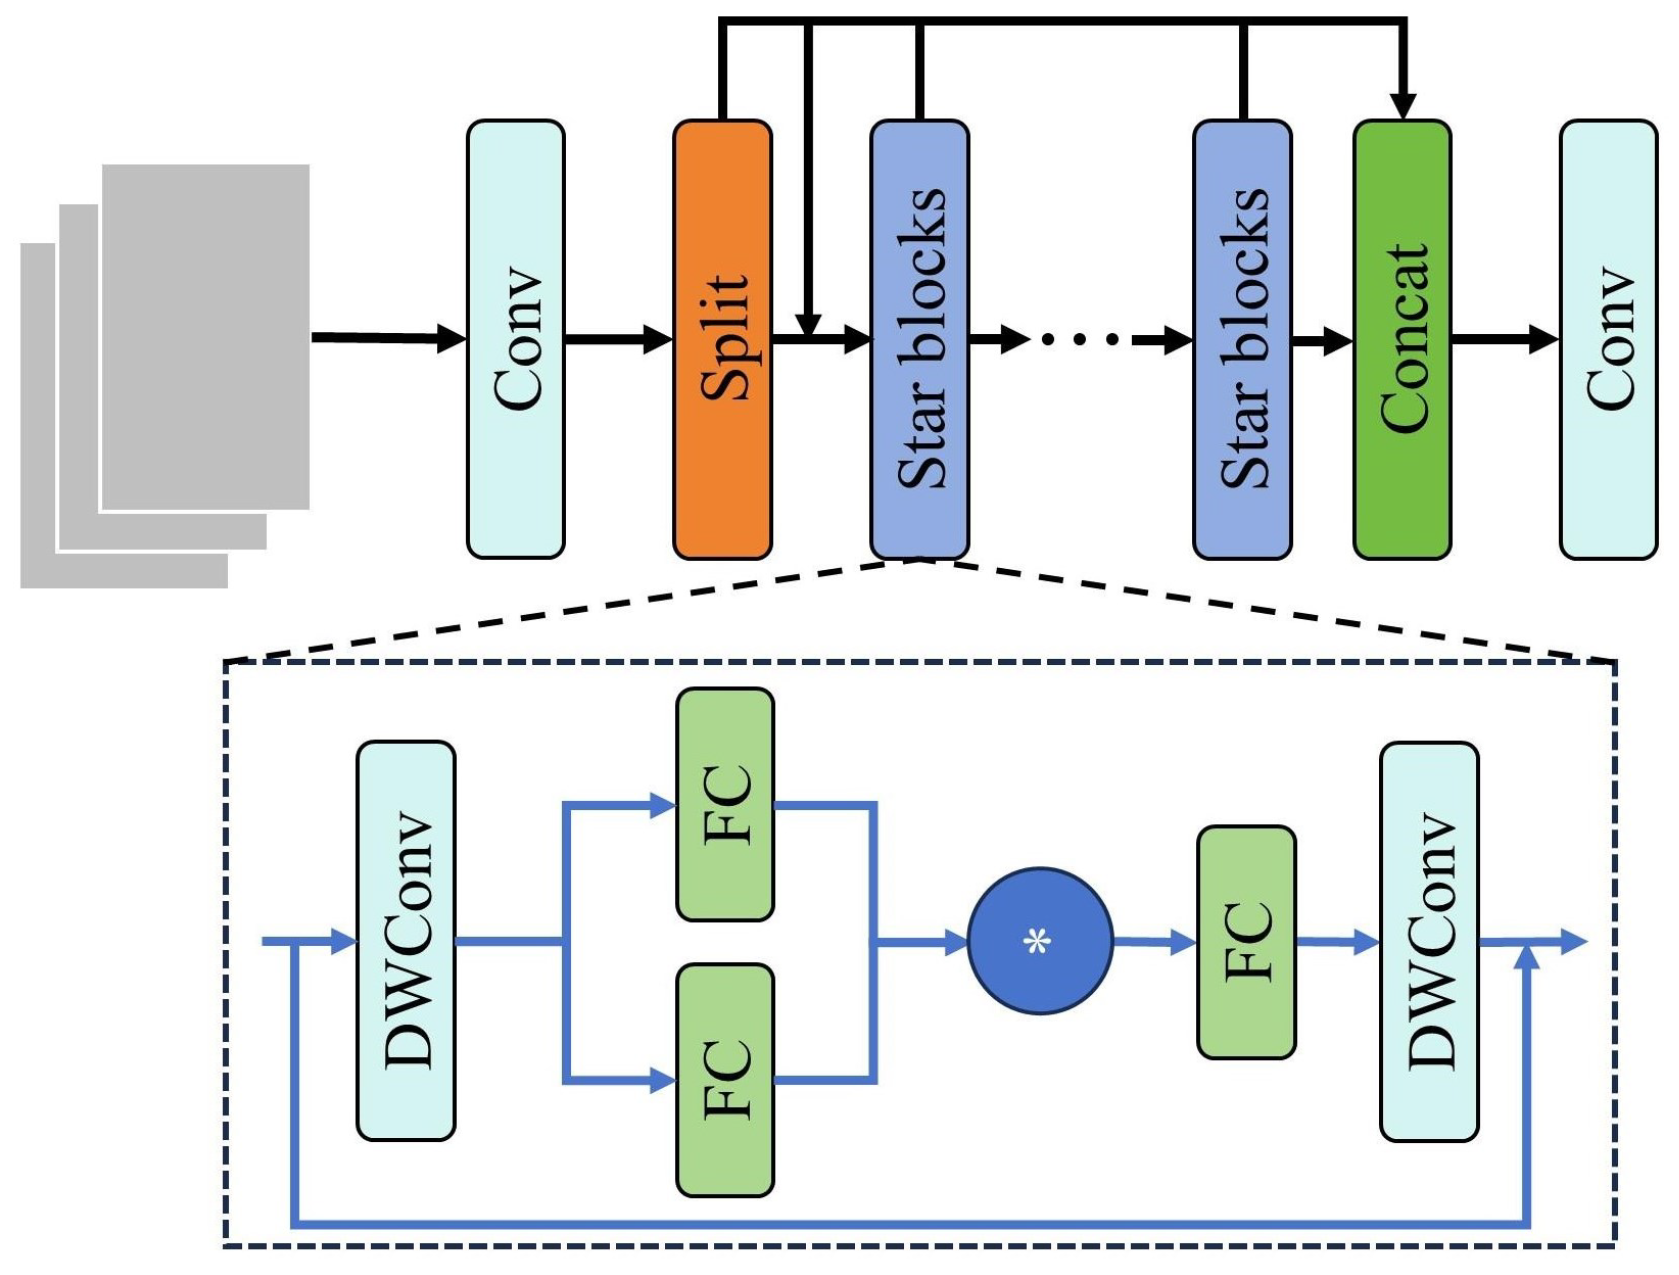
Rapeseed is densely planted in fields, and varying plant heights cause severe occlusion of rapeseed flowers from a bird’s-eye view, making detection and counting challenging. To address this, we introduced the C2f-Star [26] module, which enhances input mapping feature dimensions and improves feature extraction, thereby boosting detection accuracy. Additionally, the StarBlocks structure in C2f-Star reduces parameters compared to the original C2f module, lowering the YOLOv8 network’s parameter count, increasing computational speed, and improving real-time detection of rapeseed flowers by UAVs.
The C2f-Star module, incorporating StarNet’s StarBlocks, replaces the traditional C2f module in YOLOv8’s neck network. As shown in Figure 5, it consists of convolutional layers, split layers, multiple Bottleneck units, concatenation layers, and a final convolutional layer. The Bottleneck unit includes depthwise separable convolution, fully connected layers, and Star Operation (element-wise multiplication). The Star Operation, the module’s core, fuses features via element-wise multiplication of two linearly transformed features, mapping inputs to a high-dimensional nonlinear feature space without widening the network. Unlike traditional networks that increase width, this method resembles kernel functions performing pairwise feature multiplication across channels, especially polynomial kernels. StarBlock architecture in the C2f-Star module, demonstrating split-multiplication-concat of local spatial and global-interactive features, with a skip connection (dashed line) for residual learning. This design enhances detection of occluded rapeseed clusters by fusing fine-grained and context-rich features, as validated in ablation studies. When C2f-Star module applied in neural networks and stacked over multiple layers, it causes implicit exponential growth in feature space dimensionality, allowing nearly infinite dimensions within a compact space. This design lightens the network, reducing computational and storage costs during training and inference.

2.2.5. PGCD Detection Head

The detection head of the YOLOv8 object detection algorithm uses a decoupled design, extracting object category and location features through two 3 × 3 convolutions and one 1 × 1 convolution. However, this design has drawbacks: high computational resource consumption, making it hard to perform optimally on resource-constrained devices, and independent feature map processing by each detection head without information interaction, affecting detection results. To address these issues, this paper proposes a Lightweight Shared Detail-enhanced Convolution Detection Head (PGCD). As shown in Figure 6, the PGCD detection head innovatively uses shared-weight PConv to fuse P3, P4, and P5 features from different scales, reducing model parameters and computations. It also introduces Group Normalization (GN) to enhance localization and classification accuracy. The workflow of the PGCD detection head is as follows: First, each branch adjusts the number of channels through 1 × 1 convolution to integrate features from the neck. Then, two shared-weight 3 × 3 PConvs expand the receptive field, aggregating spatial context and multi-scale information while reducing model parameters. Finally, 1 × 1 standard convolution decouples the computation of classification and regression losses, and a Scale layer with a learnable dynamic factor λ is introduced after the regression branch. The Scale layer employs a single learnable parameter λ, which is updated during the backpropagation process to minimize the total loss. After training, this parameter remains fixed for lightweight inference, without incurring additional computational costs.
The reduction in computational cost of the PGCD module is primarily due to PConv reducing redundant computations. When the input feature is I R c × h × w and the output is O R c × h × w , the standard convolution kernel size is w R c × k × k . Since PConv only requires a subset of the input channels c p to perform spatial feature extraction using conventional convolution, the kernel size becomes w R c p × k × k . The FLOPs for standard convolution are:
FLOPs Conv = h × w × k 2 × c 2
The FLOPs for PConv are:
FLOPs PConv = h × w × k 2 × c p 2
The ratio of FLOPs between PConv and standard convolution is:
N FLOPs = FLOPs PConv FLOPs Conv = c p 2 c 2
From Equation (9), it can be seen that when c p = c 4 , the FLOPs of PConv are only 1 16 of those of standard convolution. This demonstrates that, compared to traditional convolution, PConv can reduce the computational cost, number of parameters, and model complexity.

2.2.6. LAMP

Deploying neural networks on embedded devices faces challenges like limited storage and computing resources. This calls for further compression of model computations and parameters. Neural networks have many redundant parameters from convolutional to fully connected layers. These increase storage needs and computational complexity, hindering efficient deployment and real-time operation on resource-constrained devices. To tackle this, we use Layer-Adaptive Sparsity For The Magnitude-Based Pruning (LAMP) to prune the model [27].
LAMP proposes a novel global pruning importance scoring method, which is designed from the perspective of minimizing model-level distortion. The design idea is as follows: In a neural network, each connection has a weight, and W [ u ] represents the weight term mapped by index u. Assuming that the magnitude of the weight terms satisfies an order based on the index size, i.e., u < v , then W [ u ] < W [ v ] . The LAMP score for the u-th index of the weight tensor W is defined as:
score ( u ; W ) = ( W [ u ] ) 2 v u ( W [ v ] ) 2
Here, the numerator ( W [ u ] ) 2 represents the squared magnitude of the target connection’s weight, and the denominator v u ( W [ v ] ) 2 represents the sum of squared magnitudes of all remaining connections in the same layer. Specifically, the denominator represents the sum of squared magnitudes of all connections with larger weights starting from the current target connection u (weights with indices smaller than u have already been pruned). After calculating the LAMP scores, connections with the smallest LAMP scores are globally pruned until the desired global sparsity constraint is met. Subsequently, the pruned model is fine-tuned to recover the performance loss caused by pruning. The detailed process of LAMP pruning is shown in Figure 7. Inspired by LAMP, this paper adapts the idea to measure channel importance instead of weight importance and applies channel pruning to SPL-YOLOv8. The specific steps are as follows: First, calculate the LAMP score for each channel; second, sort the channels based on their importance scores and remove the channels with lower scores until the specified pruning rate is met; finally, fine-tune the pruned model to restore its performance. The detailed algorithm flow Algorithm 1 is as follows:
Algorithm 1: Channel Pruning Based on LAMP Scores.
  Input: Model parameters before pruning.
1:
Set the pruning rate.
2:
for i = 0 ;   i < layers _ index ;   i   +   + ;
3:
for j = 0 ;   j < weights _ index ;   j   +   + ;
4:
Calculate the squared magnitude of the weights.
5:
Sort the results from step 4 in descending order.
6:
Calculate v u ( W [ v ] ) 2 .
7:
Calculate the LAMP scores for all convolutional kernels in the current layer.
8:
Sort all convolutional kernels based on their LAMP scores.
9:
Remove the channels with lower scores until the specified pruning rate is met.
  Output: Pruned model and parameters.

2.2.7. SAHI

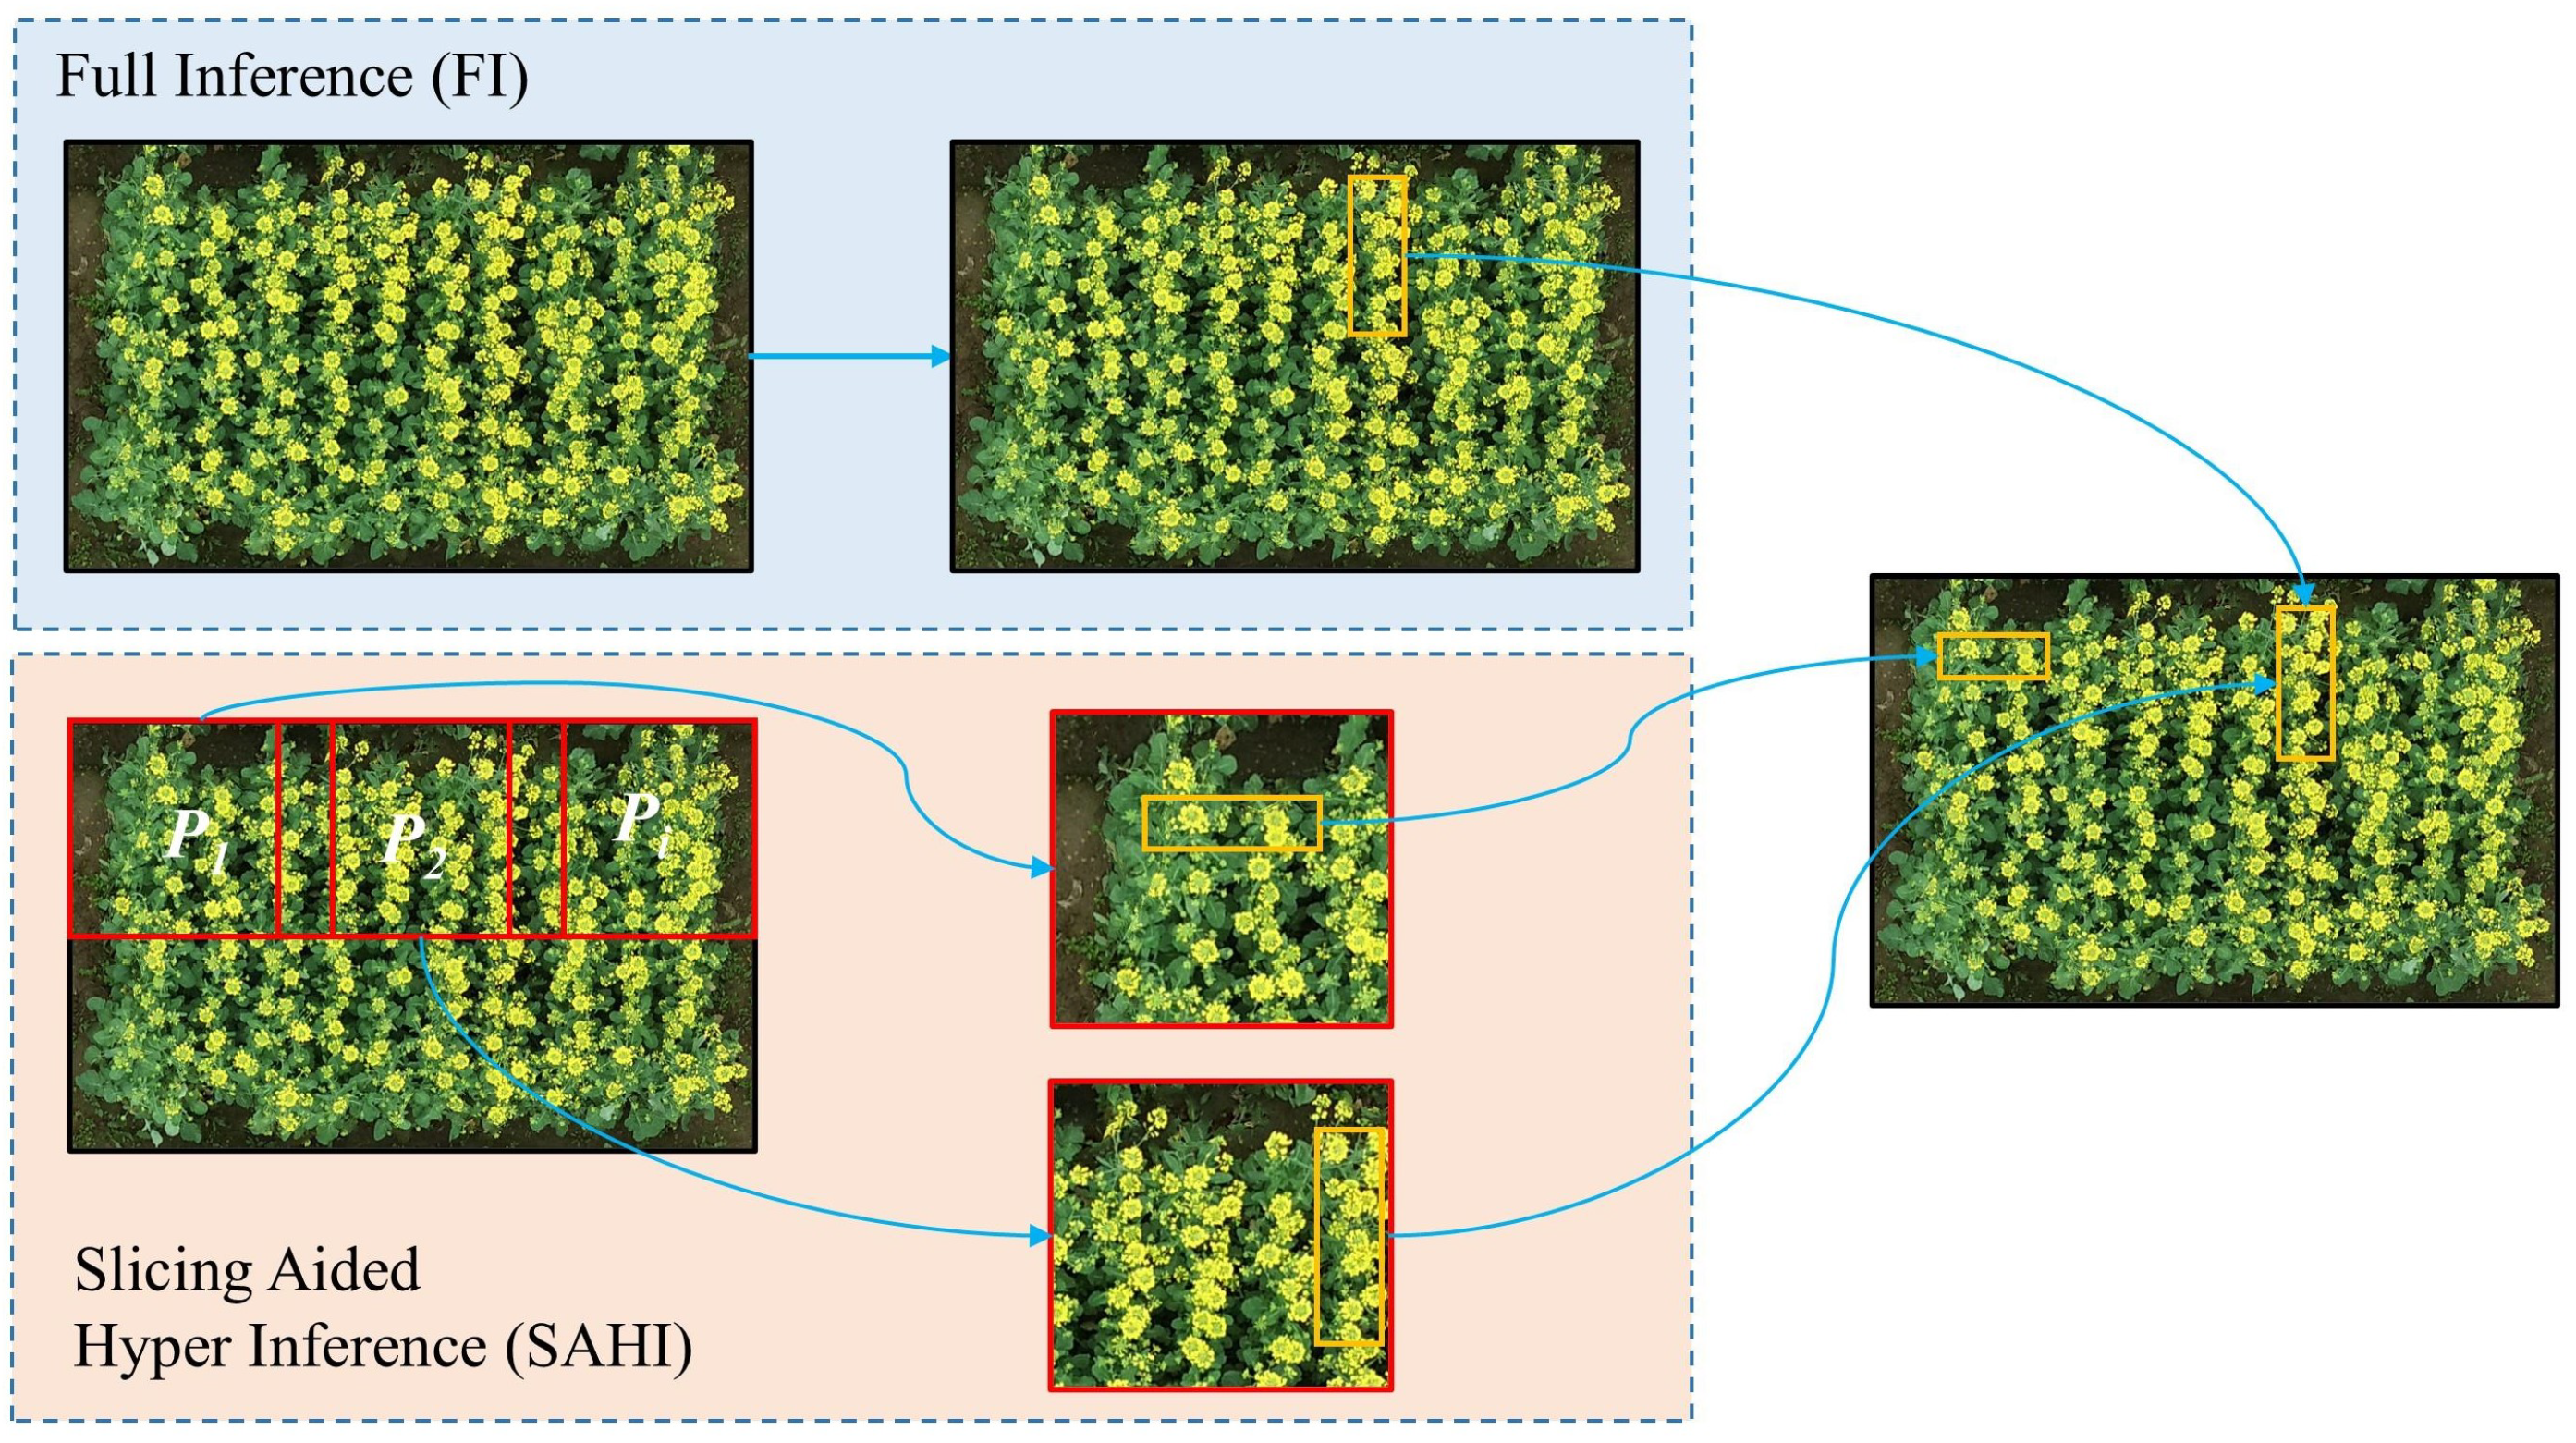
The Slicing Aided Hyper Inference (SAHI) framework, proposed by AKYON et al., is a powerful solution for small object detection and can be integrated with various object detection methods [28]. It works by dividing the input image into multiple overlapping smaller blocks (slices), performing independent object detection on each slice, and then merging the detection results from all slices back into the original image coordinate system using post-processing techniques like Non-Maximum Suppression (NMS). This approach not only increases the relative size of objects within each slice, enhancing the detection model’s ability to recognize small objects, but also reduces memory usage, making it feasible to run on devices with limited computational resources. In the context of rapeseed flower detection, the application of the SAHI framework is of great significance. Figure 8 shows the detection process of SAHI framework in RFRB dataset. Here’s how it works in different stages: In data preprocessing, the original image is divided into multiple overlapping smaller image blocks. The slicing strategy involves overlapping ratios for both width and height, such as 33% for width and 21% for height. This ensures that targets are not missed during slicing and maintains consistent resolution across slices, e.g., 2048 pixels × 2048 pixels. This slicing approach increases the number of data samples, balances class data, prevents overfitting, and enhances the model’s generalization ability across different natural environments. In model training, Slice-Assisted Fine-tuning (SA-Finetuning) is introduced. This involves training on sliced images using strategies like weighted training to further improve the model’s detection accuracy for small rapeseed flowers. In the inference stage, large field images are sliced into multiple overlapping smaller blocks. Each block is resized while maintaining the aspect ratio. The modified SPL-YOLOv8 rapeseed flower detection model is then applied independently to each overlapping image block for prediction. SAHI also offers an optional Full Inference (FI) method, which directly predicts on the unsliced original image to preserve detection of larger objects in high-resolution images. Finally, predictions from overlapping slices are merged back onto the original image using NMS, considering only boxes with an IoU ratio above a predefined threshold and removing detections with probabilities below the threshold.

3. Experimental Setup and Evaluation Metrics

3.1. Experimental Environment

The experiments in this study were conducted using the PyTorch 2.0.0 framework on the following hardware environment: NVIDIA RTX 3090 GPU (24 GB of VRAM) and Intel (R) Xeon (R) Platinum 8358P CPU @ 2.60 GHz processor. The software depends on Python 3.8 and Cuda 11.8.
Each experiment was initiated with weights that were randomly assigned, without reliance on pre-trained models throughout the training process. The dataset, formatted in YOLO style, was partitioned into into training, validation, and test sets with a 7:2:1 ratio. The training lasted for 200 epochs, with images maintained at a resolution of 640 × 640 pixels and batches composed of 200 images. Optimization was managed by the SGD algorithm, starting with a learning rate of 0.01, which was progressively adjusted using a cosine annealing approach.These parameters remain constant in subsequent comparative experiments.

3.2. Evaluation Metrics

This paper adopts precision (P), mean average precision (mAP), model size, the giga floating point operations per second (GFLOPs), and inference time as evaluation metrics to assess model performance. Precision refers to the proportion of correctly classified samples out of the total number of samples, reflecting the model’s ability to classify samples. Mean average precision represents the average precision across all categories, calculated as follows:
P = T P T P + F P × 100 %
R = T P T P + F N × 100 %
m A P = 1 C i = 1 C 0 1 P ( R ) d R × 100 %
Here, T P is the number of correctly detected rapeseed seedlings in the image; F P is the number of incorrectly detected samples; F N is the number of undetected rapeseed seedlings; and C is the number of categories. Since this paper only detects one category, C = 1 , and thus m A P = A P . AP50 is the average precision of the object detection model at an IoU (intersection over union) threshold of 0.50.
When conducting a comprehensive performance evaluation of the models, this study introduced the Min-Max normalization method, aiming to scientifically and reasonably assess the performance of each model. Through this method, each indicator can be accurately mapped to the range of 0 to 1. On this basis, based on the differences in the importance of each indicator in the model performance evaluation system, corresponding weight values are assigned to them. Then, using the weighted score as a quantitative method, a comprehensive and in-depth evaluation of the comprehensive performance of each model is carried out. We set AP50 as a positive indicator, GFLOPs, Parameters, and model size as negative indicators. The specific weight allocation is as follows: the weight of the AP50 indicator is 0.4, the weight of GFLOPs is 0.2, the weight of Parameters is 0.2, and the weight of model size is 0.2. The specific normalization formula and weighted calculation are as shown in the following formula.
AP 50 norm = AP 50 AP 50 min AP 50 max AP 50 min
GFLOPs norm = GFLOPs max GFLOPs GFLOPs max GFLOPs min
Parameters norm = Parameters max Parameters parameters max parameters min
model size norm = model size max model size model size max model size min
Score = 0.4 × AP 50 norm + 0.2 × GFLOPs norm + 0.2 × Parameters norm + 0.2 × model size norm

4. Results and Analysis

4.1. Backbone Network Ablation Study

Lightweight networks focus on reducing parameters and computations to operate on devices with limited computational resources. In order to study the impact of different lightweight networks on the model detection performance, this experiment selected three classic CNN backbone networks, namely ConvNextV2 [29], Fasternet [30], and StarNet [25], as well as five lightweight ViT backbone networks, namely MobileNet [31], EfficientFormerV2 [32], efficientViT [33], Biformer [34], and Swintransformer [35], for ablation experiments. The comparative detection results are shown in Table 1.
The results indicate that replacing the backbone network with ConvNeXtV2 significantly increases the model’s parameters and GFLOPs, raising computational and storage costs. EfficientFormerV2, while showing some performance improvements, considerably enlarges the model size, reducing storage efficiency. EfficientViT and FarnerNet demonstrate a certain balance between performance and resource usage but still have room for improvement. The Swintransformer performed the best in terms of recall and AP50 metrics, but it had the largest number of parameters among all the comparison networks. Notably, StarNet excels in accuracy, recall, and mean average precision while offering significant advantages in parameter count, GFLOPs, and model size. It achieves an accuracy of 90.5%, recall of 84.6%, and mean average precision of 92.4%, with only 2.110 M parameters, 6.5 G GFLOPs, and a model size of 4.7 MB. This shows StarNet maintains high detection performance while reducing model complexity and resource usage, making it more suitable for resource-constrained devices.

4.2. Module Ablation Experiments

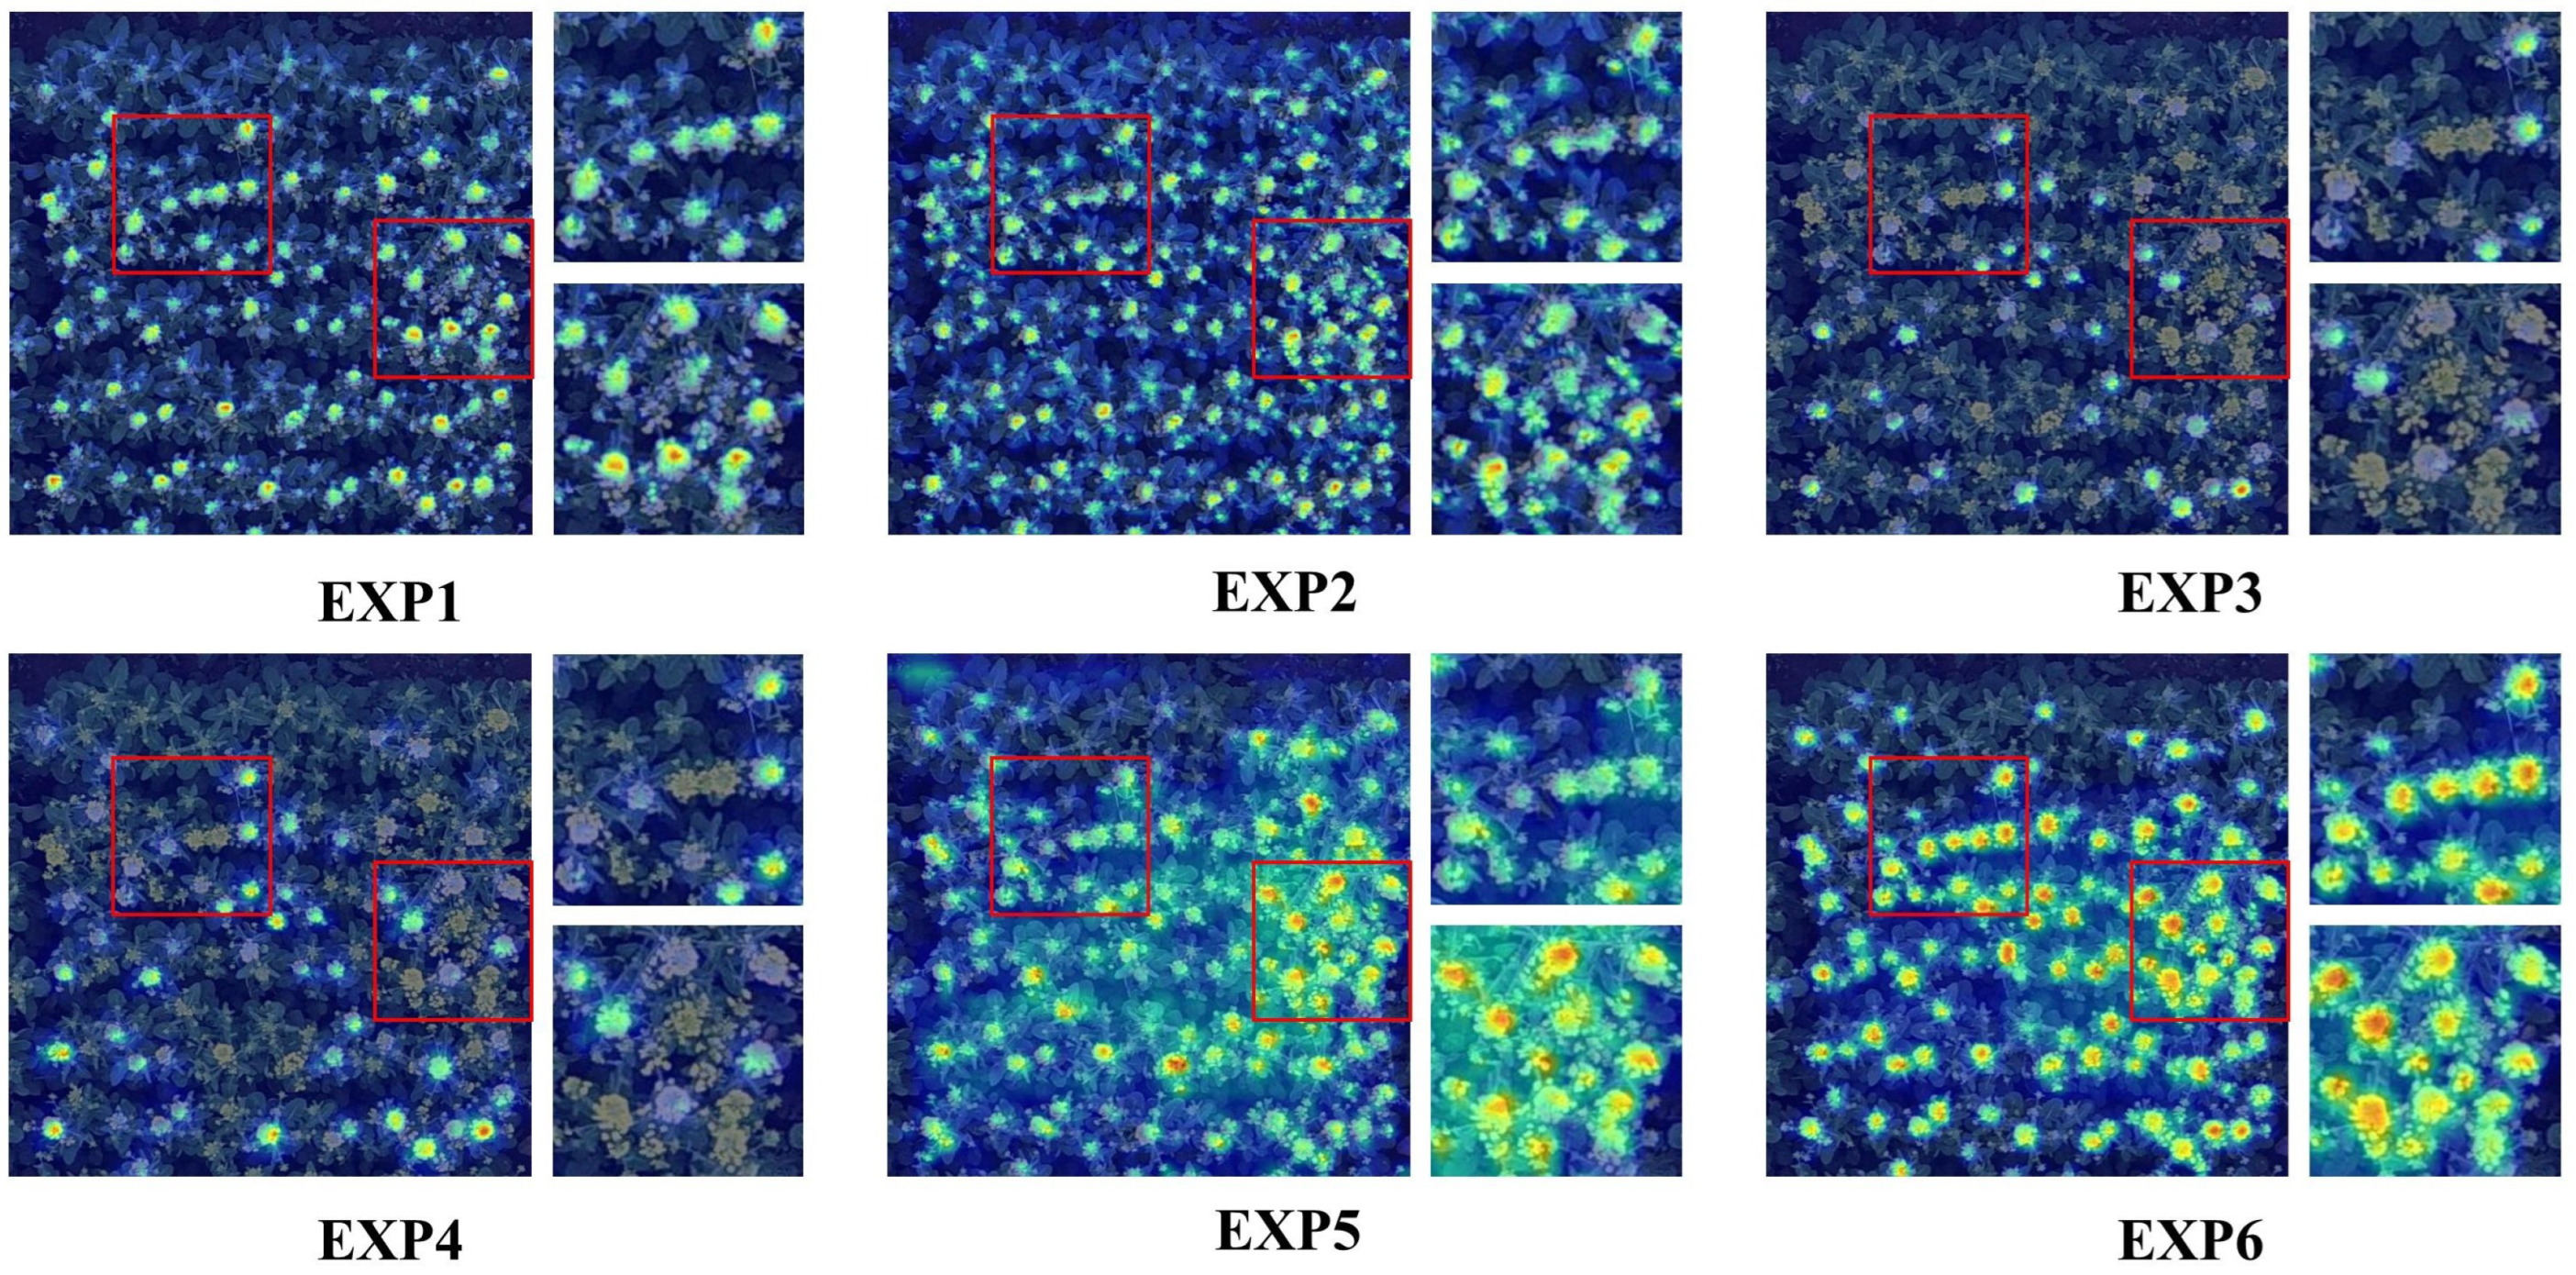
The lightweight SPL-YOLOv8 model for rapeseed flower detection and counting consists of three improved modules: StarNet, C2f-Star, and PGCD. To verify the individual functionality of each module and the synergistic effects of the modules, this paper uses a split dataset of 73 rapeseed flower images as the test set for ablation experiments. The corresponding results are shown in Table 2. And each module ablation experiment is visualized, as shown in the Figure 9.
The experimental results show that replacing the backbone feature extraction network of YOLOv8n with StarNet can reduce the computational cost and number of parameters of the network without decreasing the mAP, while also reducing the size of the model weights. This is because the StarNet network structure uses only one layer per stage to build the network, significantly reducing the complexity of the model while preserving feature mapping information, allowing the network to achieve high recognition accuracy while being lightweight. The addition of C2f-Star further enhances the lightweight nature of the model compared to the original YOLOv8n network, with a slight improvement in accuracy. When all three modules are integrated into the model to form our lightweight SPL-YOLOv8 model, the AP50 reaches 92.4%, with GFLOPs and parameters of 3.4 G and 1.240 M, respectively, representing reductions of 58% and 56% compared to the baseline model. This is attributed to the synergistic collaboration between the modules, which enhances the detection of small targets while significantly reducing the model’s parameter count and computational cost.

4.3. Model Pruning Experiments

When optimizing the SPL-YOLOv8 model, pruning mainly targets the backbone and neck due to the already lightweight detection head. By adjusting the pruning rate (the ratio of the pruned model’s GFLOPs to the original), the network is pruned to different extents. Table 3 shows how performance metrics change at different pruning rates. When the pruning rate is below 2.5, accuracy and fps first slightly drop then rise, while recall steadily declines with increasing pruning rate. Meanwhile, AP50, model size, GFLOPs, and parameters all continuously decrease. Notably, at a pruning rate of 3.0, the model balances performance metrics. At this point, accuracy, recall, and AP50 are maintained at high levels of 90.2%, 84.1%, and 92.2%, respectively. Simultaneously, parameters, GFLOPs, and model size reach their lowest values of 0.132, 1.1 G, and 0.5 MB, with fps reaching 171.1, effectively balancing model lightweight and performance. To ensure the rigor of the experiment, we further compared the l1 [36] and Group-Sl [37] pruning methods. In the experiment, the pruning rate used was the same as that of the lamp method. Although both of these methods can reduce the number of model parameters and computational load while maintaining a relatively high model accuracy, compared with the lamp method, their model accuracy has decreased significantly, and it has had a notable negative impact on the detection performance of the model.
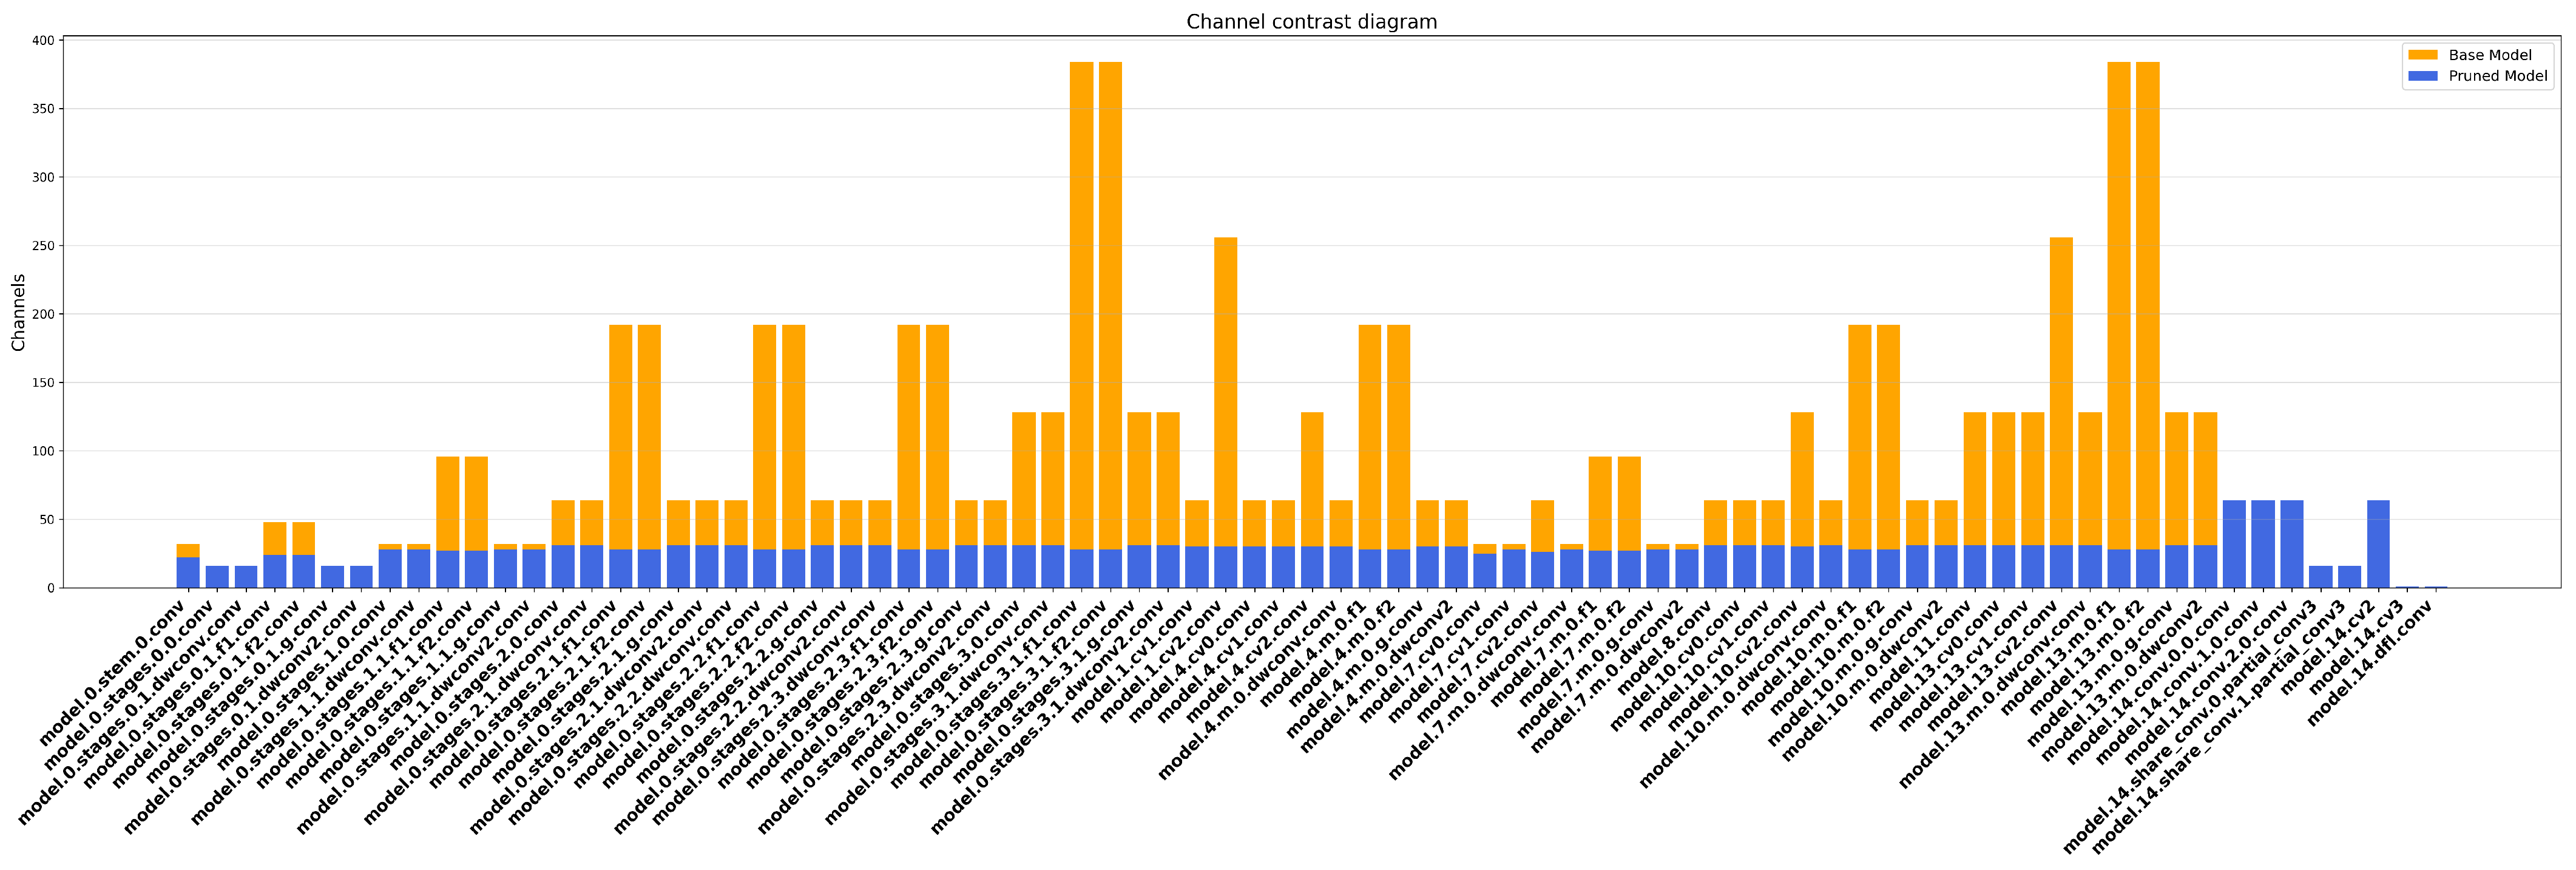
To visually observe the impact of pruning on model channels, we counted the channels before and after pruning. Figure 10 compares the number of channels in the backbone and neck before and after pruning at a rate of 3. The yellow bars represent the number of channels before pruning, and the blue bars after. The comparison clearly shows that pruning significantly reduces redundant channels, making the model more lightweight.

4.4. Comparative Experiments with Different Detection Models

To compare the detection performance of our model with current mainstream object detection models on the RFRB dataset, we conducted comparative experiments with CenterNet [38], RetinaNet [39], EfficientDet-D0 [31], SSD [40], MobileNet-SSD [41], YOLOv3 [42], YOLOv4 [43], YOLOv5n [44], YOLOv5s, YOLOv6 [45], YOLOv7 [46], YOLOv8n, YOLOv10n [47], YOLOv11n [48], and the RT-DETR [49] series on the same dataset. The results are shown in Table 4. Overall, non-lightweight detection models like CenterNet, RetinaNet, EfficientDet-D0, SSD, MobileNet-SSD, YOLOv3, and YOLOv4 achieve around 80% detection accuracy but have large parameter counts and floating-point operations, with GFLOPs exceeding 100G and much higher model memory usage than lightweight models, making them less suitable for lightweight real-time detection. Lightweight models such as YOLOv5n, YOLOv5s, YOLOv6, YOLOv7, YOLOv8n, YOLOv10n, and YOLOv11n significantly reduce computational complexity and memory usage while maintaining high detection accuracy. Although the RT-DETR series has a slight edge in detection accuracy, with AP50 values of 92.7% and 92.9% for RT-DETR-r18 and RT-DETR-r34, respectively, their GFLOPs and parameters are relatively high at 56.9G/18.95 and 88.8 G/29.67, with model sizes of 40.5MB and 63.0MB, making them less effective for model lightweighting compared to YOLO series and SPL-YOLOv8n series models. The pruned SPL-YOLOv8-prune, with its lightweight StarNet backbone and C2f-Star module, has a parameter count that is only 7.32%, 1.97%, 3.23%, 2.22%, 4.54%, 6.11%, 5.37%, and 10.65% of that of YOLOv5n, YOLOv5s, YOLOv6, YOLOv7, YOLOv8n, YOLOv10n, YOLOv11n, and other models, respectively. It also significantly reduces the number of parameters and floating-point operations, making the model more lightweight and better suited for real-time detection.

4.5. Counting Results and Robustness Analysis

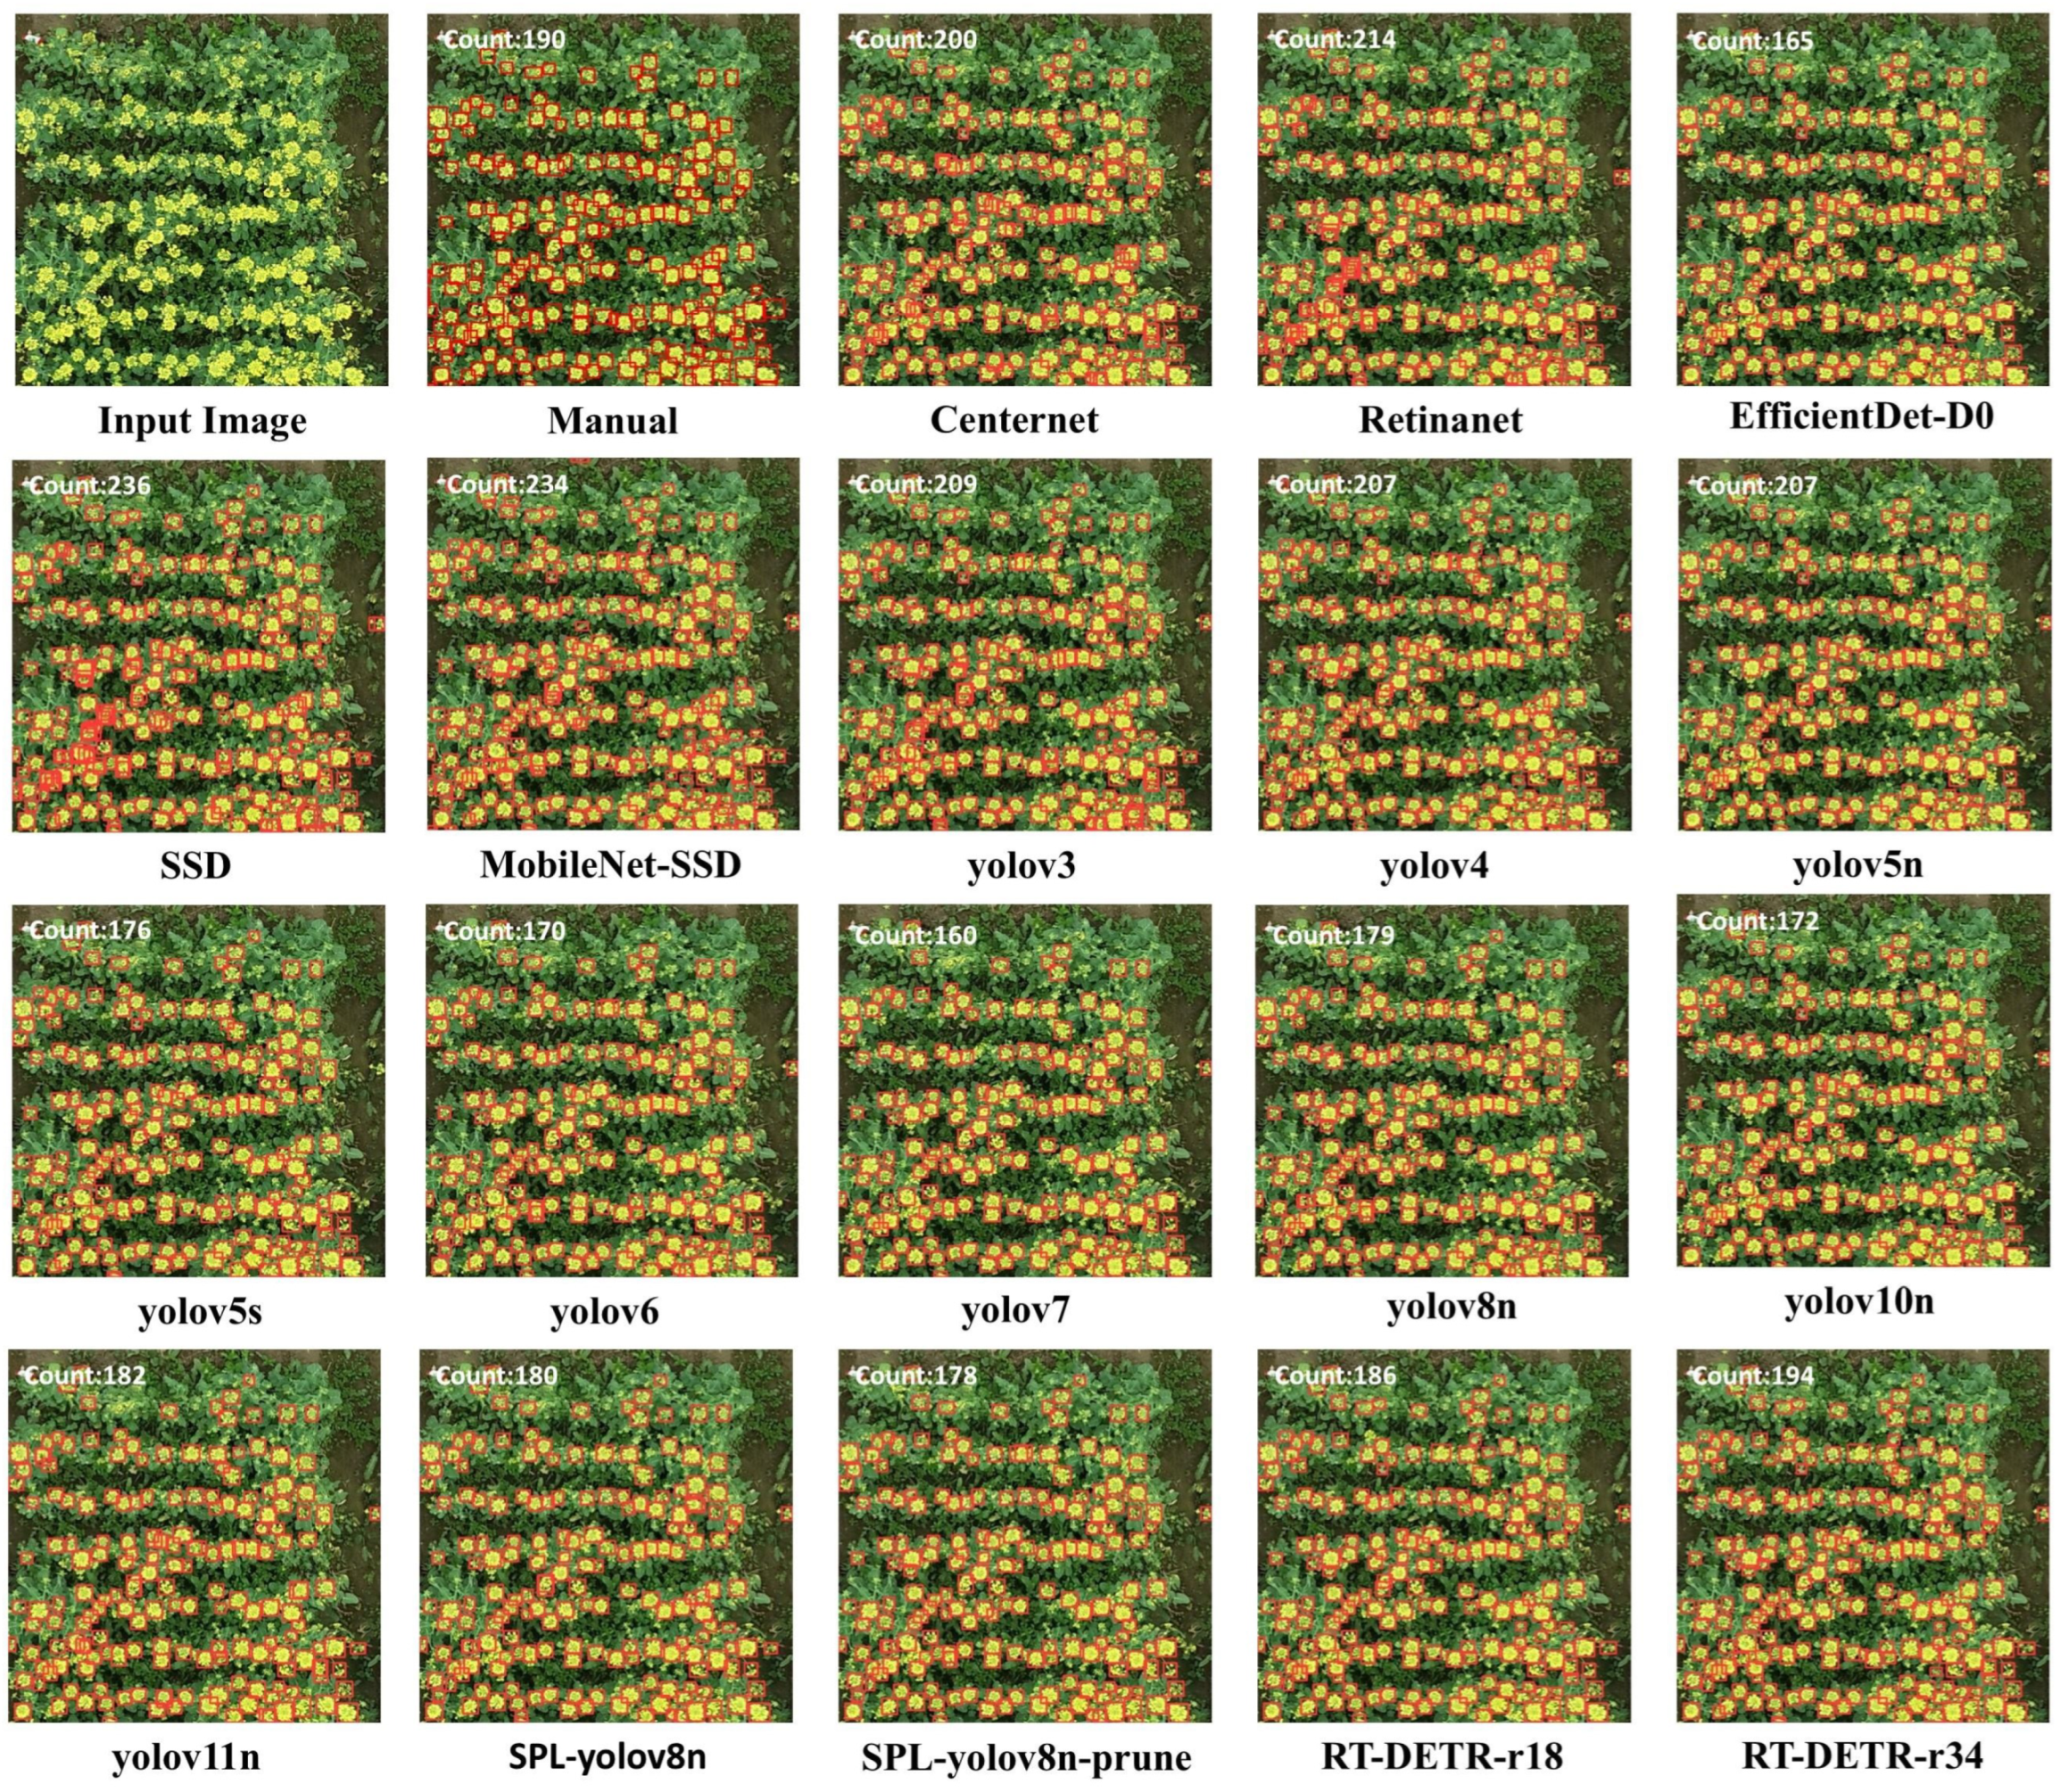
To visually evaluate the performance of SPL-YOLOv8 and other detection models in the rapeseed flower detection task, we selected a typical rapeseed flower image from the test set, applied various models for detection, and visualized the results while counting the flowers. The results are shown in Figure 11.
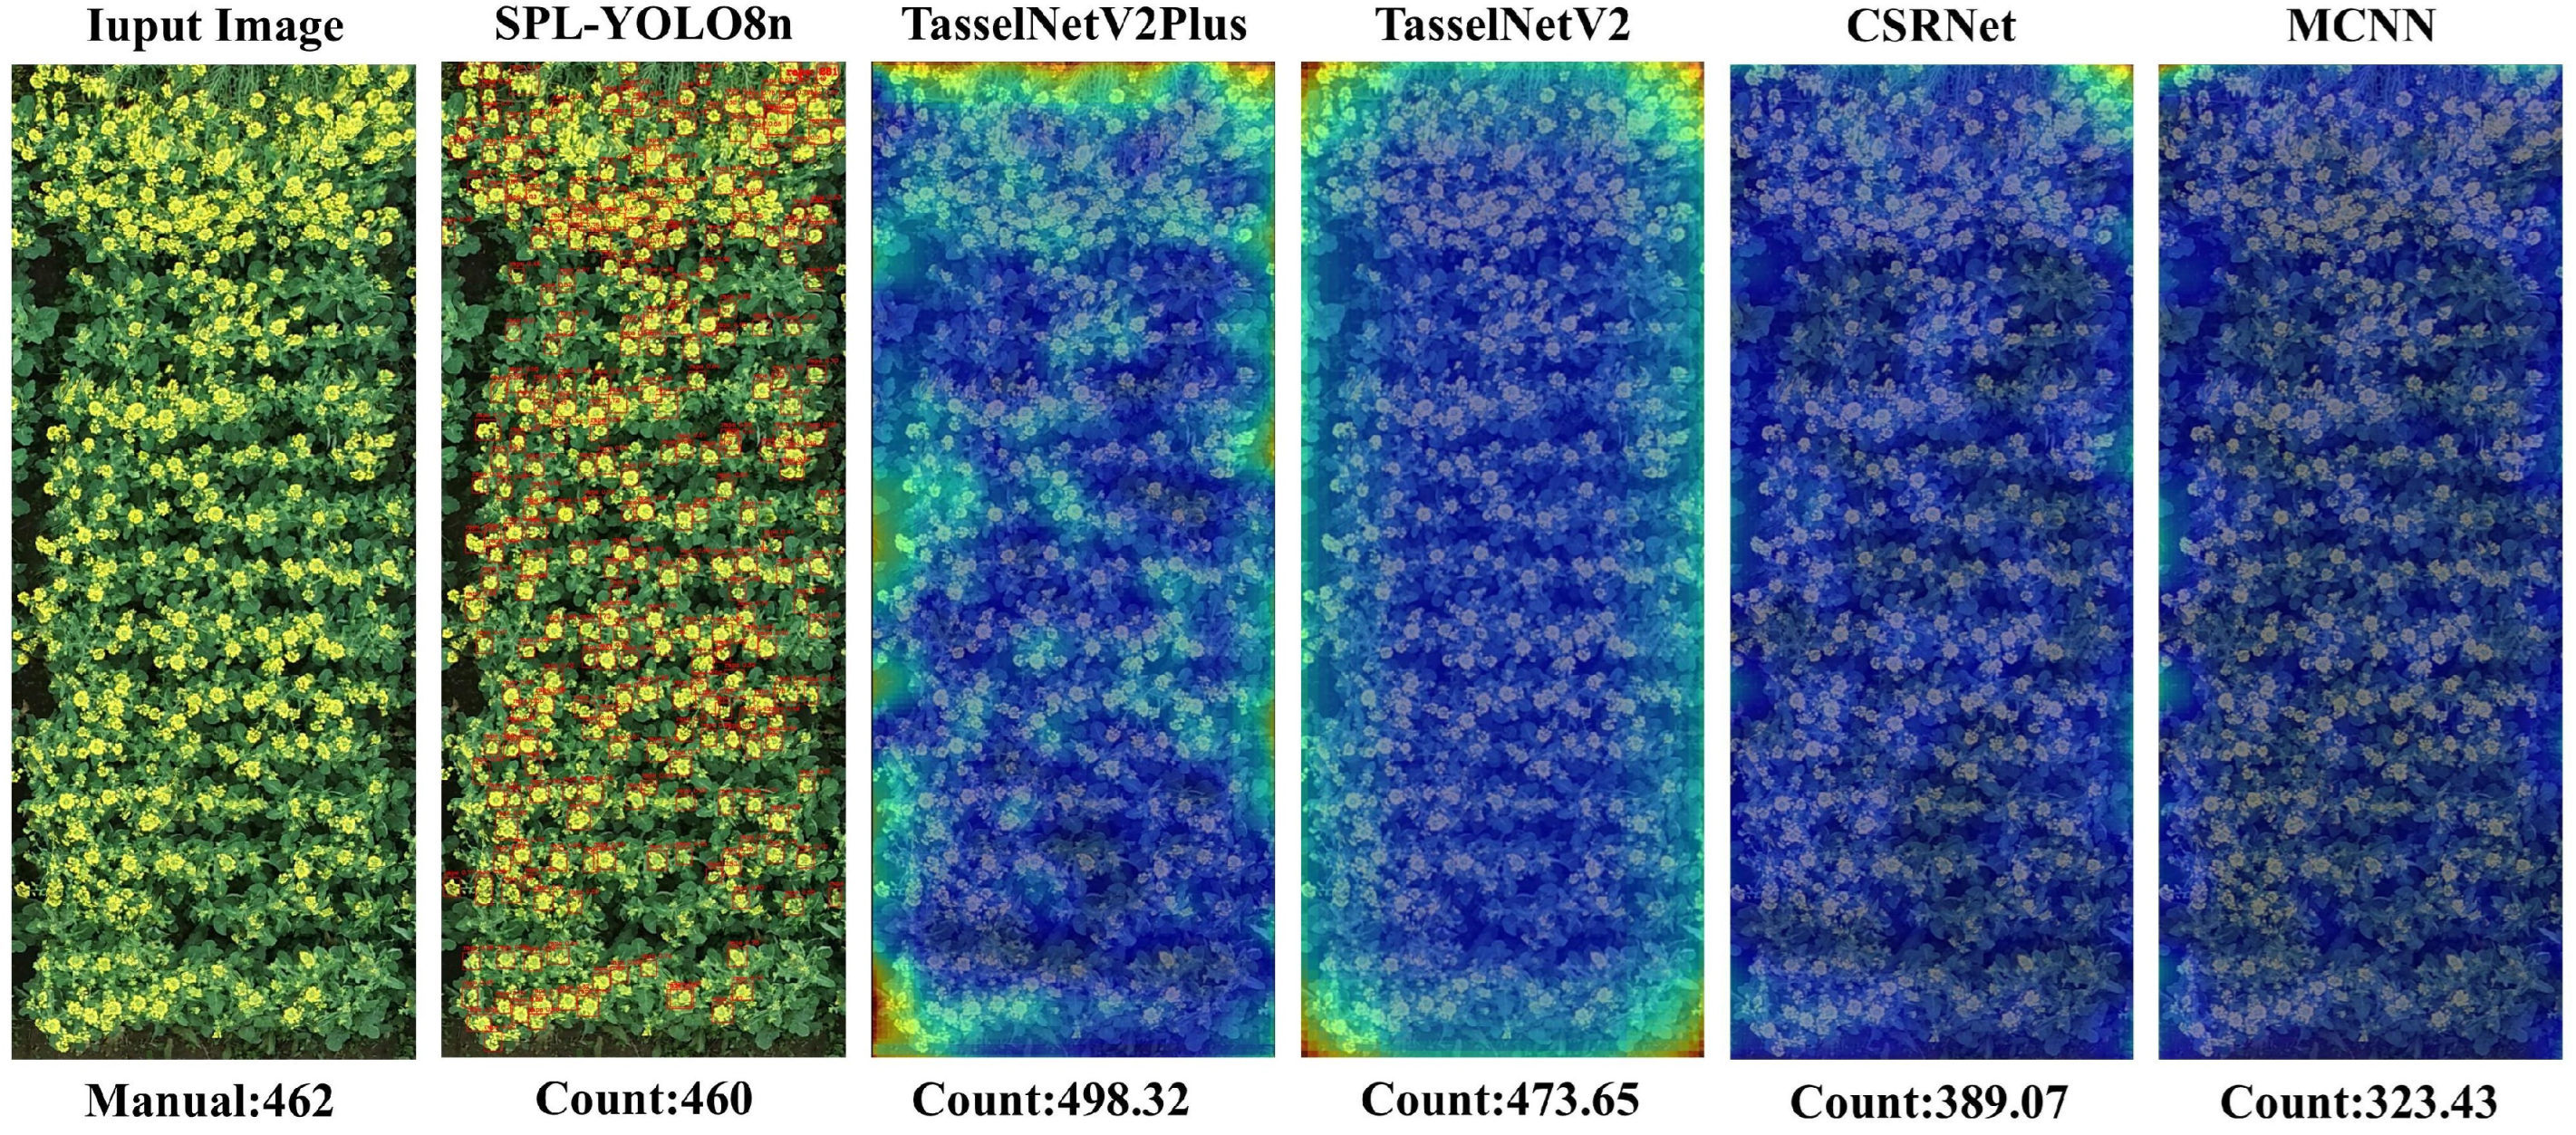
All models demonstrate good detection performance and counting accuracy on RFRB. However, differences exist in detection details. Models like CenterNet, RetinaNet, SSD, YOLOv3, and YOLOv4 produce more redundant bounding boxes due to the lack of effective attention modules in feature extraction and insufficient model constraints, affecting detection precision. In contrast, YOLOv5 and YOLOv10 series, with added attention mechanisms and new loss functions, reduce redundant boxes and improve accuracy and efficiency. YOLOv11 and RT-DETR series stand out with high detection accuracy and an average absolute error (MAE) below 8 in counting tasks. However, YOLOv11n has twice as many parameters as SPL-YOLOv8 and three times as many as its pruned version and the GFLOPs value of the RT-DETR series exceeds 10 times that of SPL-YOLOv8, indicating that the model lightweighting effect is poor and may require high computational resources. To further assess our model’s counting performance, we compared it with density-regression-based counting models MCNN, CSRNet, and TasselNet. Results and visualizations are shown in Figure 12. MCNN [50] and CSRNet [51] excel in crowd counting but perform poorly on RFRB due to flower occlusion and background interference. TasselNet [52,53], designed for counting crops like wheat and rice, shows good performance but only provides density maps without prcise location information. Our detection - based counting model offers both high-precision counting and geometric location information, enhancing practicality and flexibility, especially for applications requiring precise flower localization and analysis.
The coefficient of determination ( R 2 ) is used to reflect the goodness of fit of a linear regression model. By utilizing the predicted number of rapeseed flower clusters output by the network model and the corresponding manually calculated true counts, we explore the correlation between them. In Figure 13a–c, we present the fitting results for the YOLOv8n, SPL-YOLOv8, and SPL-YOLOv8-prune networks, respectively. All three models exhibit strong correlations between manual counting (MC) and inferred counting (IC) on the RFRB dataset, with R 2 values of 0.9247, 0.9414, and 0.9460, respectively, indicating that most predictions are sufficiently accurate. Compared to YOLOv8n, the fitting curves of SPL-YOLOv8 and SPL-YOLOv8-prune are closer to the 1:1 line. This demonstrates that the backbone network and lightweight structure used in our SPL-YOLOv8 and SPL-YOLOv8-prune models are well-suited for the rapeseed flower dataset, which exhibits significant variations in lighting and pose. Additionally, in the test samples, as the number of flowers increases, the counting error also increases, making it more challenging for the model to fit. However, overall, the proposed SPL-YOLOv8 and SPL-YOLOv8-prune networks perform well and can be used for rapeseed flower cluster counting.
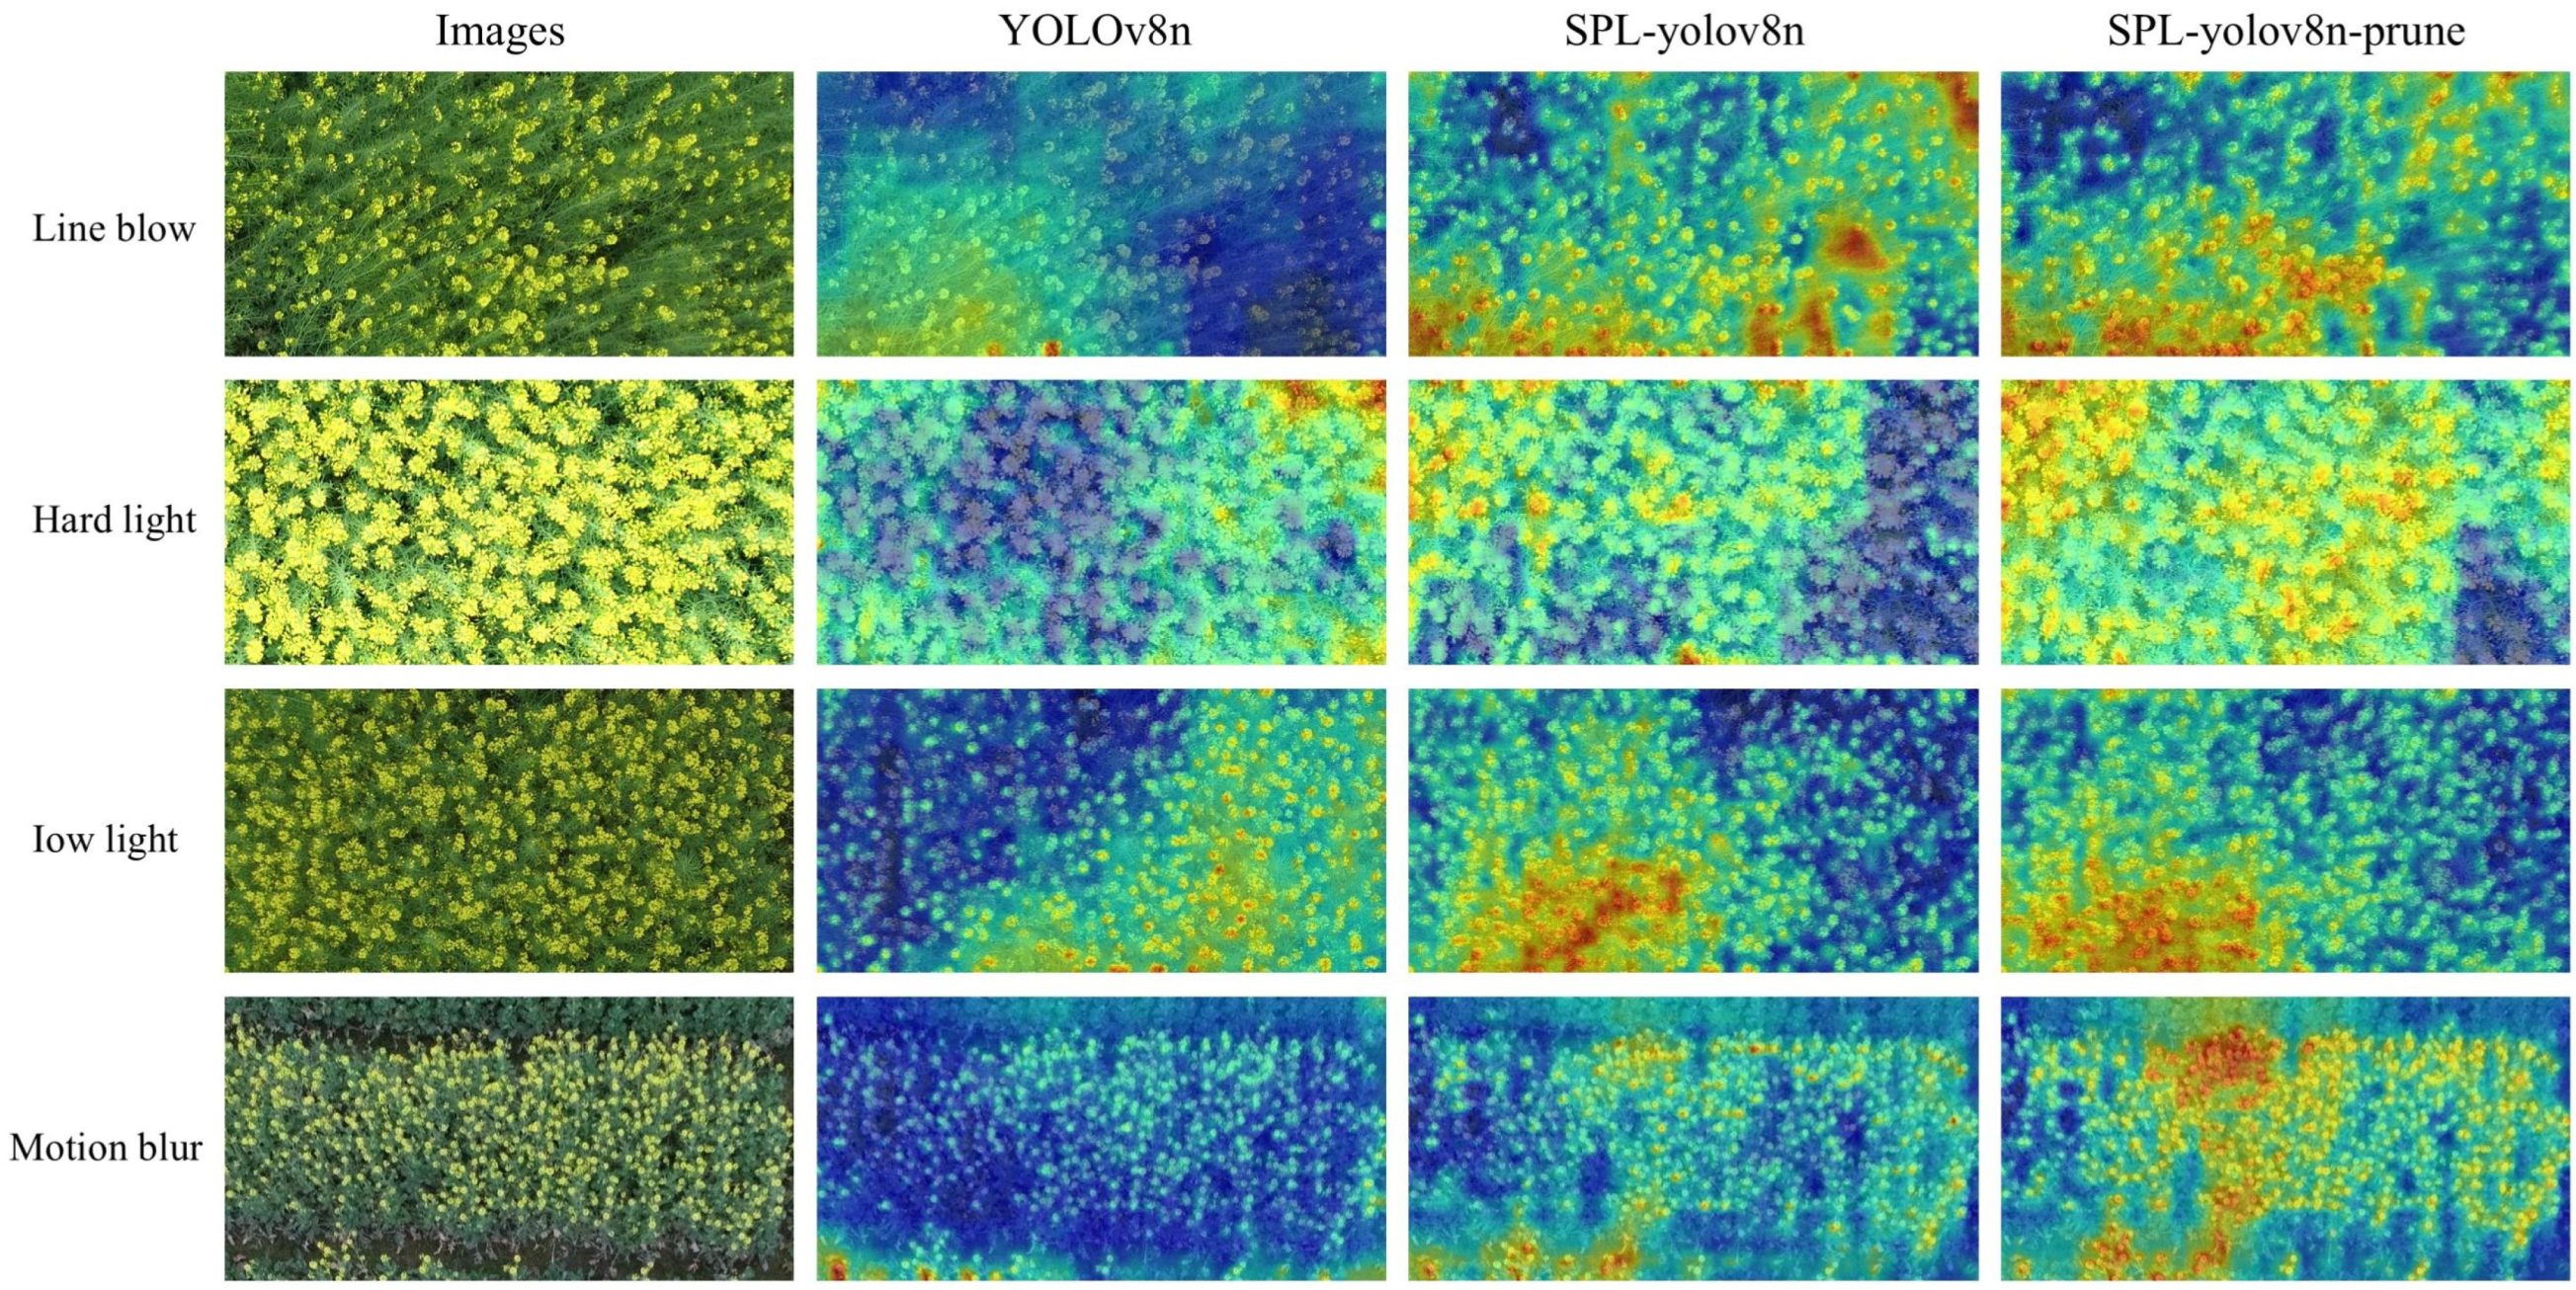
To further verify the robustness of the model under different lighting conditions, wind, motion blur or occlusion in the field, we selected four types of oilseed rape images under low light, high light, strong wind and camera motion blur conditions for the model’s robustness test. The experimental results are shown in the Figure 14. Despite the influence of different intensities of light and strong wind, through the attention heatmap, it can be observed that our SPL-YOLOv8 and SPL-YOLOv8-prune can still focus on the oilseed rape targets. Compared with the benchmark model, our model can still maintain high robustness in complex field conditions. Although in the condition of motion blur, due to the more complex background, the performance of the three models has a relatively serious decline, and the attention to the target has decreased.

5. Conclusions

Accurate yield estimation is crucial for rapeseed crop breeding. This study introduces SPL-YOLOv8, a lightweight model for rapeseed flower detection. The model employs a StarNet backbone to reduce complexity, a C2f-Star module for feature fusion to decrease storage and computational requirements while enhancing feature extraction, and a Partial Conv-based PGCD detection head with Group Normalization for multi-scale feature interaction, which reduces model parameters and improves detection of small objects. Pruning techniques further minimize runtime parameters and memory usage. SPL-YOLOv8 achieves a mean average precision of 92.1%, with 1.24 M parameters, 3.4 G GFLOPs, and a detection speed of 166.2 fps. After pruning, the model size is only 0.5 MB, with no drop in detection accuracy (AP50) on the custom dataset. Compared to the original model, computation and parameters are reduced by 86.4% and 95.4%, respectively. The pruned model’s FPS increases by 17.0% to 171.1 fps. SPL-YOLOv8 outperforms YOLOv5s, YOLOv5n, YOLOv10n, and YOLOv11n in detection accuracy, missed detections, and overall performance, making it ideal for mobile deployment.

Author Contributions

Conceptualization, Y.F.; Methodology, Y.F.; Software, Y.F.; Validation, Y.F.; Formal analysis, C.Y.; Investigation, J.L.; Data curation, J.L.; Writing—original draft, Y.F.; Writing—review and editing, J.T.; Visualization, C.Y.; Supervision, J.T.; Project administration, J.T. All authors have read and agreed to the published version of the manuscript.

Funding

This research was funded by the Major scientific and technological project of Shenzhen (No. KJZD 20230923114611023), and the National Natural Science Foundation of China (No. 42301515).

Data Availability Statement

Data are contained within the article.

Conflicts of Interest

The authors declare no conflicts of interest.

References

  1. Zhang, X.; He, Y. Rapid estimation of seed yield using hyperspectral images of oilseed rape leaves. Ind. Crops Prod. 2013, 42, 416–420. [Google Scholar] [CrossRef]
  2. Feng, H.; Wang, H. Security strategy for the nation’s edible vegetable oil supplies under the new circumstances. Chin. J. Oil Crop Sci. 2024, 46, 221–227. [Google Scholar]
  3. Mamalis, M.; Kalampokis, E.; Kalfas, I.; Tarabanis, K. Deep learning for detecting verticillium fungus in olive trees: Using yolo in uav imagery. Algorithms 2023, 16, 343. [Google Scholar] [CrossRef]
  4. Roman, A.; Rahman, M.M.; Haider, S.A.; Akram, T.; Naqvi, S.R. Integrating Feature Selection and Deep Learning: A Hybrid Approach for Smart Agriculture Applications. Algorithms 2025, 18, 222. [Google Scholar] [CrossRef]
  5. Kirkegaard, J.A.; Lilley, J.M.; Brill, R.D.; Ware, A.H.; Walela, C.K. The critical period for yield and quality determination in canola (Brassica napus L.). Field Crops Res. 2018, 222, 180–188. [Google Scholar] [CrossRef]
  6. Matar, S.; Kumar, A.; Holtgräwe, D.; Weisshaar, B.; Melzer, S. The transition to flowering in winter rapeseed during vernalization. Plant Cell Environ. 2021, 44, 506–518. [Google Scholar] [CrossRef]
  7. Li, J.; Wang, E.; Qiao, J.; Li, Y.; Li, L.; Yao, J.; Liao, G. Automatic rape flower cluster counting method based on low-cost labelling and UAV-RGB images. Plant Methods 2023, 19, 40. [Google Scholar] [CrossRef]
  8. Li, J.; Li, Y.; Qiao, J.; Li, L.; Wang, X.; Yao, J.; Liao, G. Automatic counting of rapeseed inflorescences using deep learning method and UAV RGB imagery. Front. Plant Sci. 2023, 14, 1101143. [Google Scholar] [CrossRef]
  9. Han, J.; Zhang, Z.; Cao, J. Developing a new method to identify flowering dynamics of rapeseed using landsat 8 and sentinel-1/2. Remote Sens. 2020, 13, 105. [Google Scholar] [CrossRef]
  10. d’Andrimont, R.; Taymans, M.; Lemoine, G.; Ceglar, A.; Yordanov, M.; van der Velde, M. Detecting flowering phenology in oil seed rape parcels with Sentinel-1 and-2 time series. Remote Sens. Environ. 2020, 239, 111660. [Google Scholar] [CrossRef] [PubMed]
  11. Zhang, T.; Vail, S.; Duddu, H.S.; Parkin, I.A.; Guo, X.; Johnson, E.N.; Shirtliffe, S.J. Phenotyping flowering in canola (Brassica napus L.) and estimating seed yield using an unmanned aerial vehicle-based imagery. Front. Plant Sci. 2021, 12, 686332. [Google Scholar] [CrossRef] [PubMed]
  12. Gong, G.; Wang, X.; Zhang, J.; Shang, X.; Pan, Z.; Li, Z.; Zhang, J. MSFF: A Multi-Scale Feature Fusion Convolutional Neural Network for Hyperspectral Image Classification. Electronics 2025, 14, 797. [Google Scholar] [CrossRef]
  13. Colucci, G.P.; Battilani, P.; Camardo Leggieri, M.; Trinchero, D. Algorithms for Plant Monitoring Applications: A Comprehensive Review. Algorithms 2025, 18, 84. [Google Scholar] [CrossRef]
  14. Sári-Barnácz, F.E.; Zalai, M.; Milics, G.; Tóthné Kun, M.; Mészáros, J.; Árvai, M.; Kiss, J. Monitoring Helicoverpa armigera Damage with PRISMA Hyperspectral Imagery: First Experience in Maize and Comparison with Sentinel-2 Imagery. Remote Sens. 2024, 16, 3235. [Google Scholar] [CrossRef]
  15. Sun, Z.; Li, Q.; Jin, S.; Song, Y.; Xu, S.; Wang, X.; Cai, J.; Zhou, Q.; Ge, Y.; Zhang, R.; et al. Simultaneous prediction of wheat yield and grain protein content using multitask deep learning from time-series proximal sensing. Plant Phenomics 2022, 2022, 9757948. [Google Scholar] [CrossRef]
  16. Shi, Z.; Wang, L.; Yang, Z.; Li, J.; Cai, L.; Huang, Y.; Zhang, H.; Han, L. Unmanned Aerial Vehicle-Based Hyperspectral Imaging Integrated with a Data Cleaning Strategy for Detection of Corn Canopy Biomass, Chlorophyll, and Nitrogen Contents at Plant Scale. Remote Sens. 2025, 17, 895. [Google Scholar] [CrossRef]
  17. Sun, K.; Yang, J.; Li, J.; Yang, B.; Ding, S. Proximal Policy Optimization-Based Hierarchical Decision-Making Mechanism for Resource Allocation Optimization in UAV Networks. Electronics 2025, 14, 747. [Google Scholar] [CrossRef]
  18. Xue, X.; Niu, W.; Huang, J.; Kang, Z.; Hu, F.; Zheng, D.; Wu, Z.; Song, H. TasselNetV2++: A dual-branch network incorporating branch-level transfer learning and multilayer fusion for plant counting. Comput. Electron. Agric. 2024, 223, 109103. [Google Scholar] [CrossRef]
  19. Zhang, X.; Zhu, D.; Wen, R. SwinT-YOLO: Detection of densely distributed maize tassels in remote sensing images. Comput. Electron. Agric. 2023, 210, 107905. [Google Scholar] [CrossRef]
  20. Bai, X.; Gu, S.; Liu, P.; Yang, A.; Cai, Z.; Wang, J.; Yao, J. Rpnet: Rice plant counting after tillering stage based on plant attention and multiple supervision network. Crop J. 2023, 11, 1586–1594. [Google Scholar] [CrossRef]
  21. Yadav, P.K.; Thomasson, J.A.; Hardin, R.; Searcy, S.W.; Braga-Neto, U.; Popescu, S.C.; Rodriguez, R., III; Martin, D.E.; Enciso, J. AI-Driven Computer Vision Detection of Cotton in Corn Fields Using UAS Remote Sensing Data and Spot-Spray Application. Remote Sens. 2024, 16, 2754. [Google Scholar] [CrossRef]
  22. Zhang, M.; Chen, W.; Gao, P.; Li, Y.; Tan, F.; Zhang, Y.; Ruan, S.; Xing, P.; Guo, L. YOLO SSPD: A small target cotton boll detection model during the boll-spitting period based on space-to-depth convolution. Front. Plant Sci. 2024, 15, 1409194. [Google Scholar] [CrossRef]
  23. Qian, Y.; Qin, Y.; Wei, H.; Lu, Y.; Huang, Y.; Liu, P.; Fan, Y. MFNet: Multi-scale feature enhancement networks for wheat head detection and counting in complex scene. Comput. Electron. Agric. 2024, 225, 109342. [Google Scholar] [CrossRef]
  24. Terven, J.; Córdova-Esparza, D.-M.; Romero-González, J.-A. A comprehensive review of yolo architectures in computer vision: From yolov1 to yolov8 and yolo-nas. Mach. Learn. Knowl. Extr. 2023, 5, 1680–1716. [Google Scholar] [CrossRef]
  25. Ma, X.; Dai, X.; Bai, Y.; Wang, Y.; Fu, Y. Rewrite the stars. In Proceedings of the IEEE/CVF Conference on Computer Vision and Pattern Recognition, Seattle, WA, USA, 17–21 June 2024; pp. 5694–5703. [Google Scholar]
  26. Wang, N.; Liu, H.; Li, Y.; Zhou, W.; Ding, M. Segmentation and phenotype calculation of rapeseed pods based on YOLO v8 and mask R-convolution neural networks. Plants 2023, 12, 3328. [Google Scholar] [CrossRef]
  27. Liu, L.; Zhang, S.; Bai, Y.; Li, Y.; Zhang, C. Improved light-weight military aircraft detection algorithm of YOLOv8. J. Comput. Eng. Appl. 2024, 60, 114–125. [Google Scholar]
  28. Akyon, F.C.; Altinuc, S.O.; Temizel, A. Slicing aided hyper inference and fine-tuning for small object detection. In Proceedings of the 2022 IEEE International Conference on Image Processing (ICIP), Bordeaux, France, 16–19 October 2022; pp. 966–970. [Google Scholar]
  29. Woo, S.; Debnath, S.; Hu, R.; Chen, X.; Liu, Z.; Xie, S.; He, K. ConvNeXt V2: Co-designing and Scaling ConvNets with Masked Autoencoders. arXiv 2023, arXiv:2301.00808. [Google Scholar]
  30. Doe, J.; Smith, J.; Roe, R. FarnerNet: A Lightweight Convolutional Neural Network for Agricultural Image Analysis. J. Agric. Inform. 2023, 15, 123–135. [Google Scholar]
  31. Howard, A.G.; Zhu, M.; Chen, B.; Kalenichenko, D.; Wang, W.; Weyand, T.; Andreetto, M.; Adam, H. Mobilenets: Efficient convolutional neural networks for mobile vision applications. arXiv 2017, arXiv:1704.04861. [Google Scholar]
  32. Li, Y.; Yuan, G.; Wen, Y.; Hu, E.; Evangelidis, G.; Tulyakov, S.; Wang, Y.; Ren, J. EfficientFormer: Vision Transformers at MobileNet Speed. Adv. Neural Inf. Process. Syst. 2022, 35, 12934–12949. [Google Scholar]
  33. Liu, Z.; Mao, H.; Wu, C.Y.; Feichtenhofer, C.; Darrell, T.; Xie, S. EfficientViT: Lightweight Vision Transformers for Real-Time Semantic Segmentation. arXiv 2022, arXiv:2205.14756. [Google Scholar]
  34. Liu, Z.; Lin, Y.; Cao, Y.; Hu, H.; Wei, Y.; Zhang, Z.; Lin, S.; Guo, B. BiFormer: Bidirectional Network for Visual Recognition. arXiv 2022, arXiv:2204.07369. [Google Scholar]
  35. Liu, Z.; Lin, Y.; Cao, Y.; Hu, H.; Wei, Y.; Zhang, Z.; Lin, S.; Guo, B. Swin Transformer: Hierarchical Vision Transformer using Shifted Windows. In Proceedings of the 2021 IEEE/CVF International Conference on Computer Vision (ICCV), Montreal, QC, Canada, 10–17 October 2021; pp. 10012–10022. [Google Scholar]
  36. Li, H.; Kadav, A.; Durdanovic, I.; Samet, H.; Graf, H.P. Pruning Filters for Efficient ConvNets. arXiv 2016, arXiv:1608.08710. [Google Scholar]
  37. Fang, G.; Ma, X.; Song, M.; Mi, M.B.; Wang, X. Depgraph: Towards any structural pruning. In Proceedings of the IEEE/CVF Conference on Computer Vision and Pattern Recognition, Vancouver, BC, Canada, 18–22 June 2023; pp. 16091–16101. [Google Scholar]
  38. Zhou, X.; Wang, D.; Krähenbühl, P. Objects as Points. In Proceedings of the IEEE/CVF Conference on Computer Vision and Pattern Recognition (CVPR), Long Beach, CA, USA, 16–20 June 2019; pp. 962–971. [Google Scholar]
  39. Lin, T.Y.; Goyal, P.; Girshick, R.; He, K.; Dollár, P. Focal Loss for Dense Object Detection. In Proceedings of the IEEE International Conference on Computer Vision (ICCV), Venice, Italy, 22–29 October 2017; pp. 2980–2988. [Google Scholar]
  40. Liu, W.; Anguelov, D.; Erhan, D.; Szegedy, C.; Reed, S.; Fu, C.Y.; Berg, A.C. SSD: Single Shot MultiBox Detector. In Proceedings of the European Conference on Computer Vision (ECCV), Amsterdam, The Netherlands, 11–14 October 2016; pp. 21–37. [Google Scholar]
  41. Xu, X.F.; Zhao, W.F.; Zou, H.Q.; Zhang, L.; Pan, Z.Y. Detection algorithm of safety helmet wear based on MobileNet-SSD. Comput. Eng. 2021, 47, 9. [Google Scholar]
  42. Redmon, J.; Farhadi, A. YOLOv3: An Incremental Improvement. arXiv 2018, arXiv:1804.02767. [Google Scholar]
  43. Bochkovskiy, A.; Wang, C.Y.; Liao, H.Y.M. YOLOv4: Optimal Speed and Accuracy of Object Detection. arXiv 2020, arXiv:2004.10934. [Google Scholar]
  44. Jocher, G.; Chaurasia, A.; Stoken, A.; Borovec, J.; Kwon, Y.; Michael, K.; Fang, J.; Wong, C.; Zeng, Y.; V, A.; et al. ultralytics/yolov5: v6. 2-YOLOv5 Classification Models, Apple M1, Reproducibility, ClearML and Deci. ai Integrations. 2022. Available online: https://ui.adsabs.harvard.edu/abs/2022zndo...7002879J/abstract (accessed on 8 July 2025).
  45. Li, C.; Li, L.; Jiang, H.; Weng, K.; Geng, Y.; Li, L.; Ke, Z.; Li, Q.; Cheng, M.; Nie, W.; et al. YOLOv6: A single-stage object detection framework for industrial applications. arXiv 2022, arXiv:2209.02976. [Google Scholar]
  46. Wang, C.Y.; Bochkovskiy, A.; Liao, H.Y.M. YOLOv7: Trainable bag-of-freebies sets new state-of-the-art for real-time object detectors. In Proceedings of the IEEE/CVF Conference on Computer Vision and Pattern Recognition, Vancouver, BC, Canada, 18–22 June 2023; pp. 7464–7475. [Google Scholar]
  47. Wang, A.; Chen, H.; Liu, L.; Chen, K.; Lin, Z.; Han, J. Yolov10: Real-time end-to-end object detection. Adv. Neural Inf. Process. Syst. 2024, 37, 107984–108011. [Google Scholar]
  48. Khanam, R.; Hussain, M. Yolov11: An overview of the key architectural enhancements. arXiv 2024, arXiv:2410.17725. [Google Scholar]
  49. Wang, J.; Zhang, Y.; Li, X.; Zhang, J. RT-DETR: Real-Time Detection Transformer. arXiv 2023, arXiv:2304.08069. [Google Scholar]
  50. Zhang, Y.; Zhou, D.; Chen, S.; Gao, S.; Ma, Y. Single-Image Crowd Counting via Multi-Column Convolutional Neural Network. In Proceedings of the IEEE Conference on Computer Vision and Pattern Recognition (CVPR), Las Vegas, NV, USA, 27–30 June 2016; pp. 589–597. [Google Scholar]
  51. Li, Y.; Zhang, X.; Chen, D. CSRNet: Dilated Convolutional Neural Networks for Understanding the Highly Congested Scenes. In Proceedings of the IEEE Conference on Computer Vision and Pattern Recognition (CVPR), Salt Lake City, UT, USA, 18–22 June 2018; pp. 1091–1100. [Google Scholar]
  52. Lu, H.; Cao, Z.; Xiao, Y.; Zhuang, B.; Shen, C. TasselNet: Counting Maize Tassels in the Wild via Local Counts Regression. Agric. For. Meteorol. 2019, 264, 225–236. [Google Scholar] [CrossRef] [PubMed]
  53. Lu, H.; Cao, Z. TasselNetV2+: A fast implementation for high-throughput plant counting from high-resolution RGB imagery. Front. Plant Sci. 2020, 11, 541960. [Google Scholar] [CrossRef] [PubMed]
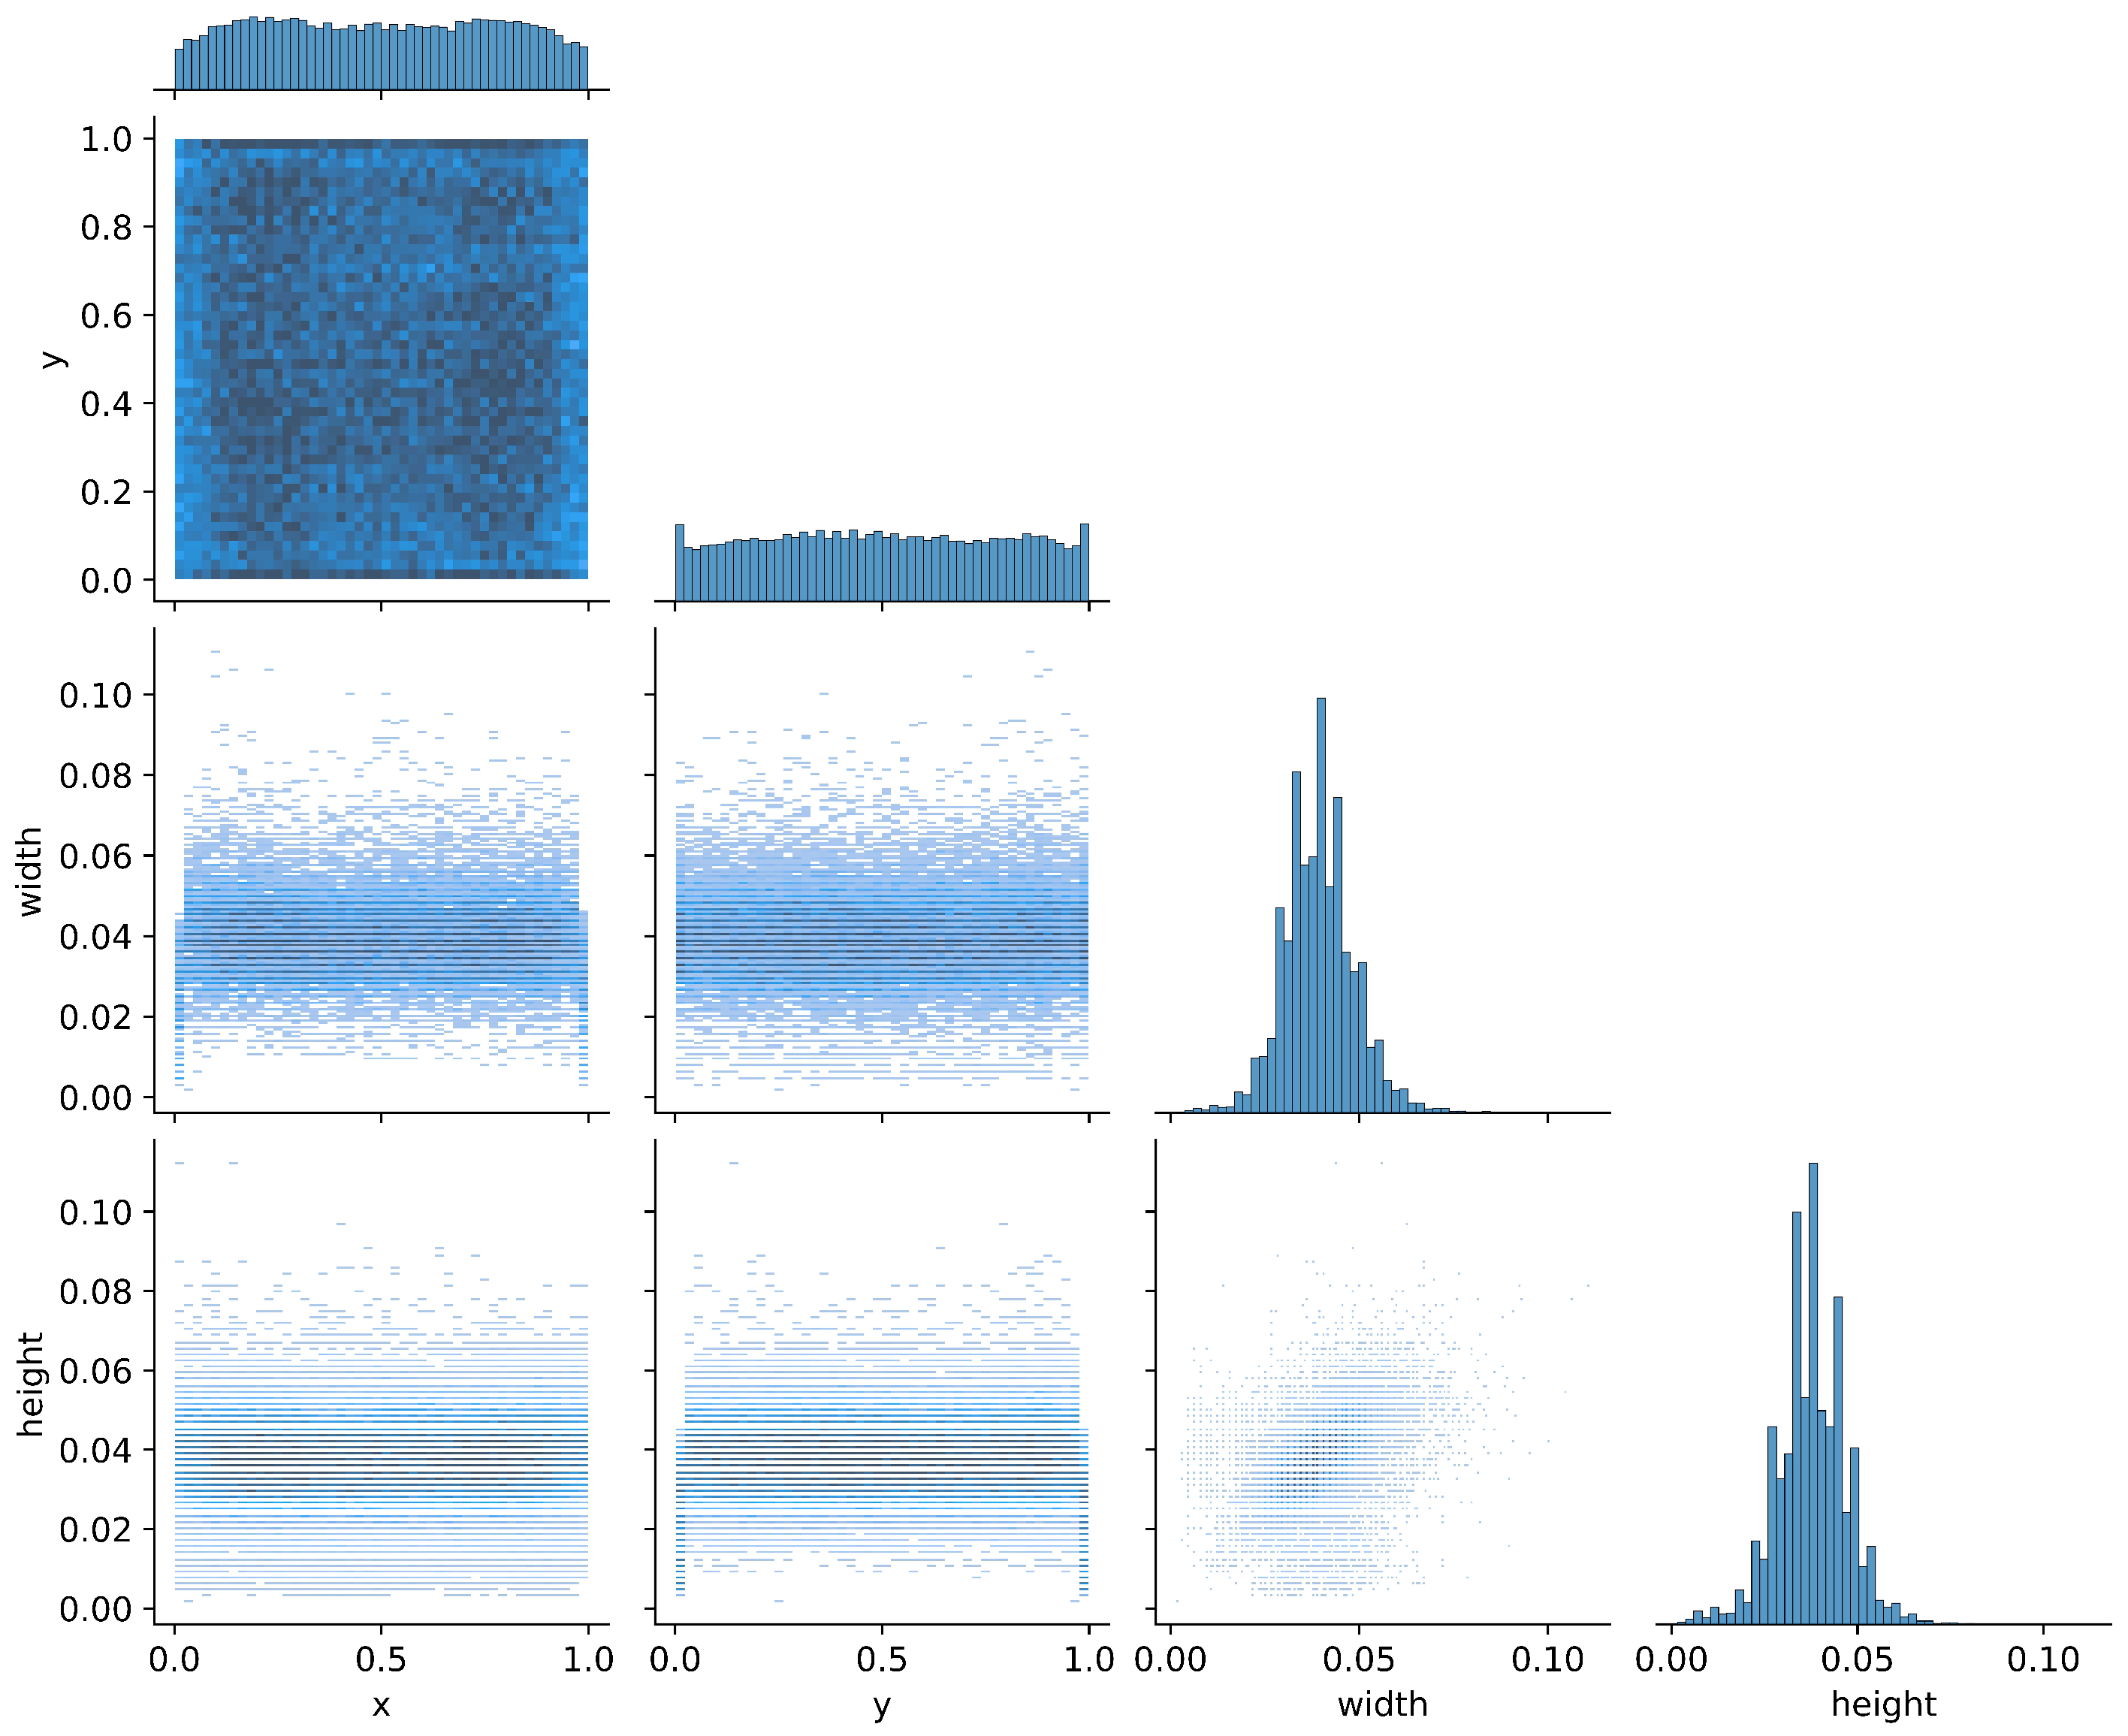
Figure 1. distribution of the center (x, y) and width and height of the dataset.
Algorithms 18 00428 g001
Figure 2. Image splitting and augmentation.
Algorithms 18 00428 g002
Figure 3. Structure of the SPL-YOLOv8 model.
Algorithms 18 00428 g003
Figure 4. StarNet network architecture.
Algorithms 18 00428 g004
Figure 5. C2f-Star network architecture.
Algorithms 18 00428 g005
Figure 6. architecture of the Lightweight Shared Detail-enhanced Convolution Detection Head (PGCD).
Algorithms 18 00428 g006
Figure 7. Description of Channel reduction and LAMP pruning process.
Algorithms 18 00428 g007
Figure 8. Detection process of rape flower clusters in large images with SAHI framework.
Algorithms 18 00428 g008
Figure 9. Heatmap with the participation of different modules.
Algorithms 18 00428 g009
Figure 10. Comparison of channels before and after pruning.
Algorithms 18 00428 g010
Figure 11. Comparison of Detection results for different models.
Algorithms 18 00428 g011
Figure 12. Visualization of counts for different models.
Algorithms 18 00428 g012
Figure 13. The coefficients of determination of YOLOv8n, SPL-YOLOv8 and SPL-YOLOv8-prune on RFRB.
Algorithms 18 00428 g013
Figure 14. Experimental tests of model robustness under different field conditions.
Algorithms 18 00428 g014
Table 1. Comparison of model training results with different backbone networks.
MethodBackbonePrecision P/%Recall R/%AP50/%Parameters/MGFLOPs/GModel Size/MB
CNNbaseline90.384.592.22.868.16.3 MB
convnextv290.085.492.45.4014.111.6 MB
Fasternet89.085.792.63.9810.78.6 MB
StarNet90.584.692.42.116.54.7 MB
ViTMobileNet89.784.892.25.7817.512.4 MB
EfficientFormerV289.886.192.84.8711.741.4 MB
efficientViT90.184.292.13.829.48.8 MB
Biformer90.286.092.74.5211.443.5 MB
Swintransformer89.886.893.038.5445.158.6 MB
Table 2. SPL-YOLOv8 module ablation experiments.
Exp No.StarNetC2f-StarPGCDAP50/%Parameters/MGFLOPs/GModel Size/MB
Exp 1×××92.22.868.16.5
Exp 2××92.12.116.54.7
Exp 3××90.82.677.75.9
Exp 4××91.32.185.45.4
Exp 5×92.01.926.14.3
Exp 692.41.243.42.8
Table 3. Comparison of results under different pruning methods.
Pruning MethodNamePruning RateAP50/%Parameters/MGFLOPs/GModel Size/MBfps
SPL-YOLOv8//92.41.243.42.8 MB166.2
lampEXP11.592.3 (−0.1%)0.49 (39.5%)2.2 (64.7%)1.3 MB141.3 (−14.9%)
EXP22.092.2 (−0.2%)0.27 (21.7%)1.7 (50%)0.8 MB167.7 (+0.9%)
EXP32.591.4 (−1.0%)0.18 (14.5%)1.3 (38.2%)0.6 MB169.6 (2.0%)
EXP43.092.2 (−0.2%)0.13 (10.4%)1.1 (32.3%)0.5 MB171.1 (+2.9%)
l1EXP11.585.7 (−7.2%)0.98 (79.3%)2.9 (85.3%)2.6 MB187.5 (+12.8%)
EXP22.088.6 (−4.1%)0.92 (74.2%)1.7 (50.0%)2.3 MB176.5 (+6.2%)
EXP32.588.7 (−4.0%)0.88 (71.0%)0.88 (25.8%)2.1 MB180.3 (+8.5%)
EXP43.087.3 (−5.5%)0.72 (58.1%)0.72 (21.2%)1.8 MB182.8 (+10.0%)
Group-SlEXP11.590.6 (−1.9%)0.79 (63.7%)2.3 (67.7%)2.2 MB167.2 (+0.6%)
EXP22.091.3 (−1.2%)0.59 (47.6%)1.7 (50.0%)1.5 MB165.9 (−0.2%)
EXP32.589.8 (−2.8%)0.45 (36.3%)1.3 (38.2%)1.3 MB160.2 (−3.7%)
EXP43.091.2 (−1.3%)0.34 (27.4%)1.1 (32.3%)1.0 MB174.7 (+5.1%)
Table 4. Comparison of our approach with mainstream models.
ModelsAP50/%Parameters/MGFLOPs/GModel Size/MBWeighted Score
Centernet90.331.15109.7124.90.71
Retinanet80.434.65163.5138.90.59
EfficientDet-D085.63.942.817.90.66
SSD89.622.52273.290.60.64
MobileNet-SSD78.217.5444.343.40.55
YOLOv384.258.67155.3235.10.53
YOLOv472.260.08141.0244.10.43
YOLOv5n92.21.684.13.90.75
YOLOv5s92.16.6815.814.40.71
YOLOv690.24.029.516.60.68
YOLOv791.05.8510.118.50.69
YOLOv8n92.22.868.16.50.74
YOLOv10n92.42.166.55.80.75
YOLOv11n92.72.466.35.50.76
RT-DETR-r1892.718.9556.940.50.73
RT-DETR-r3492.929.6788.863.00.73
SPL-YOLOv8 (ours)92.11.243.42.80.75
SPL-YOLOv8-prune (ours)92.20.131.10.50.77
Disclaimer/Publisher’s Note: The statements, opinions and data contained in all publications are solely those of the individual author(s) and contributor(s) and not of MDPI and/or the editor(s). MDPI and/or the editor(s) disclaim responsibility for any injury to people or property resulting from any ideas, methods, instructions or products referred to in the content.