An imbalance dataset was used in the experimentation where SMOTE was applied to create a balance of classes within the dataset. Furthermore, various ML models were applied with the intention of finding the model that can best classify the given dataset. After experimentation, it was observed that SMOTE-based ANN has outperformed all other models with an accuracy of 96%. It is worth mentioning that in order to prevent data leakage and ensure valid performance estimation, SMOTE was applied only within the training folds during cross-validation rather than on the entire dataset before splitting. This prevents synthetic samples from appearing simultaneously in both training and test sets. Additionally, we included an external 20% holdout validation set to assess model generalization beyond cross-validation. In order to comprehensively assess the performance of ML algorithms, additional metrics such as precision, recall, and F1-score were utilized alongside accuracy.
Table 3 depicts the evaluation results obtained after applying various ML algorithms on a balanced dataset before and after applying SMOTE. The results obtained for both classes show how SMOTE has effectively assisted in enhancing the evaluation results for the minor class, ultimately enhancing values for evaluation parameters. Moreover, to further analyze the impact of information leakage and the performance of ANN, we conducted a comprehensive comparative analysis of nine classifiers: ANN, Random Forest, SVM, KNN, Naive Bayes, Logistic Regression, AdaBoost, Bagging, and a Voting Ensemble using pairwise
t-test. Using 30 repeated runs for each model, we calculated the average accuracy and applied paired
t-tests comparing ANN’s performance against each alternative. ANN achieved a mean accuracy of 96.1%, outperforming all other models, with the next-best Random Forest averaging 85%. Paired
t-tests revealed statistically significant differences in performance (all
p-values < 0.0001), confirming that ANN’s superiority was not due to random variation but represents a robust, statistically validated improvement. The 95% confidence intervals for ANN’s accuracy (95.2–97.0%) showed no overlap with the confidence ranges of competing models, reinforcing its leading position.
Figure 3 presents boxplots illustrating the accuracy distributions across all models, clearly demonstrating ANN’s dominance in both central tendency and spread. These results establish ANN as the most effective and reliable classifier for heart disease prediction within our study framework.
Furthermore, to ensure the reliability of results external holdout of 20% was also set for testing purposes. The holdout method, which involves consistently reserving a segment of the dataset for testing while utilizing the remainder for training, guarantees that model assessment accurately represents generalizability instead of overfitting to particular data divisions, hence enhancing the reliability of the provided metrics.
Table 4 displays the average performance metrics—precision, recall, F1-measure, accuracy, and ROC-AUC—of various machine learning algorithms applied to the UCI Heart Disease dataset utilizing a cross-validation holdout of 20. The Artificial Neural Network (ANN) exhibits exceptional performance, achieving 95% accuracy, 95.3% precision, 94.9% recall, 94.8% F1-measure, and 98% ROC-AUC a, significantly surpassing traditional machine learning algorithms. Random Forest emerges as the most effective classical model, with 84% accuracy along with robust precision. Ensemble approaches, including Bagging, AdaBoost, and Voting Ensemble, attain moderate accuracies of approximately 80–81%, although individual models such as SVM, KNN, Logistic Regression, and Naive Bayes fall within the 80–82% accuracy range. Using the above results of the holdout, we further analyze the performance of ANN using ROC curve analysis, as shown in
Figure 4. It evaluates the classification efficacy of several machine learning models, with each line illustrating the balance between true positive and false positive rates across different thresholds. The Artificial Neural Network (ANN) exhibits the greatest AUC of 0.98, signifying near-perfect class discrimination and markedly higher performance compared to the other models. The elevated AUC indicates that the ANN continuously attains an optimal balance between sensitivity and specificity, hence reducing both false positives and false negatives. Conversely, models such as Logistic Regression, Naive Bayes, and the Voting Ensemble exhibit lower AUCs of 0.72, indicating diminished overall classification efficacy. The diagonal dashed line (AUC = 0.5) signifies random chance, and the greater the distance of a model’s curve below this line, the superior its predictive capability—with ANN markedly surpassing all other models in this aspect. Further, to ensure the complete efficiency of obtained results, 10-fold cross-validation is also applied, as shown in
Table 5. It can be observed from the above results that the ANN model demonstrated superior performance compared to traditional classifiers, as has also been shown in other disease prediction studies [
72,
73]. Despite ensemble methods typically performing well, ANN achieved the best balance between sensitivity and specificity after SMOTE was applied, highlighting its capacity to capture nonlinear relationships in the limited dataset. Moreover,
Table 6 summarizes the training and testing times of all employed models. Bagging and RF demonstrated the fastest execution with only 2 s for training and 0.3 s for testing; however, the performance was notably low. In contrast, AdaBoost showed high computation time (61 s training, 6.1 s testing) but with comparatively lower performance. In contrast, ANN requires more time, like AdaBoost, i.e., 69 s for training and 5 s for testing, but the performance of ANN justifies its higher computational cost.
XAI-Based Feature Importance Analysis
The main focus of this study is to integrate high-performing AI models with real-world applicability, ensuring that AI-driven heart attack prediction is both accurate and interpretable. To achieve this, (XAI) techniques, specifically LIME and SHAP, are applied to the optimal classification model, ANN.
This study focuses on enhancing model interpretability using the UCI Heart Disease dataset. LIME provides localized explanations by analyzing individual predictions, while SHAP offers global insights into feature importance, interactions, and subgroup trends. By integrating both methods, this research ensures greater transparency, reliability, and interpretability, enabling healthcare professionals to make informed, data-driven decisions for improved patient outcomes. In the rest of the section, we will examine the dataset across various XAI models in order to identify important features that are most important in regard to heart attack prediction.
Figure 5 shows the LIME analysis of the ANN model for heart attack risk assessment. The graph shows that one of the most useful features among all the features is “oldpeak”, which reveals its strong impact on the prediction. Moreover, “cp” and “thalach’ also contribute to model decisions, thus illustrating their clinical significance. Notably, the most important features are slope (weight = 0.08) and thal (weight ≈ 0.07), both showing negative correlations and having the greatest influence on the prediction of heart disease. The demographic factors “age” and “sex” are moderately important, as already shown to be the case with cardiovascular health. Finally, the importance of traditional metrics such as “trestbps”, “chol”, and “restecg” is lower in the model, which implies that these metrics do not have a prominent impact on the predictive outputs of the proposed model.
Figure 6 showcases the LIME-based local explanation of the ANN model’s prediction. It indicates an 85% probability for the “Normal” class and 15% for “Abnormal”. Features supporting “Abnormal” include age (0.07 < age ≤ 0.73) and fasting blood sugar (fbs ≤ −0.39), suggesting slight heart condition risks. Conversely, slope (≤1.02), thal (≤−0.50), and maximum heart rate (thalach > 0.72) strongly oppose the “Abnormal” prediction, associating them with better cardiac health. Resting ECG (restecg ≤ 0.96) and cholesterol (chol ≤ −0.68) provide minor negative influences. The explanation highlights slope, thal, and thalach as key in reducing heart attack risk. This transparency enhances trust in the ANN’s decision-making for medical professionals.
Figure 7 visualizes local model explanations by displaying feature weights for a specific prediction. “Age” (0.07 < age ≤ 0.73) is the top positive contributor to the “Abnormal” class, indicating a higher heart attack risk. The strongest negative contributors favoring the “Normal” class are “slope” (−0.58 < slope ≤ 1.02) and “thal” (thal ≤ −0.50), suggesting a lower risk. “Maximum heart rate achieved” (thalach > 0.72) and “fasting blood sugar” (fbs ≤ −0.39) slightly support the “Abnormal” class, while “cholesterol” (chol ≤ −0.68) and “exercise-induced angina” (exang ≤ −0.67) mildly favor the “Normal” class. Features like “resting ECG” (restecg) and “chest pain type” (cp) have minimal impact on this prediction. The model’s decision is primarily influenced by “slope”, “thal”, and “age”, with “age” being the strongest abnormality indicator. However, opposing factors suggest the model leans toward predicting “Normal”. This visualization clarifies feature contributions, enhancing trust in the model’s healthcare applications.
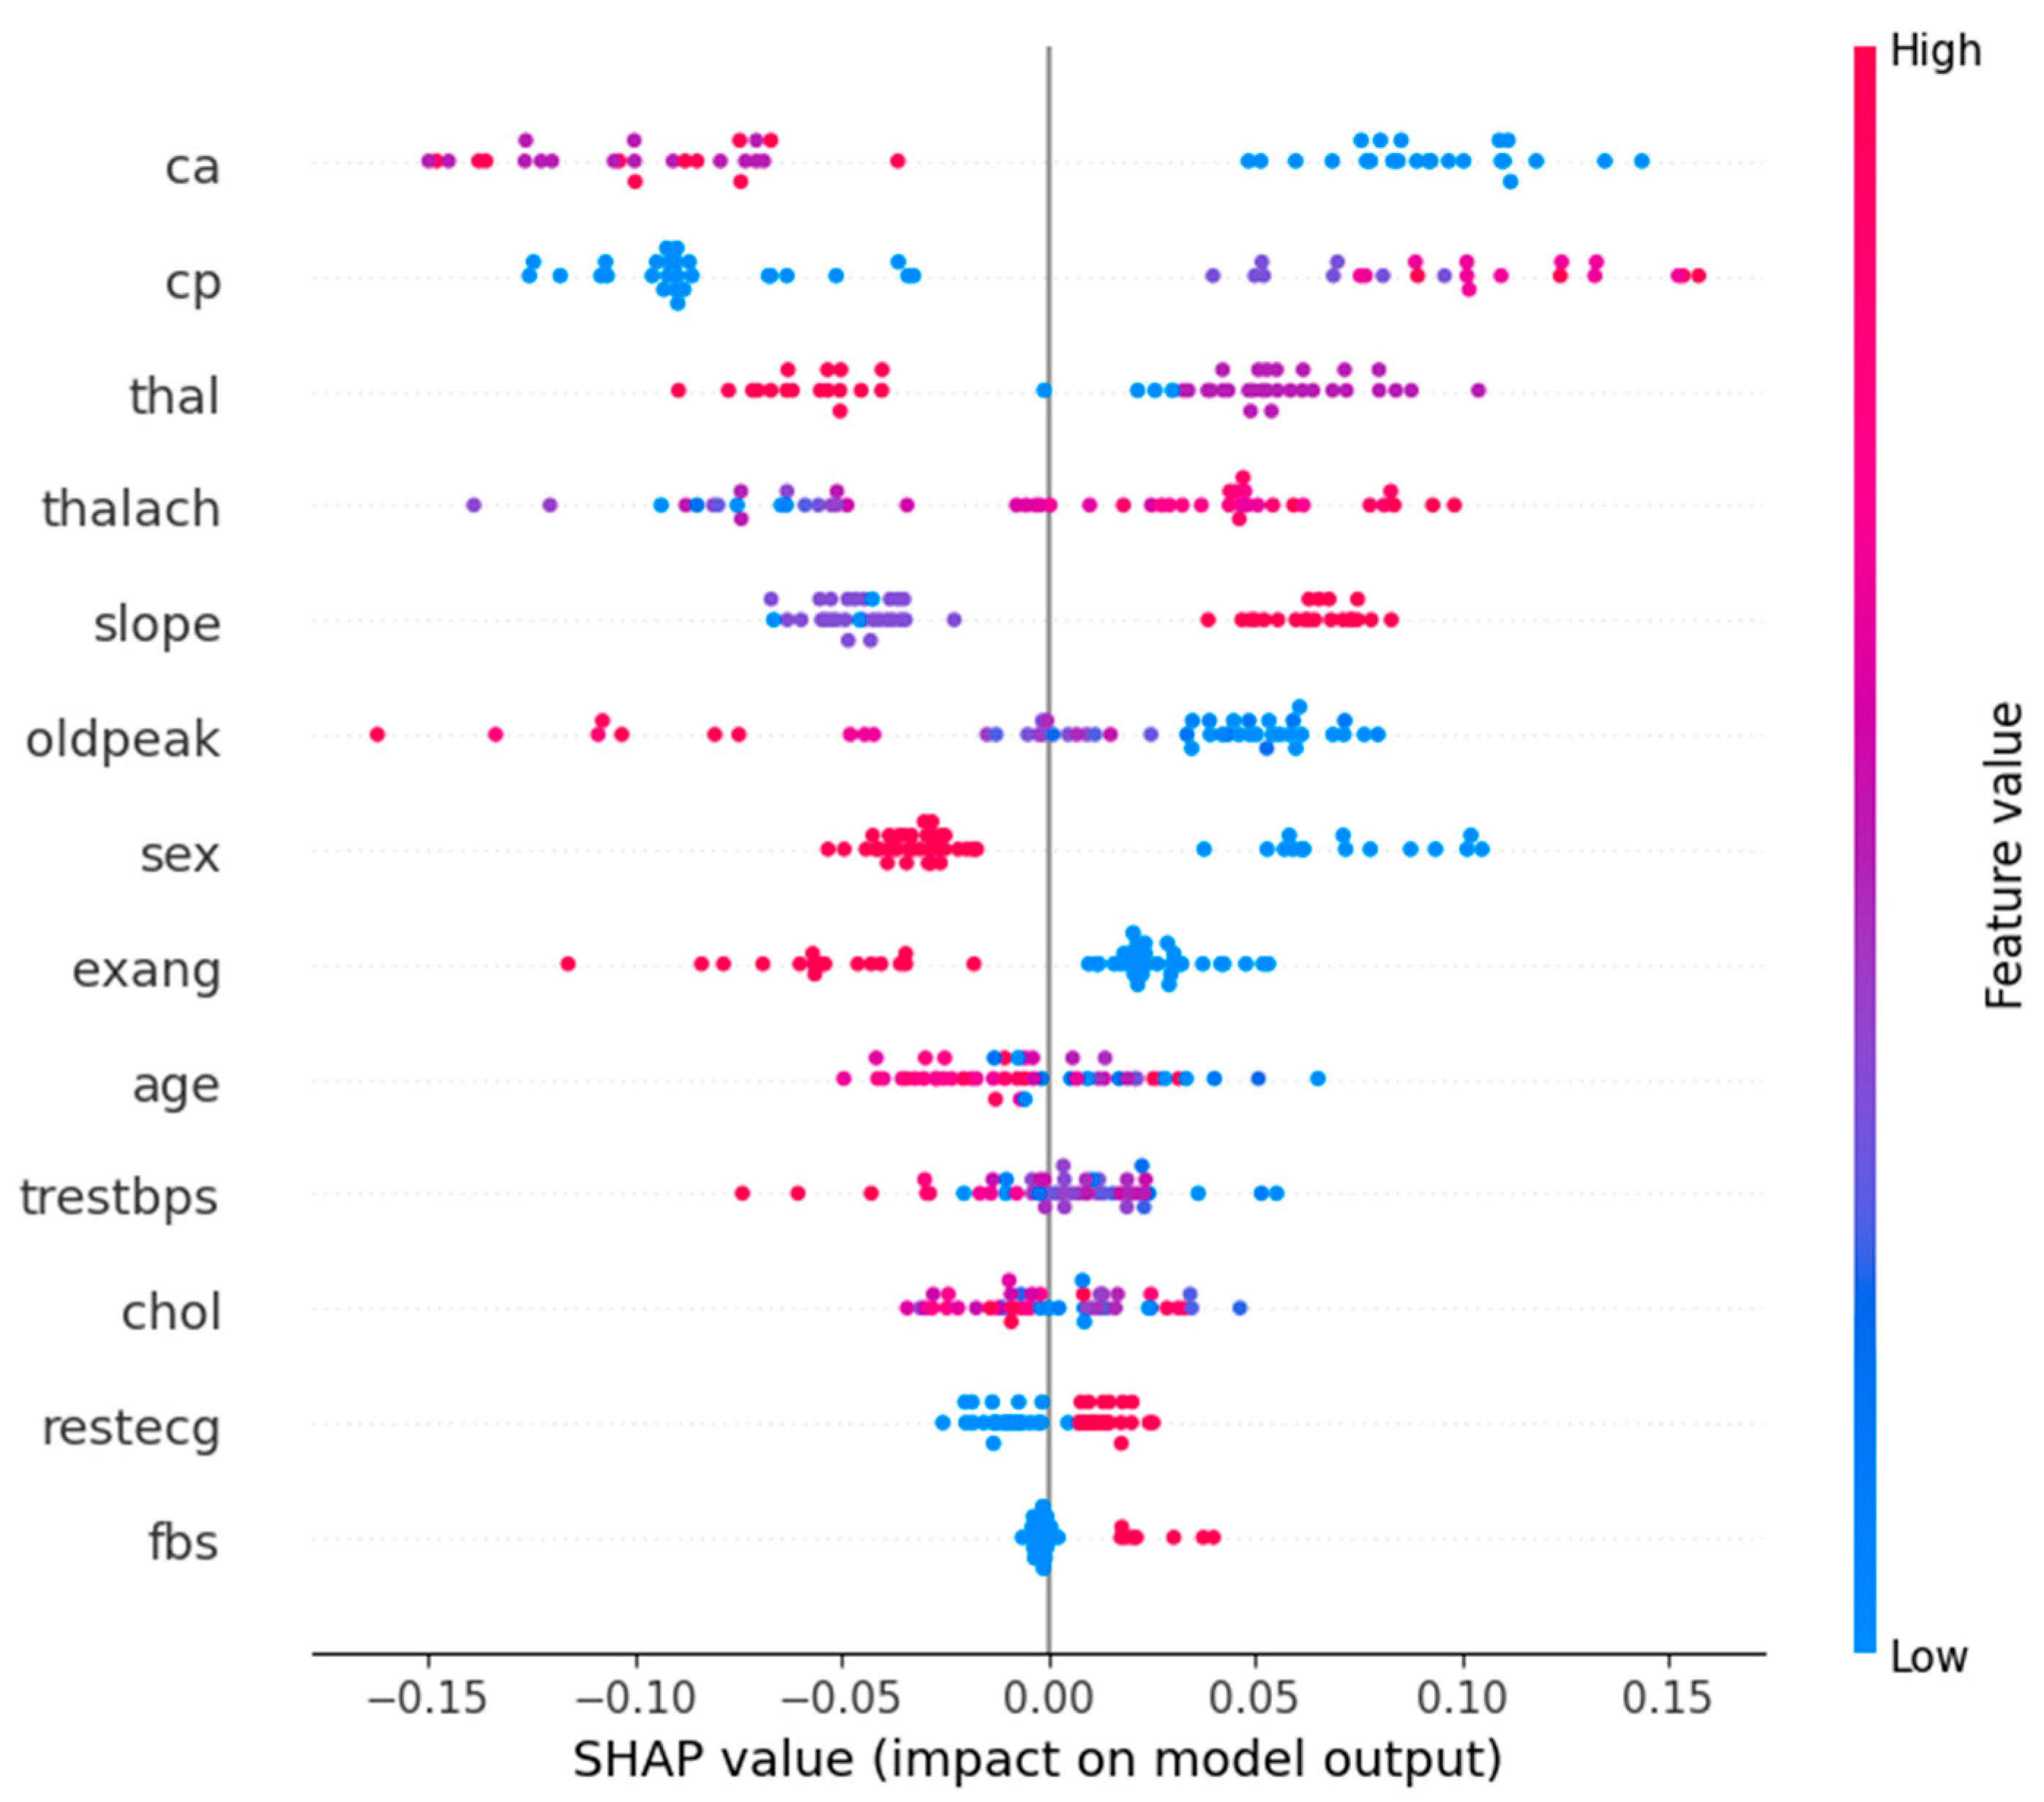
Figure 8 shows the SHAP summary plot for Class 1 (Abnormal), which corresponds to the patients who had heart attacks. It emphasizes the most important features affecting the models’ predictions. The graph concludes that “ca”, “cp”, and “thal” features are the most important features in determining whether a patient has a heart attack or not. The high values of “ca” have a high contribution to heart attack predictions, i.e., the higher the number of affected vessels, the higher the risk. Likewise, “cp” and abnormal “thal” values are also strong pointers.
On the contrary, small SHAP values for low “oldpeak” (ST depression) and “thalach” (maximum heart rate) correspond to low heart attack probability. In fact, the need for a holistic diagnostic approach is reinforced by the way complex interactions between features such as “slope”, “sex”, and “age” are captured by the model. The understanding of these feature contributions is clinically useful in helping healthcare professionals to prioritize key risk factors.
Figure 9 shows the SHAP summary plot for Class 0 (normal or not heart attack) patients with key features explained. Variables that contribute to normal classification are “cp”, “ca”, and “thal”, with comparatively low values within the graph. On the contrary, higher values of “oldpeak” and “thalach” tend to decrease the probability of being in a normal class, as these are indicative of heart problems. It shows how features like “slope” and “thalach” interact with each other to distinguish risk patients from normal patients. Clinically, “ca” and “thal” serve as strong indicators of normalcy, while “oldpeak” and “thalach” signal potential risks.
Figure 10 shows the SHAP value analysis of Class 0 (normal) and Class 1 (heart attack). After analyzing the graph, key features that contribute to Class 0 are “cp”, “ca”, and “thal”. In Class 1, oldpeak (ST depression) and slope (heart’s stress response) have the highest influence, followed by cp and ca in the heart attack prediction. Sex and thalach (max heart rate) have moderate features, while fbs (fasting blood sugar) has minimal features. It can be observed for both classes that cp and ca are dominant predictors, but oldpeak and slope have a much higher influence in heart attack cases, further proving that they are clinically relevant.
Figure 11 illustrates the SHAP force plot, showing how individual features influence a specific heart attack (Class 1) prediction. Red arrows push the model toward higher risk, while blue arrows reduce it. Key risk factors include age (57), high resting blood pressure (150), and male sex, while protective factors like no major vessel narrowing (ca = 0), atypical angina (cp = 2), and high maximum heart rate (thalach = 174) lower the probability. The base value (0.5284) represents the model’s expected output, with a final prediction of f(x) = 0.101, indicating a low heart attack likelihood. Overall, normality-driving features dominate, leading to a classification closer to normal (Class 0).
Figure 12 depicts the waterfall plot, which clearly shows how individual features influence the prediction of a heart attack. The strongest contributors to a higher likelihood of a heart attack are the absence of major vessel narrowing (ca = 0, +0.11), atypical angina (cp = 2, +0.10), and a high maximum heart rate (thalach = 174, +0.08). Additionally, a flat ST-segment slope (slope = 2, +0.07) and a fixed heart defect (thal = 2, +0.06) further push the model toward predicting a heart attack. Meanwhile, features like gender (sex = 1, −0.03) and other minor factors slightly reduce the risk, but their impact is relatively small compared to the risk-driving features. The final prediction (f(x) = 0.956) indicates a high likelihood of a heart attack, with the sum of all feature contributions leading to this outcome.
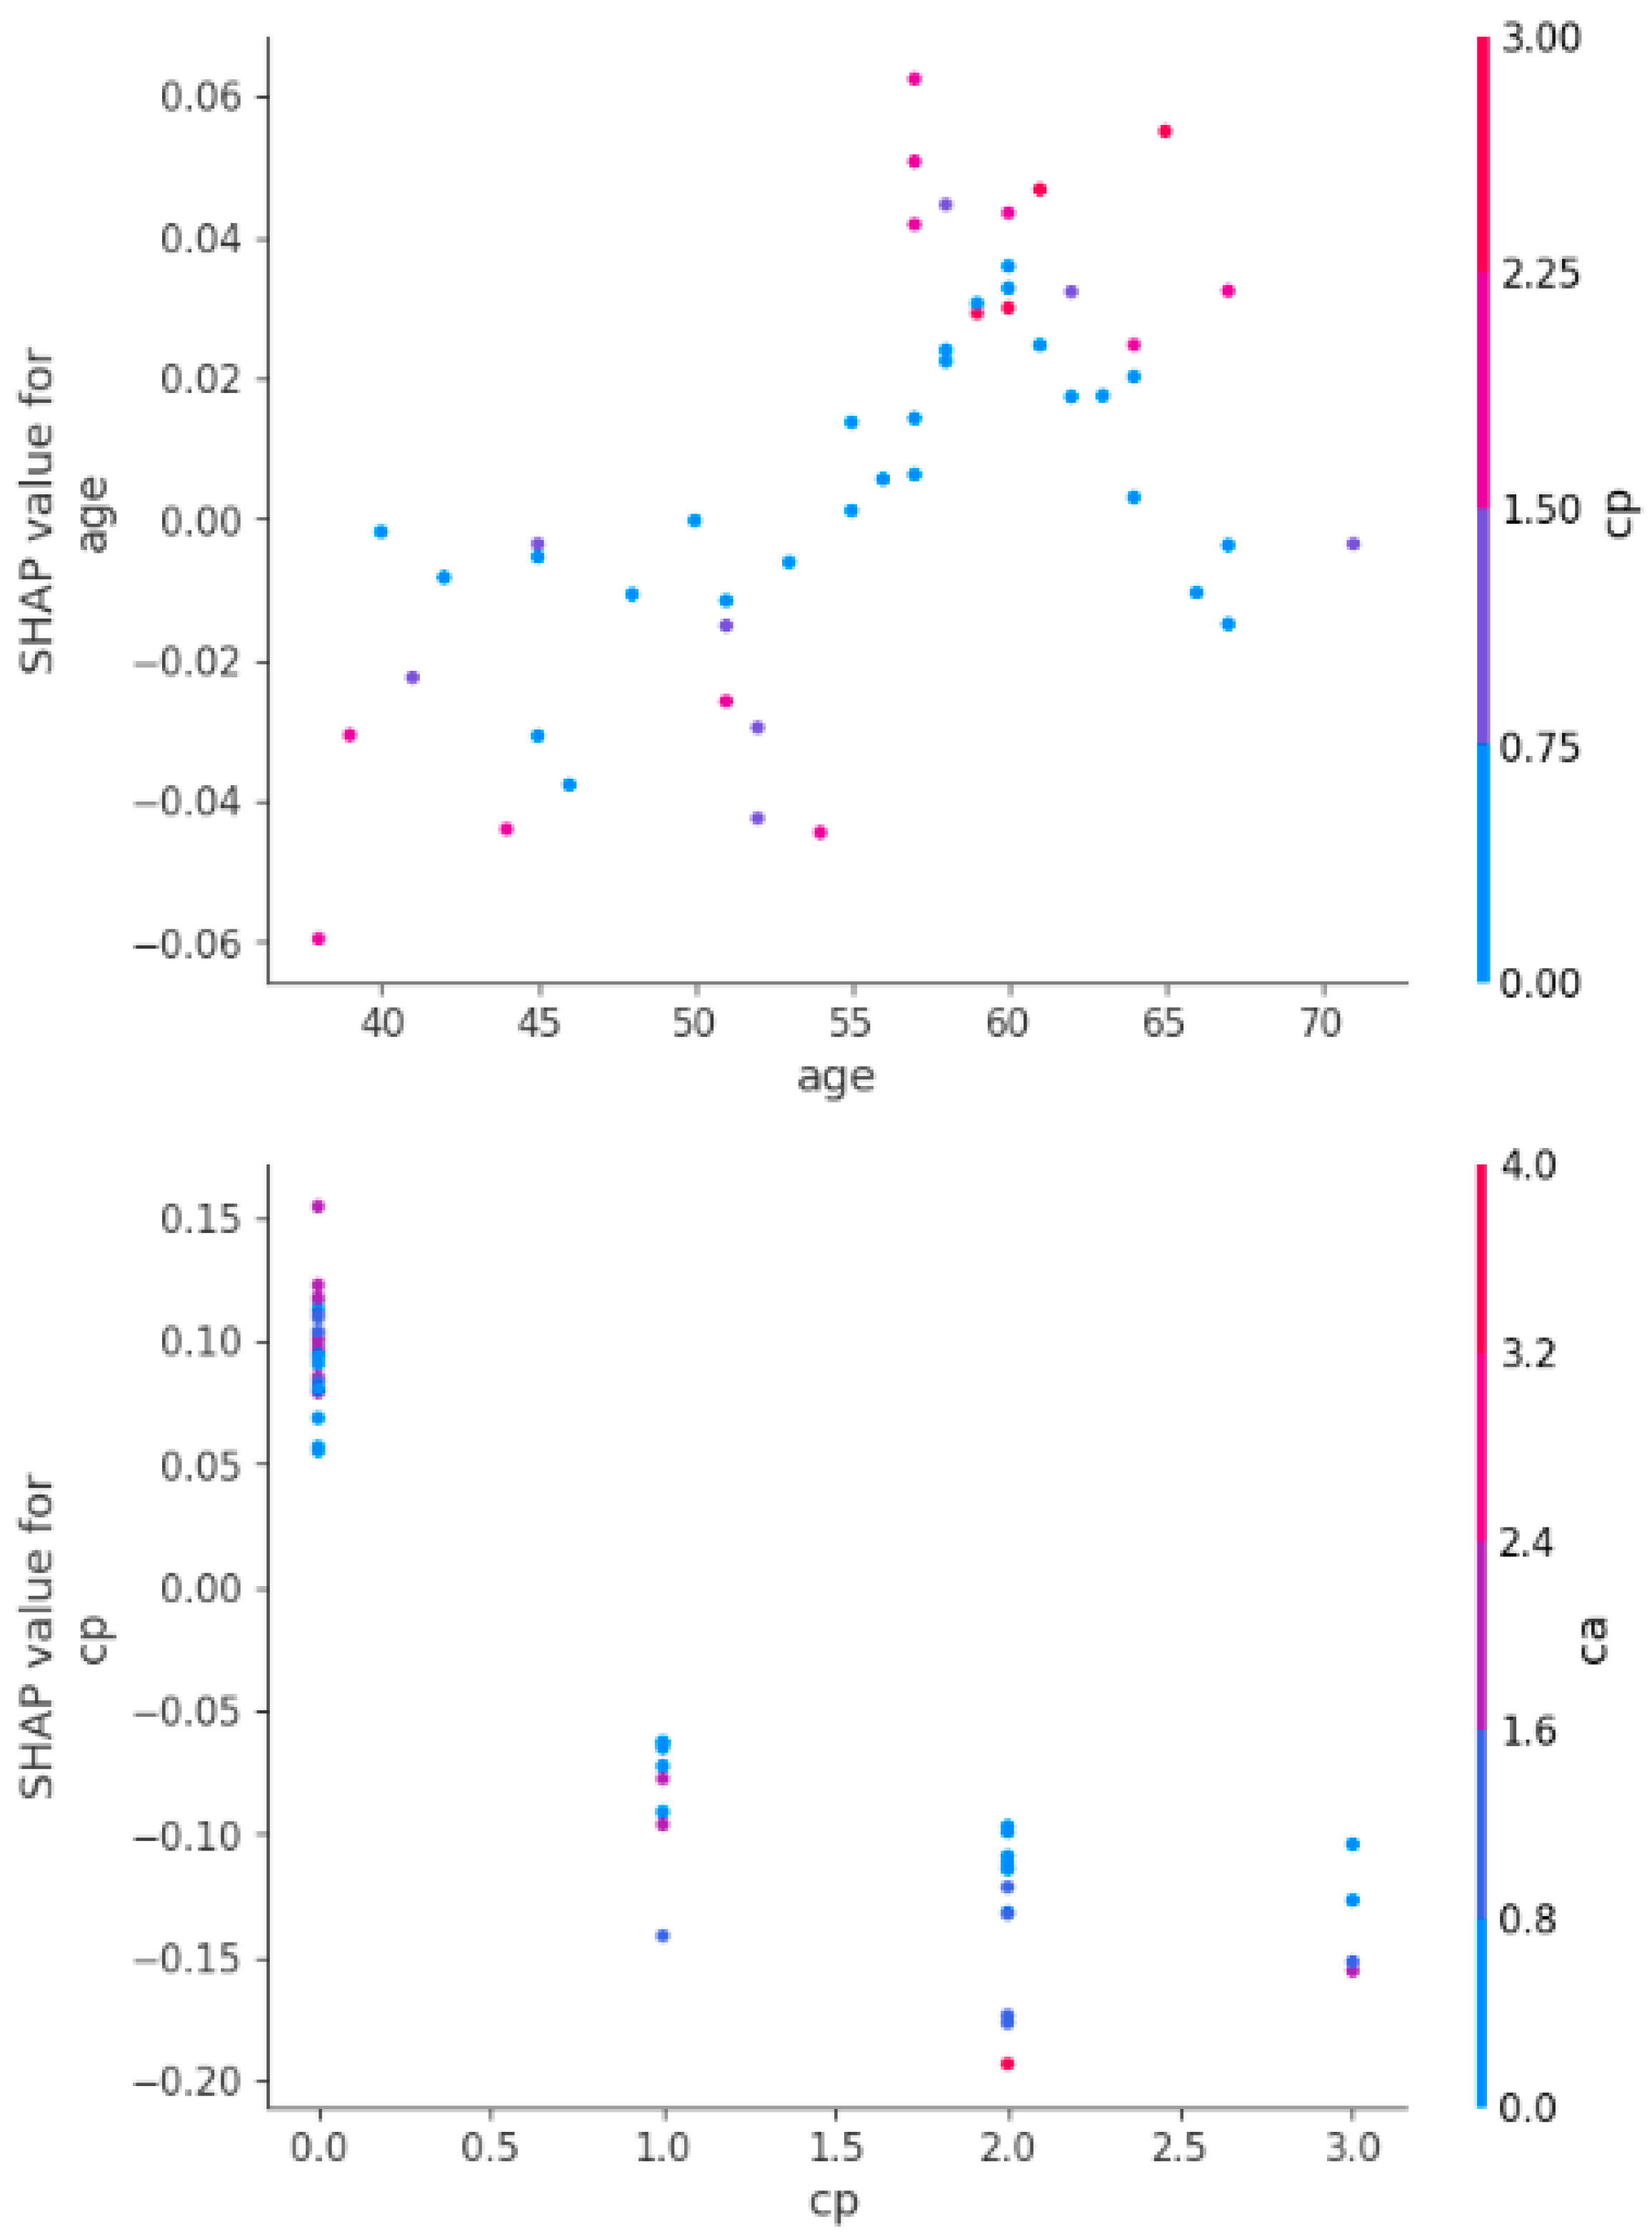
Figure 13 shows the SHAP dependence plots depicting how age and chest pain type (cp) influence heart attack predictions, showing their interactions with other features. The first plot shows that younger age reduces heart attack risk, while older age increases it, with a sharp rise in risk above 60. The second plot highlights that typical or no chest pain (low cp) has little impact, while atypical or non-anginal pain (high cp) significantly raises the risk, especially when combined with a higher number of blocked vessels (ca). Age and chest pain type are thus crucial predictors, with age steadily increasing risk and high cp values amplifying it further.
It is important to note that LIME and SHAP provide complementary perspectives on feature importance. LIME explains local predictions by approximating the model’s behavior for individual instances, while SHAP offers global feature attributions across the entire dataset. We have ensured that the combined insights from both methods align with clinically validated risk factors and provide a holistic understanding for practitioners.
Based on the analysis of the results from various XAI techniques, such as SHAP and LIME, several key features emerged as significant predictors of heart attack risk. Age consistently played a crucial role, with its increasing values contributing to a higher risk, particularly for individuals over 60 years old. Chest pain type (cp) was another dominant feature, with atypical or non-anginal pain (high cp) significantly amplifying the risk of a heart attack, especially when combined with other factors like the number of blocked vessels (ca). Other critical features identified included oldpeak (ST depression), which strongly influenced heart attack predictions, and maximum heart rate (thalach), which helped differentiate between normal and abnormal heart conditions. These features consistently appeared as high-impact contributors in the model’s decision-making process.
Further examination of the feature interactions revealed that cholesterol levels (chol) and resting blood pressure (trestbps) also had important roles, though their influence was more moderate compared to the primary predictors. Slope, thalassemia test results (thal), and sex were identified as contributors that, when combined with other factors, could shift the prediction toward higher or lower heart attack risk. The combination of age, cp, and ca were especially influential, demonstrating a complex interaction between demographic factors, clinical indicators, and physiological measurements in predicting heart attack likelihood. These insights underscore the importance of incorporating these critical features for more accurate and explainable heart disease risk assessments.


 ,
, 


