1. Introduction
Operation synchronization in production systems enhances workflow sequencing, reduces wait times, and minimizes resource waste [
1,
2]. In large manufacturing enterprises, these objectives are achieved through automation, artificial intelligence, information and communication technologies, and computational planning tools [
3,
4]. These organizations employ Enterprise Resource Planning (ERP) systems, Manufacturing Execution Systems (MESs), or real-time process simulation to coordinate tasks, adjust production schedules, and optimize machinery and personnel usage [
5,
6].
In contrast, microenterprises—particularly family-run artisanal units that manufacture multiple products simultaneously—often operate within linear production systems with multi-tasking workstations in confined spaces [
7]. The limited adoption of technology in these environments hinders efficient activity coordination, leading to idle time, unnecessary worker movement, and suboptimal resource utilization [
8,
9]. This combination of factors underscores the need for strategies to optimize task distribution and improve workflow efficiency in these smaller manufacturing systems.
Artisanal workshops organized into linear operations produce in small batches with high variability in design and materials, requiring periodic adjustments to workstations, tools, and resources [
10,
11]. Multi-product workstations predominantly rely on manual operations with simple tools, where the artisan’s experience and empirical adaptation determine the workflow [
12].
While this flexibility is valuable, it often lacks structured planning, as the arrangement of tools and materials is primarily based on immediate worker accessibility rather than workflow efficiency. As a result, inefficiencies such as unnecessary walking and downtime arise, impacting overall manufacturing system performance [
13,
14].
Beyond technological limitations, these multi-product artisanal enterprises manufacture goods on demand without adhering to standardized production processes [
15]. This necessitates constant adjustments in tool placement and operation sequencing [
16], increasing worker movement, wait times, and production delays. This ultimately leads to frequent improvisations at every stage.
Scheduling in the artisanal industry largely depends on worker experience. This lack of operation synchronization compromises operational efficiency, and dynamic space utilization [
17,
18]. These inefficiencies not only delay production but also lead to late deliveries and frequent missed deadlines. This directly affects the competitiveness of the artisanal sector in global markets [
19].
To address these challenges, the literature reports various computational and heuristic approaches to improve space allocation and activity coordination across workstations. Mathematical facility layout models have been employed to reduce unnecessary worker movement [
20], while discrete event simulation enables the assessment of different configurations before implementation [
21,
22]. Additionally, Evolutionary Algorithms have proven particularly suitable for optimizing resource allocation in constraint-laden processes [
23,
24]. These approaches have been successfully applied in the automotive, consumer goods, and agribusiness industries, readily demonstrating that operation synchronization reduces costs and production times [
25,
26,
27,
28]. However, their implementation in artisanal workshops remains limited, highlighting a gap in the application of these techniques within this sector.
While large industries have integrated advanced planning and automation systems, artisanal workshops not only resist adopting new technologies [
29] but also lack solutions tailored to their high variability. This makes it difficult to implement advanced production system optimization methodologies [
30,
31]. Some studies have explored hybrid methodologies to optimize facility layout, such as the work of Anacona-Mopan et al. [
32], who integrated discrete event simulation with the Computerized Relative Allocation of Facilities Technique (CRAFT), achieving a 13.22% reduction in material flow costs and a 4.28% decrease in workflow time. However, these approaches represent an intermediate stage between traditional heuristics and advanced combinatorial models, underscoring the need for more adaptable methodologies for the artisanal sector.
Pérez-Gosende et al. [
21] identified that initial solutions obtained through Systematic Layout Planning (SLP) can be improved with advanced tools such as Genetic Algorithms (GAs), Particle Swarm Optimization (PSO), and Variable Neighborhood Search (VNS). Additionally, simulation-based techniques such as Data Envelopment Analysis (DEA), and Multi-Criteria Decision Making (MCDM) complete the roster. Although these approaches have proven effective in industries with established infrastructure, their application in artisanal workshops remains a challenge due to spatial distribution variability and the absence of automated processes. In this context, Evolutionary Algorithms (EAs) have emerged as a more flexible alternative for layout optimization in highly dynamic environments such as the artisanal manufacturing system studied in this work. However, while the literature highlights the feasibility of applying computational optimization techniques in production systems with spatial and technological constraints, this remains an underexplored aspect for these microenterprises.
This study poses the following research question: Can an Evolutionary Algorithm (EA) effectively optimize the workstation layout and worker movements in artisanal workshops?
Despite advances in facility layout optimization using heuristic and metaheuristic approaches, important gaps remain in the literature. First, most studies focus on industrial settings with fixed workflows and automated operations, overlooking the complexity of artisanal systems with multiproduct environments and little to no automation. Secondly, although methodologies such as SLP, CRAFT, and hybrid models have shown efficiency in structured environments, their application in dynamic artisanal workstation configurations is limited. Thirdly, there is little empirical validation of Evolutionary Algorithms in real-world artisanal workshops, particularly in Latin American contexts characterized by spatial, technological, and organizational constraints. Finally, the literature lacks methodological frameworks adapted to simultaneous product manufacturing, where coordination between workers and stations must occur without advanced technologies. This study addresses these gaps by proposing and validating an Evolutionary Algorithm designed for flexible-tasking, low-automation, multiproduct artisanal workshops.
This study evaluates the efficiency of an EA in optimizing facility layout for human–machine operations in a multi-product artisanal manufacturing system with flexible workstations. Through simulations based on a real-world case study, the EA’s impact on reducing idle time and unnecessary worker movement between stations is analyzed, comparing its performance against conventional facility layout optimization methodologies. In this regard, this work contributes to the application of EAs within the artisanal sector, providing a robust methodological framework to enhance operational efficiency in these simple, high-variability environments.
In this context, the present study contributes to the body of knowledge through three main aspects: (1) the application of an EA to optimize the workstation layout in an artisanal workshop with simultaneous multiproduct elaboration (an environment that remains underexplored in the literature); (2) the computational validation of the model through simulations in ProModel®, comparing its performance with conventional methods such as SLP and CRAFT; and (3) the generation of empirical evidence demonstrating significant reductions in operator travel distances and total system time. This last point contributes to improved operational synchronization and spatial efficiency in old-style, multi-tasking environments. These contributions provide a foundation for future research for the integration of advanced optimization techniques in this area.
2. Materials and Methods
This study adopts a quantitative, experimental, and computational approach to optimize workstation layout in an artisanal workshop, with multi-product elaboration and flexible workstations. An EA is implemented to minimize worker travel distances and reduce downtimes, aiming to synchronize operations.
This study compares the performance of the EA against traditional methods, including SLP and the CRAFT algorithm. The evaluation is conducted through computational simulation using ProModel
® Version 7 [
33], allowing for an assessment of the EA’s effectiveness in terms of reducing walking distances and production times.
2.1. Description of the Production System
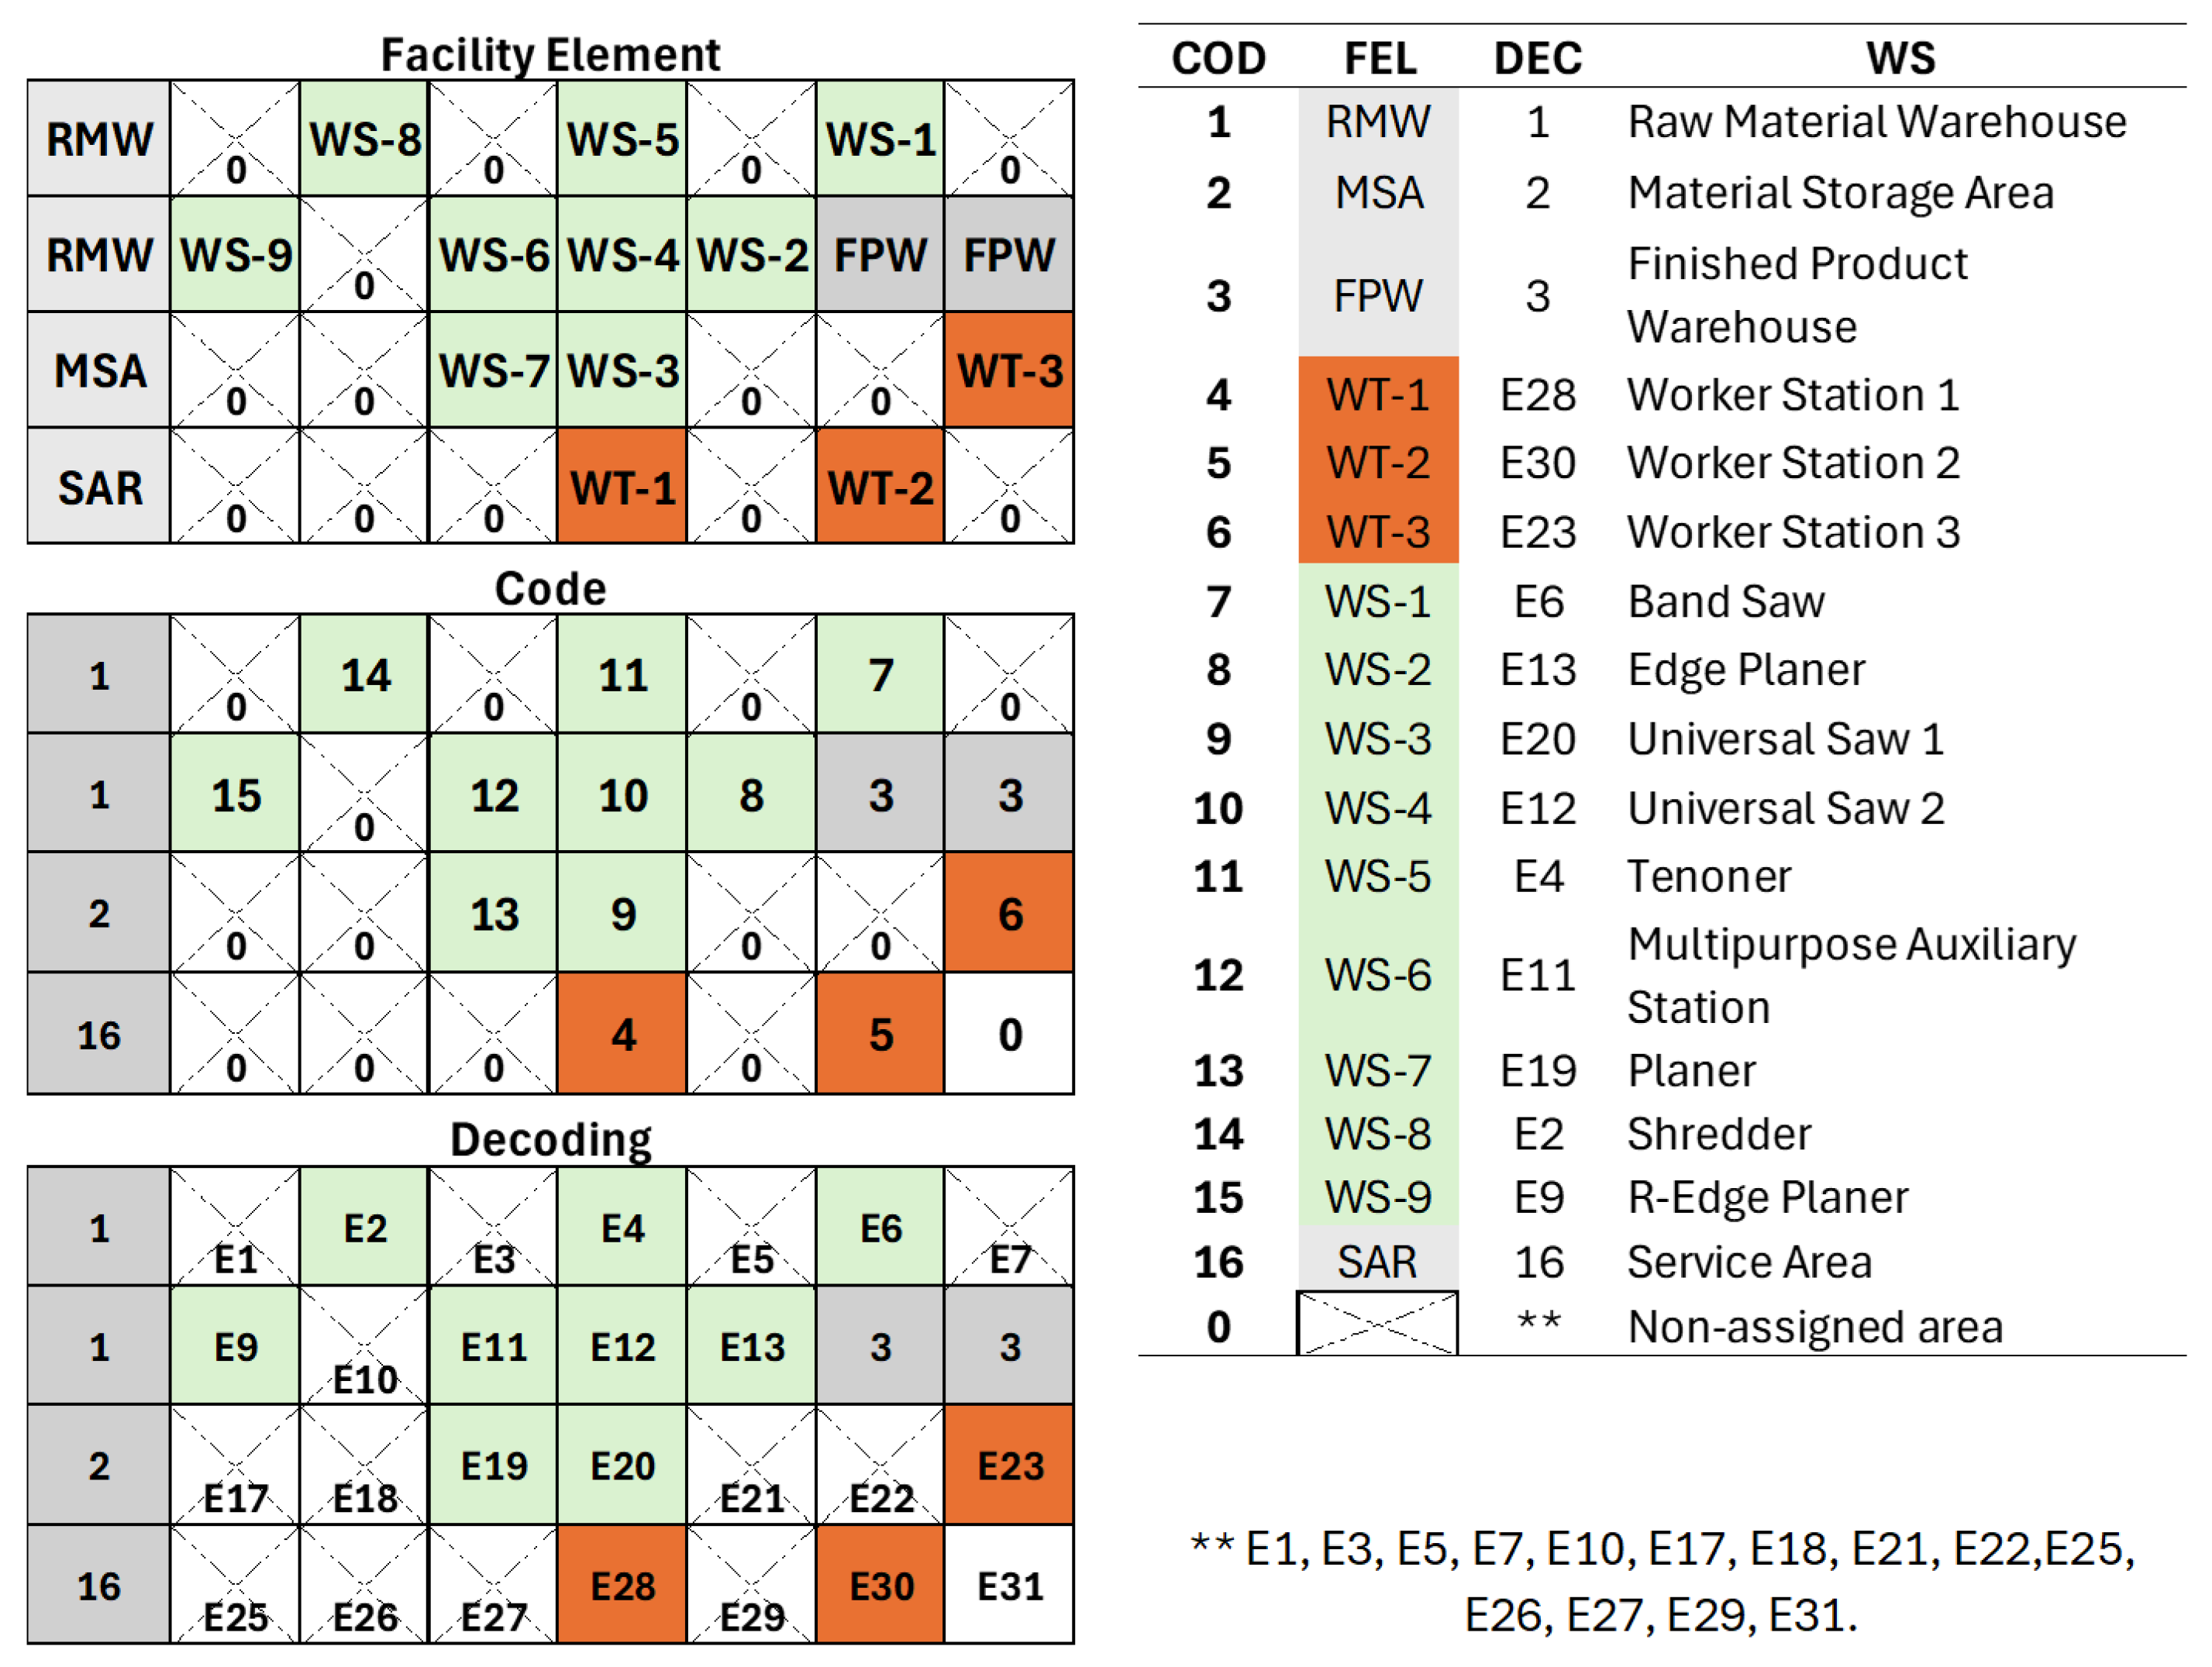
This study was conducted in an artisanal wooden furniture workshop, where production is based on small batches with high product variability. The work area, which has a rectangular layout, covers a total surface of 166.50 m
2 and consists of an initial workstation arrangement that includes nine workstations (WS), a material storage area (MSA), a finished product storage area (FPW), and three worktables (WT) (
Figure 1).
Due to the simultaneous use of flexible workstations, workers frequently move between stations as needed during the furniture-manufacturing process. The initial workstation layout in this artisanal sector is primarily based on the workshop owner’s preference rather than on the actual demand for each operation. This arrangement, originally designed for single-product manufacturing, becomes inefficient when multiple furniture pieces are produced simultaneously. As a result, idle times increase, and workflow disorganization occurs, as a single furniture piece may require attention at certain stations multiple times or in a different sequence depending on its manufacturing process.
2.2. Mathematical Formulation of the Problem
The facility layout issue with equal spaces is formulated as a discrete assignment problem, where WS must be optimally positioned to minimize the total distance traveled by workers within the production area. The workspace is structured as a rectangular grid of 4 × 8 equally sized cells, forming the layout matrix. The following notation is used throughout the model:
i ∈ I = {1,2,3,4}: row index of the layout matrix.
j ∈ J = {1,2,…,8}: column index of the layout matrix.
k ∈ K = {1,2,…,16}: index of workstations (WS).
l ∈ L = {1,2,3}: index of workers.
N = |K|: 16: total number of assignable positions in the matrix.
d(i,j),(i’,j’): Euclidean distance between two cells: (i,j) and (i’,j’).
rl: route assigned to worker l, as a sequence of WS positions.
sl: ordered set of cells visited by worker l based on task sequence.
dl: total travel distance incurred by worker l.
xijk ∈ {0,1}: binary decision variable: 1 if workstation k is placed at cell (i,j), 0 otherwise.
The objective function that minimizes the total distance of all workers is as follows:
Constraints.
The total travel distance for each worker
l is computed as the sum of Euclidian distances between consecutive cells in the route s
l, given the layout defined by the decision variables:
Each workstation must be assigned to exactly one location:
Each cell can host at most one workstation:
The total number of assigned cells equals the number of workstations:
Fixed pre-assignments. Some workstations are pre-assigned to specific locations due to physical or infrastructure constraints:
The proposed model seeks to optimize the facility layout by minimizing the total travel distance of all workers, as defined in objective function (1). This objective is needed for improving process efficiency and reducing idle time within the production system. Constraint (2) ensures that each worker’s assigned route aligns with the spatial distribution of workstations, enabling accurate distance calculations based on Euclidean metrics between consecutive cells. Constraint (3) ensures that each workstation is assigned to exactly one location, while constraint (4) prevents multiple workstations from being placed in the same cell, preserving the validity of the layout. Constraint (5) ensures that the number of assigned workstations equals the number of assignable positions, guaranteeing full use of available space. Constraints (6) to (11) define fixed assignments for specific workstations due to infrastructure limitations or operational requirements, such as storage zones or immovable equipment. Lastly, constraint (12) enforces the binary nature of the decision variables, ensuring each assignment is discrete and clearly defined, which is essential for the structure of the facility layout optimization.
2.3. Proposed Evolutionary Algorithm
Evolutionary Algorithms have been widely applied in industrial engineering for resource allocation and facility layout efficiency problems. In this study, an EA is implemented to optimize the placement of workstations in wooden furniture workshop. The EA follows three main stages: (1) generation of the initial population, where 10,000 individuals are created, each representing a unique workstation layout configuration; (2) crossover, where high-performing individuals are selected, and their characteristics are combined to generate new solutions; and (3) mutation, where random changes are introduced to prevent premature convergence to suboptimal solutions.
The iterative process terminates when either the maximum number of generations is reached or no significant improvement in worker travel distance is observed over a predetermined number of consecutive iterations. In this regard, the pseudocode in
Appendix A.1 outlines a simplified Evolutionary Algorithm, where an initial population of individuals is generated and evaluated using an objective function. Over multiple generations, the population evolves through two key processes: survival and reproduction.
In the survival process, a subset of individuals is randomly selected for the next generation, where they may mutate with a given probability before being inserted into the new population. Meanwhile, in the reproduction process, two individuals are selected via a tournament mechanism, undergo crossover with a defined probability to generate offspring, and subsequently, these offspring may mutate before being evaluated and integrated into the next generation. Thus, this iterative process enables the population to evolve progressively, adapting to the optimization problem and improving performance with each generation.
Although the structure of the proposed EA relies on classical operators—selection, crossover, mutation, and survival—its novelty lies in its adaptation to the context of multiproduct artisanal manufacturing. The EA encodes solutions as 4 × 8 cell matrices that represent the actual workspace, including fixed areas such as storage zones and service areas. The crossover and mutation processes include validation routines to ensure that the solutions remain feasible. Additionally, a decreasing mutation rate—from 80% to 5%—was used to maintain diversity at the beginning and promote convergence in later stages. This configuration was fine-tuned through sensitivity analysis. The EA is integrated with the ProModel® simulation environment, allowing for performance evaluation that considers operation synchronization and the actual movements of operators. These features make the algorithm suitable for high-variability, non-automated production settings.
2.4. Case Study
2.4.1. Input Parameters (Constraints)
The search area for the EA corresponds to a rectangular surface divided into 4 rows and 8 columns, resulting in 32 equal-sized location cells. Within this matrix, certain cells are preassigned to fixed areas, specifically: the Raw Material Warehouse (AMP), the Material Storage Area (AMT), the Temporary Warehouse for Finished Products (TWFP), and the Service Zone (S).
Moreover, workers manufacture different products and follow specific workstation sequences. The total travel distance evaluation is based on the Euclidean distance between cells, and all workers begin production simultaneously.
2.4.2. Individual Encoding
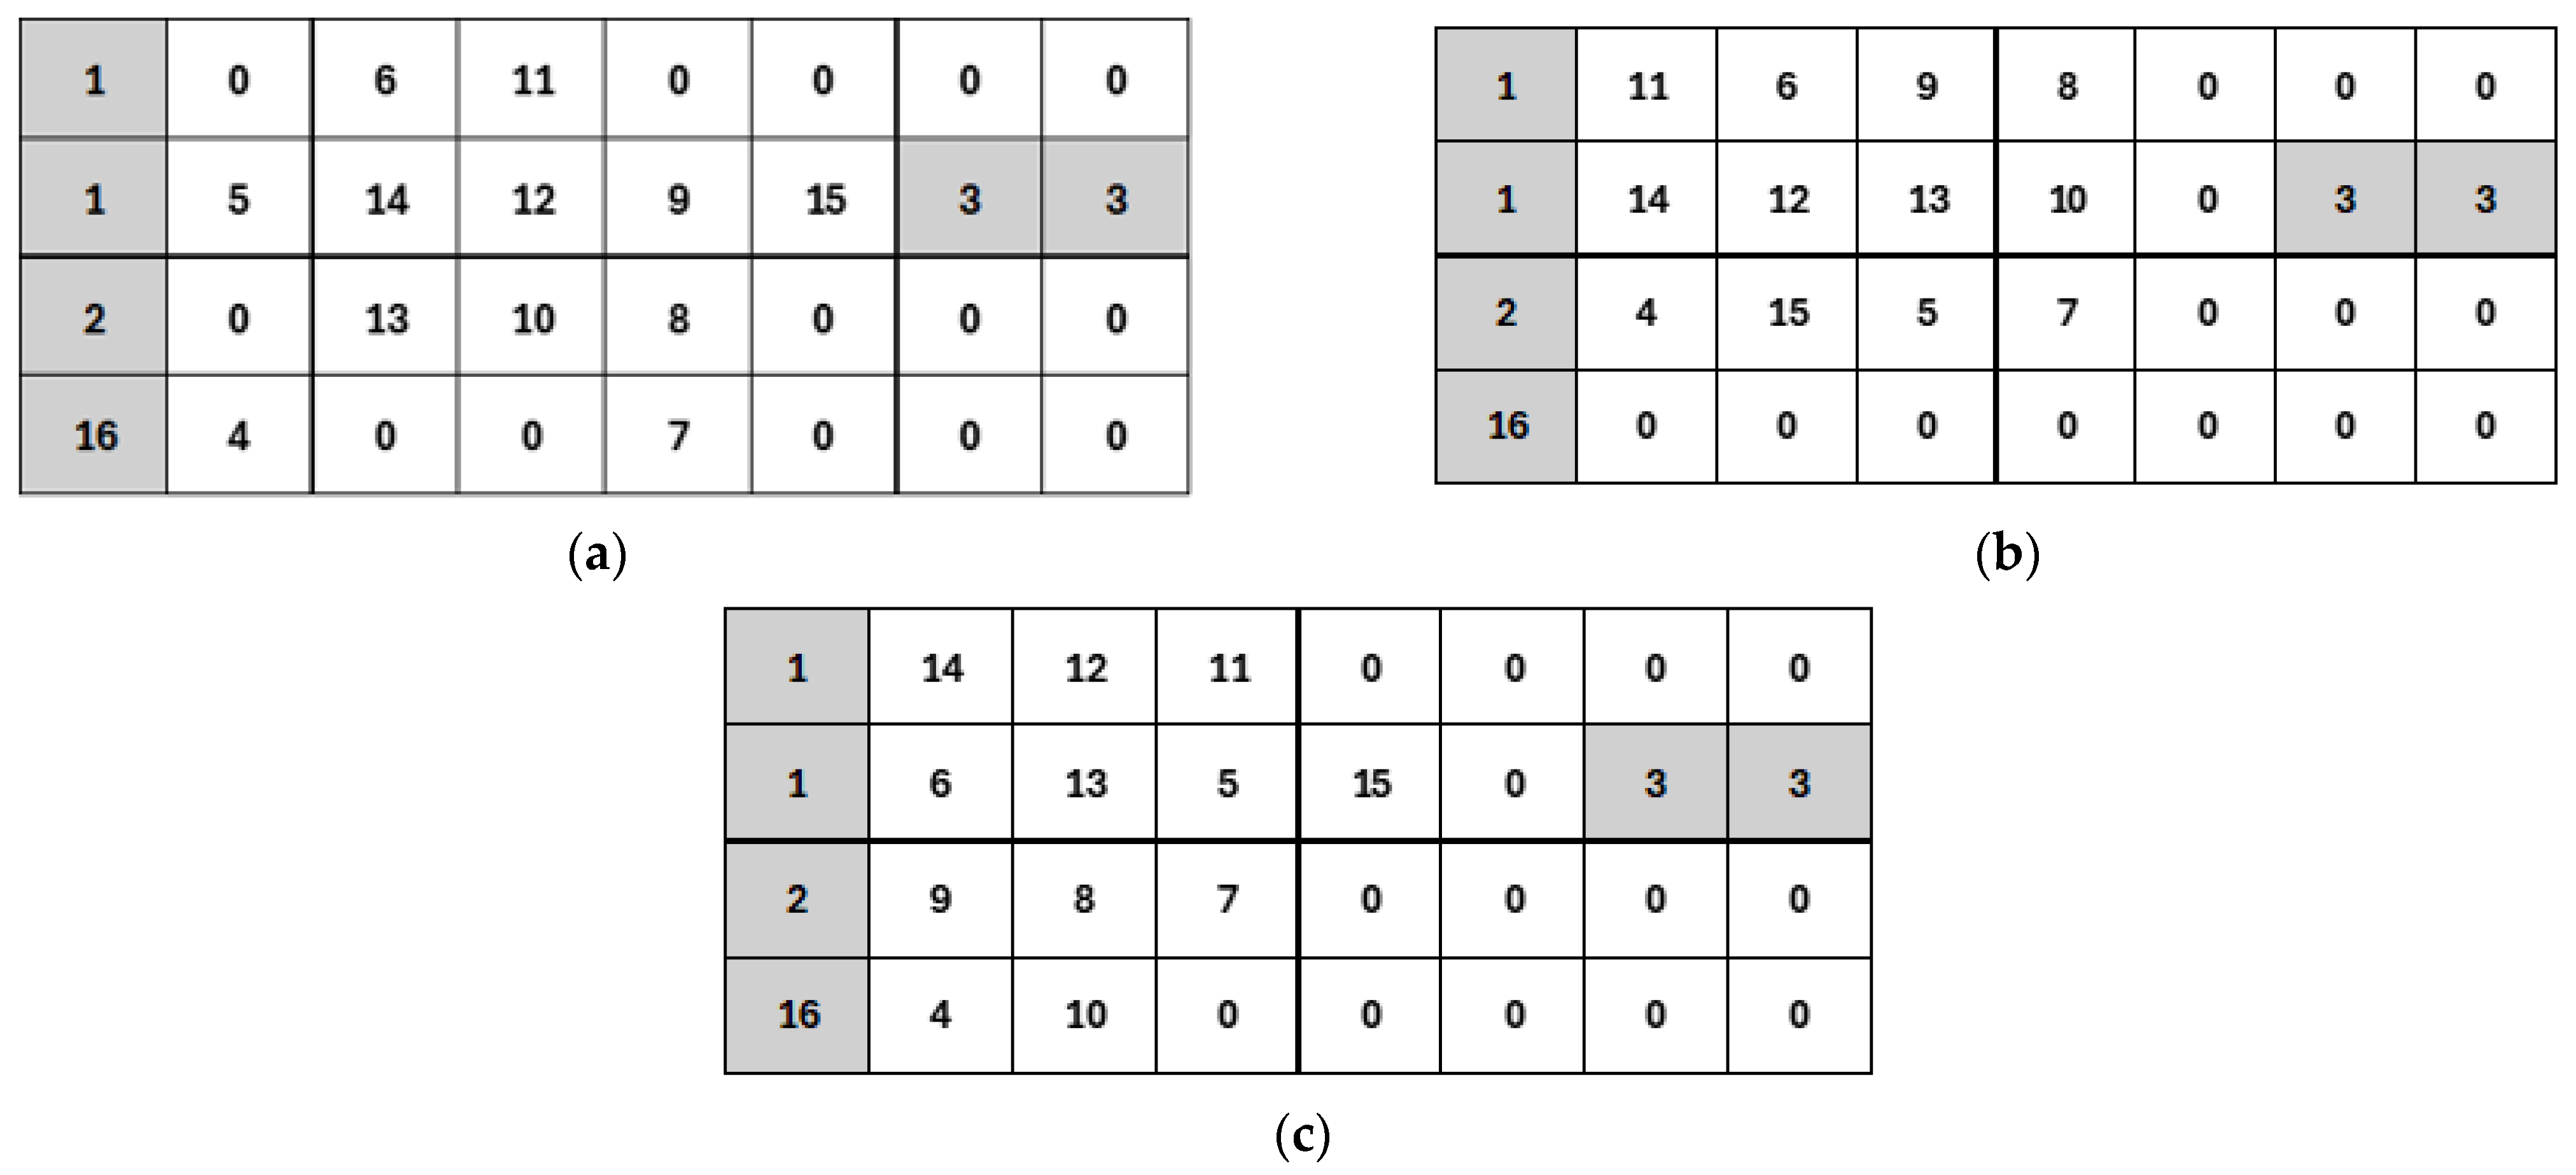
Each solution within the EA is represented as a 4 × 8 matrix, where each cell has a unique assignment to facilitate its evaluation. Additionally, some cells are preassigned to fixed areas, ensuring that realistic constraints are maintained within the model.
In this context,
Figure 1 illustrates the initial facility layout, including preassigned fixed areas corresponding to the Raw Material Warehouse (RMW:1), the Material Storage Area (MSA:2), the Finished Product Warehouse (FPW:3), and the Service Area (SAR:16). The figure also establishes the relationship between facility elements and their respective alphanumeric codes.
2.4.3. Initial Population Generation
The number of generations and initial population size were determined based on previous studies in heuristic optimization [
23,
24]. Specifically, a population size of 5000 individuals and a maximum of 1000 iterations were established to ensure a balance between searched space exploration and convergence toward an optimal solution. To prevent premature convergence and enhance solution diversity, the mutation rate was gradually reduced from 80% to 5% throughout the evolutionary process. These values were experimentally adjusted and later validated through sensitivity analysis in the simulation. The procedure for generating a new individual is detailed in
Appendix A.2.
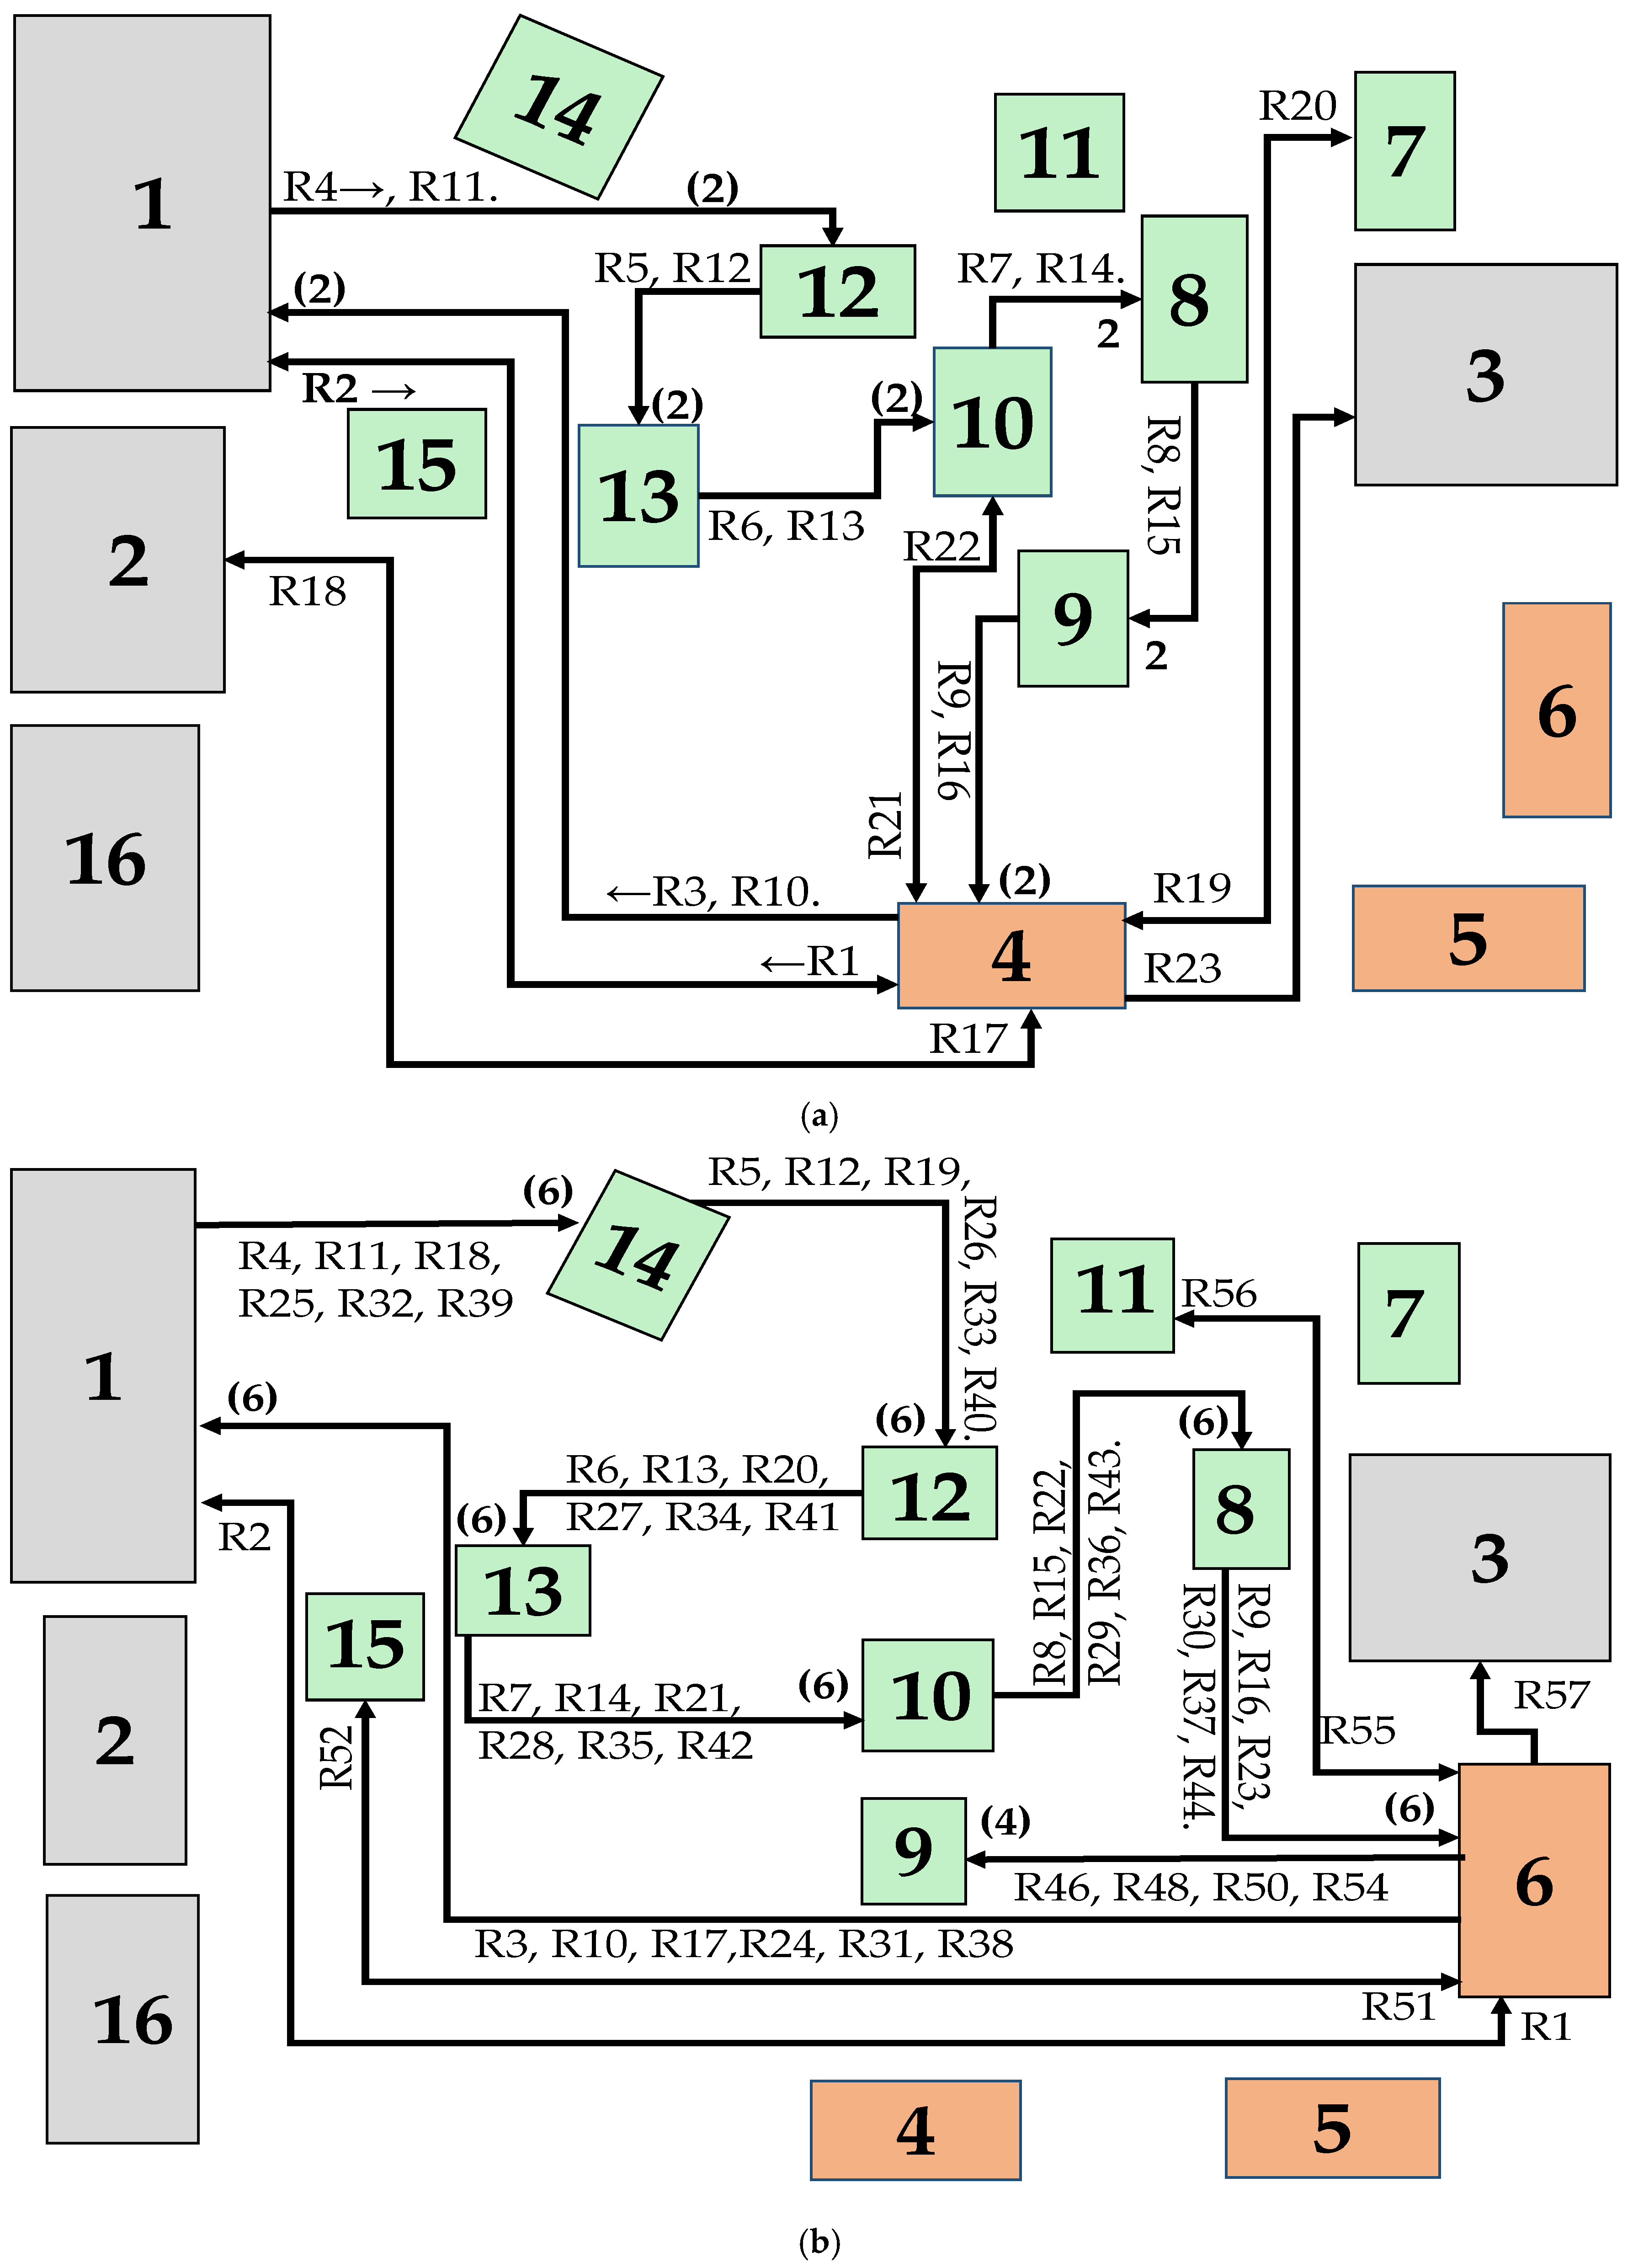
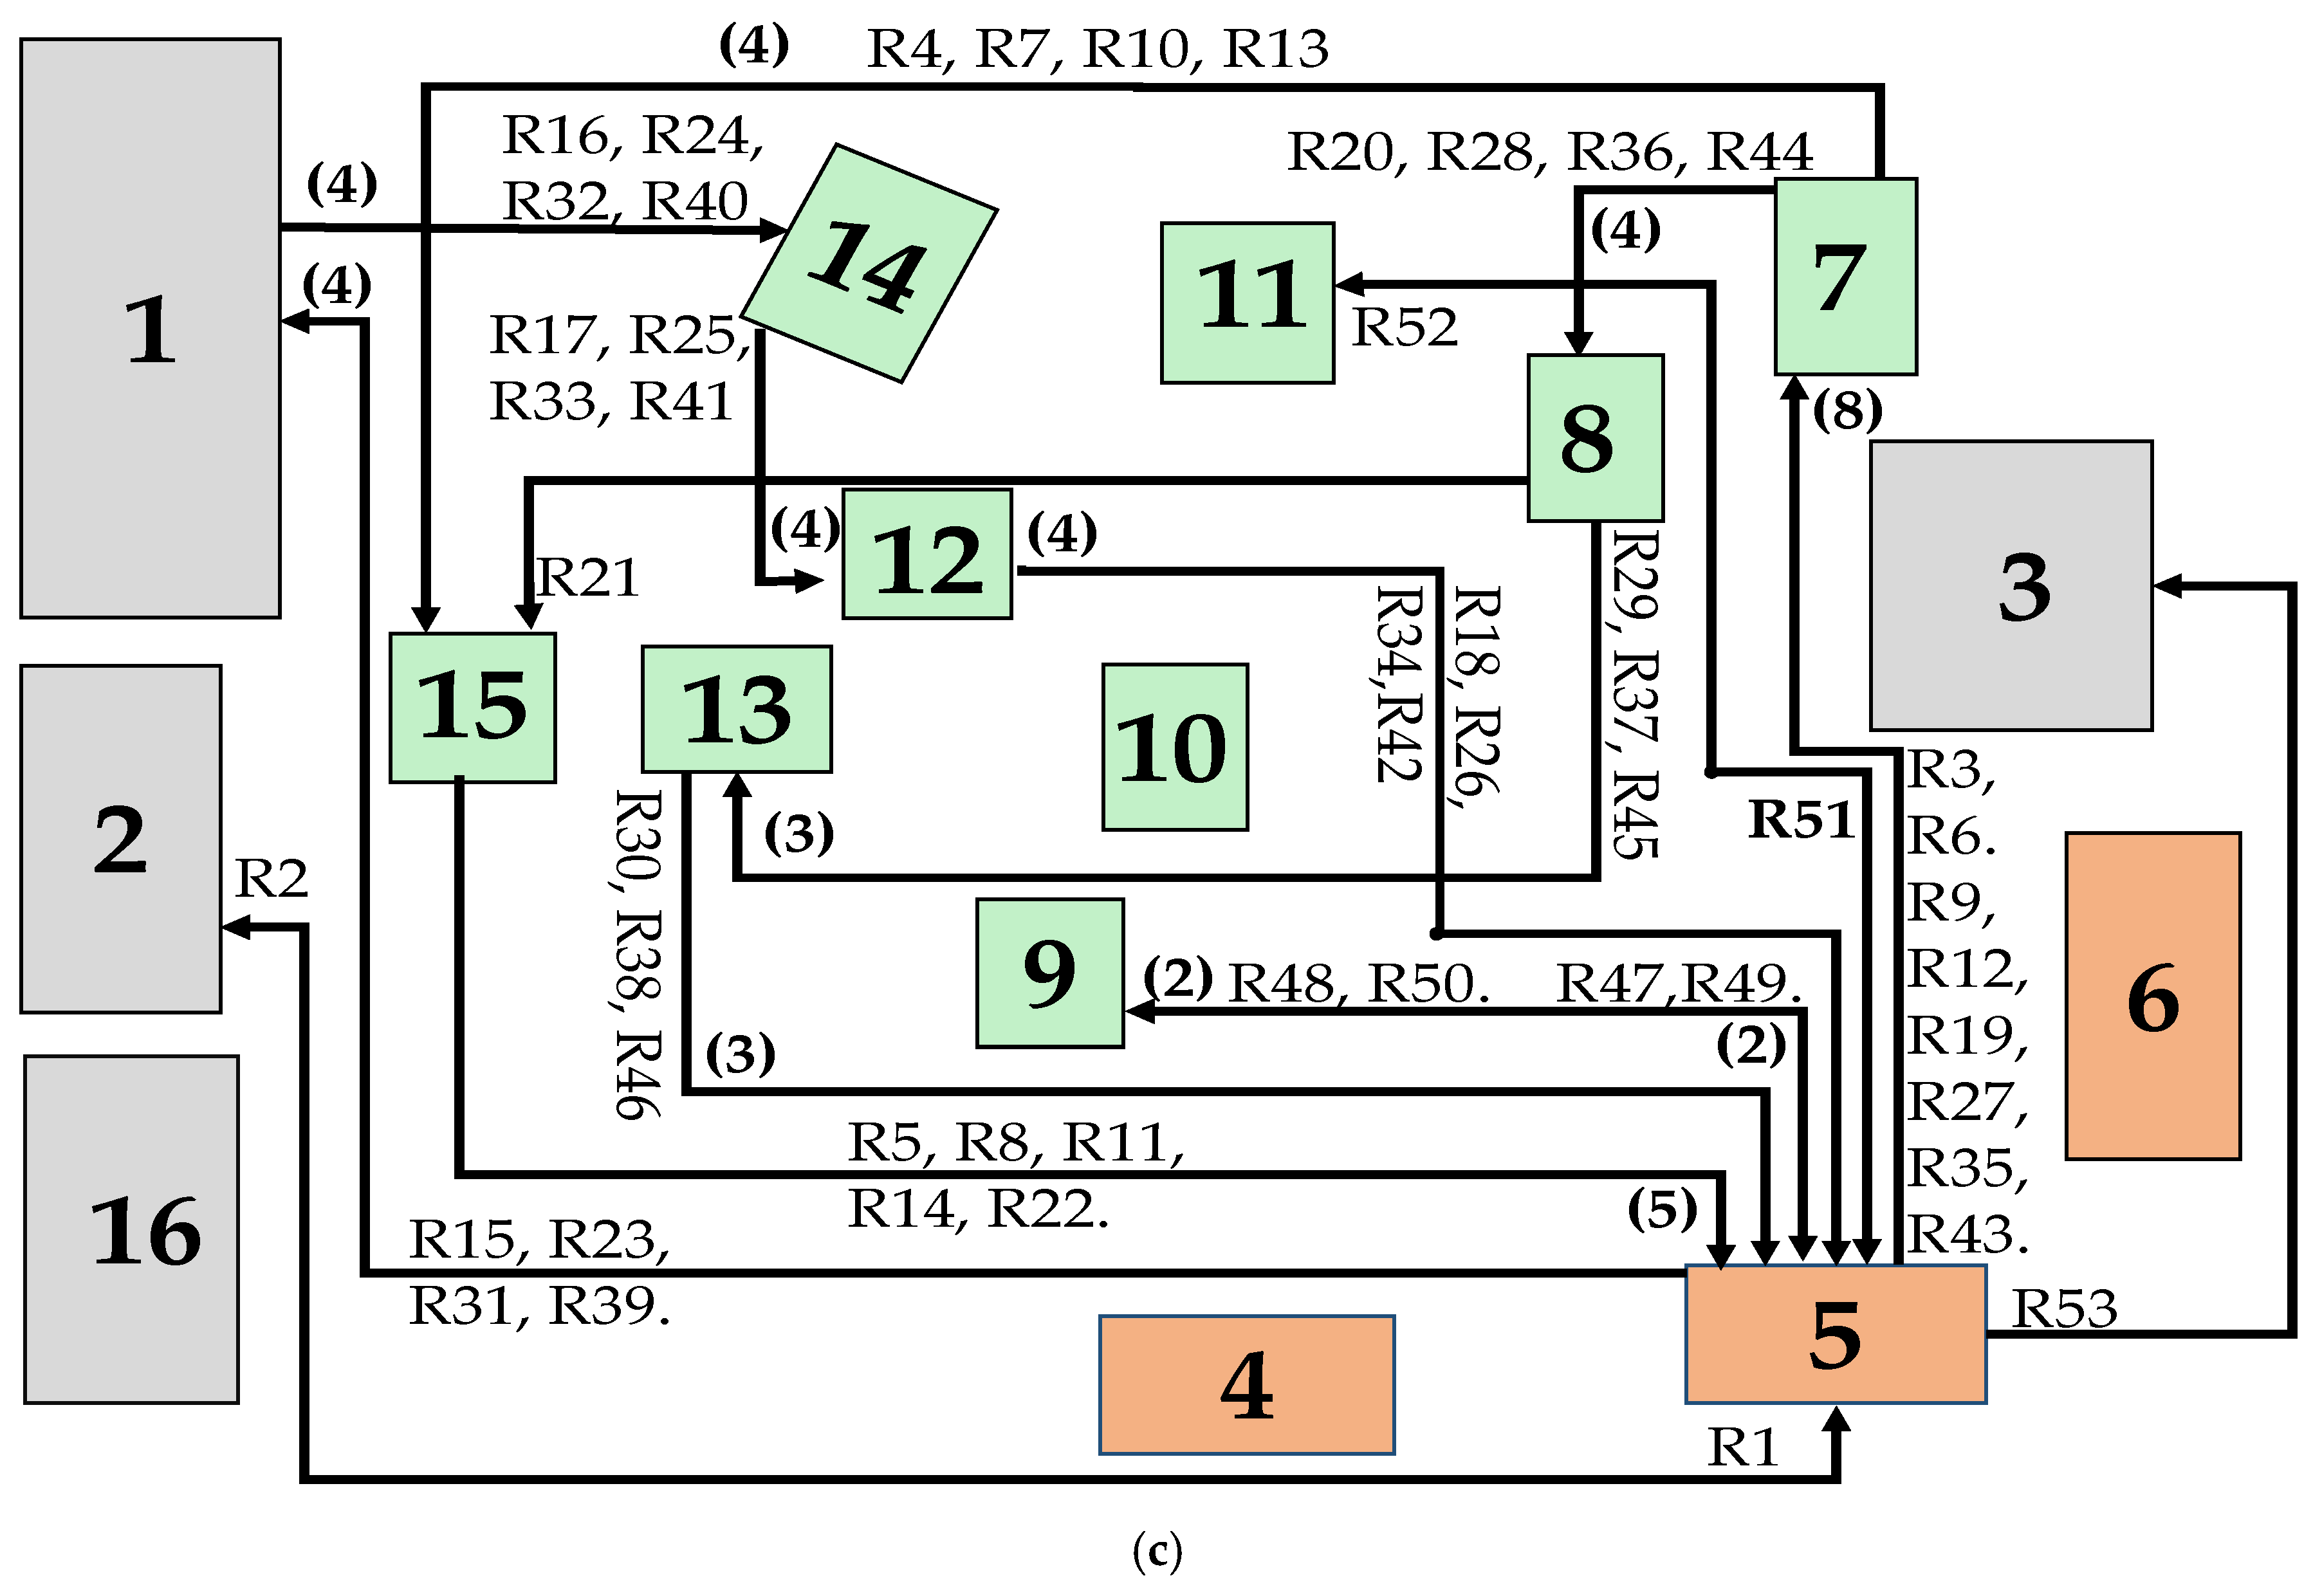
The relationship between facility elements and their respective codes, along with the initial workstation layout, where empty cells are represented as “0,” is shown in
Figure 1. Additionally, the figure depicts the sequence of worker movements in each system iteration. The workers follow predefined trajectories, as seen with Worker 1, who starts at WT 4 (R1 →), moves to the RMW, and returns to the starting point (R2 ←), repeating this cycle (
Figure 2a). Likewise, Workers 2 and 3 follow specific paths between workstations and storage areas (
Figure 2b,c). This analysis helps identify configurations that reduce travel distances, improve space utilization, and enhance production flow efficiency.
2.4.4. Crossover
For the crossover process, two parent solutions are selected through a random tournament, ensuring that they are distinct from each other. A single random crossover point is defined within the encoding of each parent, and the new individual is generated by taking the first segment from Parent 1 and the remaining segment from Parent 2. Afterward, the offspring undergoes a verification and reconstruction process to ensure its feasibility within the system.
2.4.5. Mutation
The mutation process involves randomly selecting two non-fixed workstation elements within the facility layout and swapping their positions. The mutation rate decreases progressively across generations, starting from 80% and gradually reducing to 5%, preventing premature convergence while maintaining solution diversity. The mutation algorithm is detailed in
Appendix A.3.
2.4.6. New Population
The new population consists of 40% of the top-performing individuals, selected through a random tournament method. In this approach, n = 20 individuals are randomly chosen, and the one with the shortest total travel distance is retained. The remaining 60% is generated through crossover, combining features of the selected individuals.
Afterward, the new population undergoes a mutation process, where some individuals are randomly modified to preserve solution diversity and prevent premature convergence.
2.5. Evolutionary Algorithm Configuration
The configuration of the EA was established through a two-step process: (1) initial parameter setting based on previous studies on heuristic optimization applied to facility layout problems [
23,
24], and (2) parameter adjustment through sensitivity analysis conducted in the ProModel
® simulation environment.
A population of 5000 individuals was used, with a maximum of 1000 generations, a crossover rate of 60%, and a mutation rate decreasing from 80% to 5%. These values were selected to balance the exploration of the solution space with convergence speed. The proportion of survivors varied between 40% and 80%, depending on the scenario evaluated. Each configuration was independently executed 20 times to ensure consistent results and to estimate the algorithm’s average performance. These parameters ensure a balance between exploration and exploitation in the search process, allowing the EA to efficiently optimize workstation layout under the high variability and spatial constraints typical of artisanal manufacturing environments.
A canonical version of the EA was implemented in the C programming language, due to its computational efficiency and suitability for resource-constrained environments. Although more advanced variants of the algorithm exist—incorporating elitism, adaptive operators, or hybrid strategies—this study focused on a calibrated base model to improve performance without increasing complexity. This methodological decision provides a solid foundation for future applications in larger-scale systems.
During the calibration phase, the effects of population size and number of generations on convergence were analyzed. With 5000 individuals, sufficient genetic diversity was observed in the early generations, and the objective function value tended to stabilize around generation 750, with no evidence of premature convergence. The average execution time per run was 3.2 min on a computer equipped with an Intel i7 processor and 16 GB of RAM, which is considered reasonable for environments with limited computing resources.
2.6. Sensitivity Analysis of Algorithm Parameters
To evaluate the stability of the EA under different operating conditions, a sensitivity analysis was conducted on its initial parameters. This analysis made it possible to identify how configuration decisions influence the algorithm’s performance and to prevent issues resulting from improper calibration.
Four experimental configurations were defined by adjusting the number of generations, the percentage of survivors, and the mutation rate while keeping the population size constant at 5000 individuals. These parameters were selected due to their direct influence on the balance between exploration and exploitation of the solution space (
Table 1).
These configurations were applied to the three defined production scenarios (2P × 2W, 3P × 3W, and 4P × 4W). The performance metric used was the average travel distance covered by operators. The objective was to identify which parameter combination yielded the most consistent and efficient results in layout optimization.
2.7. Scalability and Computational Complexity Considerations
The computational complexity of the EA is determined by the population size (P), the number of generations (G), and the dimensions of the layout matrix. Everyone represents a different configuration of workstations within a 4 × 8 matrix, and its evaluation is based on the cumulative calculation of Euclidean distances according to operator paths. The per-generation complexity is approximately O(P × E), where E represents the time required to evaluate an individual. The implementation in C programming language allowed for acceptable execution times, even under large configurations.
In exploratory tests using larger matrices (e.g., 6 × 10 or 8 × 12), execution time increased linearly with population size, while the search space expanded combinatorially. Although the model remains feasible for medium-sized problems, future scalability can be improved through adaptive control of population size, parallel evaluation of individuals, or the integration of hybrid local search strategies. These enhancements would enable the algorithm to be applied to more complex and less variable manufacturing environments while maintaining computational efficiency.
2.8. Validation of the Simulation Model in ProModel®
To ensure the accuracy of the simulation model in ProModel
®, validation was conducted following the methodology proposed by Law [
34]. The simulation results were compared with historical production data from the artisanal workshop, verifying consistency in cycle times, worker movements, and workstation utilization. Additionally, a sensitivity analysis was performed to evaluate the model’s stability under variations in production sequences and workstation arrangements, confirming its robustness in representing the actual system.
2.9. Statistical Validation
To validate the effectiveness of the EA in facility layout optimization, a one-way ANOVA was performed, comparing the SLP, CRAFT, and EA methods based on total travel distance. Each method was tested over 15 iterations, while data normality was verified using the Shapiro–Wilk test [
35]. With a significance level of 0.01 the mean, standard deviation, F-statistic, and
p-value were calculated [
36]. Additionally, to ensure EA convergence without excessive computational costs, 1000 generations with 10,000 individuals were selected, following evolutionary optimization criteria for facility layout problems [
37].
3. Results
The EA was evaluated in a simulation environment using ProModel® Version 7 to optimize workstation layout and minimize the distance travelled by operators in an artisanal production workshop. Its performance was compared against the SLP method and the CRAFT algorithm.
3.1. Reduction in Travel Distance
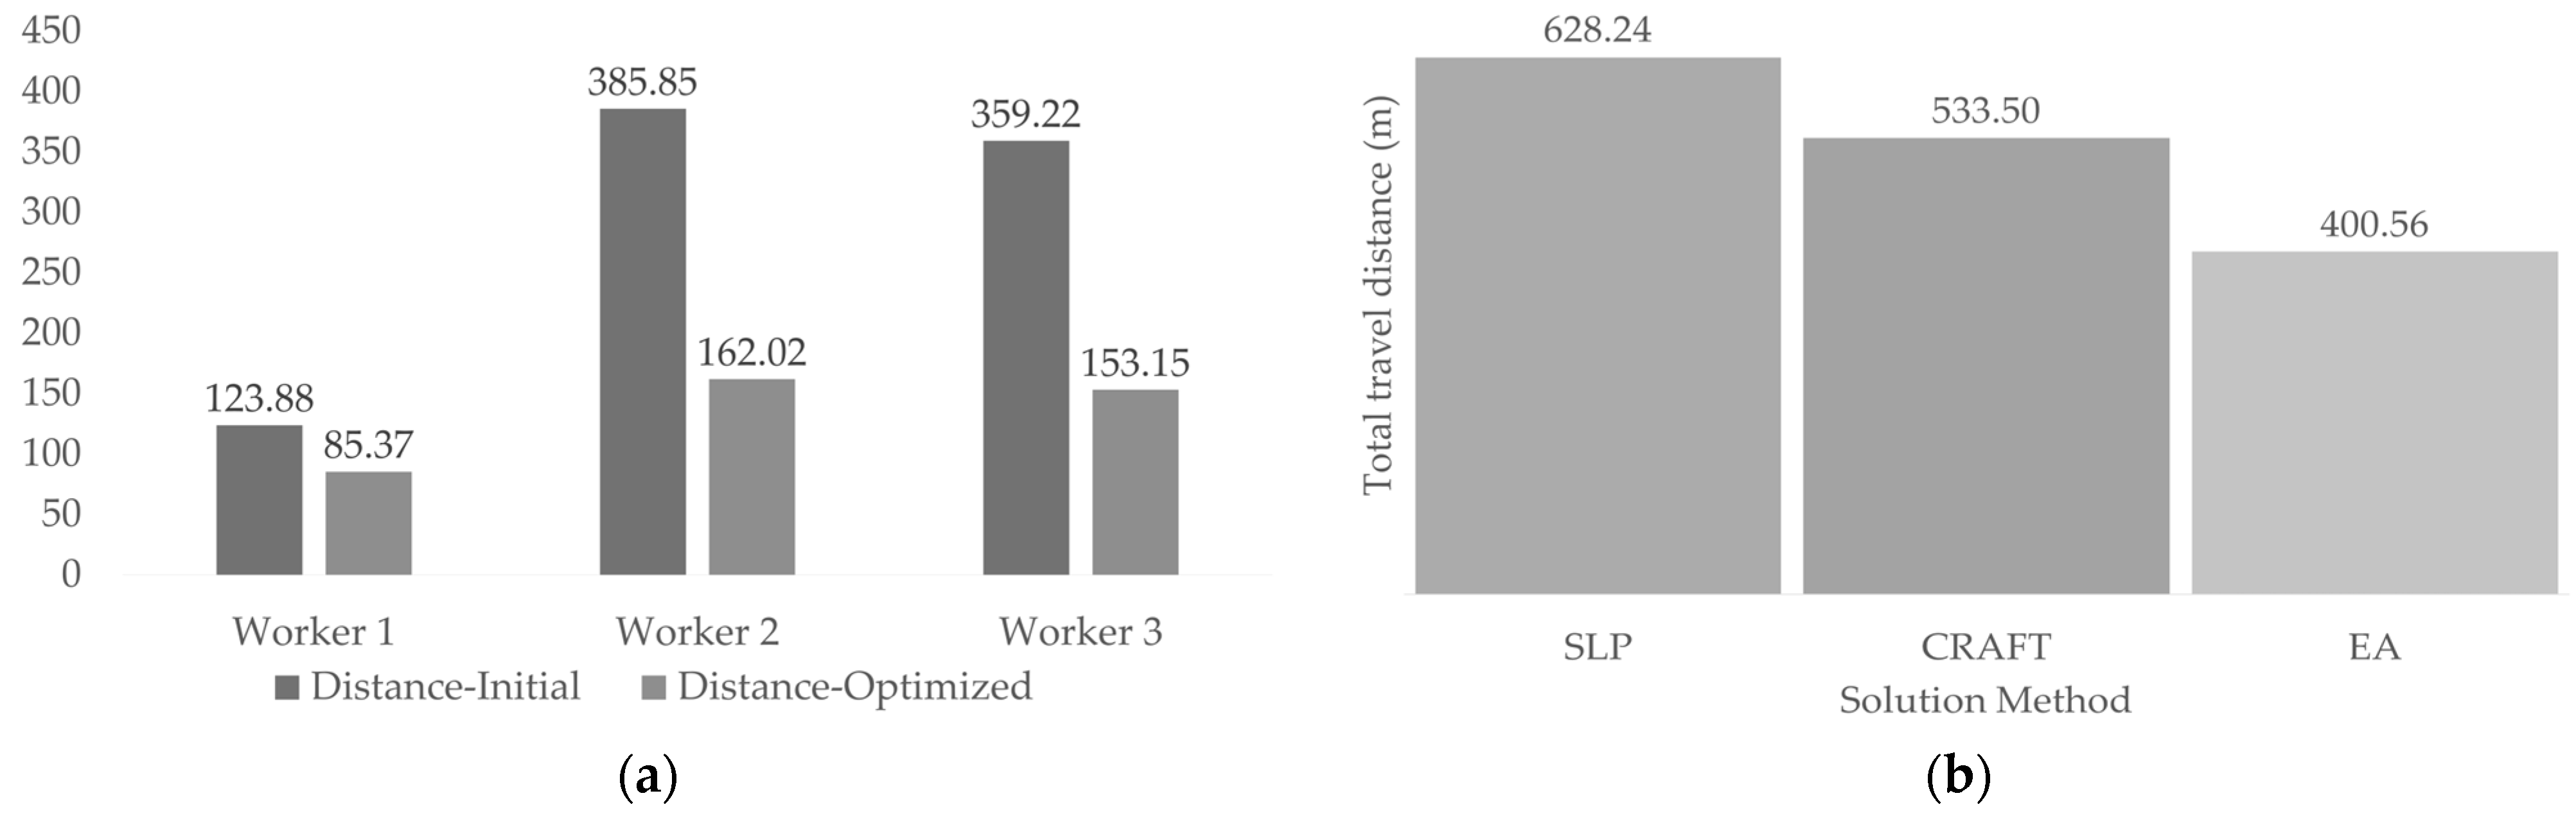
The results demonstrate that redistributing workstations using the EA significantly reduced operational movement (
Table 2). In the initial layout, the total distance travelled by operators was 868.95 m. After optimization with the EA, this was reduced to 400.56 m, representing a 53.90% improvement. In comparison, the CRAFT algorithm achieved a 38.60% reduction, while SLP resulted in only a 27.70% improvement (
Table 3).
A detailed analysis of individual operators revealed that Operator 2, who initially travelled 385.85 m, reduced their movement to 162.02 m with the EA (a 58.00% reduction), while Operator 3 decreased their travel distance from 359.22 m to 153.15 m (a 57.36% reduction). This confirms that the EA not only optimizes the overall workflow of the workshop but also enhances the individual efficiency of each operator.
3.2. Comparison with Traditional Methods
The comparative analysis confirms the superiority of the EA over conventional methods such as SLP and CRAFT, particularly in high-variability environments. While SLP and CRAFT are effective in facilities with fixed layouts, the EA enables dynamic adjustments, making it especially useful in artisanal manufacturing, where designs and materials frequently change.
The results presented in
Table 3 show that the EA reduced the total travel distance by 447.08 m, equivalent to a 51.45% decrease compared to the initial layout, outperforming the reductions achieved by SLP (27.70%) and CRAFT (38.60%). Additionally, the reorganization of workstations reduced the occupied area by 22 m
2, a critical advantage for workshops with spatial constraints. On an individual level, Worker 2, who initially recorded the longest travel distance, reduced their movement from 385.85 m to 175.13 m, demonstrating that the EA improves workstation arrangement and optimizes production sequencing, reducing travel times and maximizing space utilization.
Before conducting the ANOVA test, the assumptions of normality, homogeneity of variance, and data independence were verified. The Shapiro–Wilk test was applied to assess normality in the distribution of travel distances for each method, yielding p-values of 0.09 for EA, 0.12 for CRAFT, and 0.07 for SLP, indicating no sufficient evidence to reject normality. Levene’s test was used to evaluate variance equality across methods, with a p-value of 0.25, confirming homoscedasticity. The independence of observations was ensured through controlled iterations without interference between values.
The one-way ANOVA test resulted in an F-statistic of 8806.19 and a
p-value < 0.01, indicating significant differences among the evaluated methods (
Table 4). These results confirm the effectiveness of the EA in optimizing facility layouts.
In terms of computational efficiency, the EA exhibited a higher average execution time per run (192.0 s) compared to traditional methods such as CRAFT (25.2 s) and SLP (13.5 s). However, this longer processing time is compensated by the significant reductions in operator travel distance and overall system time. As shown in
Table 3, while traditional methods provide faster execution, the EA’s superior optimization performance justifies the additional computational cost, especially in artisanal production environments with high variability and space constraints.
Figure 3 illustrates how workstation placement varies across the different optimization methods and its impact on the spatial distribution of the workshop. Notably, ET-4 (Worker 1’s station) and ET-14 (Shredder station) retain strategic positions across all methods, confirming their significance in overall productivity. This finding further validates the EA as an effective technique for improving workstation layout in artisanal manufacturing with limited resources.
Figure 4 demonstrates the reduction in total system time, highlighting the differences between the initial layout and the optimized configuration. These results confirm that the EA efficiently enhances operation synchronization, reduces idle time, and optimizes space utilization and resource management.
3.3. Reduction in Total System Time
In addition to reducing travel distances, the EA improved the system’s operational efficiency by decreasing the total manufacturing process time from 9284.09 min to 8538.33 min, representing a 13.2% improvement (
Table 5).
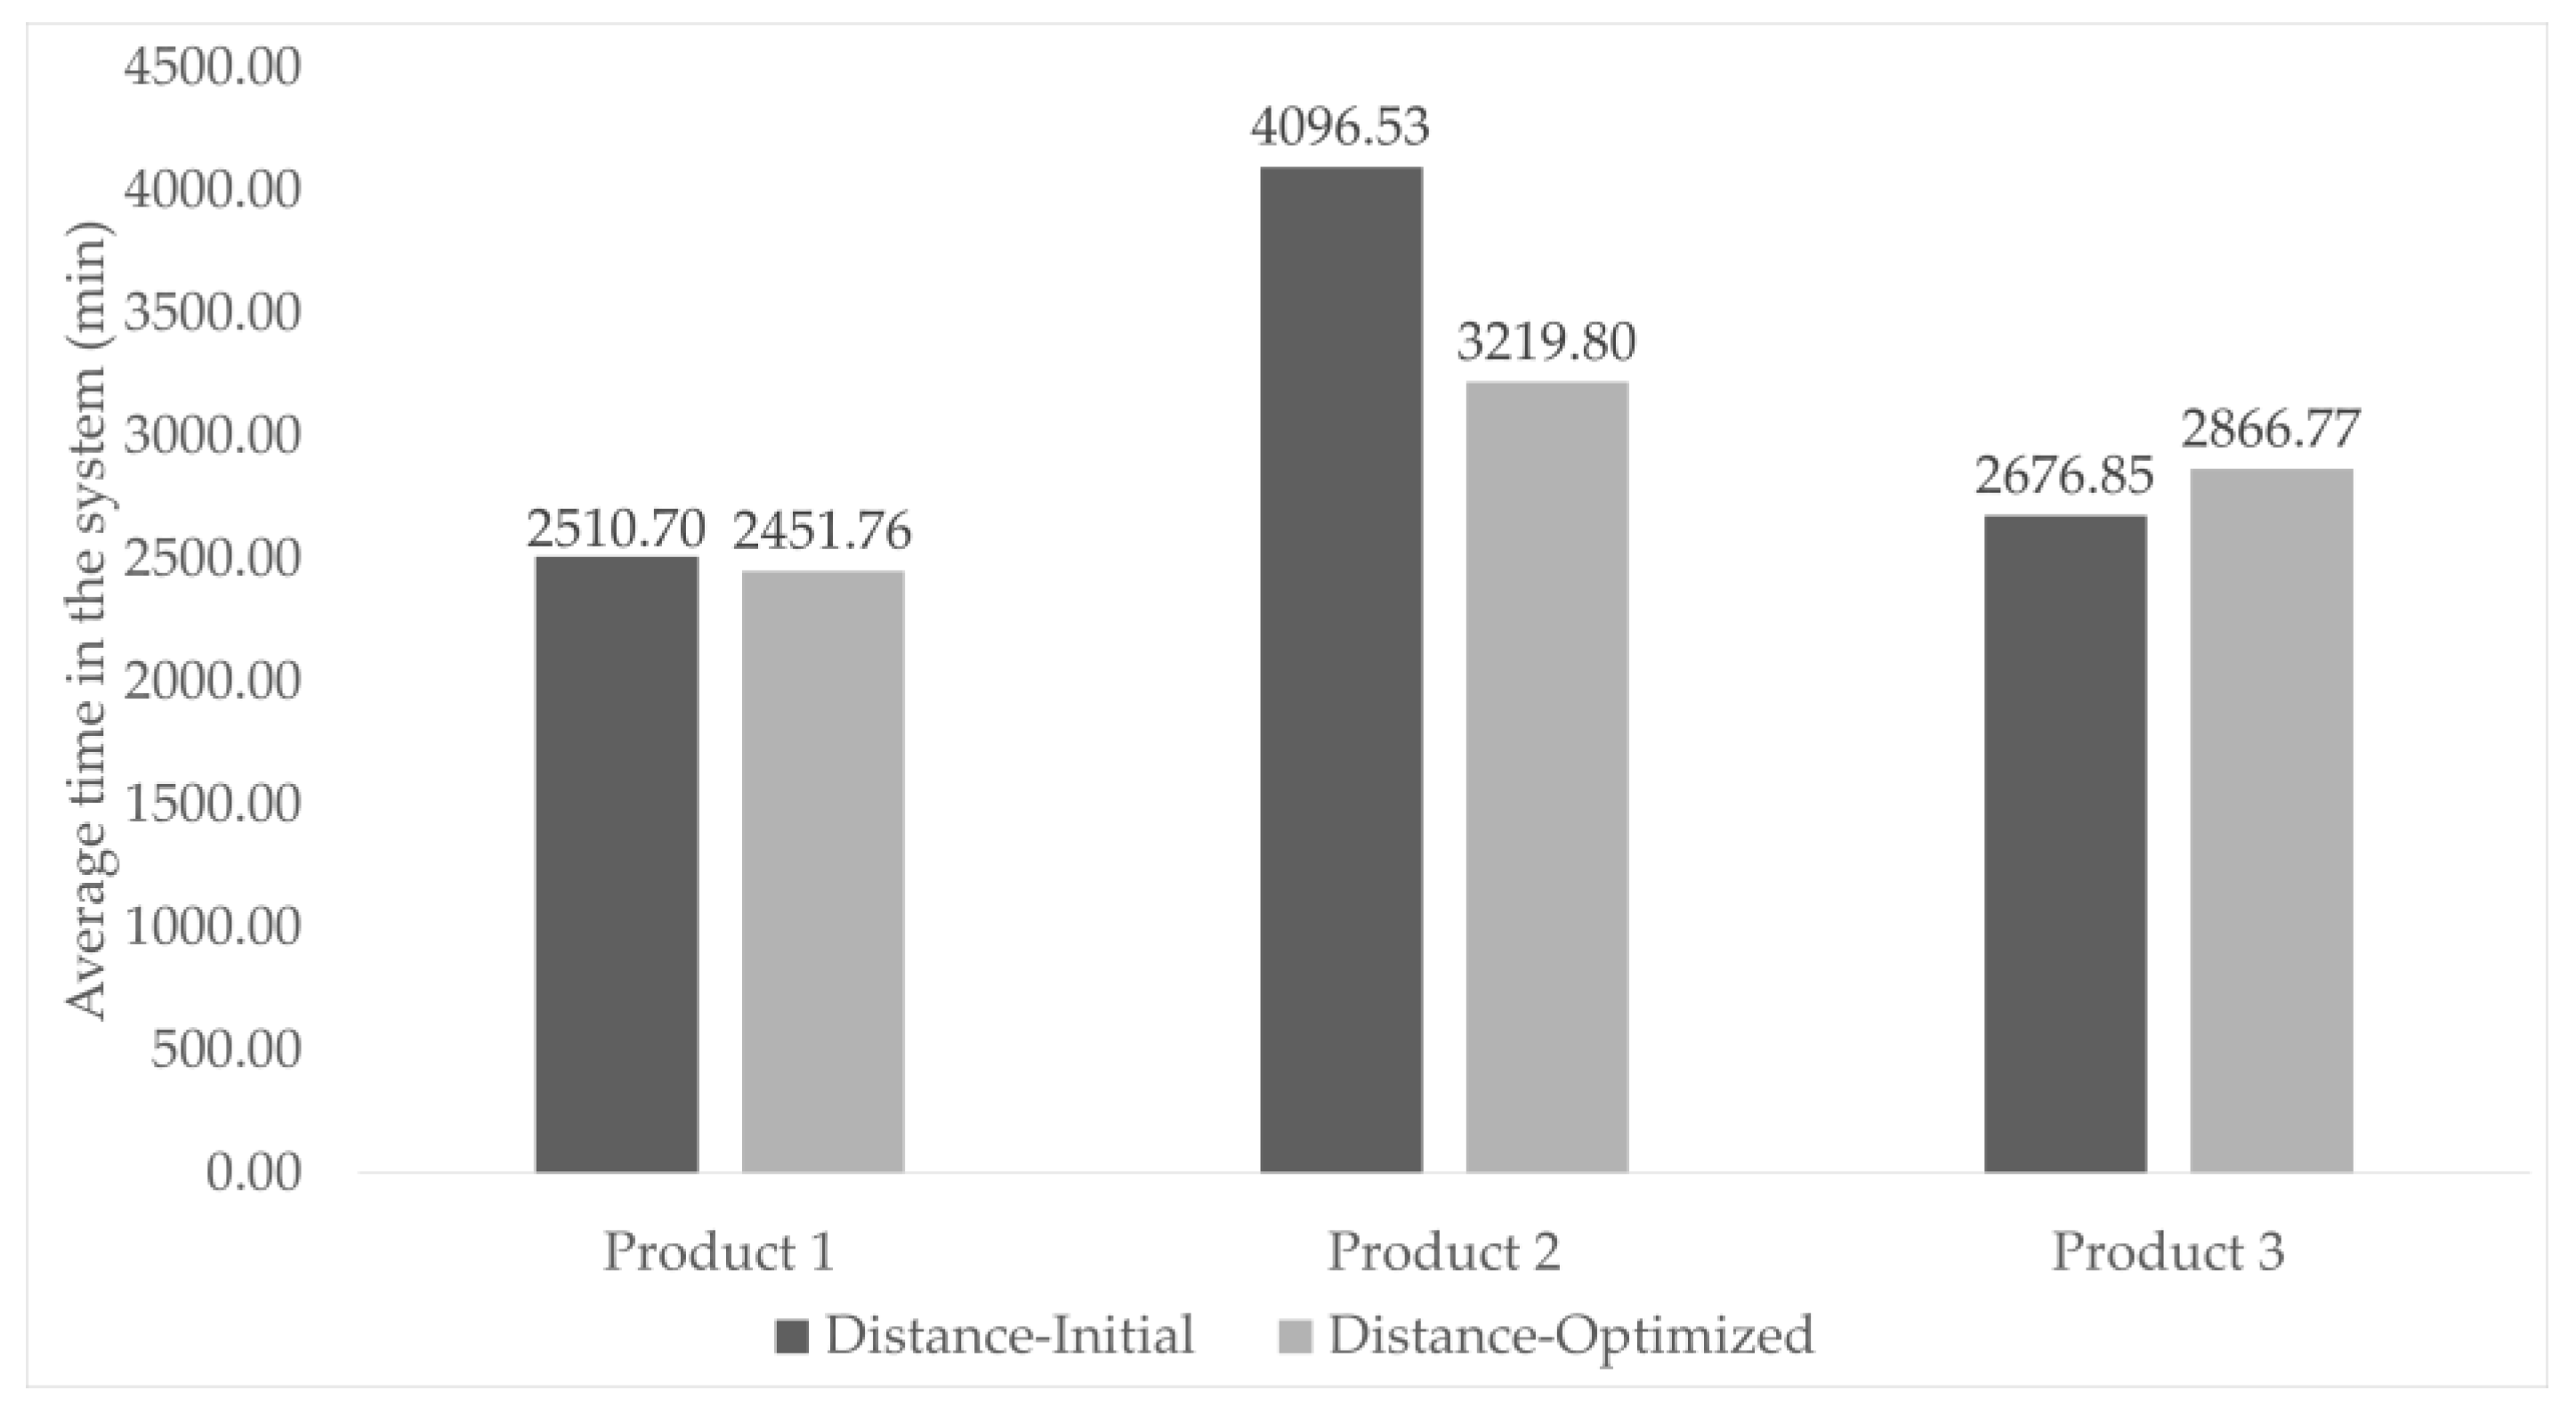
Figure 5 compares the average time in the system for each product across two scenarios: the initial layout and the optimized layout using the EA. The results show a significant reduction, particularly for Product 2, where the processing time decreased from 4096.53 min to 3219.8 min. This reduction is attributed to better workstation synchronization and reduced interference among operators, minimizing blockages and waiting times.
These findings confirm that the EA is a viable solution for optimizing artisanal elaboration, enhancing workspace organization, and increasing productivity in multi-tasking environments.
3.4. Evaluation on Multiple Scenarios
To validate the proposed algorithm, simulations were conducted in three production scenarios, varying the number of products and operators. The configurations considered were as follows: (i) two products with two operators (2P × 2W), (ii) three products with three operators (3P × 3W—baseline case), and (iii) four products with four operators (4P × 4W). In all cases, the layout, task sequence, and variability remained unchanged to isolate the effect of workload on the performance of the compared methods.
The results, presented in
Table 6, show that the EA achieved the best performance across all scenarios. In terms of total travel distance, the EA achieved reductions of 63.45% in 2P × 2W, 53.91% in 3P × 3W, and 57.18% in 4P × 4W, compared to the initial layout. In contrast, the traditional methods SLP and CRAFT obtained smaller reductions in all configurations.
These results indicate that the EA remains effective in both low- and high-workload conditions. Its consistent behavior supports its application in smaller manufacturing systems with variable workflows. Furthermore, as the number of products and operators increases, the EA maintains its performance, confirming its applicability to larger and more complex systems.
4. Discussion
Multi-product artisanal manufacturing faces operational challenges due to the flexible arrangement of workstations and production variability. Unlike industrial environments with fixed layouts and standardized workflows, these systems require optimization methodologies that not only minimize unnecessary movement but also synchronize human–machine operations to improve overall system efficiency. Traditional layout optimization approaches, such as SLP and the CRAFT algorithm, have proven effective in structured environments, but their applicability to non-technical businesses remains limited, particularly when dynamic workstation reconfiguration is required.
This study implemented an EA programmed in C++ to optimize workstation distribution and synchronize operations in a multi-product wooden furniture workshop, where three types of products are simultaneously manufactured across 16 flexible workstations. The results demonstrate that the EA reduced total worker travel distance by 51.45% (from 868.95 m to 421.87 m) and total system time by 13.2% (from 9284.09 min to 8057.85 min), significantly outperforming conventional methodologies.
These findings align with previous studies where layout optimization has proven to reduce costs and travel distances in industrial environments with fixed structures [
38]. However, unlike these approaches, the EA applied in this study enables dynamic adjustments, overcoming the limitations of traditional methods in systems with high operational variability. This capability makes it particularly relevant in flexible manufacturing and small-batch production, where layout configurations must continuously adapt to demand.
The use of metaheuristics in layout optimization has been widely explored in high-automation environments. Zhao and Wei [
39] combined an enhanced Genetic Algorithm with SLP, successfully improving cellular layout in injection molding workshops. Similarly, Pérez-Gosende et al. [
21] determined that integrating SLP with advanced tools such as GA, Particle Swarm Optimization (PSO), and Variable Neighborhood Search (VNS) optimizes space allocation and reduces operational costs. However, these approaches do not address dynamic operation synchronization, which is a critical factor in artisanal manufacturing. The present study demonstrates that Evolutionary Algorithms can be successfully applied in such environments, synchronizing tasks in multi-product systems without requiring advanced automation.
From a methodological perspective, the stability of the EA depends on key parameter configurations, such as population size, crossover rate, and mutation probability. Faruque et al. [
30] suggest that integrating an EA with machine learning and hybrid metaheuristics enhances adaptability in environments with high uncertainty. This presents an opportunity to optimize its performance in more complex operational systems with greater demand variability.
While this study demonstrates that the EA outperforms traditional methods in reducing travel distances and synchronizing operations in artisanal manufacturing, its scalability and stability should be further explored in larger-scale systems with greater product diversity. Integrating EA with advanced simulation models and digital twins would allow for performance evaluation in different scenarios in a real-world implementation, ultimately optimizing decision-making in environments with spatial and operational constraints.
Although the proposed EA outperformed SLP and CRAFT, its current structure can be improved to enhance convergence, maintain diversity, and increase solution quality. Key modifications include incorporating elitism, applying an adaptive mutation rate based on population diversity, replacing single-point crossover with multi-point or uniform crossover, and enforcing a minimum Hamming distance between individuals (
Appendix A.4). These enhancements can prevent premature convergence and improve performance in layout problems with spatial and operational constraints. They should be validated against reference algorithms such as Genetic Algorithm (GA) and Particle Swarm Optimization (PSO) under identical conditions.
5. Conclusions
Mexican artisanal manufacturing is characterized by family-based management and the lack of formal records in its production processes, which has limited its study from a scientific perspective. This study addressed the facility layout problem in a workshop specializing in wooden furniture manufacturing. This is typically an environment marked by limited space, shared workstations, and simultaneous multi-product elaboration without predefined sequential scheduling. These conditions make layout optimization in this sector a complex challenge, difficult to resolve using conventional methodologies.
To tackle this issue, an EA was implemented to optimize workstation distribution and synchronize operations. The results indicate that the EA reduced total worker travel distance by 51.45% (from 868.95 m to 421.87 m) and decreased total system time by 13.2% (from 9284.09 min to 8057.85 min), significantly outperforming traditional methodologies such as SLP and CRAFT. Additionally, space redistribution reduced the occupied area by 22 m2, improving internal mobility and reducing downtime. On an individual level, Worker 2 reduced their travel distance by 54.6% (from 385.85 m to 175.13 m), while Worker 3 decreased their walking by 55.8% (from 359.22 m to 158.63 m), demonstrating the EA’s impact on workflow optimization in artisanal manufacturing.
Despite these advancements, certain limitations were identified in the model’s implementation. The EA’s sensitivity to parameter calibration, such as population size, crossover rate, and mutation probability, can affect solution stability and quality. Additionally, its applicability in larger-scale production systems with greater product diversity remains an open area for further exploration to ensure its scalability and robustness in manufacturing environments with spatial and technological constraints.
Given these considerations, future research should focus on applying the EA to other manufacturing models, such as cellular manufacturing within the artisanal wooden furniture sector, to distribute and organize workstations into specialized production cells. This transition could optimize workflow without compromising system flexibility, adapting to multi-product elaboration and the need for dynamic adjustments in workstation and material layout. Combining EA with multi-objective optimization models and machine-learning-based heuristics could enable real-time workstation reconfiguration, adjusting to demand variations and spatial constraints. Furthermore, the integration of digital twins would facilitate model validation in real-world implementation, minimizing operational risks and enhancing process control in artisanal manufacturing.
Finally, further EA optimization should explore the incorporation of material handling and transportation costs, leading to a more comprehensive optimization of the total production system. This approach would not only minimize worker travel distances but also reduce internal logistics costs, strengthening the competitiveness of artisanal workshops compared to more technologically advanced production models.


 ,
, 
