Article

Generative Neural Networks for Addressing the Bioequivalence of Highly Variable Drugs

by
Anastasios Nikolopoulos
1,2 and
Vangelis D. Karalis
1,2,*
1
Department of Pharmacy, School of Health Sciences, National and Kapodistrian University of Athens, 15784 Athens, Greece
2
Institute of Applied and Computational Mathematics, Foundation for Research and Technology Hellas (FORTH), 70013 Heraklion, Greece
*
Author to whom correspondence should be addressed.
Algorithms 2025, 18(5), 266; https://doi.org/10.3390/a18050266
Submission received: 7 March 2025 / Revised: 27 April 2025 / Accepted: 2 May 2025 / Published: 4 May 2025
(This article belongs to the Section Algorithms for Multidisciplinary Applications)

Abstract

:
Bioequivalence assessment of highly variable drugs (HVDs) remains a significant challenge, as the application of scaled approaches requires replicate designs, complex statistical analyses, and varies between regulatory authorities (e.g., FDA and EMA). This study introduces the use of artificial intelligence, specifically Wasserstein Generative Adversarial Networks (WGANs), as a novel approach for bioequivalence studies of HVDs. Monte Carlo simulations were conducted to evaluate the performance of WGANs across various variability levels, population sizes, and data augmentation scales (2× and 3×). The generated data were tested for bioequivalence acceptance using both EMA and FDA scaled approaches. The WGAN approach, even applied without scaling, consistently outperformed the scaled EMA/FDA methods by effectively reducing the required sample size. Furthermore, the WGAN approach not only minimizes the sample size needed for bioequivalence studies of HVDs, but also eliminates the need for complex, costly, and time-consuming replicate designs that are prone to high dropout rates. This study demonstrates that using WGANs with 3× data augmentation can achieve bioequivalence acceptance rates exceeding 89% across all FDA and EMA criteria, with 10 out of 18 scenarios reaching 100%, highlighting the WGAN method potential to transform the design and efficiency of bioequivalence studies. This is a foundational step in utilizing WGANs for the bioequivalence assessment of HVDs, highlighting that with clear regulatory criteria, a new era for bioequivalence evaluation can begin.

Graphical Abstract

1. Introduction

The introduction of generic equivalents of brand-name pharmaceuticals into worldwide marketplaces has been a major approach for cutting medication costs and hence reducing their proportion to total healthcare expenses. Given the importance of generic drugs in healthcare, it is critical that their pharmaceutical quality and in vivo performance be accurately evaluated [1]. Bioequivalence (BE) testing is a critical component of drug development for the evaluation of generics. For the registration of a generic formulation, the pharmaceutical company must provide supporting evidence to the regulatory body on the proposed generic content, development, manufacture, quality, stability, and in vitro and in vivo performance [2]. According to the FDA and EMA, the BE of two products lies in their pharmaceutical equivalence, their bioavailabilities after administration that must fall within acceptable established boundaries, meaning that they do not differ significantly. This statement is quantified in a range that both regulatory bodies agree on 80.00–125.00%, in order to pass the 90% confidence interval for the ratio of Test (T) to Reference (R) products [3,4,5].
Highly variable drugs (HVDs) are a class of pharmacological products that have a within-subject variability (CVw) equal to or bigger than 30% of the maximum concentration (Cmax) and/or the area under the concentration–time curve (AUC). The BE of HVDs is a concern because the high variability necessitates a large number of patients to provide acceptable statistical power [1,6,7]. Moreover, there have been reported difficulties in achieving the conventional BE requirements for HVDs. There are examples of a highly variable reference product failing to demonstrate BE when compared to itself in BE research with the typical design/sample size [8,9]. FDA and EMA propose specific scaled limits for HVDs with the magnitude of the widening being determined by the CVw of the BE study [3,4,5].
Nowadays, technological advancements can efficiently address modern challenges in the pharmaceutical field [10,11]. The status quo of traditional clinical studies lacks pioneering solutions, particularly in areas like patient recruitment and monitoring through the entire process. Clinical and BE studies are adversely affected by delays and tremendous costs, with the additional risk of the drug not reaching the market [10,11,12]. Across the field, time-consuming procedures can be optimized and automated with the integration of artificial intelligence (AI). From creating recommendation systems to data augmentation, AI holds the potential in the advancement of the pharmaceutical field [10,11,13,14].
Generative AI models can help overcome limitations and accelerate advancements in healthcare. Generative AI has a variety of applications that can contribute, from data analysis to optimization of a clinical study [15,16,
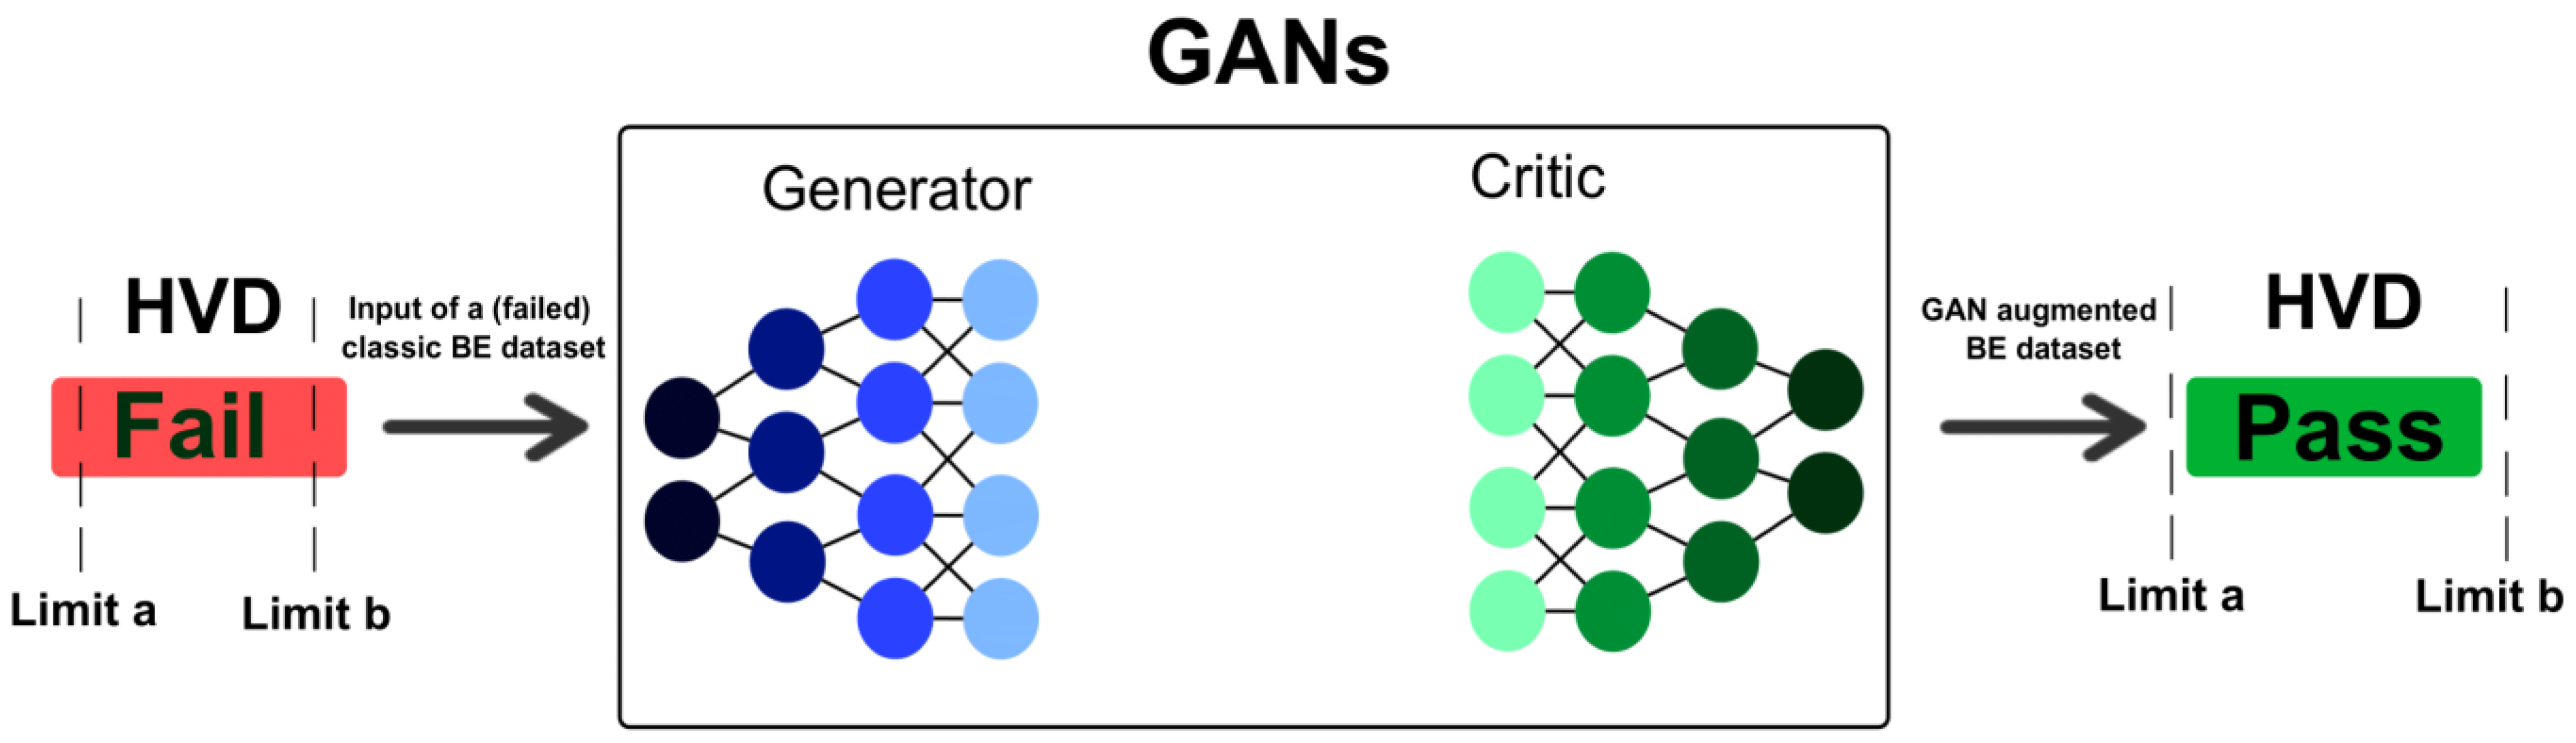
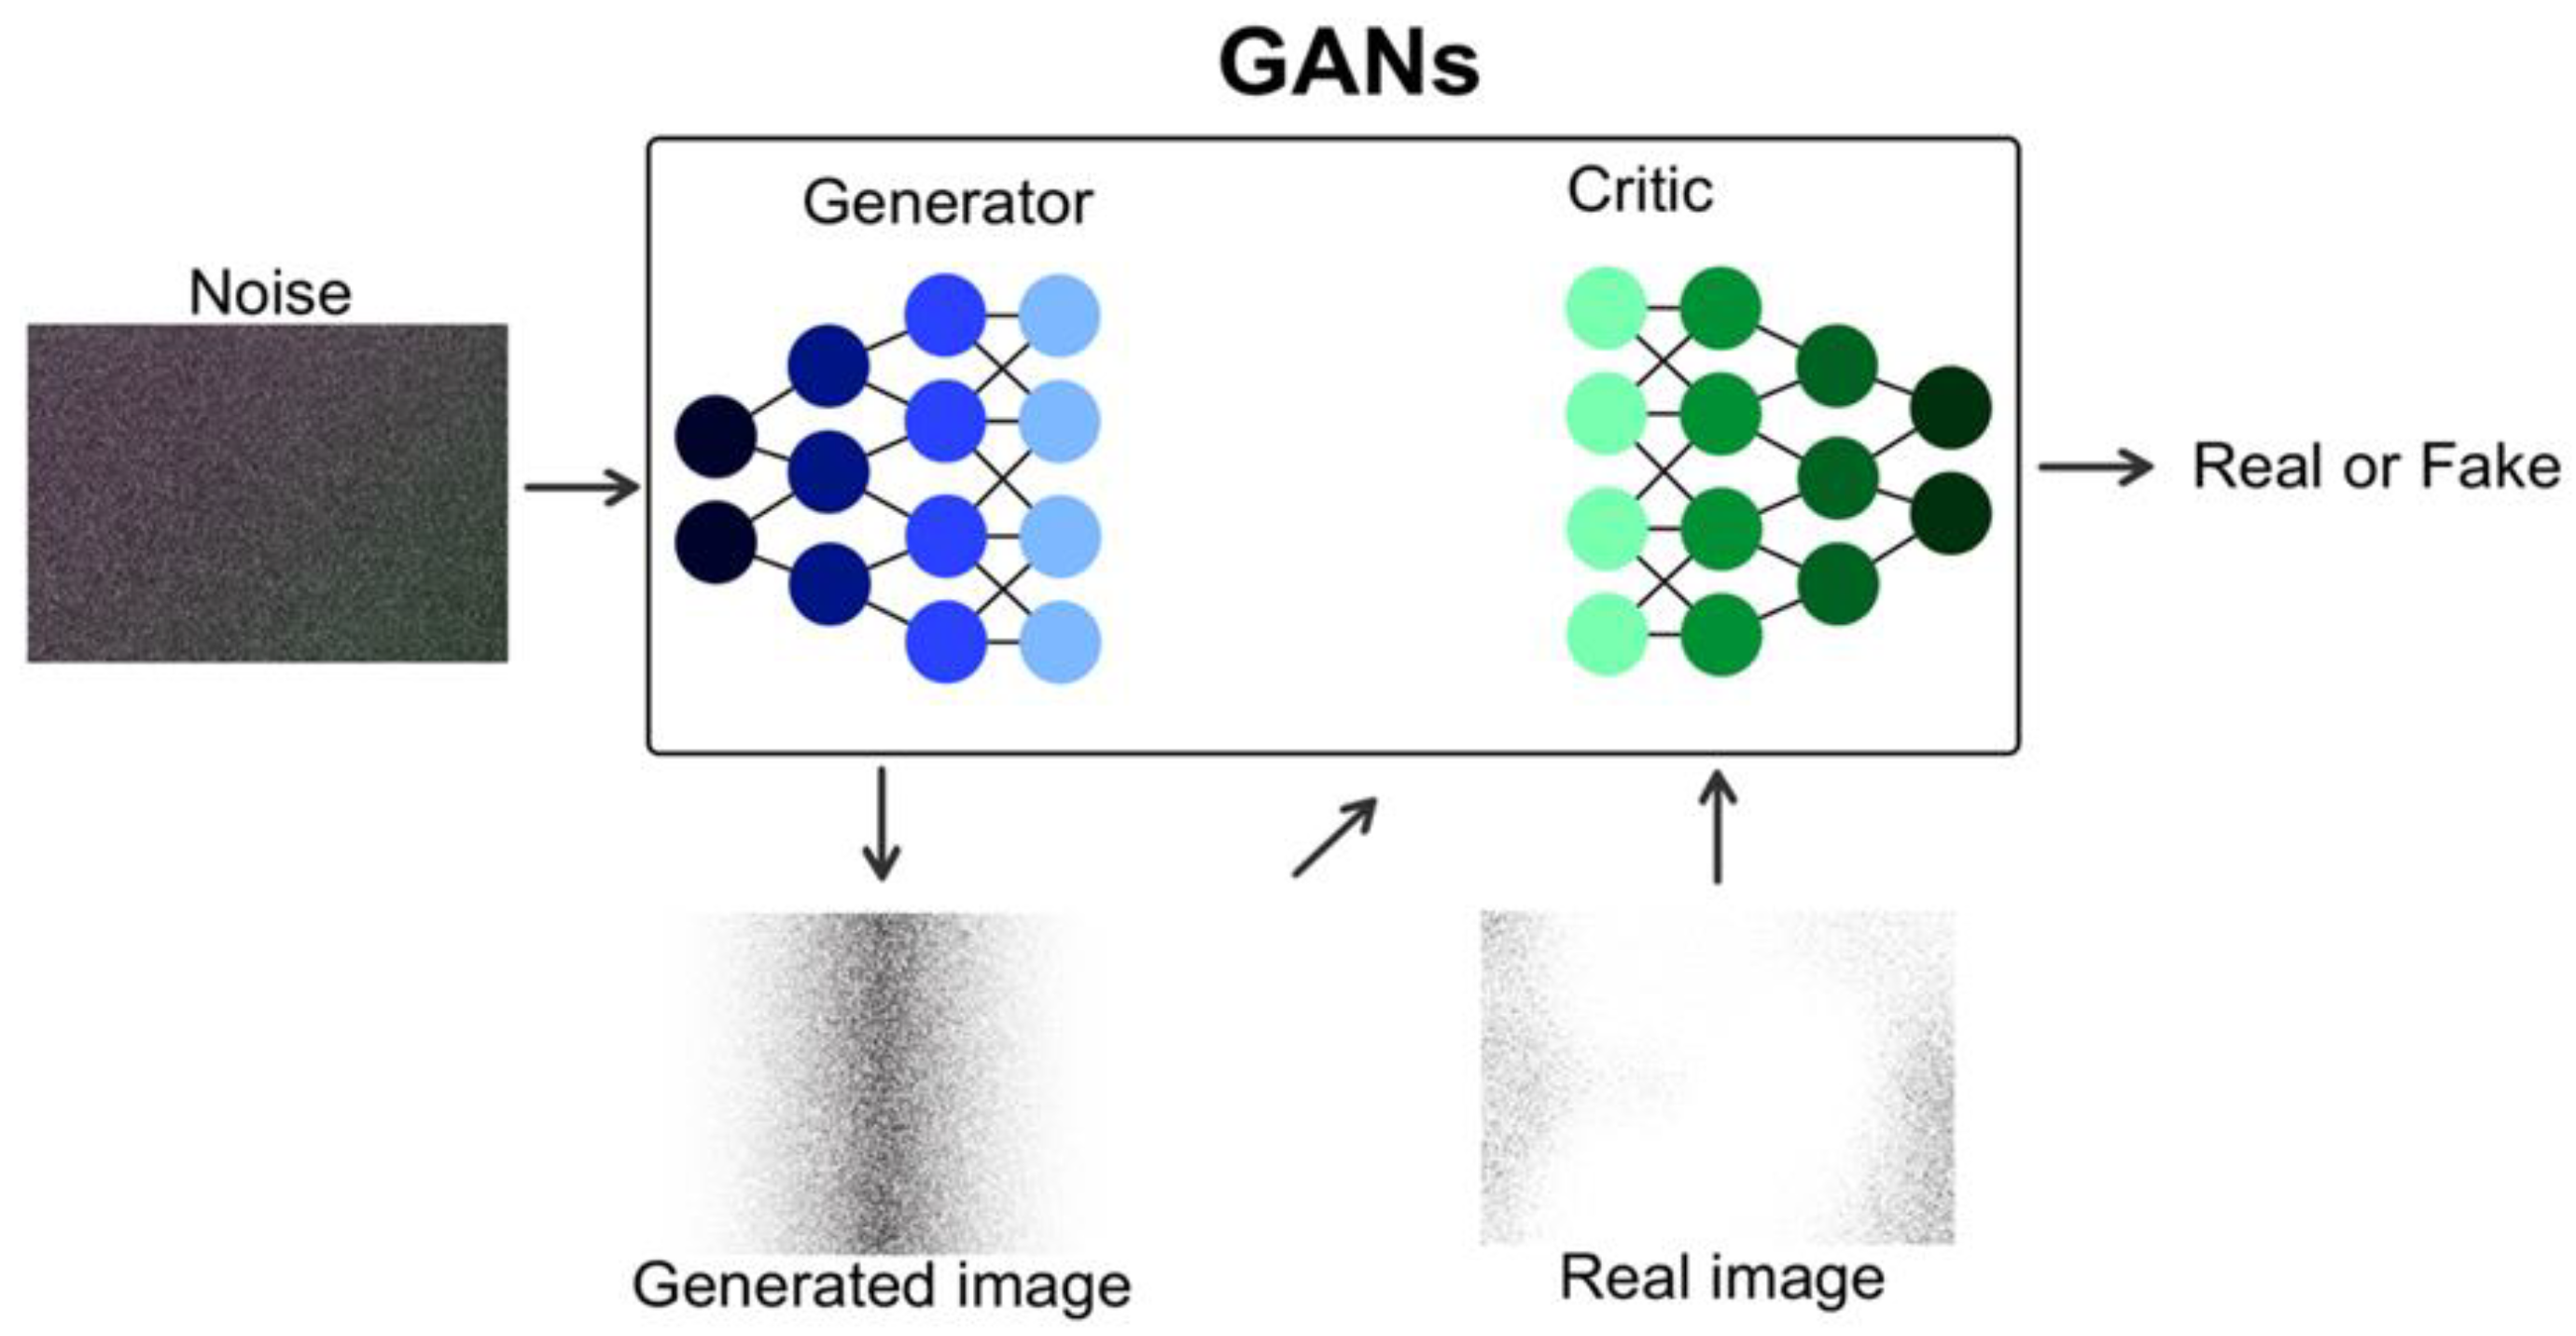
17]. Models like generative adversarial networks (GANs) can play a vital role in assisting the field, such as in trial design and participant recruitment, thus automating the existing procedures, identifying complex patterns and offering innovative solutions [16,17,18,19]. This can revolutionize the clinical setting by improving the decision-making process and providing diagnoses and treatments more efficiently than traditional methods [18]. Currently, generative AI demonstrates its impact in cancer diagnoses and detection, bariatric surgery, neurological clinical decisions, etc. Undoubtedly, the emergence and applicability of generative AI reinforces its characterization as the “second machine age” [15].
Existing studies that use AI algorithms (particularly early-generation models such as vanilla GANs), often encounter substantial challenges when applied to tabular clinical datasets. In contrast to image or text data, tabular clinical data are inherently heterogeneous, typically comprising a complex mix of continuous and categorical variables. These datasets frequently exhibit skewed distributions, missing values, and intricate inter-variable dependencies, all of which pose significant modeling difficulties [20]. Vanilla GANs, originally developed for image generation tasks, are not inherently designed to manage these complexities. Consequently, they often struggle to accurately capture the true underlying structure of tabular clinical data, resulting in synthetic datasets that lack fidelity and realism. This limitation becomes particularly critical when attempting to replicate key pharmacokinetic parameters, such as Cmax and AUC, which are fundamental to BE evaluations. Inadequate synthetic reproduction of these parameters can compromise the reliability of BE assessments, diminish the regulatory applicability of the generated data, and ultimately constrain the broader adoption of synthetic data solutions in clinical research and drug development. Also, they frequently need large datasets for training, which increases the computational cost, as well as result in low interpretability due to model complexity (e.g., TVAE, CTGAN, CTAB-GAN, StaSy) [21].
In our previous study, we introduced the idea of using Wasserstein GANs (WGANs) in clinical studies and used Monte Carlo simulations to evaluate their performance [22]. In that study, the data generated from the WGANs outperformed the sample, in terms of t-test evaluation, while also performing similarly to the original distributions. The similarity was assessed on the simultaneous success or not of the t-test criterion between the original and sample distribution, and the original and generated distribution [22]. This behavior of the WGANs model led us to further investigate its applicability in more extreme scenarios such as those of the HVDs in BE studies.
The aim of the study is to suggest a novel approach for incorporating WGANs in the traditional BE study setting to address the problem of patient recruitment and decision-making. The methodology was further implemented in real BE datasets after the Monte Carlo simulations to assess their validity. By providing a framework for generating realistic synthetic datasets (“virtual patients”) that preserve the inherent variability of pharmacokinetic parameters we aim to potentially reduce the need for large sample sizes and complex replicate designs. By exploiting the ability of WGANs to model complex, high-variability distributions with stable training, this approach could improve the efficiency of BE studies, reduce the false negative rejections of HVDs based on the small sample, decrease participant burden, and ultimately facilitate faster access to generic drugs.

2. Materials and Methods

Our methodology consists of three parts: a BE study environment, WGANs, and Monte Carlo simulations. The model was assessed using BE acceptance percentages based on regulatory body-scaled limitations and their similarity [3,4,5]. To evaluate our model performance with HVDs, we examined a comprehensive range of parameters.
Figure 1 demonstrates our proposed method for our current study. The first step of our research is to replicate the current BE setting and calculate the BE acceptance percentages according to the limits proposed by the FDA and the EMA for HVDs. The BE acceptance percentages are then recalculated using this data augmentation technique by applying WGANs and creating “virtual patients”.

2.1. Wasserstein Generative Adversarial Networks

The fundamental part of our research is the implementation of WGANs as a novel approach in BE studies. Generative adversarial networks are based on a game between two machine learning models, which are commonly implemented with two neural networks. Those are named generator and discriminator. The generator must learn to transform random noise into realistic samples and the discriminator must evaluate the sample to estimate whether or not they are real. If it originates from training data, then it is real; if it originates from the generator, then it is fake (Figure A1) [23,24]. The two primary components of WGANs that provide them an edge over GANs are Wasserstein distance and loss. The work needed to convert one distribution into another is known as the Wasserstein distance between two distributions. The goal of the Wasserstein distance cost or loss function is to improve the gap between the generated and actual data [25,26].
Figure 1 solely refers to the proposed approach of our study and how HVDs that falsely failed to demonstrate BE, with the implementation of WGANs and data augmentation, can provide a more informed decision on the BE. On the other hand, Figure A1 provides a depiction of the GAN architecture, to present how the AI model works, by providing the generator with random noise and the generating data. The generated data are then added to the critic and by comparing them to real data, the model can decide if the generated data are real or fake. The whole process is repeated many times, and the critic learns each time to better distinguish real samples from fake ones.
Training stability was ensured by tracking both generator and critic losses during training. By visually inspecting the curves, an indicator of stable training are smooth converging loss curves. Also, in our study where a small number of samples were used, we implemented an early stopping to prevent overfitting. Furthermore, consistent model initialization and fixed seeds throughout the code helped reduce variance across runs.

2.2. Monte Carlo Simulations

The primary objective of pharmacokinetics is to characterize the central tendency of pharmacokinetic parameters and to identify the sources contributing to their variability within a population. A comprehensive modeling approach allows the evaluation of different forms of variability, including between-subject, within-subject, and residual (unexplained) variability. In the context of a standard 2 × 2 crossover bioequivalence study, each subject receives both the test and reference treatments in different periods, enabling direct within-subject comparisons. The main sources of variability in such designs include sequence effects (differences due to the order of treatments), period effects (differences between study periods), treatment effects (true differences between formulations), and, most critically, residual variability. Residual variability captures the random fluctuations in pharmacokinetic responses within the same individual that are not explained by other model components. It plays a central role in bioequivalence assessment, as it directly influences the width of the confidence intervals used to determine equivalence. Higher residual variability increases uncertainty, making it more difficult to demonstrate bioequivalence, and often requires larger sample sizes or the application of alternative statistical methods for highly variable drugs.
To simulate the BE environment, we created Monte Carlo simulations of a 2 × 2 crossover study. In our simulations, we generated random distributions as input for WGANs. We randomly generated two different normal distributions to create the initial T and R groups. These distributions had a mean endpoint of 100, with standard deviations varying according to each executed scenario. The original distributions were generated by generating random normal distributions using the mathematical equation Χ   ~   Ν ( μ , σ 2 ) , where μ = 100 represents the mean pharmacokinetic endpoint (e.g., Cmax or AUC) and σ is determined based on the coefficient of variation (CV) through the relationship σ = μ × C V (CV remained constant at 10% throughout the whole study). The mean of 100 was chosen to standardize the simulated datasets and simplify interpretation, ensuring consistency across the different executed scenarios. This choice does not affect generalizability, as the BE analysis depends on the relative T/R ratios and variability rather than the absolute values of the endpoints. This approach is designed to replicate data from real BE studies, where samples are randomly selected. In pharmacokinetics, variability is typically quantified using the CV, which expresses the extent of variability relative to the mean. In our study, we specifically refer to CVw, which measures the residual variability of pharmacokinetic parameters (AUC, Cmax). In BE studies, the CVw plays a critical role in determining sample size requirements and influences whether scaled BE approaches (such as those used for HVDs) are needed. To ensure robust results, we repeated the process of generating random distributions for WGAN input thousands of times.
We conducted simulations across 36 unique scenarios, structured through a full factorial design to thoroughly assess our proposed approach. This design varied four key factors: sample size (three levels), data variability (three levels), regulatory context (two frameworks, such as FDA and EMA), and the size of the synthetic datasets used for augmentation (two levels). By exploring all possible combinations of these factors (3 × 3 × 2 × 2), we ensured a comprehensive evaluation of the method’s performance under a broad spectrum of conditions. For each scenario, a number of 1000 Monte Carlo trials have been simulated. In the methodology flowchart (Figure 2) below you can see the exact steps of the implementation of WGANs in BE studies. First of all, it is important to create a WGAN architecture based on the data type of our research. The WGAN model comprises the generator and the critic, each one of those with their own layers and activation functions. Next, for each executed scenario, there was the definition of the parameters, such as CVw, N, sample size, T/R ratios and augmentation scale. To begin with, Monte Carlo simulations were performed for the generation of original data and the random sampling, which served as an input of the generator of WGANs. Then, the WGANs were trained based on the samples and generated data according to the augmentation scale. Finally, for all three distributions (original, sample and generated) an ANOVA analysis was performed to evaluate the percentage of BE acceptance and to compare the results.
Figure A2 depicts parts of the code created for the implementation of WGANs in BE studies to give a better understanding of the methodology that was followed from creating the original distributions to generating the synthetic data.
The selection of appropriate WGAN hyperparameters was crucial for our research. Table 1 shows all hyperparameter values evaluated during the study fine-tuning phase. We investigated various activation functions, latent dimensions, and epochs, along with different numbers of neurons in both the generator and critic components of the WGANs. WGANs are sensitive to hyperparameter changes based on the type of input data. To evaluate the best combination of hyperparameters that suits our study, a variety of different values were examined. A change in the hyperparameters can result in a dysfunctional model, which is why the optimal hyperparameter combination is important to ensure the consistency of our results and the robustness. The specific hyperparameter ranges were selected through empirical tuning based on a trial-and-error approach. The latent dimension range of 60–120 was examined to ensure sufficient capacity for generating diverse samples without overfitting. Smaller dimensions produced oversimplified output, whereas larger ones added unnecessary complexity and noise. The final choice of 60 for the latent dimension provided a better model performance. The number of neurons (4–10) showcase the balance of the model expressiveness and training efficiency. Fewer neurons conclude to underfitting the data, while larger numbers increase training time and lead to overfitting. On the other hand, the number of epochs (500–5000) was examined on the convergence based on our specific research study. The goal was for the WGANs architecture to provide consistent results and not result in mode collapse. The final choice of the hyperparameters across all scenarios, following an exhaustive search through all combinations of settings and scenarios. These hyperparameters remained constant throughout all scenario executions.
Table 2 summarizes the scenarios investigated in this study. To evaluate the method’s performance across various conditions, we tested CVw values ranging from low (15%) to high variability (50%). For challenging algorithm evaluation, we set the T/R ratio at 1.1. Input population sizes varied from 18 to 60 values per group, with different sampling percentages. The generated population size was set at two or three times the original size. For the 30% and 50% variability levels, the EMA and FDA-scaled limits were applied to the original and sample datasets, whereas the classic 80–125% limits were always used for the WGAN-generated data. We assessed all parameter combinations to understand WGAN performance under extreme conditions for high-variable drugs, resembling real-world scenarios.
The analysis relied on two key parameters: the BE acceptance percentage for each distribution and the similarity percentage, both based on regulatory bodies’ scaled limits. The similarity parameter is a percentage that denotes the simultaneous acceptance of BE by the two distributions under comparison. In the context of BE studies, the similarity parameter serves as a crucial quality check to ensure that the datasets generated by WGANs maintain the essential statistical properties of the original distributions. Maintaining distributional similarity is fundamental because BE conclusions depend heavily on precise statistical characteristics such as variability, central tendency, and shape of the exposure parameters (e.g., Cmax and AUC). Without sufficient similarity, synthetic data could introduce bias, either artificially increasing the chance of passing BE criteria (false positives) or masking true BE (false negatives). Therefore, by quantifying similarity using statistical metrics, we can demonstrate that the WGAN-generated datasets are good representations of the original datasets, thus supporting the validity of the synthetic data for BE assessment. An appropriate data augmentation approach would ensure that the similarity between the synthetic data and the original dataset remains high when variability is low. However, as variability increases, the similarity values are expected to gradually decrease, reflecting the growing differences introduced during the augmentation process. These were produced among the distributions of the same simulation to analyze the resemblance for the 75% sampling percentages, in order to gain a better understanding of the similarities between the original distribution and a sample, rather than a 100% sampling, which would not show any differences. To evaluate the data distribution overlap visual inspections were carried out in combination with metric such as the Szymkiewicz–Simpson and the Bhattacharyya for all datasets.

3. Results

Initial scenarios were focused on generating 2×N data, while the second part of the analysis focused on the generation of 3×N data. 
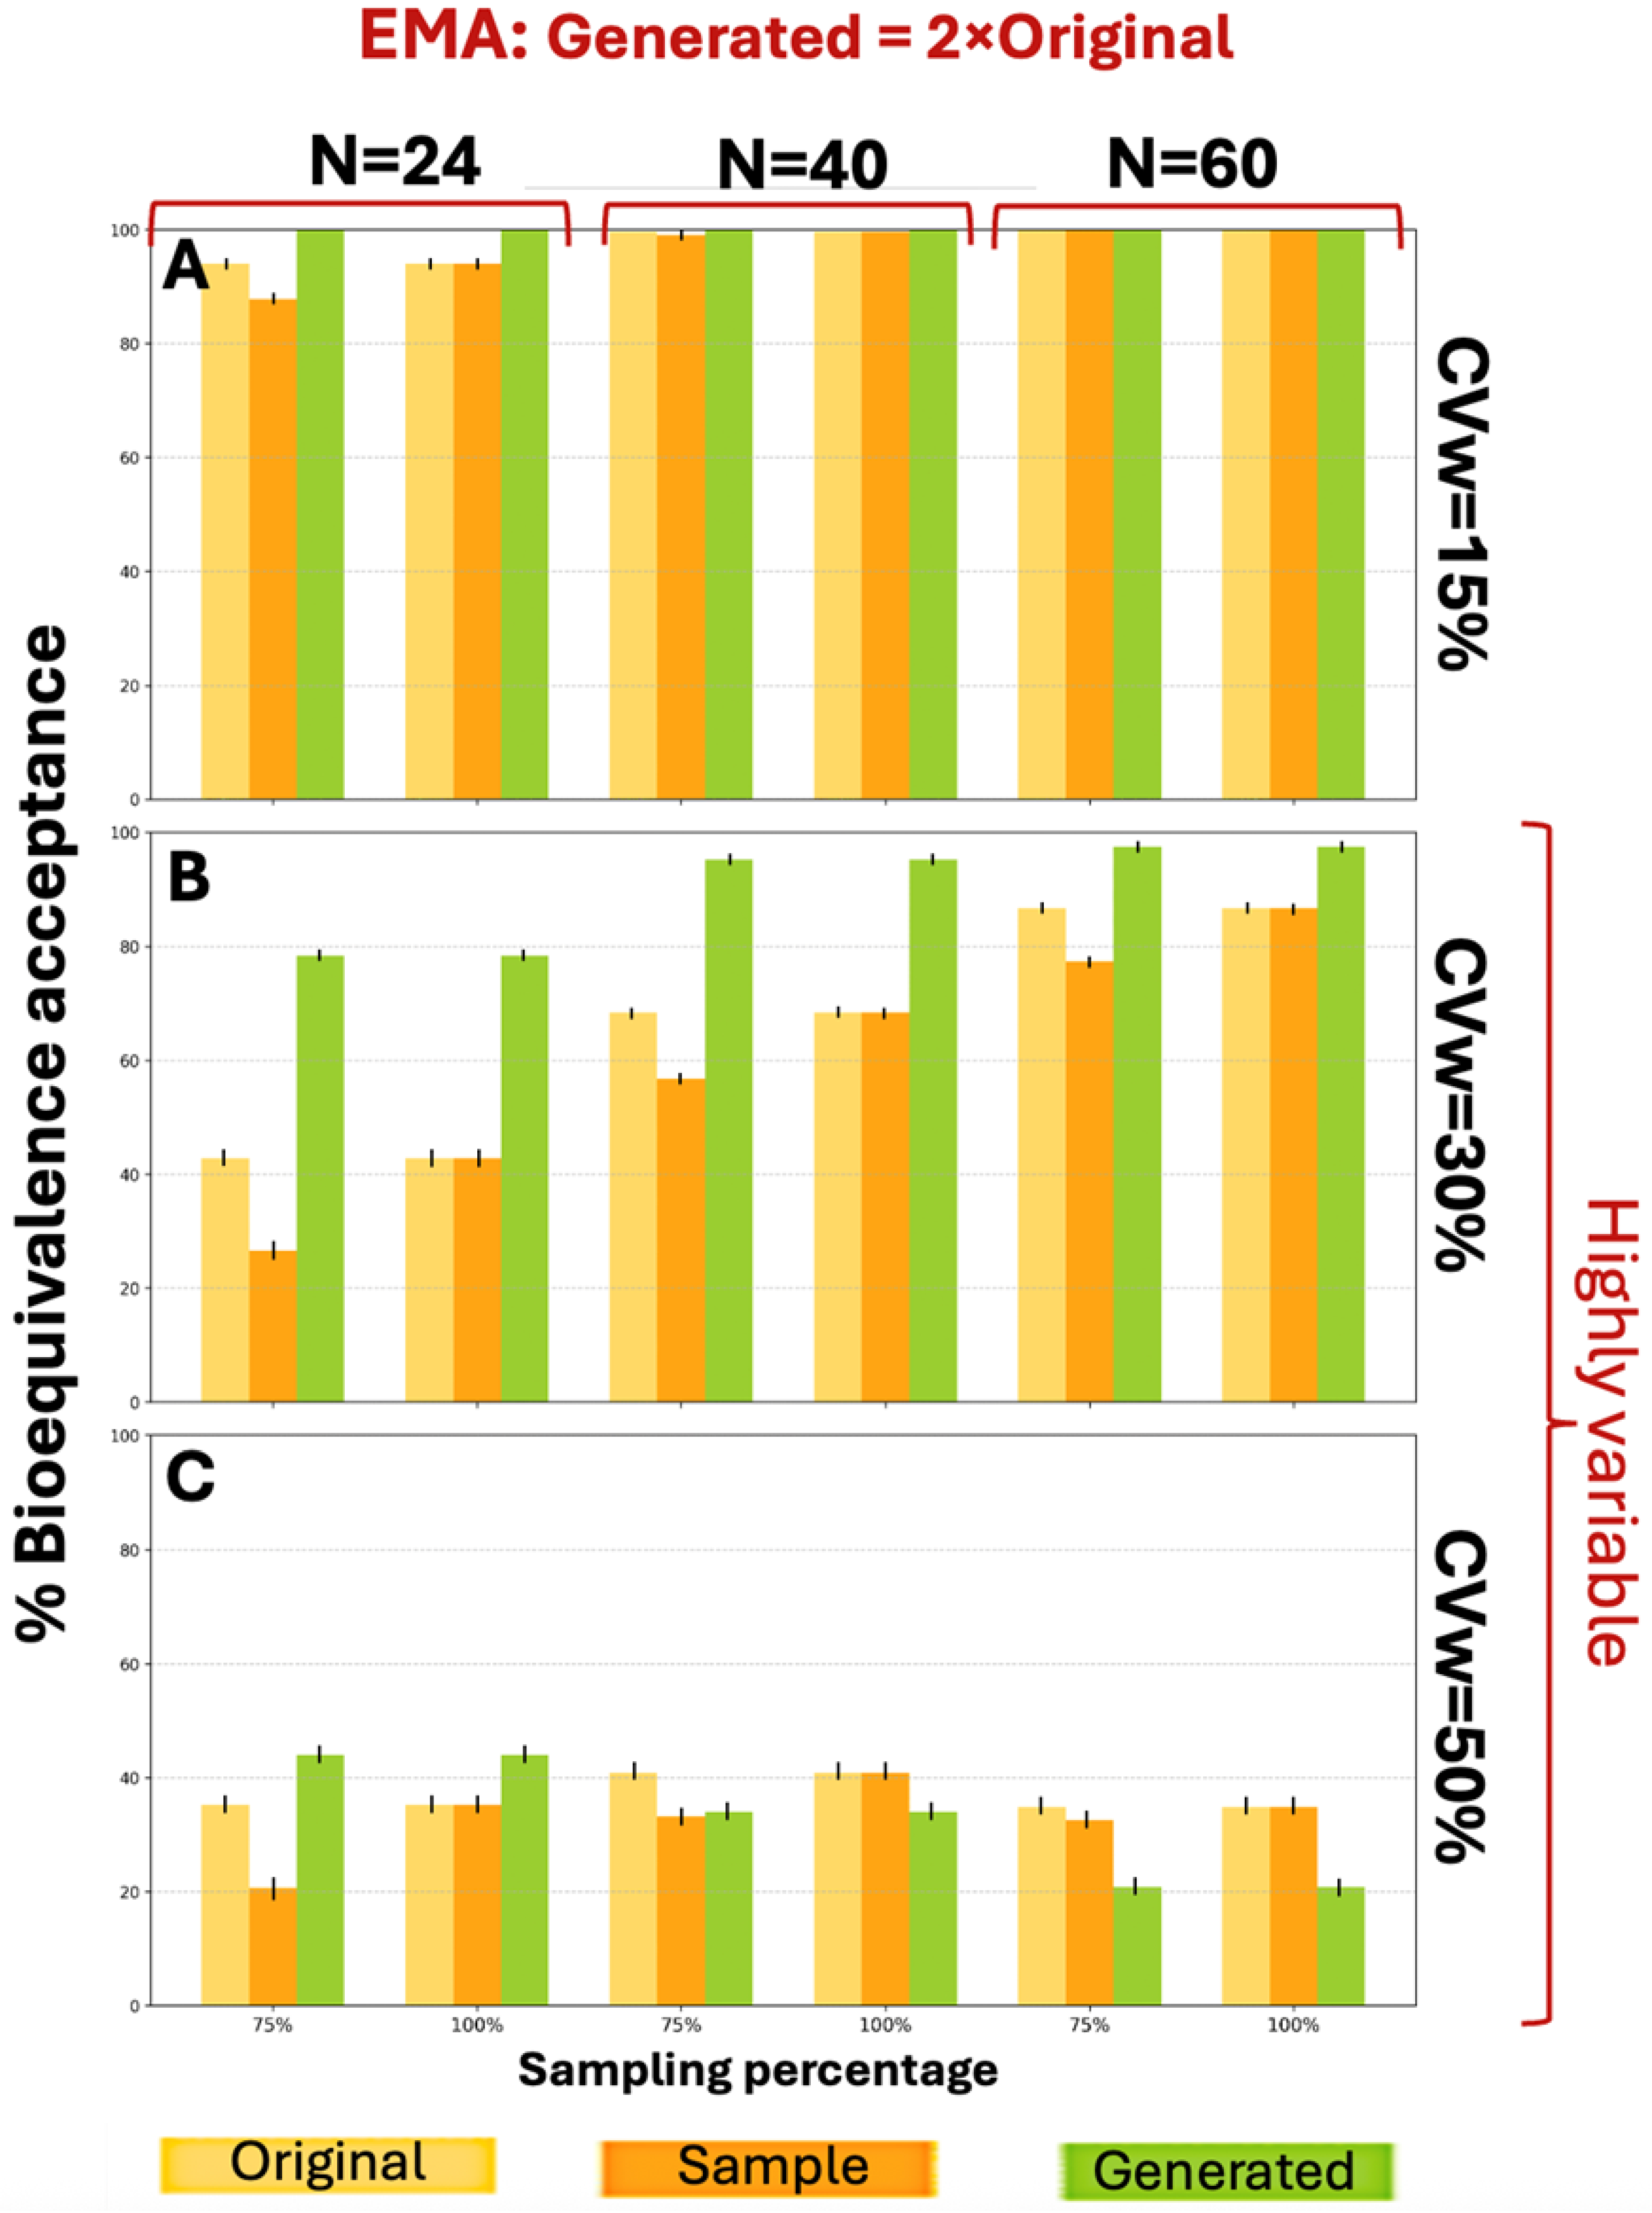
Figure A3 shows the BE acceptance percentage results for the three distributions (original, sample, and generated) according to EMA guidelines. For a CVw value of 15% the generated data exhibited better performance compared to the original data for N = 24 and N = 40 (for 75% sampling), while for the other scenarios the generated data performed equally to the original. For CVw = 30% the generated data consistently outperformed the original data. Similarly, 
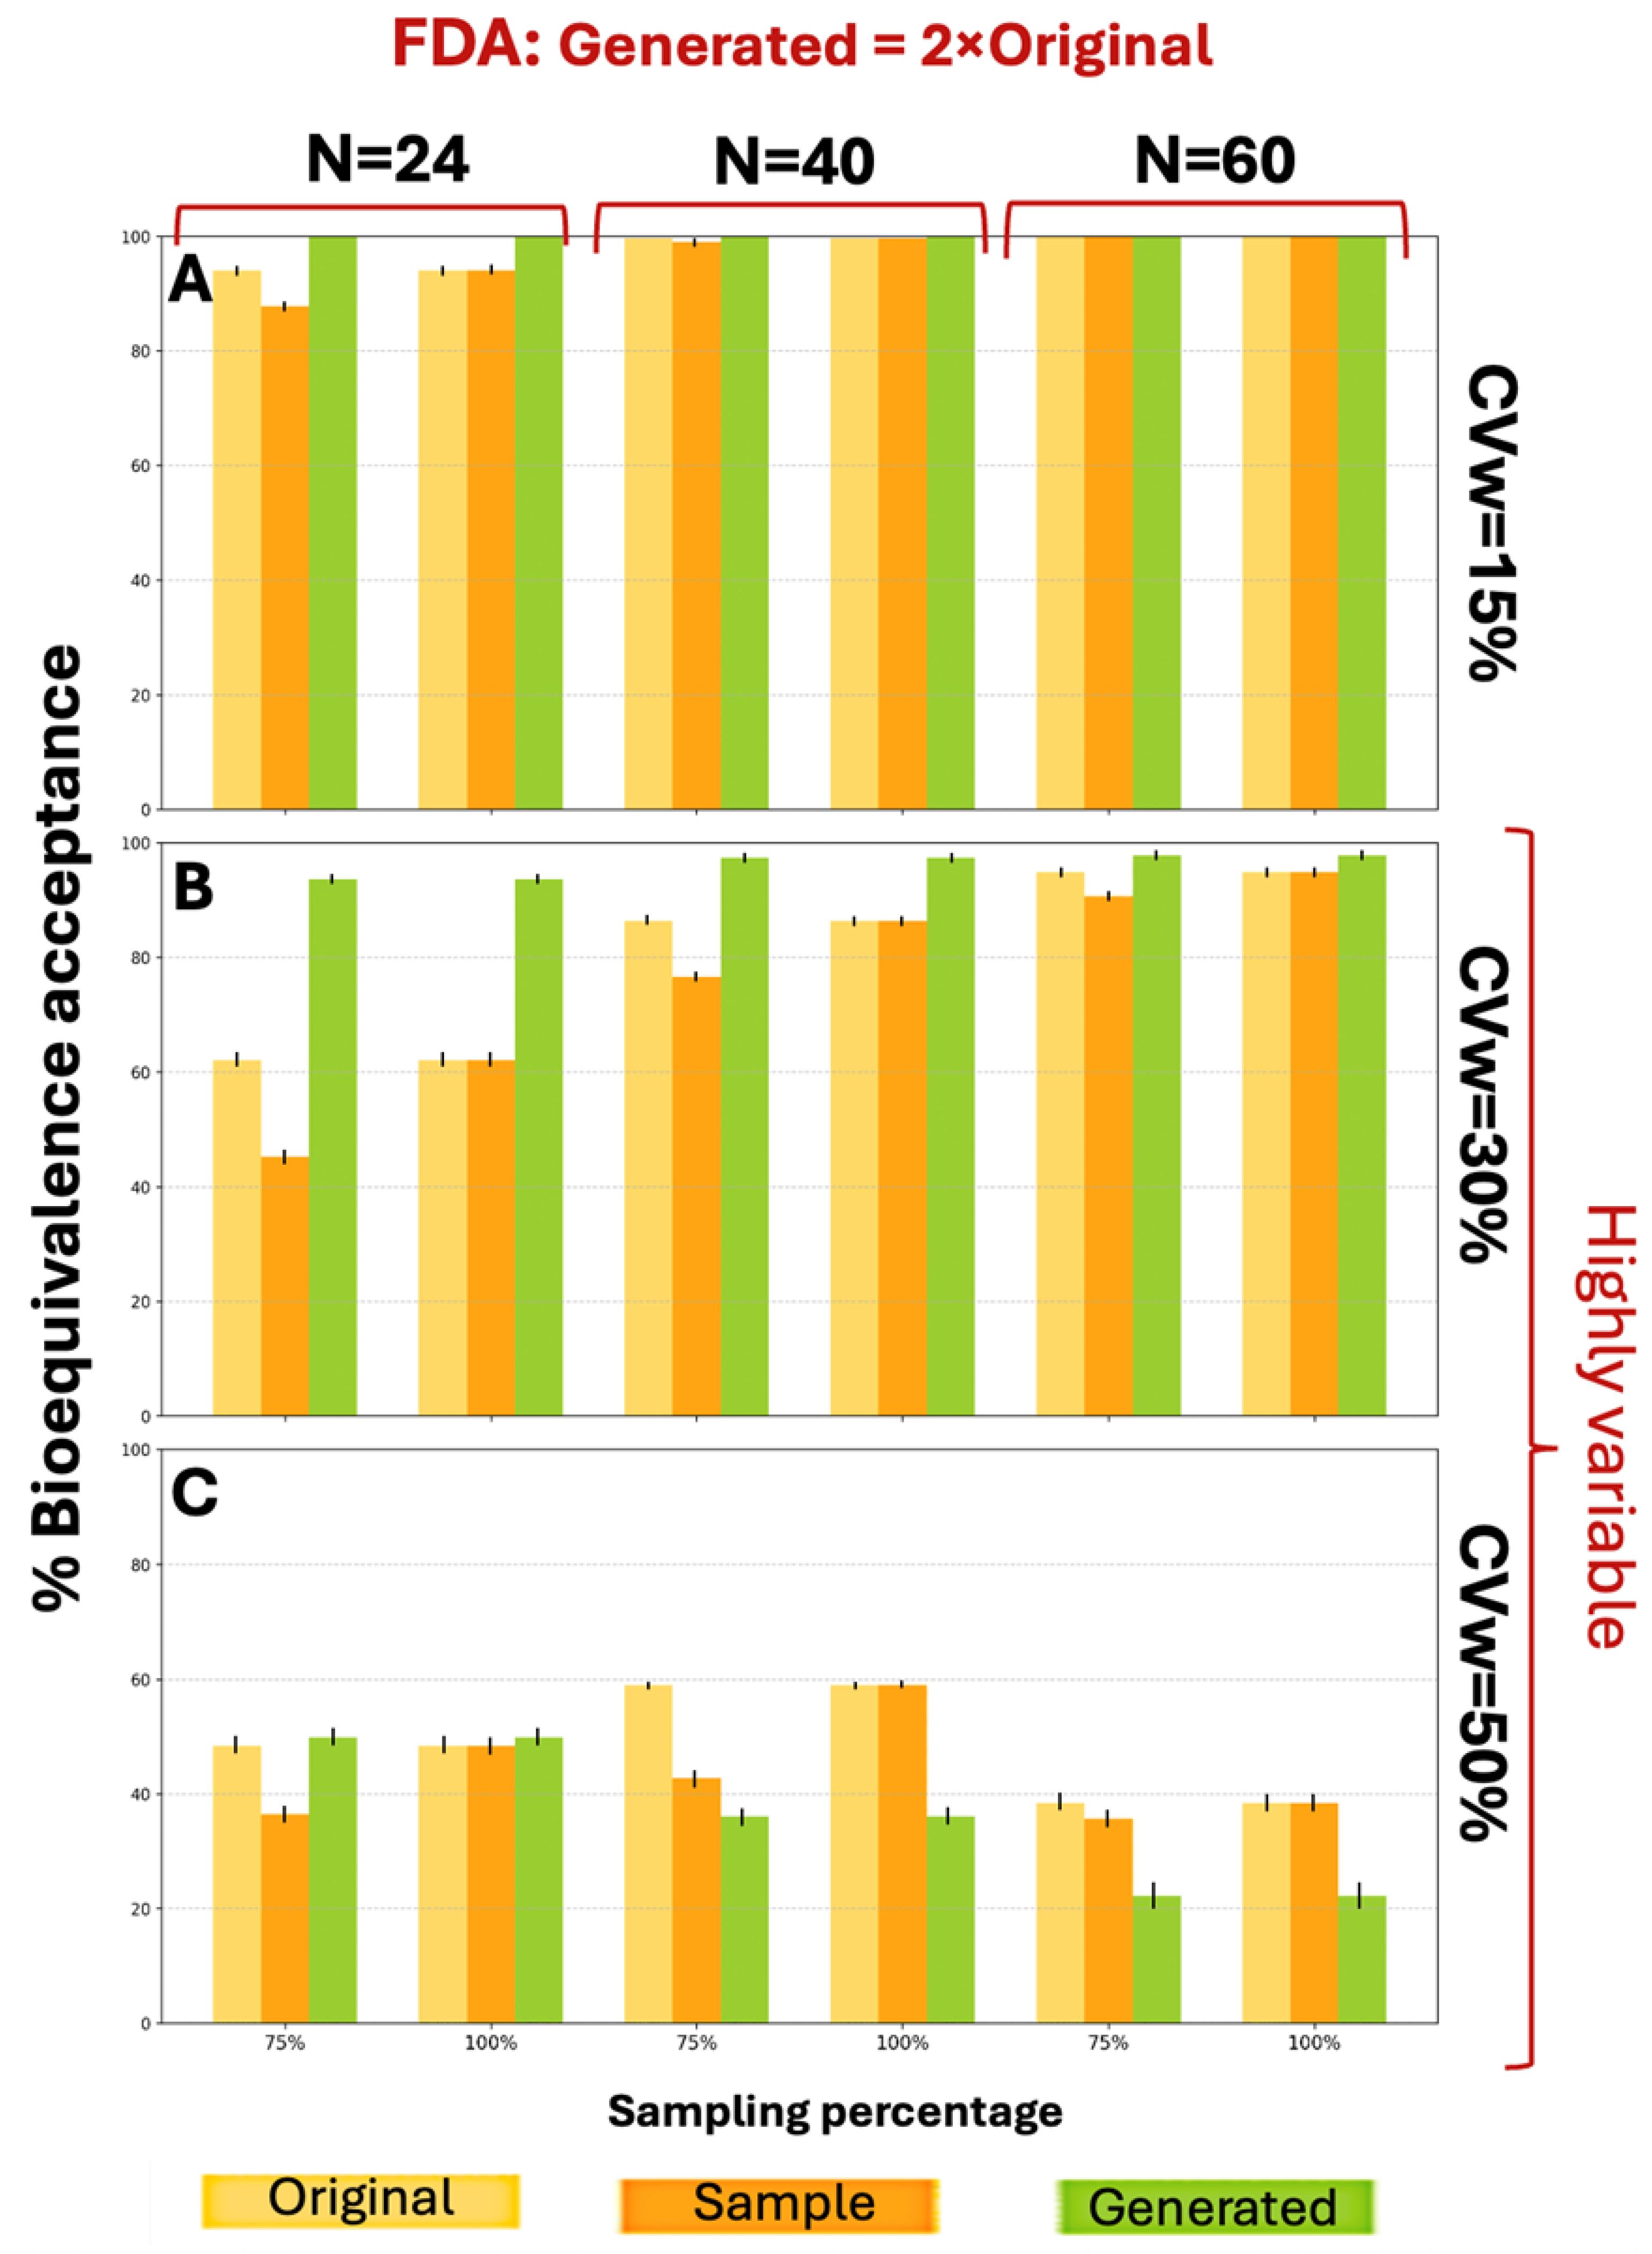
Figure A4 presents the BE acceptance results under FDA criteria. For CVw values of 15% and 30%, distributions generated at twice the original size showed better performance across all parameter combinations, achieving higher BE acceptance percentages. The WGAN datasets capture variability and uncertainty in two ways. The first is the application of the BE acceptance percentage as a probabilistic metric. For each scenario, the percentage is based on thousands of simulation iterations and captures the uncertainty in the outcome, indicating how frequently synthetic data can produce an acceptable result. The second one is the variation between runs. The standard deviation across the scenarios is represented by error bars in each figure. At CVw = 50%, the generated distributions achieved higher percentages for smaller sample sizes (N = 24) but lower percentages for larger samples (N = 40, N = 60) under both EMA and FDA guidelines.
Due to the limited number of available samples, data augmentation was restricted to 2×N and 3×N of the original dataset size. The process initially began with a 2×N augmentation; however, based on preliminary results, it was subsequently extended to a 3×N augmentation. This larger augmentation yielded improved performance, approaching the optimal results one might expect. The decision to limit augmentation at this scale was made to avoid over-reliance on a small sample base and to prevent the generation of synthetic data that could lead to overfitting.
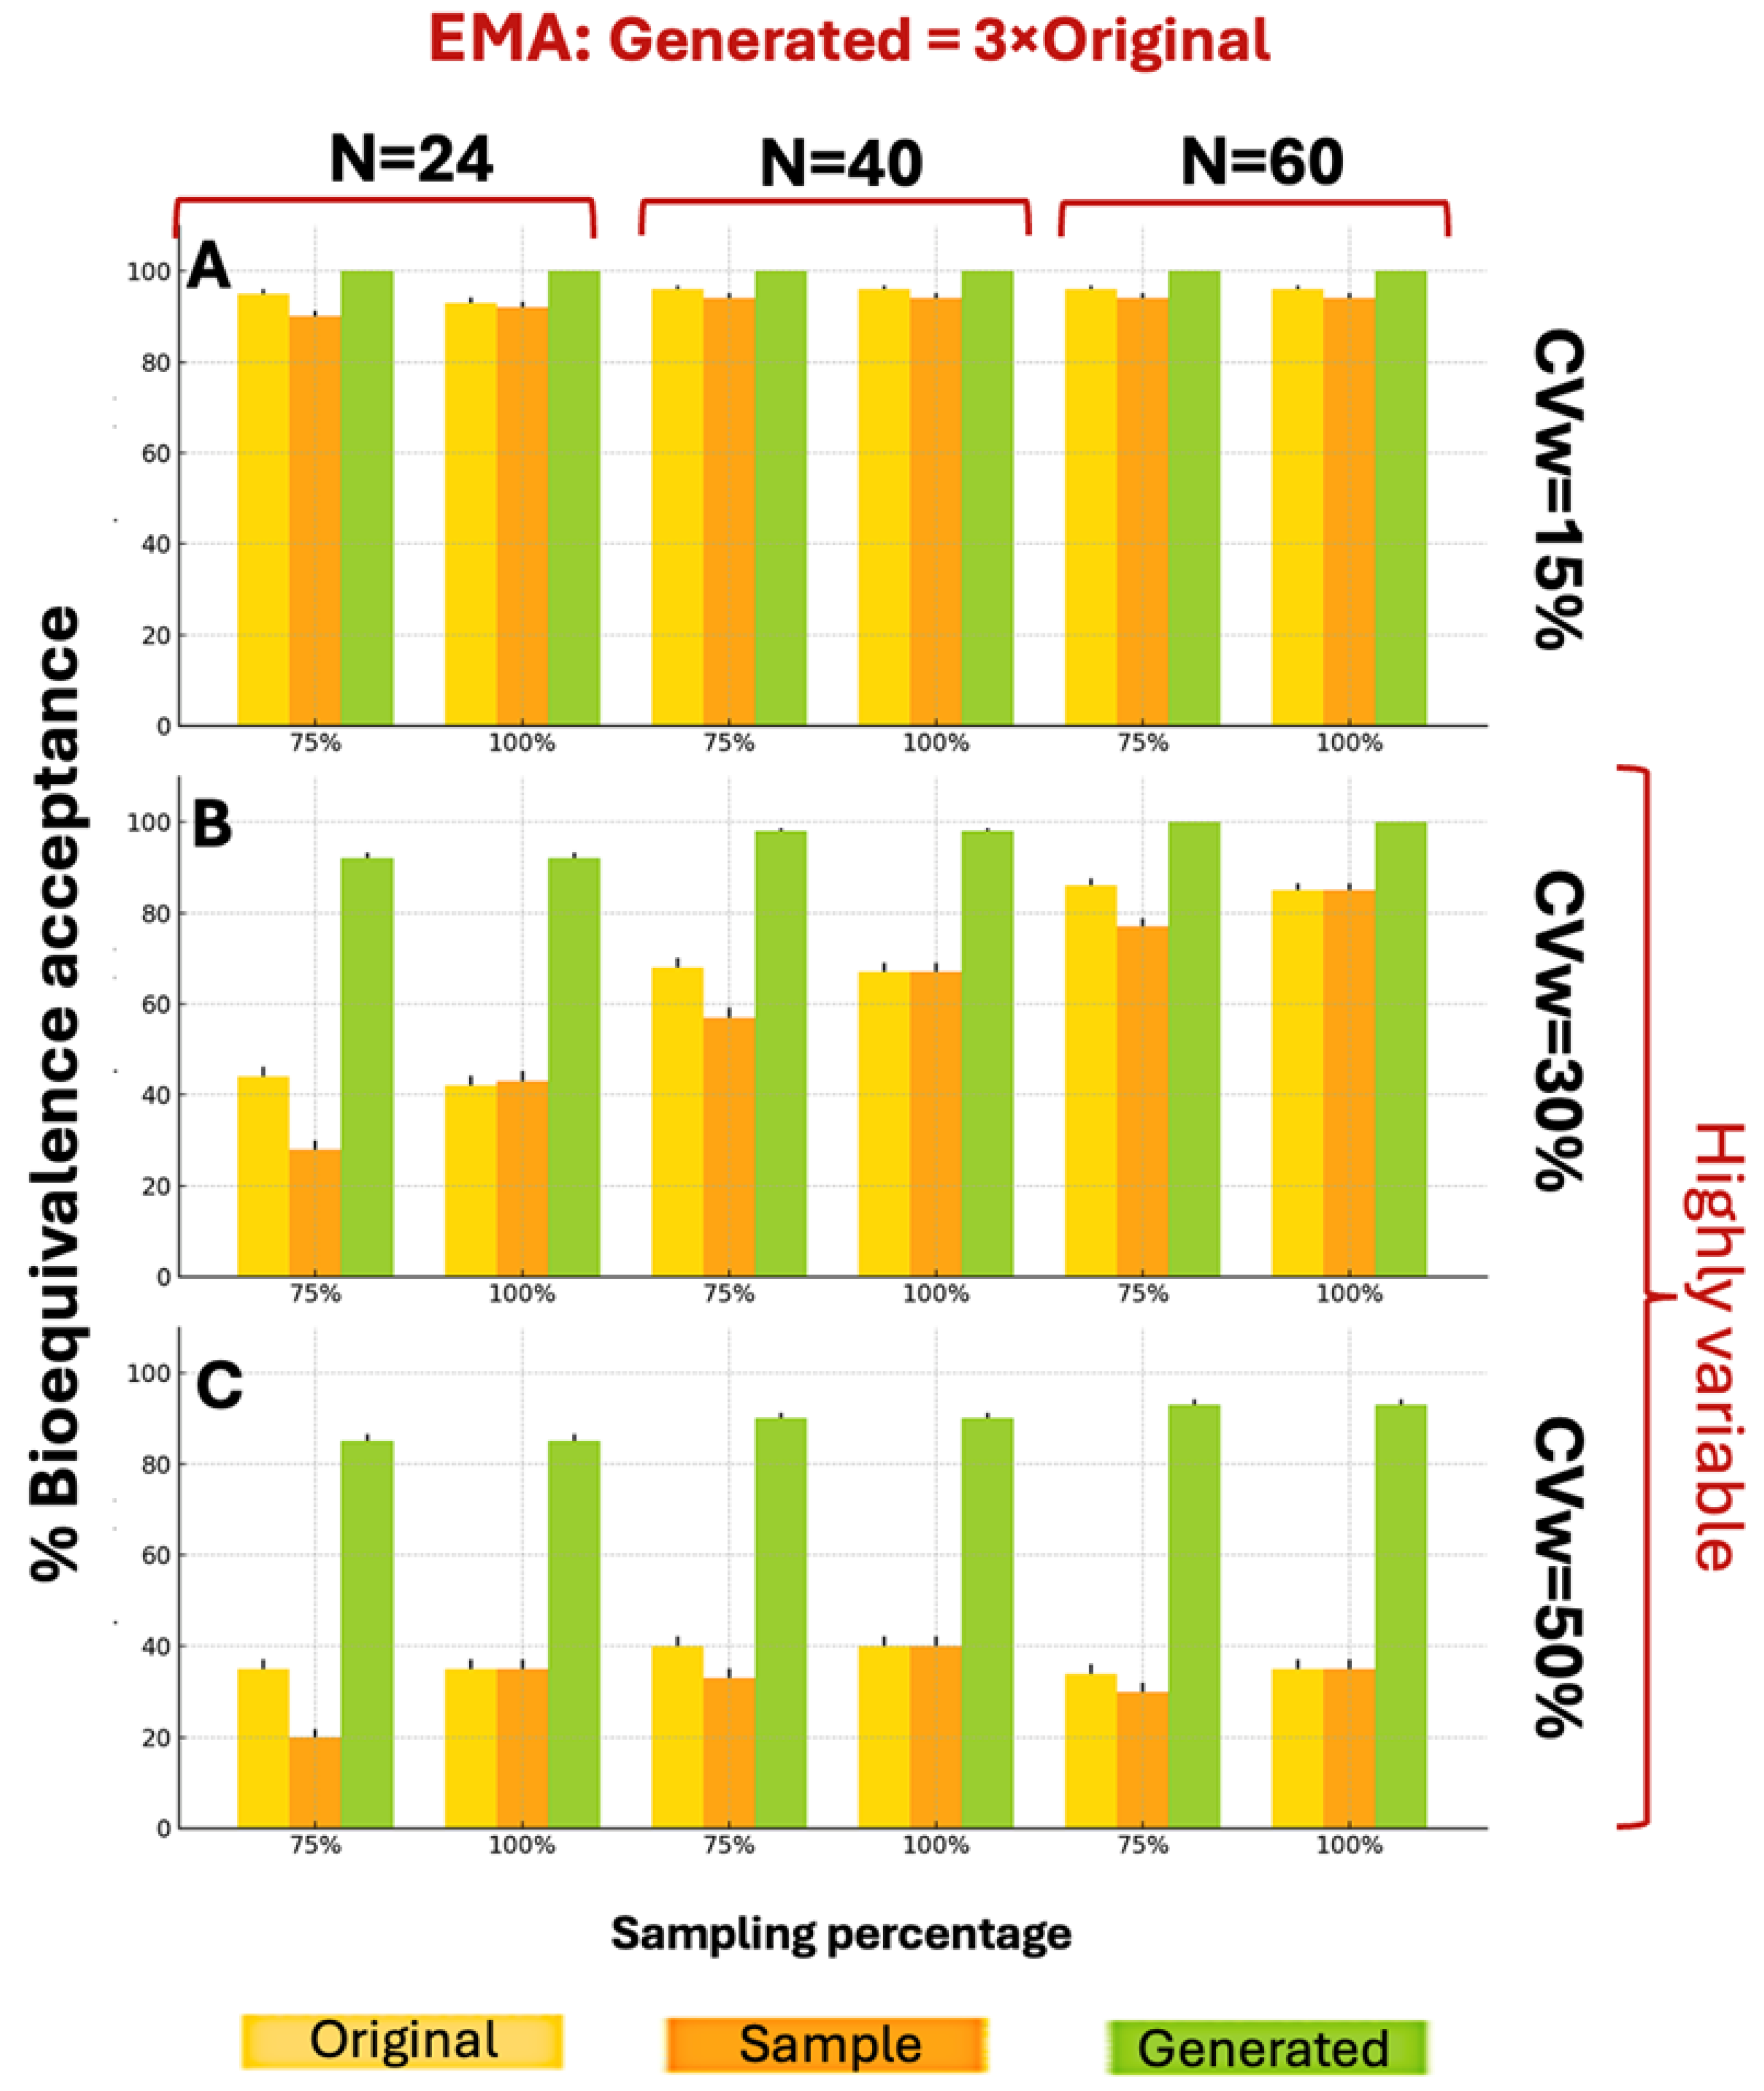
The generated distributions of the 3×N augmentation consistently showed better BE acceptance compared to both original and sample distributions, under the EMA guidelines. Figure 3 illustrates the BE acceptance percentages under EMA guidelines when generating 3×N distributions. The 3×N generation scenarios demonstrated superior BE acceptance compared to 2×N scenarios across all parameter combinations. While WGANs struggled with 2×N data at CVw = 50%, the 3×N approach overcame this limitation, achieving BE acceptance percentages consistently above 80%, compared to the sample maximum of 40%.
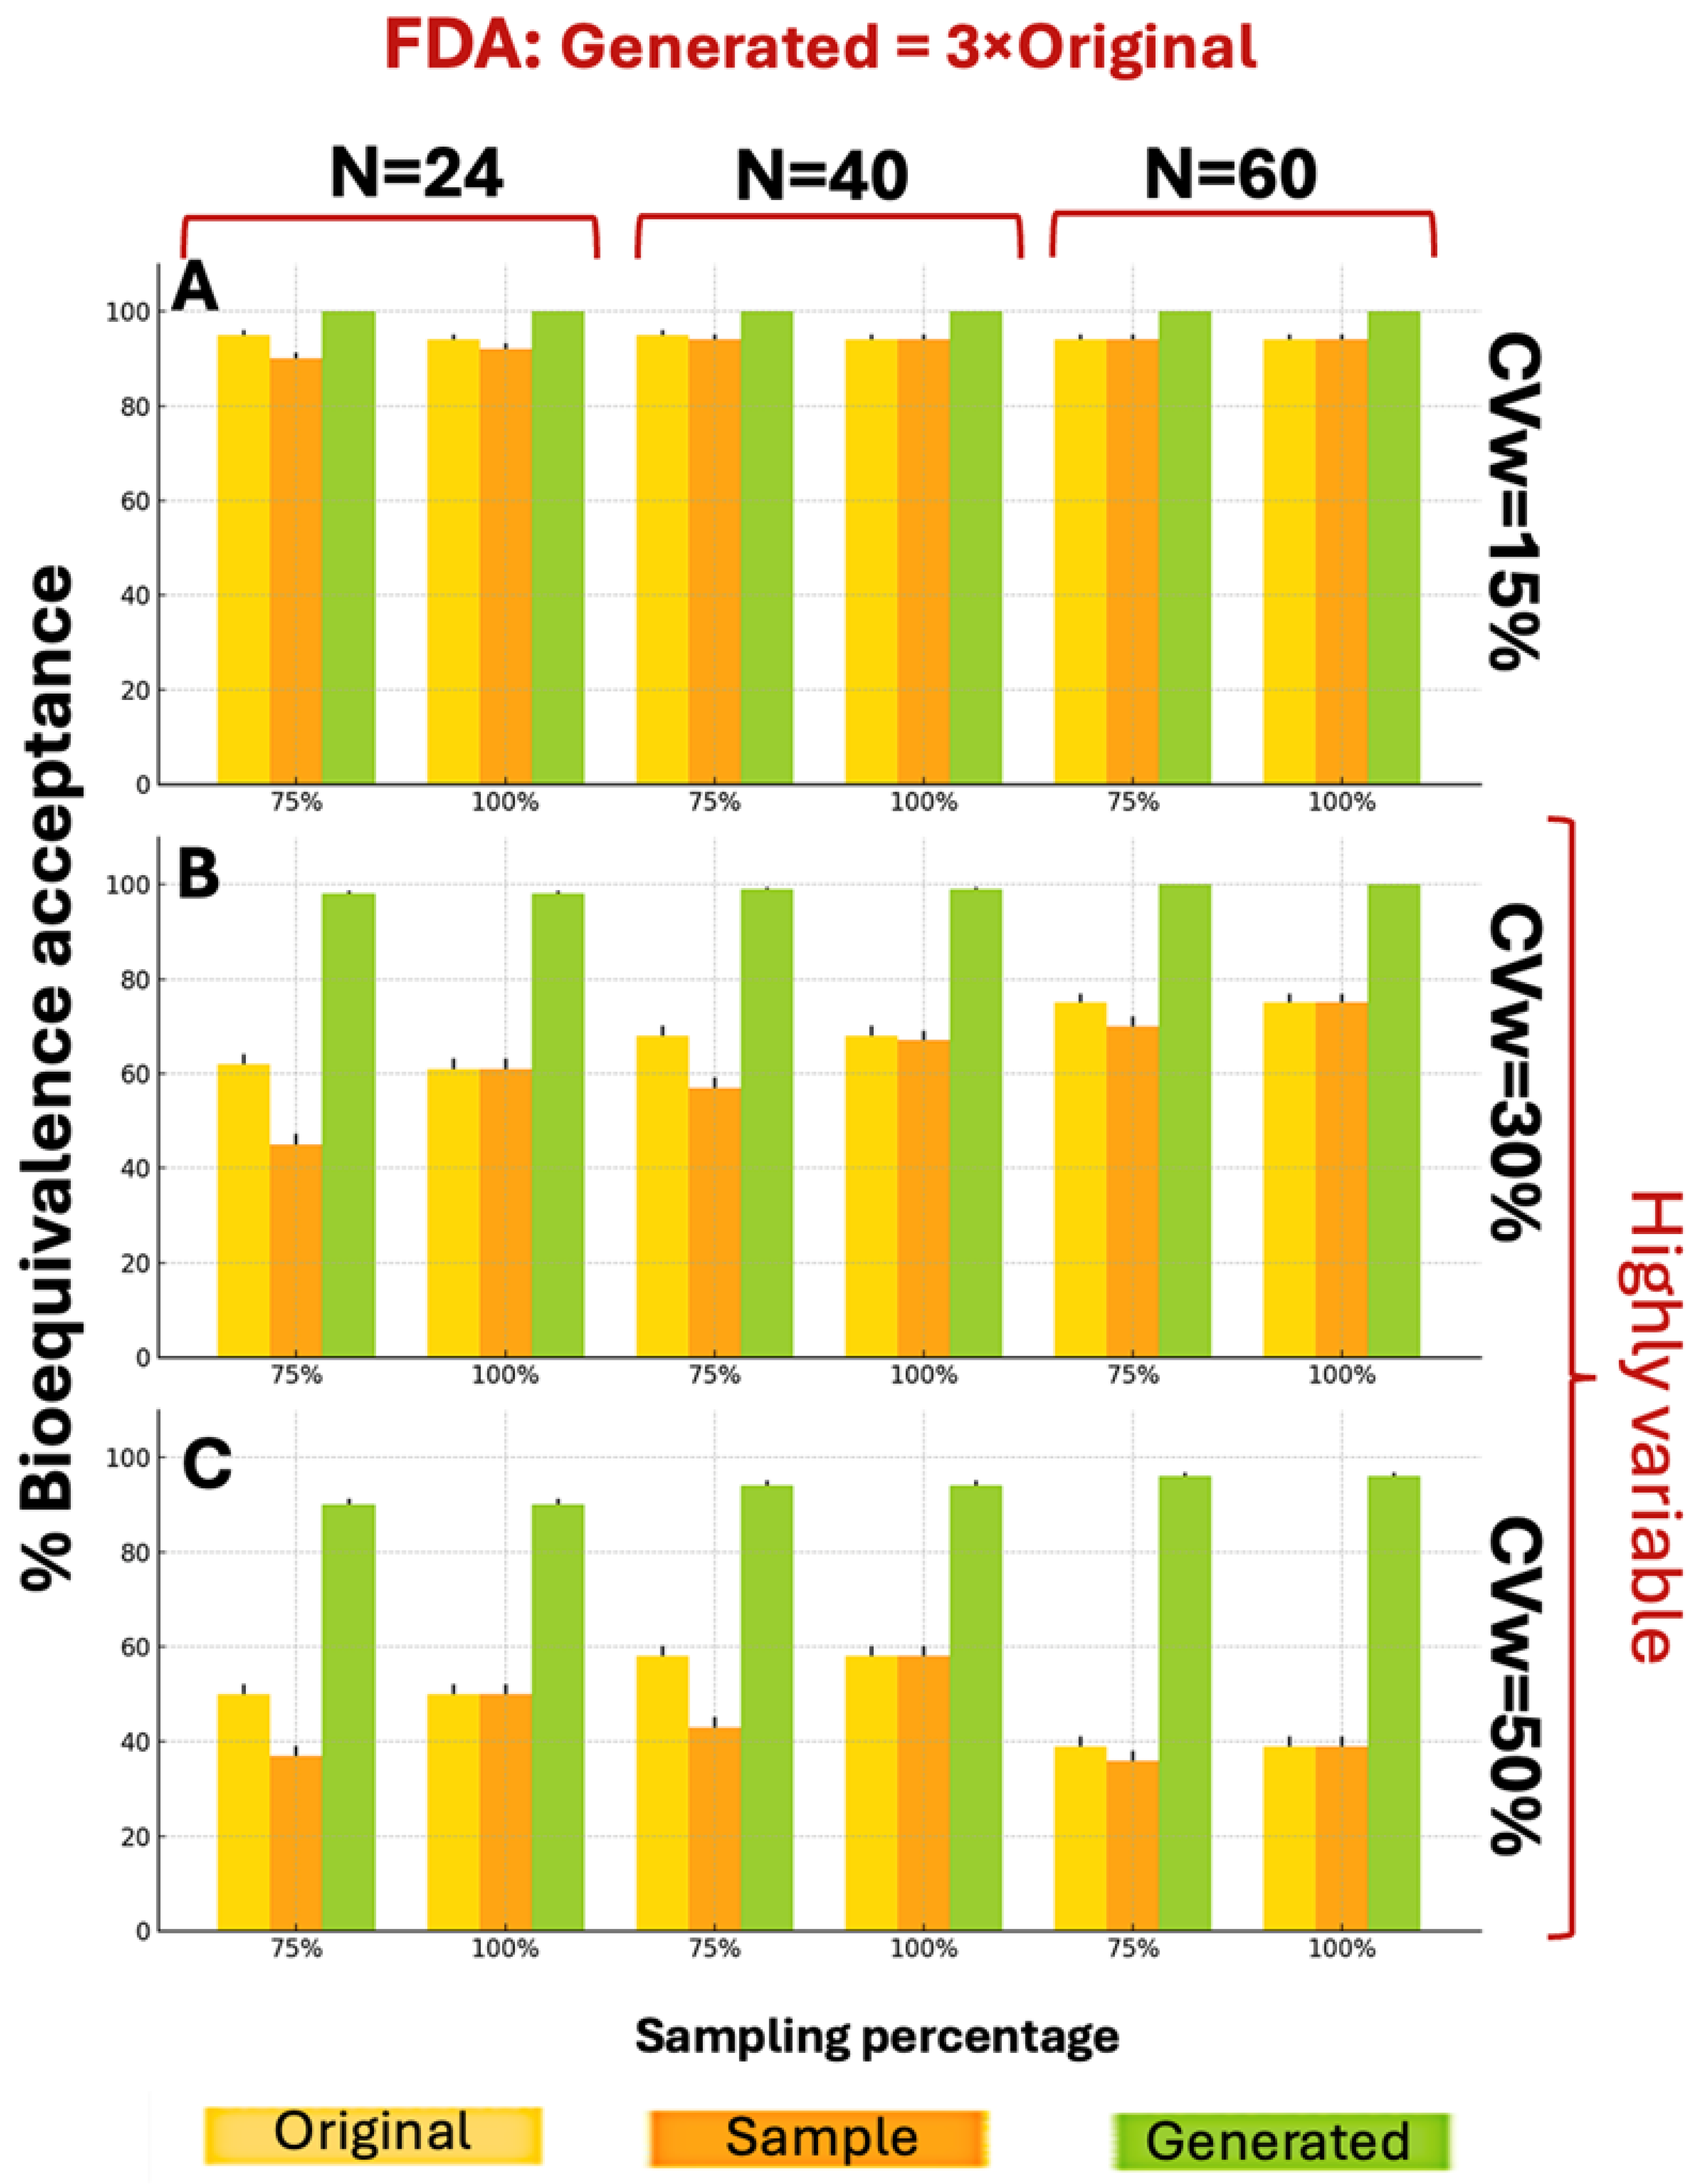
WGANs consistently outperformed both original and sample distributions across all CVw values and parameters, under the FDA guidelines, showcasing similar behavior as Figure 3. According to Figure 4, for CVw ranging from 15% to 50%, the generated data achieved higher BE acceptance percentages than original or sample distributions, exceeding 89% in all scenarios. Notably, 10 of the 18 scenarios reached 100% generated BE acceptance. These superior results with 3×N generation confirm the appropriateness of this approach.
Considering the similarity parameter, for the EMA scenarios the original distribution and the synthetic one have a higher similarity in 14/18 scenarios compared to the original and sample. For the FDA guidelines, 12/18 scenarios performed better in the similarity parameter of the original and the synthetic distributions compared to the original and sample. In the following tables (Table 3 and Table 4) are presented the results for the EMA and FDA scenarios, respectively. As CVw and the augmentation scale (×N) increase, the similarity original vs. synthetic becomes lower. It should be emphasized that in all scenarios with low to medium sample sizes and variability, the synthetic datasets exhibited a higher percentage of similarity compared to the sample data. However, as expected, the percentage similarity decreased under conditions of high sample size and variability—an underlying factor contributing to the superior performance of the synthetic data.
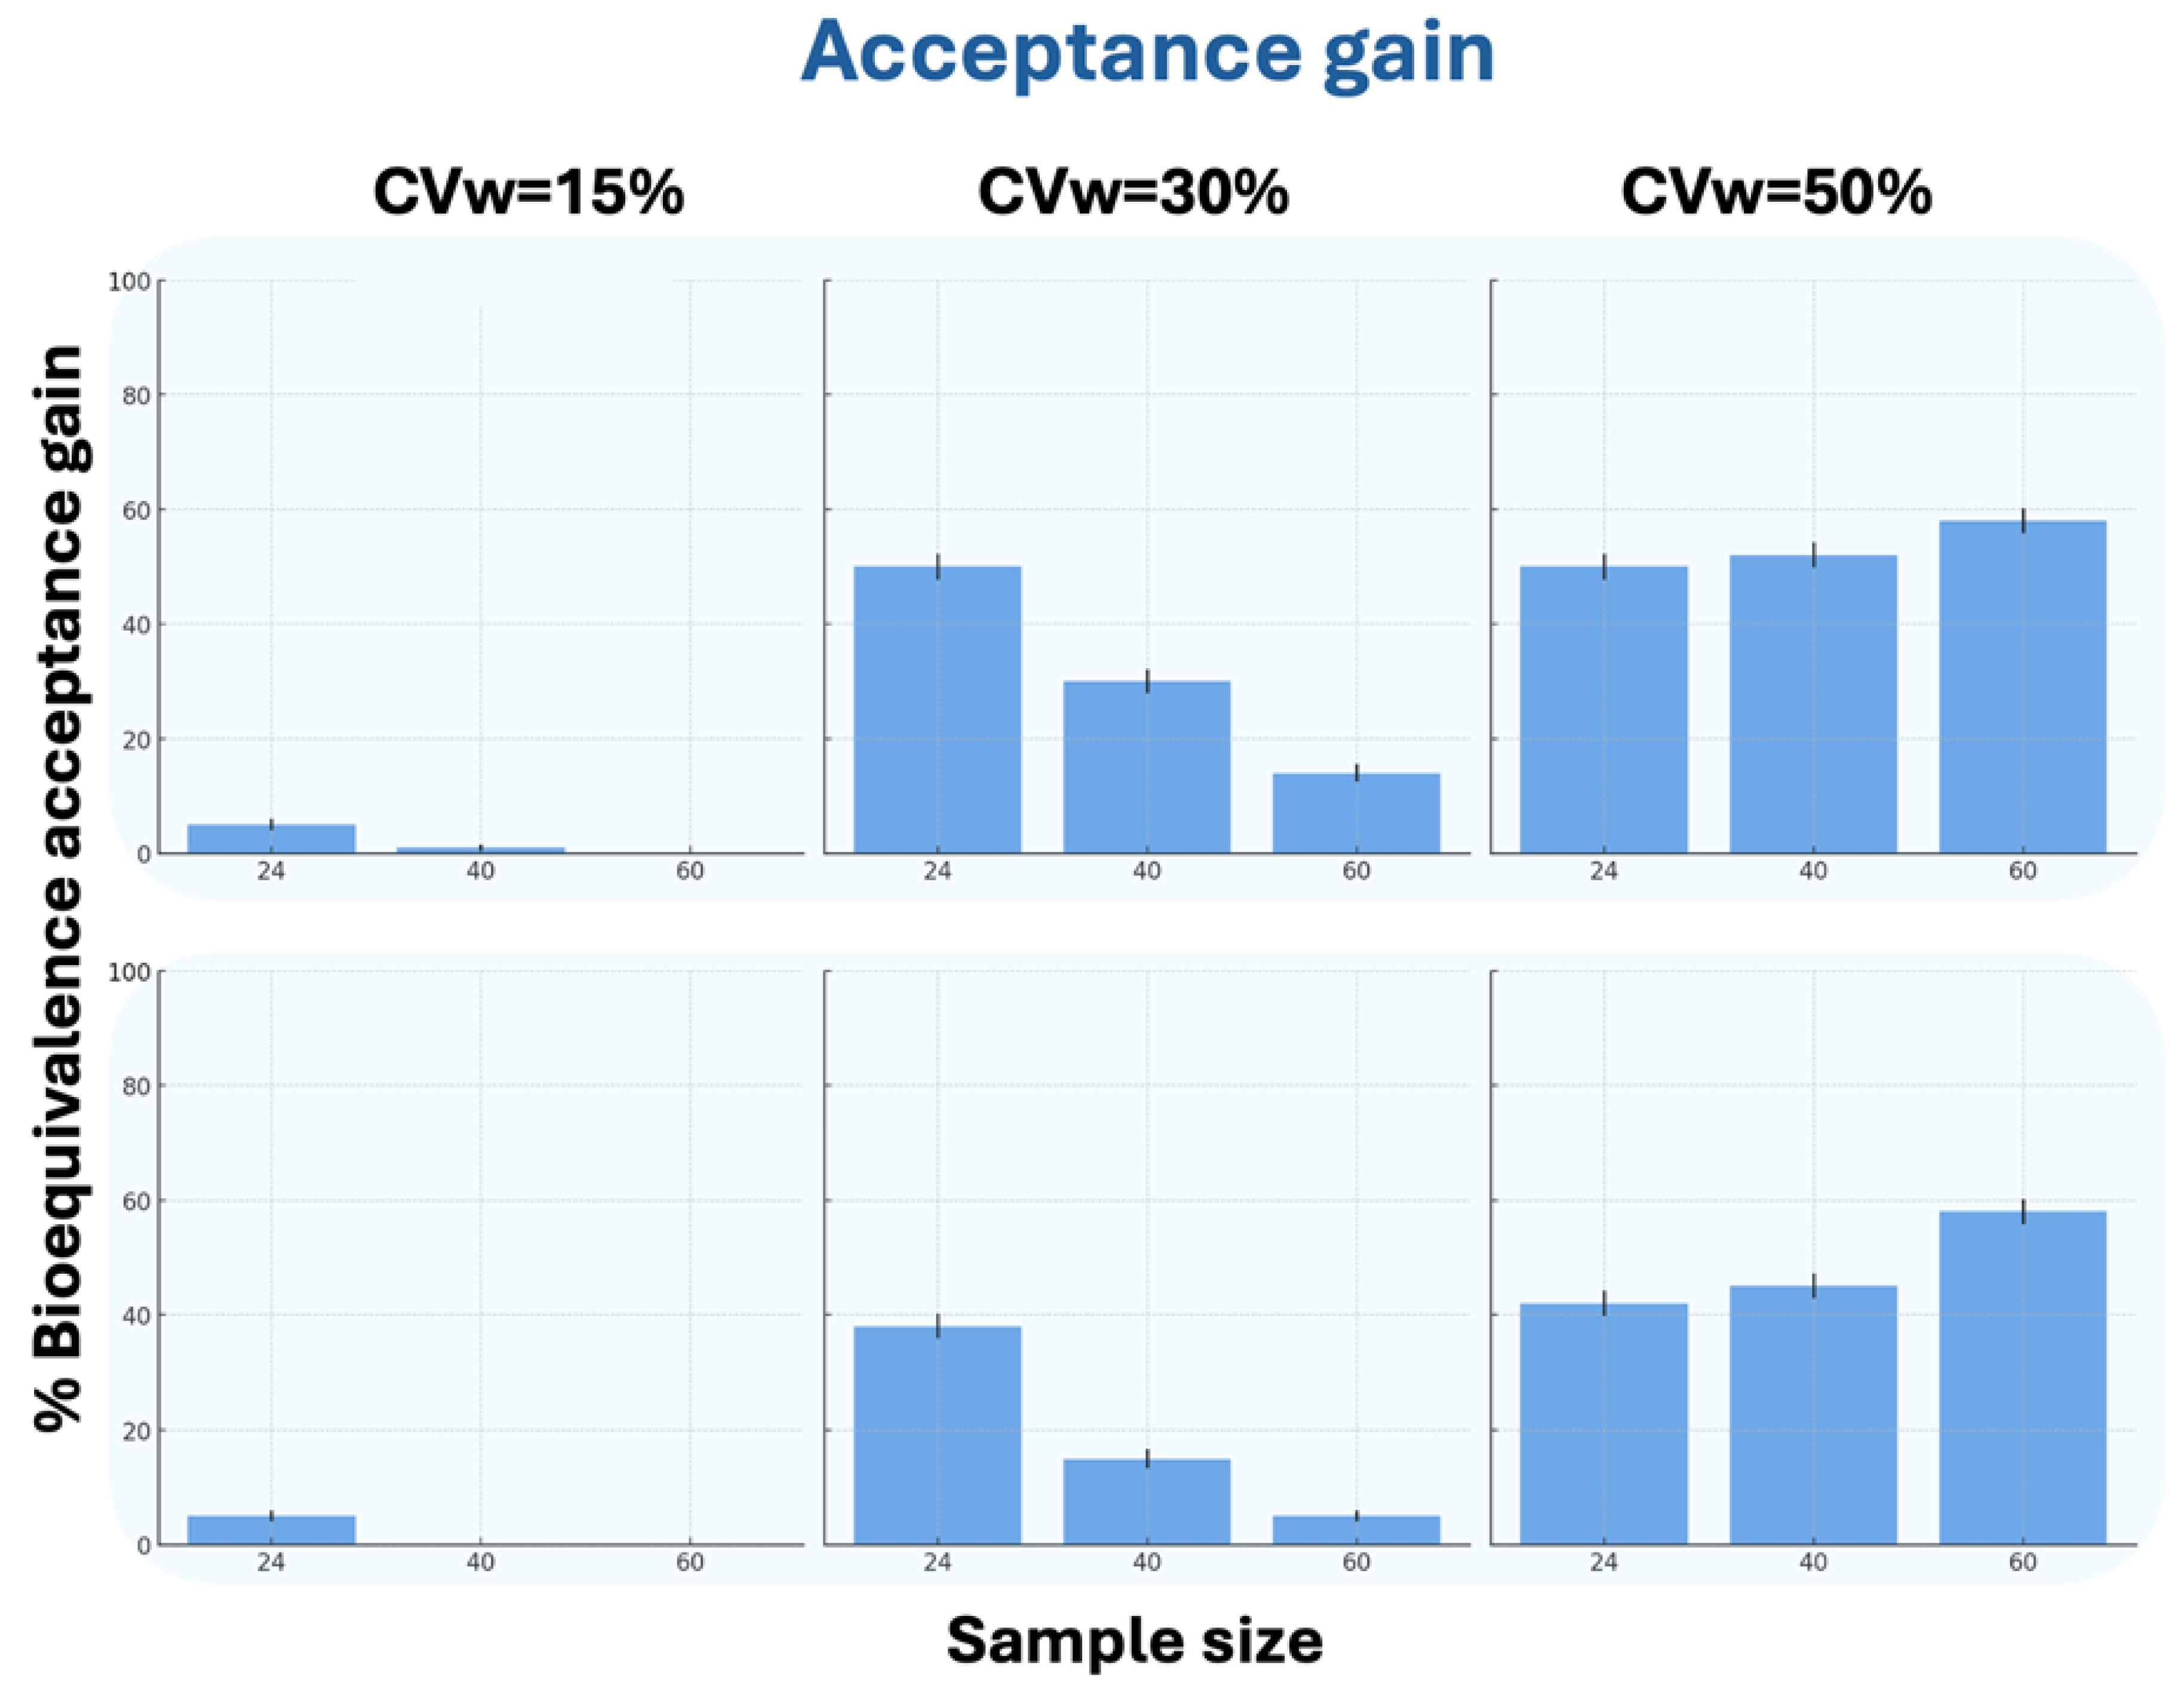
In terms of BE acceptance gain, in all scenarios except N = 60 at CVw = 15% (where generated data matched the original), the WGANs showed superior performance. For CVw = 30%, the generated data showed higher acceptance percentages with decreasing N values, while for CVw = 50%, the percentages increased with increasing N values. The results for N = 24 were notably similar between CVw = 30% and CVw = 50%. Interestingly, WGAN performance improved with increasing CVw, showing significantly better BE acceptance gain at 50% variability compared to 15%. Figure 5 demonstrates the WGANs’ effectiveness in terms of the BE acceptance gain between generated and original data.
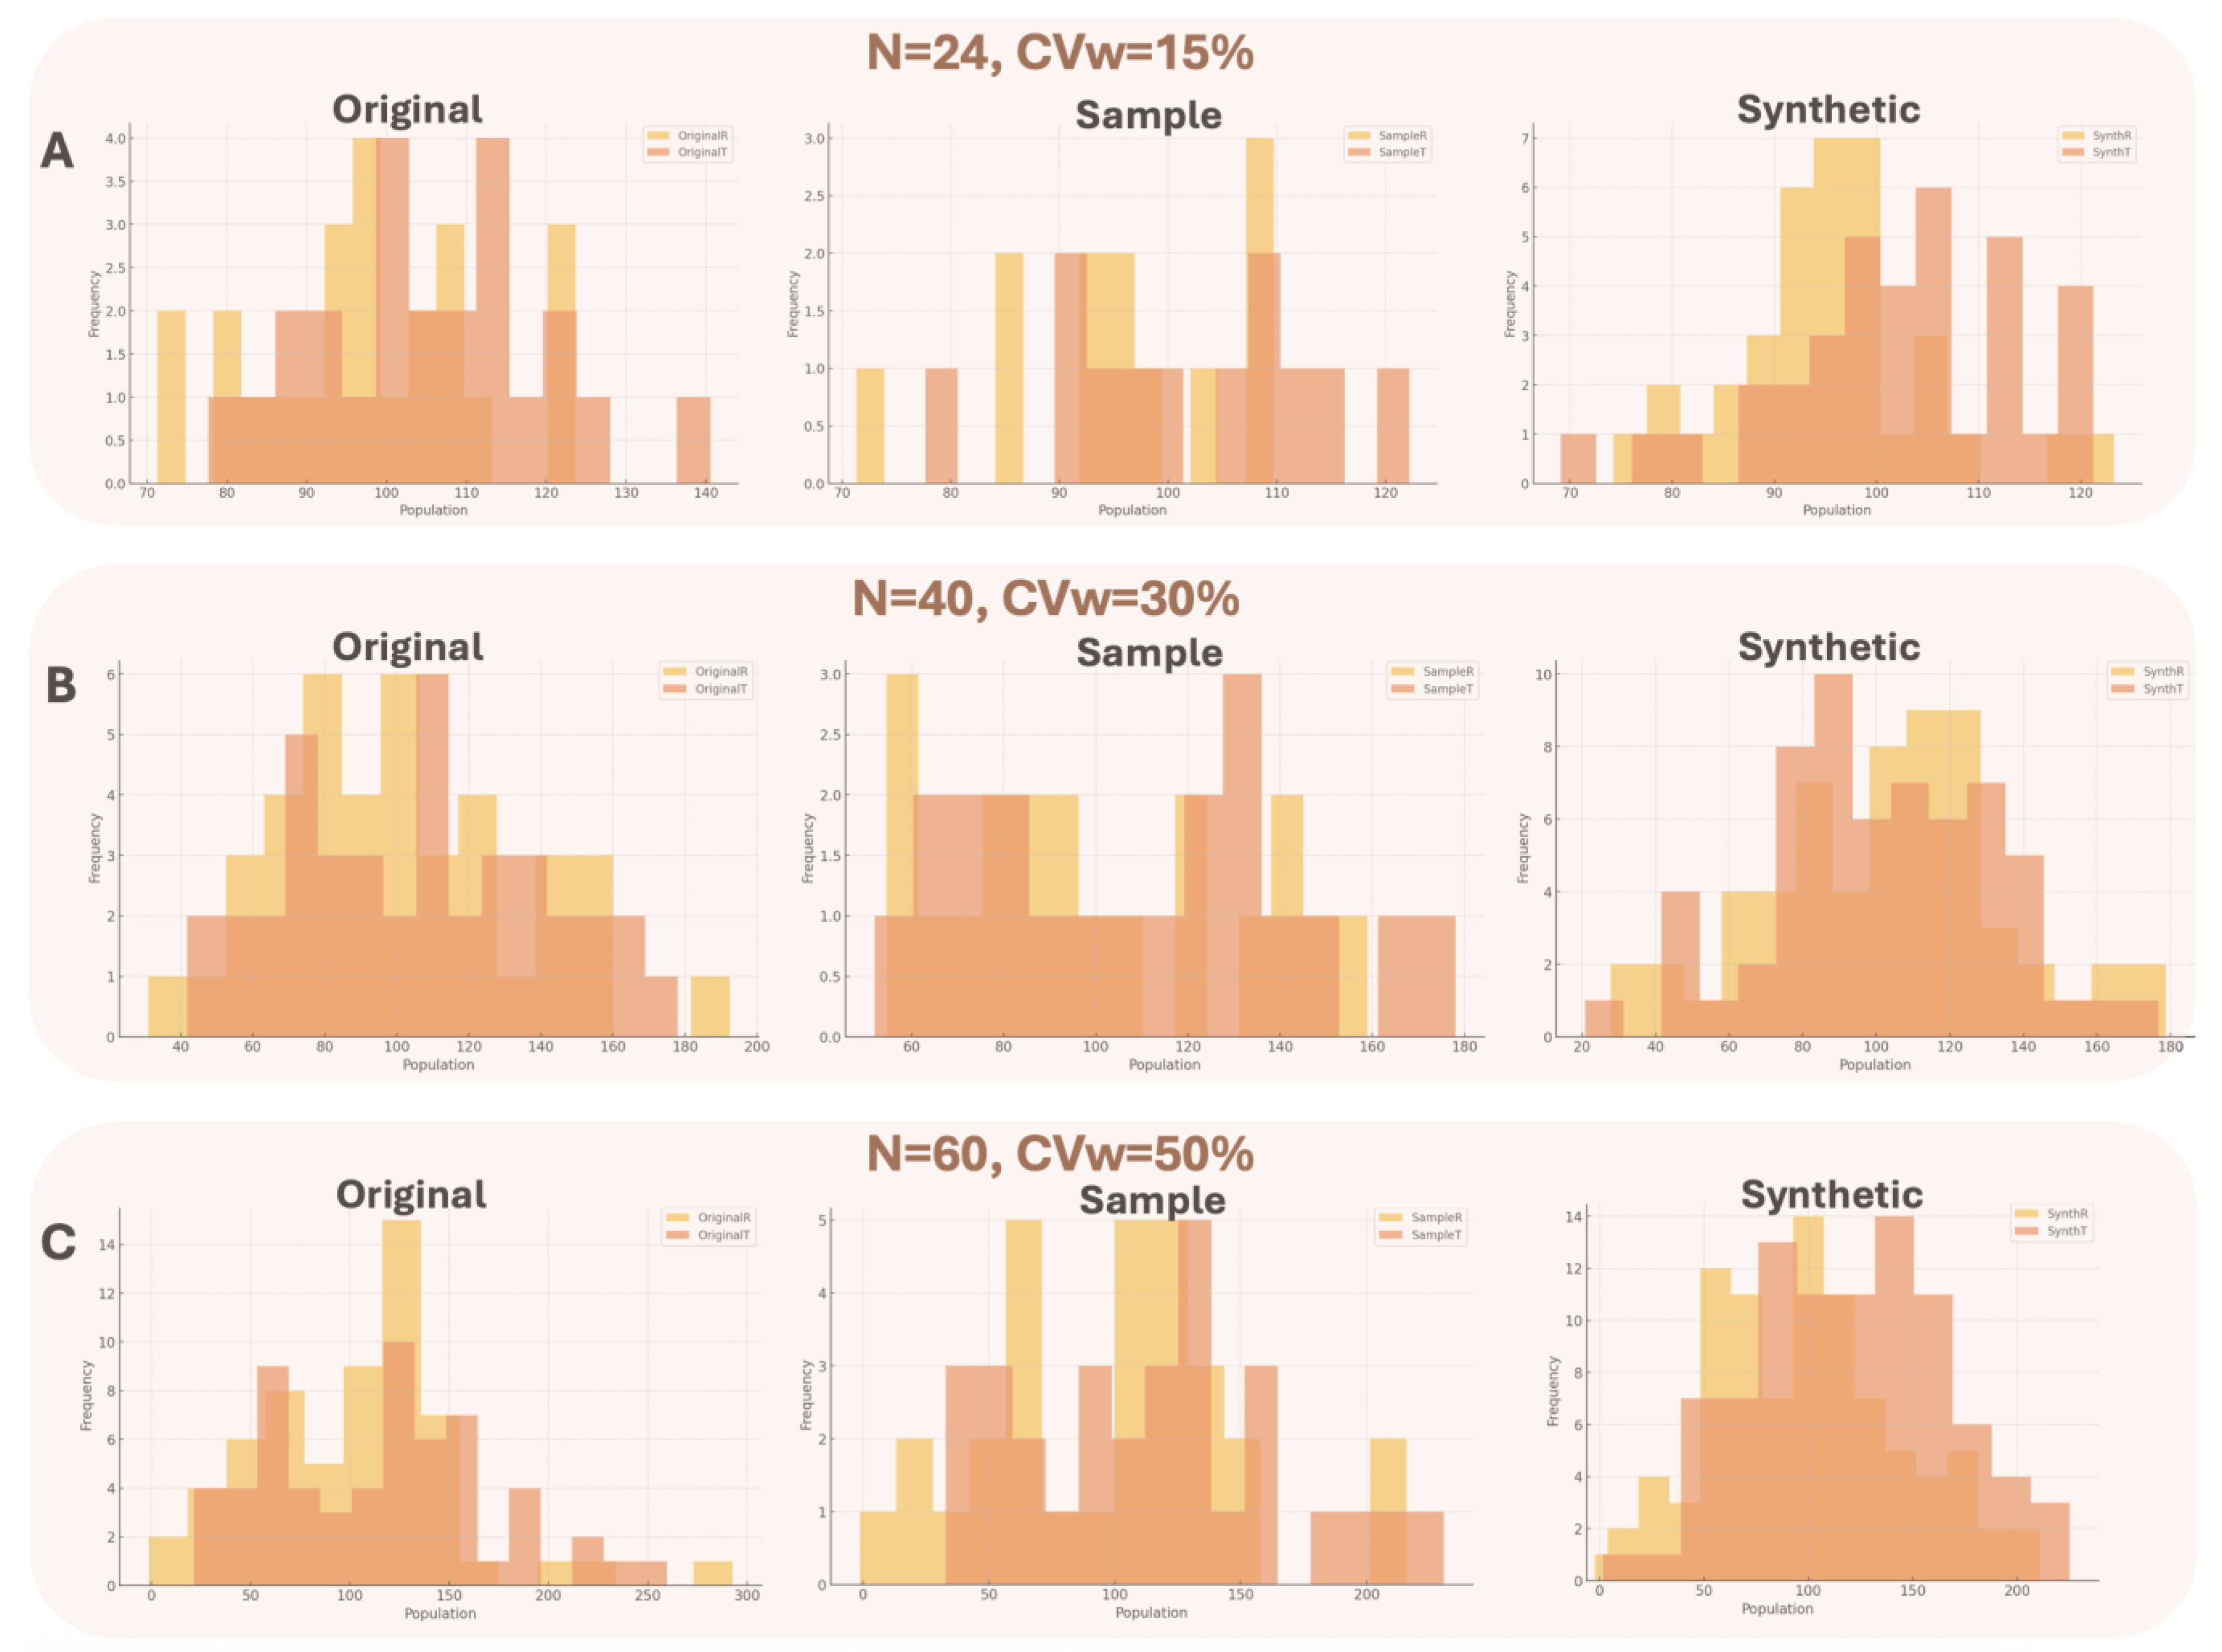
For all different executed scenarios, the generated distributions were better resembling the original, rather than the sample compared to the original distribution based on the statistical tests that were carried out. The tests were important to validate data distribution overlap and consisted of visual inspection (histograms for the original, sample and synthetic data) and calculation of Szymkiewicz–Simpson and Bhattacharyya distances for all datasets. To make all the estimations, three different original datasets were generated, referring to (1) N = 24, CVw = 15%, (2) N = 40, CVw = 30%, and (3) N = 60, CVw = 50%. The chosen values have been selected to be in line with the results of Figure 3, Figure 4 and Figure 5. Figure A5 provides a visual overview of the distributions of the original, sample, and synthetic data.
The Szymkiewicz–Simpson coefficient measures the overlap between two probability distributions and the closer the value to 1 then there is a better similarity. The Bhattacharyya distance measures the distance between two probability distributions and the closer the value to 0, then the more identical the distributions are. For the purpose of this analysis, “distribution overlap” refers to the comparison between the Test and Reference distributions, which differ by an average of 10%, across several scenarios.
The statistical criteria indicated that in all cases, the synthetic distribution maintained the same (or even superior) discriminatory power compared to the original data and significantly outperformed the sample data. Table A1 demonstrated the results of the different statistical tests. Overall, three distinct conditions were studied: low sample size/low variability (Panel A), medium sample size/moderately high variability (Panel B), and large sample size/high variability (Panel C). In Panel A, the statistical criteria demonstrated that the synthetic data had better discriminatory power than the original data (and much better than the sample data). In Panel B, where the distributions begin to spread out, the discriminatory power decreases across all datasets, though the synthetic data continue to deliver strong performance. Finally, in Panel C, where data are highly dispersed due to very high variability, the discriminatory power between the T and R distributions is, as expected, further reduced—but the synthetic data still exhibit the best performance.
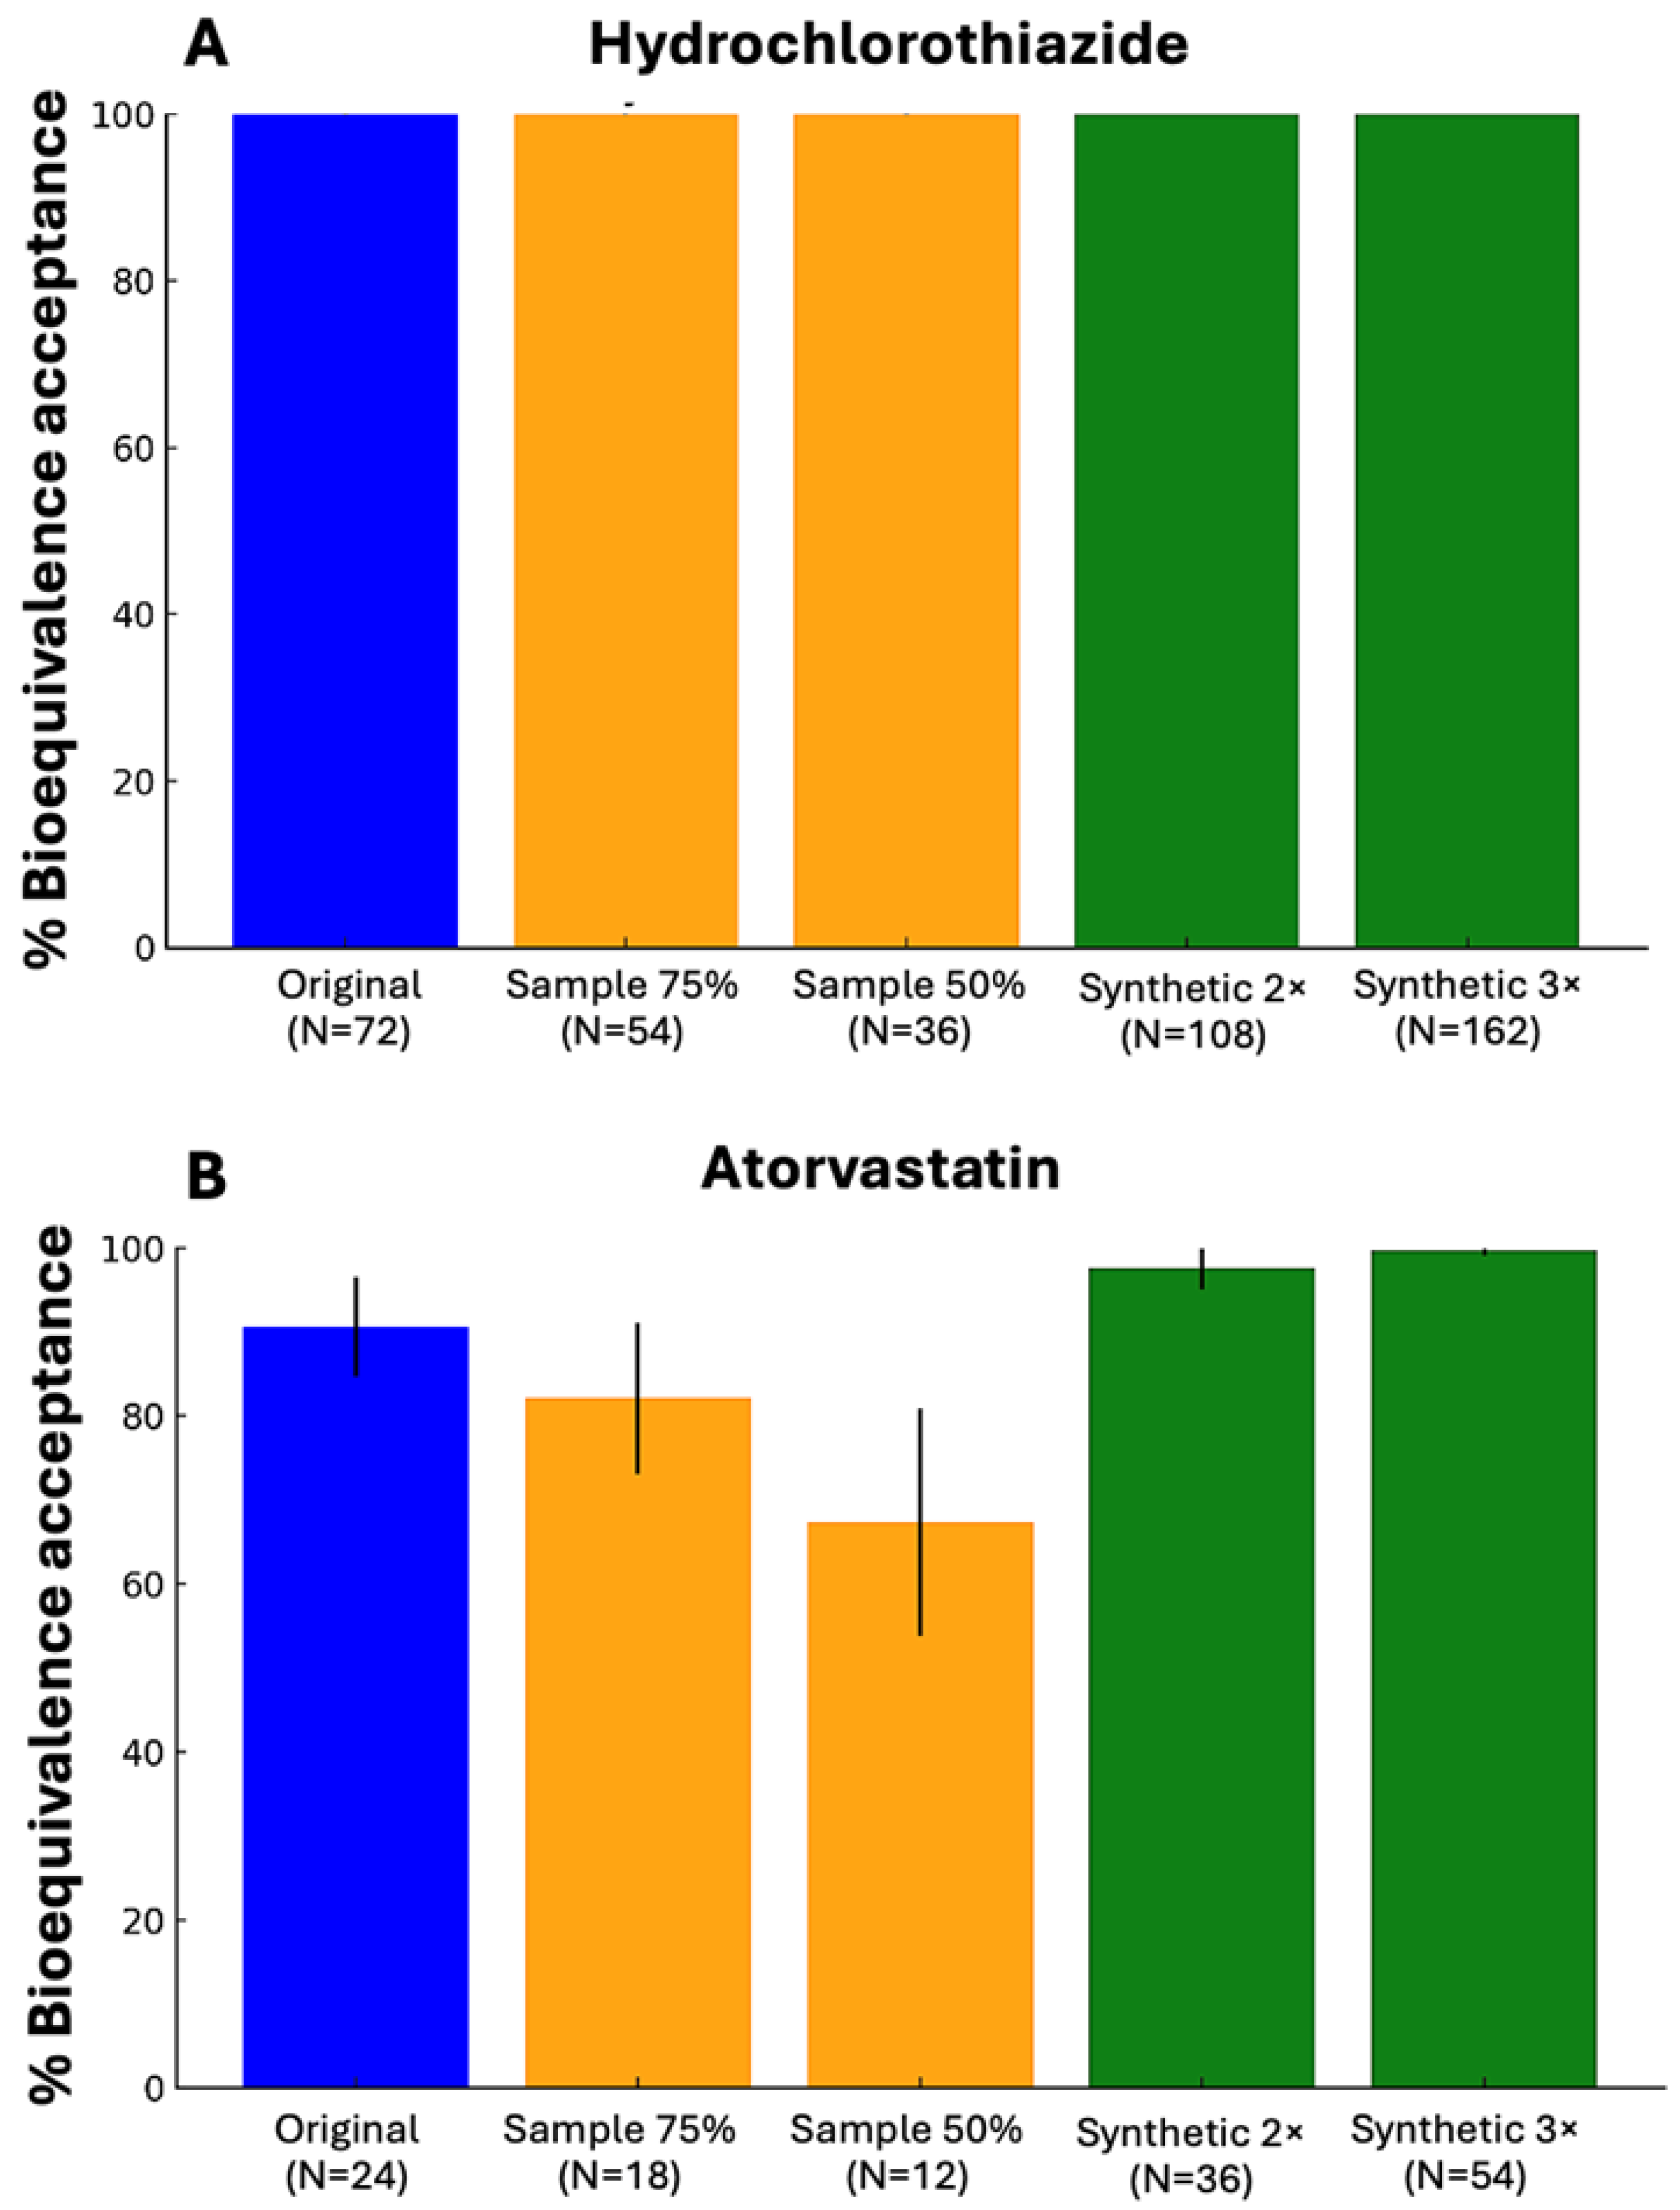
The implementation of WGANs in real BE data, showed that in both studied drugs, the generated data either provided the same results as the original dataset (hydrochlorothiazide) or outperformed the original dataset (atorvastatin). The study with hydrochlorothiazide performed on 72 subjects and the CVw for the Cmax value was 29.2% [27]. On the other hand, for the simvastatin study the number of subjects was 24 and had a CVw value of 16.76%, regarding the Cmax value [28]. The assessment was performed based on the percentage of BE acceptance, comparing the results of the original dataset, the 75% and 50% sample and the generation of 2×N and 3×N the original dataset. For atorvastatin, the sample had a smaller BE acceptance compared to both the original and the synthetic data. Figure 6 demonstrates the above-mentioned results of real world BE data for hydrochlorothiazide and atorvastatin by implementing WGANs.

4. Discussion

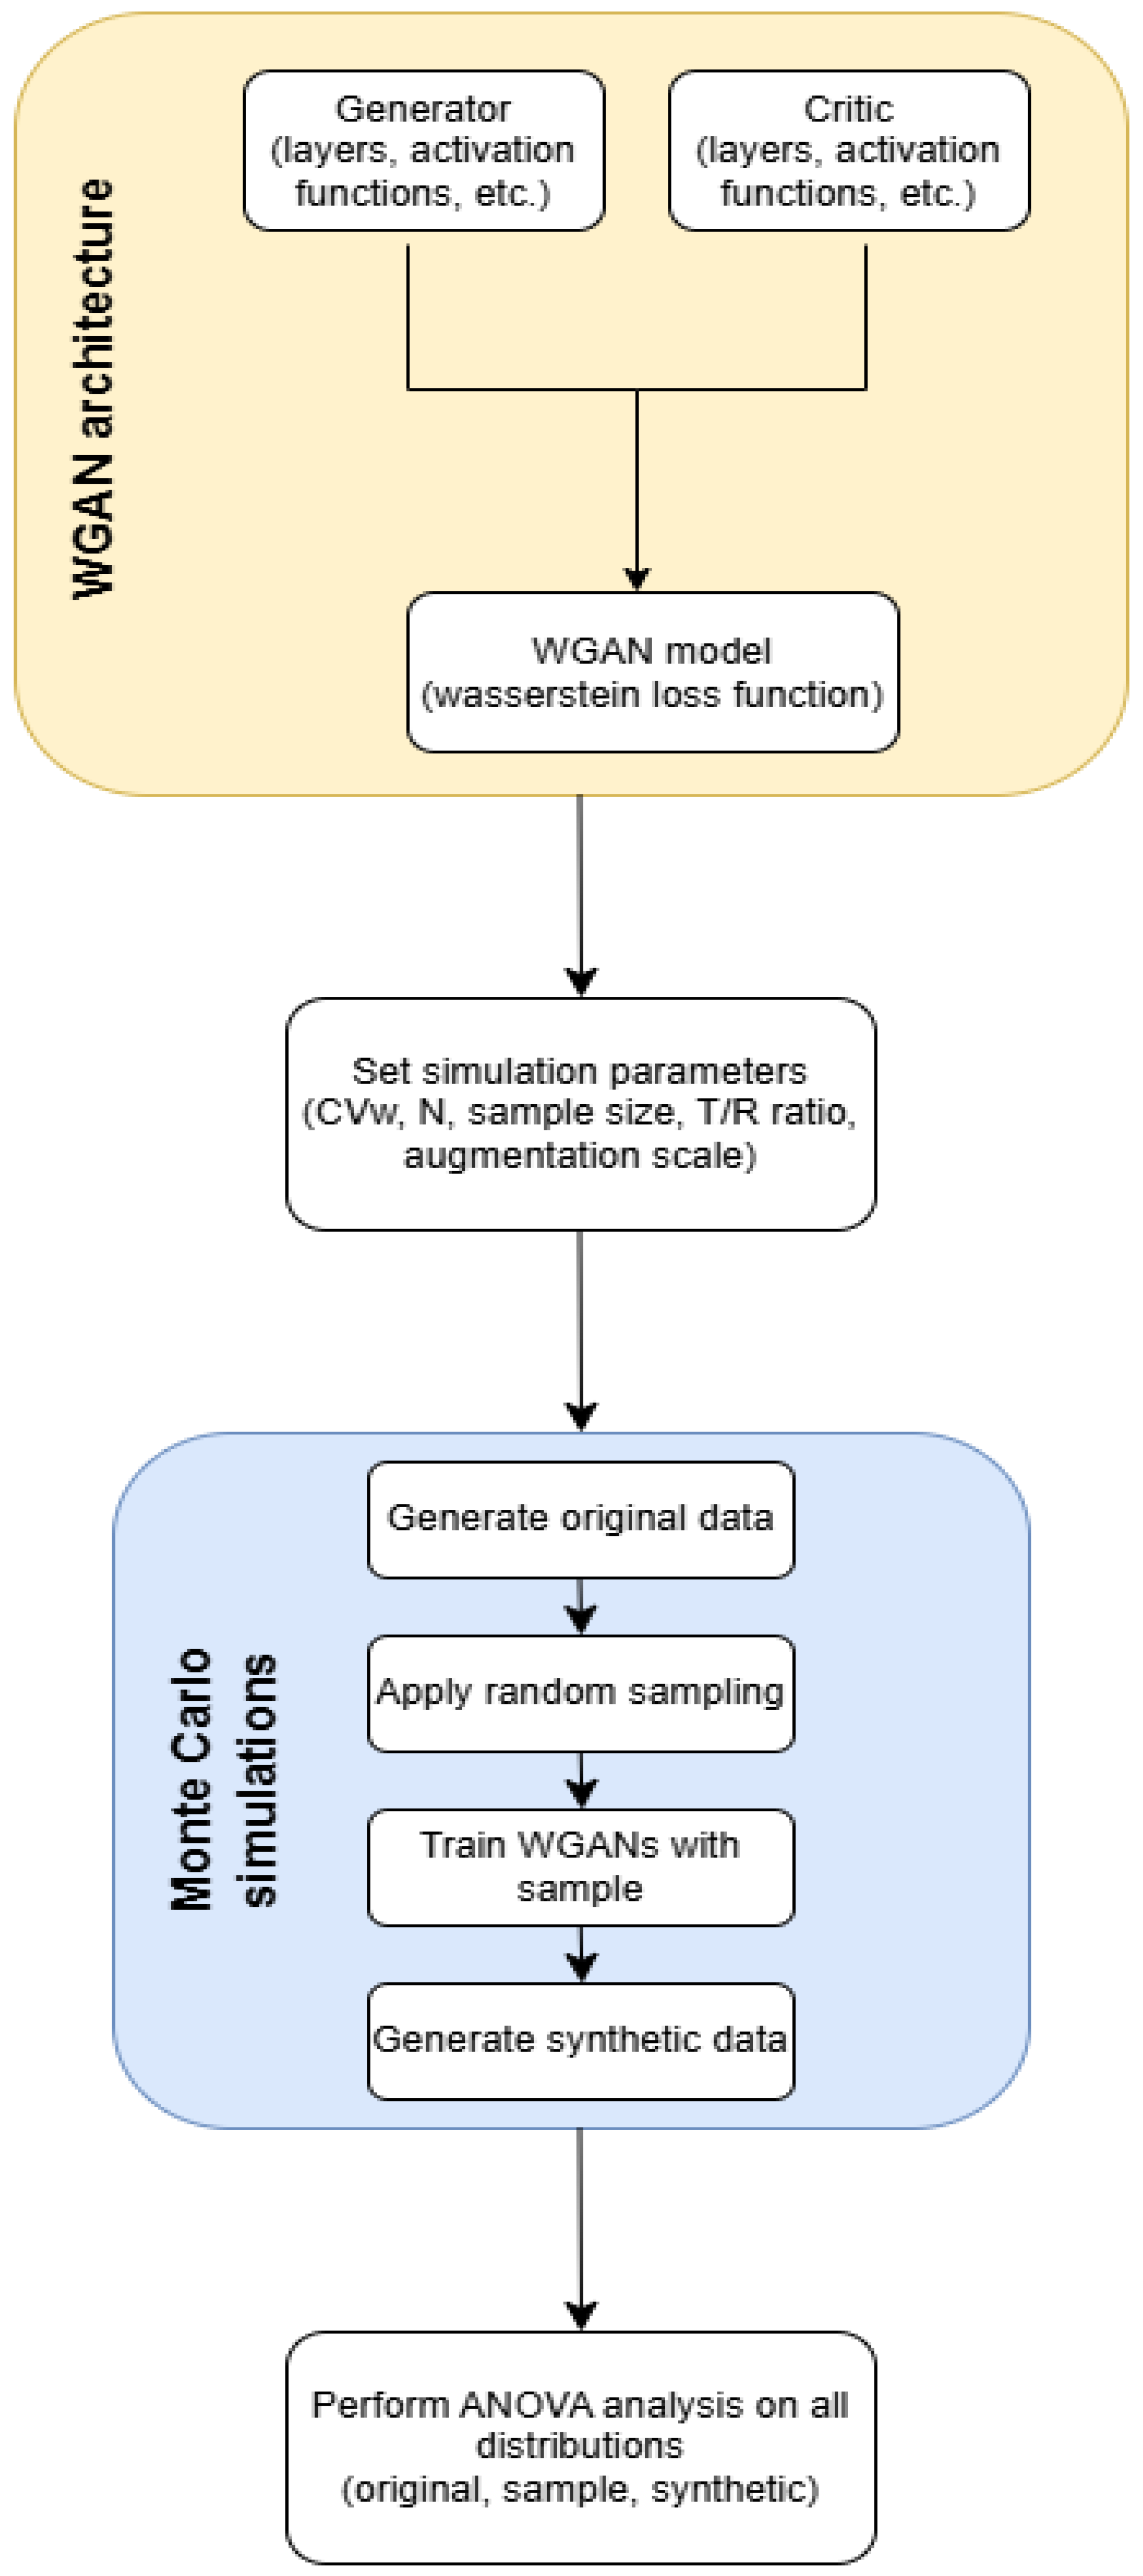
The purpose of this study was to investigate the potential of WGANs to solve the problem of high variability in BE studies. These restrictions result in higher costs, longer procedures, and logistical issues in finding enough participants, all of which are substantial hurdles to medication development and licensing processes. By using WGANs to virtually increase sample sizes, this work aims to give a novel method for reducing reliance on large populations. In this study, WGANs were used to generate data that simulated the HVDs in BE studies. The methodology involved applying the WGAN model on data that replicated BE research using Monte Carlo simulations. To model the BE setting, we constructed simulations of 2 × 2 crossover studies. The WGAN performance was evaluated by comparing the generated, sample, and original data for BE acceptance and similarity. To validate the process’s resilience and robustness, thousands of Monte Carlo simulations were executed.
In this study, we applied Monte Carlo simulations to systematically investigate a broad spectrum of experimental conditions. Specifically, we simulated 36 unique scenarios derived from a full factorial design encompassing three levels of sample size, three levels of data variability, two regulatory contexts, and two synthetic sample sizes (i.e., 3 × 3 × 2 × 2). This comprehensive simulation framework enabled a rigorous evaluation of the generative model performance and robustness across diverse conditions. Moreover, the use of simulated data was rather important in assessing the similarity between original, sampled, and synthetic data distributions, as described in Table 3 and Table 4. Simulated data provided the necessary control and transparency to perform robust comparisons and compute statistical similarity metrics, tasks that would be almost impossible using real-world datasets due to the lack of ground truth and inherent variability.
The study findings reveal that creating 3×N data using WGANs results in much higher BE acceptance percentages than both the original and sample distributions. For CVw values of 15% and 30%, the generated data consistently outperformed the original and sample distributions according to EMA and FDA criteria for both 2×N and 3×N. When CVw = 50%, the generated distributions showed higher BE acceptance for smaller sample sizes but lower acceptance for bigger sample sizes for 2×N generation. However, for 3×N data, the produced distributions consistently demonstrated higher BE acceptance across all scenarios. This was most noticeable at CVw = 50%, when the 3×N-generated data obtained BE acceptance percentages greater than 80%, compared to the sample’s maximum of 40%. The results showed that the WGANs approach is beneficial in situations with higher variabilities, underlining the possibility for adopting WGANs to increase the efficiency of BE studies.
It is crucial to note that WGANs perform better, the smaller the sample and the bigger the generation, as can be seen from our current research, where the 3×N results offered better results than the 2×N, but also from our previous one [22]. WGANs have significant advantages even over the scaled limits used by regulatory bodies in BE studies for HVDs. One of WGANs key features is their ability to generate data that nearly resembles the original distributions while dealing with variability. Traditional procedures, such as applying bootstrapping, rely on assumptions that may not adequately convey the complexities of real clinical data. WGANs, on the other hand, can model and create data that accurately represent the original data, including pharmacokinetic parameter fluctuations that are common in HVDs. This flexibility allows WGANs to generate more accurate estimates of BE, even when the observed data does not completely coincide with the regulatory standards. Furthermore, WGANs can improve statistical power by providing more data points to optimize the analysis without the requirement for bigger sample sizes. By creating realistic synthetic datasets, WGANs provide a more nuanced approach to assessing BE, potentially increasing the efficiency of BE studies and providing better tools for regulatory decision-making, particularly in cases where data variability would otherwise prevent clear conclusions from being drawn using traditional methods.
The WGAN-generated data were evaluated for BE acceptance percentages under EMA and FDA guidelines for highly variable drugs. It is important to emphasize that the performance of WGANs was compared against the scaled approaches of EMA and FDA. These regulatory approaches permit wider acceptance limits than the traditional 80–125% range, allowing handling the high variability of certain drugs. In contrast, the WGAN-approach was strictly assessed using the classic 80–125% limits, without the benefit of scaling. Additionally, the evaluation included scenarios of high variabilities (i.e., CVw = 50%), further intensifying the stringency of the assessment. The statistical evaluation metrics and the visual inspection showed favorable results considering overfitting/underfitting problems for the synthetic distributions that resembled the original, better than the sample. Despite these challenging scenarios, the WGAN approach demonstrated favorable performance, highlighting its potential as a robust method for addressing challenges in BE studies. To conclude, our study demonstrated the potential of implementing WGANs in real BE data, where the results from the two scenarios that were examined showed promising results. However, more thorough analysis must be conducted to evaluate a variety of different real case scenarios.
Furthermore, in our research, the type of input data can mirror variables from BE studies, and the technique of obtaining them is identical. These values may be pharmacokinetic, such as Cmax or AUC. WGANs generate the type of data in the input by producing data points that are similar to the original while yet being uniquely different. Another advantage of using WGANs relies on the fact that the BE study can be performed not only with a reduced sample size, but also with the typical 2 × 2 crossover design. In other words, there is no need to use replicate or semi-replicate designs, which are more complex, time-consuming, expensive, and prone to high dropout rates. Once the WGAN approach is validated in practice and a regulatory framework is established, it can provide all these advantages.
AI-based solutions have the potential to drastically lower healthcare expenditures in many aspects of the industry. AI enables more personalized healthcare interventions based on an individual’s disease profile, diagnostic information, or treatment responses, thereby improving treatment outcome prediction, developing new drug designs, and improving patient care [29]. Furthermore, AI can help minimize variability in care, increase precision, speed discovery, and address inequities, all while empowering patients and healthcare professionals through advanced medical research and analytic technologies [30]. The impact of AI on healthcare is already visible, such as a 30% reduction in emergency room wait times, a 70% reduction in transfer delays from operating rooms, and faster ambulance dispatch times, demonstrating how AI is revolutionizing care delivery, diagnosis, treatment, and patient lifestyle [31]. Furthermore, AI has sped drug discovery procedures and automated target identification for pharmaceutical companies, while also allowing AI-assisted clinical trials to manage massive datasets with high accuracy. Medical AI systems help patients by evaluating medical data and providing insights that improve their quality of life [32].
However, it is critical to understand the ethical and legal frameworks that govern the risks and advantages of AI technologies. Key considerations include data privacy, algorithmic bias, and transparency, as well as ensuring that AI research is in line with society objectives [33,34]. The problems posed by generative AI, such as data security breaches, bias, and misinformation, necessitate stringent regulation [31]. Furthermore, interdisciplinary collaboration and dynamic regulatory mechanisms are critical for navigating the ethical problems of generative AI while balancing innovation and safety [35,36,37].
While the study demonstrates the efficacy of WGANs in terms of HVDs in BE experiments, several limitations must be addressed. The methodology is heavily dependent on Monte Carlo simulations to mimic BE study conditions. While this approach provides controlled scenarios, it lacks the complexity and variability inherent in real-world clinical data. In other words, the proposed approach has not been validated with real-world datasets, which would be crucial to confirm the applicability of WGANs in actual BE study settings. Controlling bias when training WGANs on small samples can be risky. However, our methodology relies on steps that help mitigate this risk. First, the scenarios that were chosen to be executed provides a ground truth to compare the generated data against by visually inspecting them and ensure that no same values were in the original and the generated distributions. Also, WGANs offer greater stability than GANs because of the introduction of Wasserstein loss function, which helps reduce mode collapse and the consistent generation of the same data. Finally, the choice of small augmentation scales was intended to avoid over-reliance on limited information and minimizing overfitting to noise. Although the results align with FDA and EMA guidelines, the practical acceptance of WGAN-generated data in actual regulatory settings remains uncertain. It should be underlined that the use of generative AI, such as WGANs, may introduce challenges related to algorithmic bias, and regulatory acceptance. Future studies could overcome these constraints by using real-word datasets and evaluating once again the WGAN performance. Furthermore, optimization strategies could be developed to lower computing demands while retaining data quality. Finally, one of the challenges with generative algorithms is that they often work like a “black box”. In other words, it is hard to understand how they make decisions or reach conclusions. But once regulatory authorities create clear rules and guidelines for their use, what seems like a drawback could actually become a strength. These algorithms could then be seen as fair and unbiased tools, operating consistently without being influenced by human interference. This could build trust and make them even more valuable in the long run.
It should be noted that the WGAN technique does not result in uniform BE acceptance in all circumstances. Our results show that the model performance changes depending on the level of variability and sample size. In cases with smaller augmentation scales or higher variability, the generated data did not match the BE approval criteria, which was consistent with the original data results. While this study focused on analyzing BE acceptance percentages and similarity metrics, as well as showcase the incompetence of the sample compared to the original distribution in various scenarios, future work will include a thorough examination of potential false positive cases in which BE is not attained in the original dataset but is accepted in the WGAN-generated data. However, this will aid in determining the method’s specificity and further confirm its robustness under regulatory criteria.
WGANs have several advantages that make them suitable for clinical simulation. First and foremost, they provide more consistent training and convergence than GANs, allowing them to avoid concerns such as mode collapse. Additionally, the Wasserstein distance might better indicate learning progress and data quality. They offer greater flexibility in capturing complex distributions, such as those observed in the pharmacokinetics of highly variable medicines. However, their usage in clinical simulations is not without difficulties, as interpretability remains limited, particularly in understanding how the model arrives at specific outcomes. Regulatory approval is currently low, as synthetic data must undergo rigorous validation. Bias control and transparency remain active areas of research. As a result, while WGANs are technically great for modeling, their clinical applicability is dependent on thorough validation, real-world testing, and clear regulatory frameworks, all of which we are presently investigating in follow-up work using real BE datasets.
Various machine learning and generative AI algorithms have been explored or proposed for synthetic data generation in the context of BE studies, each bringing its own set of advantages and inherent limitations. Variational Autoencoders (VAEs) [38], while effective in learning compact latent representations of complex data, often produce overly smoothed outputs due to their probabilistic nature. This smoothing effect limits their ability to accurately simulate the sharp fluctuations and variability typically observed in highly variable drugs, a critical requirement in BE analyses. Traditional GANs [23], although powerful in certain domains, are prone to issues such as training instability and mode collapse, particularly when applied to small or noisy clinical datasets where sample sizes are constrained. Conditional GANs (cGANs) attempt to address some of these challenges by incorporating auxiliary information to guide generation. However, cGANs generally require large, well-annotated datasets to achieve stable training dynamics and maintain generation quality [39], conditions that are often difficult to meet in BE studies. Other conventional synthetic data generation techniques, such as the Synthetic Minority Over-sampling Technique (SMOTE), focus primarily on balancing datasets by generating new synthetic samples but tend to produce limited diversity and struggle with datasets containing a mixture of continuous and categorical variables [39]—a common characteristic of clinical pharmacokinetic data. Recently, diffusion models have emerged as highly effective generators, particularly in the image domain, demonstrating remarkable capabilities in producing high-fidelity synthetic images. Nonetheless, their application to clinical or tabular datasets remains nascent, and their computational demands are considerable [40], posing practical challenges for their widespread adoption in resource-constrained regulatory environments. In contrast, WGANs present a compelling alternative by offering more stable and consistent training, greater resilience against mode collapse, and superior distributional fidelity. WGANs are particularly adept at capturing complex variability, a critical feature for accurately replicating pharmacokinetic profiles and ensuring regulatory acceptability in BE simulations. These comparative advantages, especially the balance between training robustness and synthetic realism under regulatory constraints, motivated our selection of WGANs as the foundational model for this study.
The study by Papadopoulos et al. [38] of our research group was the first study to introduce the idea of using synthetic data in clinical trials, in particular data that are generated from VAEs. That study proposed the use of synthetic data in BE investigations of HVDs, with the goal of essentially increasing sample sizes and improving statistical power while maintaining the conventional BE acceptance limits (80–125%). In contrast, we use WGANs, which are known for their steady training dynamics and ability to predict complex data distributions. While VAEs encode and decode data in a latent space and may produce blurrier outputs due to their probabilistic nature, WGANs use a generator-critic architecture that produces sharper and more realistic synthetic data, better reflecting the variability in pharmacokinetic parameters inherent in HVDs. Furthermore, our method focuses on modeling and conserving variability rather than simply minimizing it through sample enlargement. Importantly, we address regulatory acceptability more explicitly by suggesting validation paths and integrating our strategy with existing EMA and FDA standards, laying the groundwork for future real-world integration. Thus, while both studies aim to improve BE evaluation using generative AI, they differ greatly in technique, output quality, and regulatory direction. It should be mentioned that analyzing the behavior of the latent space, particularly under high-variability scenarios, can provide valuable insights into how WGANs learn and represent the underlying data distribution. However, the primary focus of the present study was to evaluate the quality of the generated data. We intend to investigate the latent space structure in future work, with the aim of gaining a deeper understanding of model robustness and data diversity.
As the use of synthetic data will expand in healthcare and pharmaceutical research, there is a pressing need for a specific regulatory framework to ensure its appropriate and reliable application. To address this need in the case of BE of HVDs, we are currently developing a framework to support the acceptance of synthetic data in clinical and scientific evaluations. This effort is grounded in a thorough analysis of BE outcomes across a wide range of scenarios, based solely on real-world data. By systematically evaluating BE acceptance under diverse and extensive conditions, we aim to establish clear, evidence-based criteria that can inform regulatory bodies on when and how synthetic data may be accepted. This work is a crucial step toward building trust and promoting the responsible integration of synthetic data into regulatory decision-making.
Overall, it should be stated that this work sets the groundwork for introducing WGANs as a new approach to tackling BE studies for highly variable drugs. The research highlights how WGANs can help address challenges like reducing input samples while maintaining solid, reliable output results, essential for studying drugs with high variability. It should be underlined that this study aimed to present a generalized framework for the application of WGANs in the evaluation of BE for HVDs. For this reason, all simulations were deliberately designed to be broad and not tailored to specific drug characteristics. Consequently, the findings are not confined to any single drug type and are applicable across a wide range of drug classes. The proposed methodology is inherently replicable and can be used irrespective of the therapeutic category.
In this study, our aim was to develop a robust framework for generating realistic synthetic datasets (referred to as “virtual patients”) that can preserve the inherent variability of pharmacokinetic parameters critical for BE assessments. By creating synthetic data that captures the complexity of real clinical datasets, we seek to potentially reduce the need for large sample sizes and intricate replicate study designs, which are often necessary to manage high inter-individual variability. To achieve this, we exploited the capabilities of WGANs, which are particularly well-suited for modeling complex, high-variability distributions with enhanced training stability. Through this approach, the aim was to improve the efficiency and statistical power of BE studies, minimize the risk of false negative outcomes, especially for highly variable drugs.
While this study highlights the potential of WGANs for generating virtual populations in BE studies involving HVDs, several limitations must be acknowledged. The methodology relies mainly on Monte Carlo simulations, rather than real-world datasets, limiting its direct applicability. The specific use of WGANs, favored for their stability via the Wasserstein loss function, helped reduce risks like mode collapse and overfitting, especially through small augmentation scales and validation against ground truths. However, the absence of extensive real clinical data validation remains a gap. Future research should focus on applying WGANs to real-world BE datasets to verify performance under realistic conditions. Additionally, strategies to optimize computational efficiency without compromising data quality are needed. As WGANs and other generative models often operate as “black boxes”, establishing regulatory frameworks will be crucial. Clear guidelines could transform perceived opacity into a strength, framing these models as consistent and unbiased tools for clinical research.
To truly unlock the potential of WGANs, more studies using real-world clinical data are needed. Testing this method in real-life scenarios would allow researchers to refine it and make it more reliable across diverse situations. On top of that, it is crucial to establish clear criteria and conditions before WGANs can become part of regulatory practice. These criteria would ensure the method meets the strict scientific and compliance standards set by regulatory authorities like the EMA and FDA.
Overall, in this study, we address a key challenge in BE assessments for highly variable drugs: the reduced statistical power resulting from high intra-subject variability, which often leads to an increased false negative rate. Traditionally, this issue is moderated by increasing the sample size of the BE study, which enhances statistical power. However, recruiting additional participants is often costly, time-consuming, and raises ethical considerations. To overcome these limitations, our study follows the same principle of increasing sample size, but in a virtual setting. We use a Wasserstein Generative Adversarial Network to generate AI-synthesized virtual volunteers that mimic the statistical characteristics of real participants. By augmenting the dataset with these synthetic samples, we aim to strengthen the reliability of BE outcomes while reducing the practical and ethical constraints of conventional clinical trial expansion.
The ultimate aim of this study was to demonstrate how the integration of data augmentation techniques (in particular with the use of generative AI algorithms) could significantly transform clinical research by achieving substantial cost savings, accelerating study timelines, and minimizing human exposure. It is proposed in this study that this can be achieved by partially replacing real volunteers with “virtual subjects”, thereby sharply reducing the number of participants needed in certain phases of clinical trials. Our results showed that WGANs were able to generate virtual populations with BE acceptance rates and similarity levels that matched or even surpassed those of the original population. This approach proved highly effective across a range of scenarios, enabling marked expansions in BE study sample sizes, while simultaneously lowering operational costs, reducing logistical burdens, and speeding up trial completion. By requiring fewer human participants, this strategy also promoted more ethical research practices by limiting unnecessary human exposure. Although the application of AI in clinical research held tremendous promise for revolutionizing healthcare, realizing these benefits would require a cautious path forward. Rigorous scientific evaluation, continuous validation, and the development of strong regulatory frameworks are essential to ensure the safe, ethical, and sustainable integration of AI-driven methodologies into clinical research.

5. Conclusions

This study introduced the application of artificial intelligence generative algorithms, specifically the Wasserstein Generative Adversarial Networks, in the BE assessment of highly variable drugs. To demonstrate the benefits of using WGANs to reduce the required sample size, Monte Carlo simulations of BE studies were conducted, and various scenarios were tested across a range of within-subject variability values, sample sizes, and data augmentation scales (2× and 3× the original sample size). The WGAN method was compared against the scaled EMA and FDA approaches for highly variable drugs. In all cases, the WGAN approach showed a favorable performance. It should be mentioned that even though no scaling was incorporated in the WGAN method (the classic 80–125% limits have always been used), its performance was at least equal or even better than the scaled EMA/FDA approaches. When WGAN synthetization was used to augment the original sample size by 3×, the performance further improved, highlighting its effectiveness in minimizing sample size requirements. We give significant proof of the method robustness by demonstrating that WGANs can reliably recreate and even increase BE acceptance under these extreme conditions, by simultaneously preserving specificity. Studying a less variable medicine would not have put as much strain on the algorithm or regulatory frameworks, nor would it have demonstrated its ability to minimize sample numbers, eliminate complex replication designs, and speed approval processes for the most difficult BE scenarios. Apart from reducing the required sample size in BE studies of highly variable drugs, the WGAN approach also eliminates the need for replicate or semi-replicate designs, which are complex, costly, time-consuming, and prone to high dropout rates. Once validated and supported by a regulatory framework, it can efficiently deliver these benefits. Even though this study is only the first step towards using WGANs in the BE assessment of highly variable drugs, it clearly shows that once specific criteria are set by regulatory authorities, a new avenue will open for the future of BE assessment.

Author Contributions

Conceptualization, V.D.K.; methodology, V.D.K.; software, A.N.; validation, A.N.; formal analysis, A.N.; investigation, A.N.; resources, V.D.K.; data curation, A.N.; writing—original draft preparation, A.N.; writing—review and editing, V.D.K.; visualization, A.N. and V.D.K.; supervision, V.D.K.; project administration, V.D.K. All authors have read and agreed to the published version of the manuscript.

Funding

This research received no external funding.

Data Availability Statement

The study used simulated data.

Conflicts of Interest

The authors declare no conflicts of interest.

Appendix A

Figure A1. Architecture of GANs. The generator takes input to create a synthetic image, while the critic evaluates both the generated and real images to classify them as “real” or “fake”. This iterative process enhances the generator’s ability to produce realistic images.
Algorithms 18 00266 g0a1
Figure A2. Algorithm flowchart of part of the code created for the implementation of WGANs in BE studies for HVDs. (A) represents the function created for the original BE distributions, (B) is used for the random sampling, and (C) is the function used for implementing WGANs in BE studies.
Algorithms 18 00266 g0a2
Figure A3. Percent BE acceptance for the original dataset, a sample, and the WGAN-generated dataset was evaluated at three variability levels: 15% (A), 30% (B), and 50% (C), under the EMA regulations. The sample sizes of the original datasets were 24, 40, and 60, while the corresponding sample sizes of the WGAN-synthesized data were twice as large as those of the original. The error bars represent the standard error calculated from 1000 Monte Carlo trials performed under each condition.
Algorithms 18 00266 g0a3
Figure A4. Percent BE acceptance for the original dataset, a sample, and the WGAN-generated dataset was evaluated at three variability levels: 15% (A), 30% (B), and 50% (C), under the FDA regulations. The sample sizes of the original datasets were 24, 40, and 60, while the corresponding sample sizes of the WGAN-synthesized data were twice as large as those of the original. The error bars represent the standard error calculated from 1000 Monte Carlo trials performed under each condition.
Algorithms 18 00266 g0a4
Figure A5. Visual comparison of distributions (Test vs. Reference formulation) between “original”, “sample”, and “synthetic” datasets across varying sample sizes (N) and intra-subject variabilities (CVw). The average difference between the Test and Reference distributions in the original data was 10%. Panels (AC) correspond to different configurations: (A) N = 24, CVw = 15%, (B) N = 40, CVw = 30%, and (C) N = 60, CVw = 50%. Each panel displays histograms of the T and R populations within the “original” dataset (left), a 50% random “sample” of the original (middle), and a “synthetic” dataset generated to be three times the size of the sample (right).
Algorithms 18 00266 g0a5
Table A1. Comparison of statistical similarity metrics between the Test and Reference distributions of the original, sample, and synthetic datasets. Several sample size (N) levels and intra-subject variability (CVw) were used for the “original” dataset. The “sample” represents a 50% random subset of the “original” dataset, while the “synthetic” data were generated to be three times the size of the “sample”. The average difference between the Test and Reference distributions in the original data was 10%.
DatasetStatistical Criterion
Szymkiewicz–SimpsonBhattacharyya Distance
N = 24%, CVw = 15%
Original0.3830.817
Sample0.5020.719
Synthetic0.3210.978
N = 40%, CVw = 30%
Original0.5750.349
Sample0.6590.332
Synthetic0.5180.461
N = 60%, CVw = 50%
Original0.6830.196
Sample0.7020.177
Synthetic0.6220.203

References

  1. Midha, K.K.; McKay, G. Bioequivalence; Its History, Practice, and Future. AAPS J. 2009, 11, 664–670. [Google Scholar] [CrossRef] [PubMed]
  2. Pearce, G.A.; McLachlan, A.J.; Ramzan, I. Bioequivalence: How, Why, and What Does it Really Mean? Pharm. Pract. Res. 2004, 34, 195–200. [Google Scholar] [CrossRef]
  3. European Medicines Agency. Guideline on the Investigation of Bioequivalence; Rev 1/Corr.; Committee for Medicinal Products for Human Use (CHMP): Amsterdam, The Netherlands, 2010; Available online: https://www.ema.europa.eu/en/documents/scientific-guideline/guideline-investigation-bioequivalence-rev1_en.pdf (accessed on 11 January 2025).
  4. European Medicines Agency. ICH Guideline M13A on Bioequivalence for Immediate-Release Solid Oral Dosage Forms—Scientific Guideline; European Medicines Agency: Amsterdam, The Netherlands, 2025; Available online: https://www.ema.europa.eu/en/ich-guideline-m13a-bioequivalence-immediate-release-solid-oral-dosage-forms-scientific-guideline (accessed on 11 January 2025).
  5. U.S. Food and Drug Administration. Guidance for Industry: Bioavailability and Bioequivalence Studies Submitted in NDAs or INDs—General Considerations; Draft Guidance; U.S. Food and Drug Administration: Spring, MD, USA, 2014. Available online: https://www.fda.gov/media/88254/download (accessed on 11 January 2025).
  6. Midha, K.K.; Rawson, M.J.; Hubbard, J.W. The Bioequivalence of Highly Variable Drugs and Drug Products. Clin. Pharmacol. 2005, 43, 485–498. [Google Scholar] [CrossRef] [PubMed]
  7. Karalis, V.; Symillides, M.; Macheras, P. Bioequivalence of Highly Variable Drugs: A Comparison of the Newly Proposed Regulatory Approaches by FDA and EMA. Pharm. Res. 2011, 29, 1066–1077. [Google Scholar] [CrossRef]
  8. Haidar, S.H.; Davit, B.; Chen, M.L.; Conner, D.; Lee, L.; Li, Q.H.; Lionberger, R.; Makhlouf, F.; Patel, D.; Schuirmann, D.J.; et al. Bioequivalence Approaches for Highly Variable Drugs and Drug Products. Pharm. Res. 2007, 25, 237–241. [Google Scholar] [CrossRef]
  9. Tothfalusi, L.; Endrenyi, L.; Arieta, A.G. Evaluation of Bioequivalence for Highly Variable Drugs with Scaled Average Bioequivalence. Clin. Pharmacokinet. 2009, 48, 725–743. [Google Scholar] [CrossRef] [PubMed]
  10. Vora, L.K.; Gholap, A.D.; Jetha, K.; Thakur, R.R.S.; Solanki, H.K.; Chavda, V.P. Artificial Intelligence in Pharmaceutical Technology and Drug Delivery Design. Pharmaceutics 2023, 15, 1916. [Google Scholar] [CrossRef]
  11. Karalis, V.D. A Vector Theory of Assessing Clinical Trials: An Application to Bioequivalence. J. Cardiovasc. Dev. Dis. 2024, 11, 185. [Google Scholar] [CrossRef]
  12. Harrer, S.; Shah, P.; Antony, B.; Hu, J. Artificial Intelligence for Clinical Trial Design. Trends Pharmacol. Sci. 2019, 40, 577–591. [Google Scholar] [CrossRef]
  13. Khan, O.; Parvez, M.; Kumari, P.; Parvez, S.; Ahmad, S. The Future of Pharmacy: How AI Is Revolutionizing the Industry. Intell. Pharm. 2023, 1, 32–40. [Google Scholar] [CrossRef]
  14. Al Meslamani, A.Z. Applications of AI in Pharmacy Practice: A Look at Hospital and Community Settings. J. Med. Econ. 2023, 26, 1081–1084. [Google Scholar] [CrossRef]
  15. Yim, D.; Khuntia, J.; Parameswaran, V.; Meyers, A. Preliminary Evidence of the Use of Generative AI in Health Care Clinical Services: Systematic Narrative Review. JMIR Med. Inform. 2024, 12, e52073. [Google Scholar] [CrossRef] [PubMed]
  16. Sehrawat, S.K. Transforming Clinical Trials: Harnessing the Power of Generative AI for Innovation and Efficiency. Trans. Recent Dev. Health Sect. 2023, 6, 1–20. [Google Scholar]
  17. Papadopoulos, D.; Karalis, V.D. Variational Autoencoders for Data Augmentation in Clinical Studies. Appl. Sci. 2023, 13, 8793. [Google Scholar] [CrossRef]
  18. Bragazzi, N.L.; Garbarino, S. Toward Clinical Generative AI: Conceptual Framework. JMIR AI 2024, 3, e55957. [Google Scholar] [CrossRef]
  19. Fleurence, R.; Bian, J.; Wang, X.; Xu, H.; Dawoud, D.; Higashi, M.; Chhatwal, J. Generative AI for Health Technology Assessment: Opportunities, Challenges, and Policy Considerations. arXiv. [CrossRef]
  20. Marchesi, R.; Micheletti, N.; Kuo, N.I.; Barbieri, S.; Jurman, G.; Osmani, V. Generative AI Mitigates Representation Bias and Improves Model Fairness Through Synthetic Health Data. medRxiv 2023. [Google Scholar] [CrossRef]
  21. Wang, A.X.; Chukova, S.S.; Simpson, C.R.; Nguyen, B.P. Challenges and Opportunities of Generative Models on Tabular Data. Appl. Soft Comput. 2024, 166, 112223. [Google Scholar] [CrossRef]
  22. Nikolopoulos, A.; Karalis, V.D. Implementation of a Generative AI Algorithm for Virtually Increasing the Sample Size of Clinical Studies. Appl. Sci. 2024, 14, 4570. [Google Scholar] [CrossRef]
  23. Goodfellow, I.; Pouget-Abadie, J.; Mirza, M.; Xu, B.; Warde-Farley, D.; Ozair, S.; Bengio, Y. Generative Adversarial Networks. Commun. ACM 2020, 63, 139–144. [Google Scholar] [CrossRef]
  24. Saxena, D.; Cao, J. Generative Adversarial Networks (GANs). ACM Comput. Surv. 2021, 54, 1–42. [Google Scholar] [CrossRef]
  25. Solanki, A.; Naved, M. (Eds.) GANs for Data Augmentation in Healthcare; Springer International Publishing: Berlin/Heidelberg, Germany, 2023. [Google Scholar] [CrossRef]
  26. Ahmad, Z.; Jaffri, Z.U.A.; Chen, M.; Bao, S. Understanding GANs: Fundamentals, Variants, Training Challenges, Applications, and Open Problems. Multimed. Tools Appl. 2024, 84, 10347–10423. [Google Scholar] [CrossRef]
  27. Vlachou, M.; Karalis, V. An in Vitro–in Vivo Simulation Approach for the Prediction of Bioequivalence. Materials 2021, 14, 555. [Google Scholar] [CrossRef]
  28. Alvero, R.G.Y.; Aquino, R.C.C.; Balmadrid, A.S.; Balaccua, G.P. Bioequivalence Study of Two Formulations of Simvastatin 20 Mg Tablet in Healthy Filipino Participants under Fasting Conditions: A Randomized, Open-Label, Two-Way Crossover Study. Acta Medica Philipp. 2023, 58, 30. [Google Scholar] [CrossRef]
  29. Bohr, A.; Memarzadeh, K. The Rise of Artificial Intelligence in Healthcare Applications. Artif. Intell. Healthc. 2020, 2020, 25–60. [Google Scholar] [CrossRef]
  30. Koski, E.; Murphy, J. AI in Healthcare. Stud. Health Technol. Inform. 2021, 284, 295–299. [Google Scholar] [CrossRef]
  31. Lee, D.; Yoon, S.N. Application of Artificial Intelligence-Based Technologies in the Healthcare Industry: Opportunities and Challenges. Int. J. Environ. Res. Public Health 2021, 18, 271. [Google Scholar] [CrossRef]
  32. Shaheen, M.Y. Applications of Artificial Intelligence (AI) in Healthcare: A Review. Sci. Prepr. 2021. [Google Scholar] [CrossRef]
  33. Kasula, B.Y. AI Applications in Healthcare: A Comprehensive Review of Advancements and Challenges. Int. J. Inf. Syst. Comput. Sci. 2023, 6, 1–9. [Google Scholar]
  34. Luckett, J. Regulating Generative AI: A Pathway to Ethical and Responsible Implementation. Int. J. Comput. Intell. 2023, 12, 79–92. [Google Scholar] [CrossRef]
  35. Xinru, H. Generative Artificial Intelligence: Risks of Data Acquisition, Regulatory Deficiencies, and Suggestions for Countermeasures—From the Inspiration of European Union Legislation. Int. J. Financ. Stud. 2024, 6, 61–70. [Google Scholar] [CrossRef]
  36. Luk, C.Y.; Chung, H.L.; Yim, W.K.; Leung, C.W. Regulating Generative AI: Ethical Considerations and Explainability Benchmarks. Available online: https://osf.io/preprints/osf/h74gw_v1 (accessed on 23 April 2025).
  37. Meskó, B.; Topol, E.J. The Imperative for Regulatory Oversight of Large Language Models (or Generative AI) in Healthcare. NPJ Digit. Med. 2023, 6, 120. [Google Scholar] [CrossRef] [PubMed]
  38. Papadopoulos, D.; Karali, G.; Karalis, V.D. Bioequivalence Studies of Highly Variable Drugs: An Old Problem Addressed by Artificial Neural Networks. Appl. Sci. 2024, 14, 5279. [Google Scholar] [CrossRef]
  39. Wang, W.; Pai, T.-W. Enhancing Small Tabular Clinical Trial Dataset through Hybrid Data Augmentation: Combining SMOTE and WCGAN-GP. Data 2023, 8, 135. [Google Scholar] [CrossRef]
  40. Trabucco, B.; Doherty, K.; Gurinas, M.; Salakhutdinov, R. Effective Data Augmentation with Diffusion Models. arXiv 2023. [Google Scholar] [CrossRef]
Figure 1. Proposed method for addressing the assessment of HVD in ΒΕ studies through the implementation of WGANs. The process begins with an input (dataset of a classic BE study), which is then processed through the WGAN generator and critic networks. The generator creates new data representations, while the critic evaluates the generated outputs to improve decision outcomes, by augmenting the dataset. In the example shown, the input refers to a “failed” BE assessment where the 90% confidence interval is outside the acceptance region, while the GAN augments the input, leading to a “Pass” output within the acceptance region.
Algorithms 18 00266 g001
Figure 2. Methodology flowchart.
Algorithms 18 00266 g002
Figure 3. Percent BE acceptance for the original dataset, a sample, and the WGAN-generated dataset was evaluated at three variability levels: 15% (A), 30% (B), and 50% (C), under the EMA regulations. The sample sizes of the original datasets were 24, 40, and 60, while the corresponding sample sizes of the WGAN-synthesized data were three times larger than those of the original. The error bars represent the standard error calculated from 1000 Monte Carlo trials performed under each condition.
Algorithms 18 00266 g003
Figure 4. Percent BE acceptance for the original dataset, a sample, and the WGAN-generated dataset was evaluated at three variability levels: 15% (A), 30% (B), and 50% (C), under the FDA regulations. The sample sizes of the original datasets were 24, 40, and 60, while the corresponding sample sizes of the WGAN-synthesized data were three times larger than those of the original. The error bars represent the standard error calculated from 1000 Monte Carlo trials performed under each condition.
Algorithms 18 00266 g004
Figure 5. Percent BE acceptance gain across three variability levels (15%, 30%, and 50%) and three sample sizes of the original dataset (24, 40, and 60). The acceptance gain refers to the difference in statistical power between the synthetic data and the original (or sample) data. The error bars represent the standard error calculated from 1000 Monte Carlo trials performed under each condition.
Algorithms 18 00266 g005
Figure 6. Percent BE acceptance for the original dataset, a random sample (50% of the original), and the WGAN-generated dataset (2×, 3×) for two actual datasets: (A) hydrochlorothiazide and (B) atorvastatin. N refers either to actual human subjects or to data synthesized using WGANs. The error bars represent the standard error calculated from 1000 Monte Carlo trials performed under each condition.
Algorithms 18 00266 g006
Table 1. List of hyperparameter values examined during the fine-tuning process.
GeneratorNumber of Hidden Layers1
Number of Neurons4–10
CriticNumber of Hidden Layers1
Number of Neurons4–10
Activation FunctionInput/Hidden Layerlinear, tanh, ReLu
Output Layerlinear, sigmoid, tanh, softmax
Latent dimension60–120
Number of Epochs500–5000
Table 2. Values of the parameters investigated in the Monte Carlo simulation method.
Between-Subject Variability10%
Within-Subject Variability (CVw)15%, 30%, 50%
Average Test/Reference difference10%
Population Size of the Original data (N)24, 40, 60
Sampling Percentages (of the Original)75%, 100%
Generated Population Size (×N)2×, 3×
Table 3. Similarity assessment between original and synthetic datasets across three levels of intra-subject variability (CVw) and three original sample sizes (N). BE evaluations were conducted according to EMA guidelines. Results are shown for both 2×N and 3×N data augmentations.
% Similarity
CVwAugmentation ScaleNOriginal vs. SampleOriginal vs. Synthetic
15%6099.8%100.0%
4099.0%99.6%
2493.4%94.0%
6099.8%100.0%
4099.0%99.6%
2493.4%94.0%
30%6090.4%97.2%
4085.2%90.8%
2483.0%88.4%
6090.4%95.8%
4085.2%92.4%
2483.0%88.4%
50%6096.6%92.6%
4089.6%89.8%
2484.2%84.8%
6096.6%91.4%
4089.6%86.0%
2484.2%82.4%
Table 4. Similarity assessment between original and synthetic datasets across three levels of intra-subject variability (CVw) and three original sample sizes (N). Bioequivalence evaluations were conducted according to FDA guidelines. Results are shown for both 2×N and 3×N data augmentations.
% Similarity
CVwAugmentation ScaleNOriginal vs. SampleOriginal vs. Synthetic
15%6099.8%100.0%
4099.0%99.6%
2493.4%94.0%
6099.8%100.0%
4099.0%99.6%
2493.4%94.0%
30%6094.2%97.4%
4087.4%94.0%
2482.4%92.4%
6094.2%96.8%
4087.4%93.4%
2482.4%91.6%
50%6096.4%92.0%
4093.0%89.4%
2486.0%85.4%
6096.4%90.4%
4093.0%85.4%
2486.0%81.4%
Disclaimer/Publisher’s Note: The statements, opinions and data contained in all publications are solely those of the individual author(s) and contributor(s) and not of MDPI and/or the editor(s). MDPI and/or the editor(s) disclaim responsibility for any injury to people or property resulting from any ideas, methods, instructions or products referred to in the content.

