Article

A GNN-Based False Data Detection Scheme for Smart Grids

1
XJ Electric Corporation of China Electrical Equipment, Xuchang 461000, China
2
The School of Artificial Intelligence and Big Data, Henan University of Technology, Zhengzhou 450001, China
*
Author to whom correspondence should be addressed.
Algorithms 2025, 18(3), 166; https://doi.org/10.3390/a18030166
Submission received: 8 January 2025 / Revised: 22 February 2025 / Accepted: 28 February 2025 / Published: 14 March 2025

Abstract

:
A Cyber-Physical System (CPS) incorporates communication dynamics and software into phsical processes, providing abstractions, modeling, design, and analytical techniques for the system. Based on spatial temporal graph neural networks (STGNNs), anomaly detection technology has been presented to detect anomaly data in smart grids with good performance. However, since topological changes of power networks in smart grids often already predict the occurrence of anomalies, traditional models based on STGNNs to portray network evolution cannot be directly utilized in smart grids. Our research proposed a smart grid anomaly detection method on the grounds of STGNNs, which used evolution in the information of several attributes that affected the power network to represent the evolution of the power network, subsequently used STGNNs to obtain the time-space dependencies of nodes in several information networks, and used a cross-domain method to help the anomaly detection of the power network through anomaly information of other related networks. Laboratory findings reveal that the abnormal data detection rate of our scheme reaches 90% in the initial stage of data transmission and outperforms other comparative methods, and as time goes by, the detection rate becomes higher and higher.

1. Introduction

The Internet of Things (IoT) is boosting the progress of Cyber Physical Systems (CPSs), which build a complex communication system on top of physical processes [1] by integrating information flowing between several interconnected sensors and controllers. Smart grids, as an example of CPSs, also deploy a large number of sensors, measurement devices, and controllers on top of the power network. Sensors collect grid data and transmit them over the network to the control center, which gives instructions to the controllers in the power network for critical tasks based on the collected data [2]. Due to the high level of integration between communication systems and physical systems in CPSs, cyber attacks against communication systems can not only affect the operation of communication systems, but can also have a serious impact on physical systems, leading to serious consequences such as grid failure [3].
The smart grid integrates the cutting-edge information and communication technology (ICT) to achieve real-time surveillance, optimization, and the control of power supply and demand, improving the efficiency, reliability, and flexibility of the power system. By applying advanced sensors and devices at key nodes, such as substations, transmission lines, and user terminals, IoT technology has achieved real-time data collection and human–computer interaction. These apparatuses are able to gather real-time data and transmit them to a central processing system for analysis and processing through a communication network, providing real-time status of the power system for staff and allowing timely decision-making on potential issues. The application of IoT technology has improved the real-time monitoring capability of smart grids, allowing them to predict system failures, quickly alert users of emergencies, and automatically adjust grid configurations to maintain power supply stability.
For example, in Figure 1, the communication system contains three control centers X 1 , X 2 , and X 3 , and the power system contains two generators Y 2 and Y 3 and two power relay nodes Y 1 and Y 4 . If X 2 in the communication system fails by a network attack, it will cause Y 2 generators in the power system to stop working, and the corresponding two relay nodes Y 1 and Y 4 in the power system will also fail, which in turn will lead to the failure of X 1 and X 3 in the communication system according to the cascading failure in the coupling network, which may eventually lead to the collapse of the entire power system. For example, in 2019, malicious attacks against hydroelectric centers caused nationwide power outages in Venezuela [4]. Therefore, ensuring cybersecurity in the smart grid is critical to national security.
Deep learning (DL), thanks to its powerful data abstraction capabilities, is able to extract potential connections between anomalies and data in communication systems. Thus, deep learning is extensively utilized for anomaly detection in Cyber-Physical Systems (CPSs) [2,5,6]. Given the nature of the Industrial Internet of Things (IIoT), in which devices are interconnected, it is appropriate to use a graph to represent the spatial relationships between devices. Traditional deep learning models are mainly devised to manage data with Euclidean structures, encompassing texts and images, which can not effectively capture the spatial information within more intricate non-Euclidean structures. By contrast, GNN enhances deep neural networks by incorporating both network structures and node features, which allows it to effectively handle graph-structured data. This makes a GNN particularly well-suited for anomaly detection in smart grids, utilizing spatial information. For example, in [7], the weather data obtained from sensor measurements are processed to measure the possibility of power outages through a graph neural network. This study [8] proposed to analyze the mapping of non-linear relationships from the categories of dissolved gases to the categories of transformer faults using Graph Convolutional Networks (GCNs). However, after severe weather or dissolved gases were generated and the threat to the grid emerged, these methods could not address the possible threats and simply construct a mapping among weather, dissolved gases, and anomalous events of the smart grid. MAD-SGCN [9] efficiently captures both temporal and spatial dependencies in the input sequence via Long Short-Term Memory networks (LSTMs) and GCNs, and determines whether anomalies are currently occurring by reconstructing the degree of the observed sequence. However, the method uses LSTM to obtain the temporal correlation of the input sequence and does not use the possible state of the future sequence to determine the potential threat.
In other CPSs, such as the physical transmission network, the topology of the network tends to change to different degrees with the passage of time or the occurrence of anomalies; however, in smart grids, changes in the power network topology often indicate that anomalies have occurred, and dynamic changes in the power network topology may lack practical application for anomaly detection. Therefore, the traditional spatial-temporal GNN-based anomaly detection model for CPSs cannot be applied directly to the smart grid. As shown in Figure 1, the temperature, wind, rainfall, and other data measured by the sensors naturally conform to the graph signal processing process, and the weather and other external factors measured by the sensors are naturally interdependent in time and space and have an impact on the power load of the smart grid. Therefore, our reseach could utilize the spatial temporal graph neural network (STGNN) to manage the information network composed of these external factors as well as the evolution of the information network to represent the change of the smart grid state and forecast the potential external threats and anomalies in the future.
As shown in Figure 2, smart grids are divided into communication networks, power networks, and physical transmission networks. In the power network, distributed power units are one of the core components of the entire system. Each unit module integrates power electronic converters, sensing devices, and control units. Each unit module includes a power converter, inverter, DC bus, and intelligent switch. The power generation or load unit is connected to the busbar by power electronic converters and intelligent switches. Each unit is interconnected through a network, with sensors in one unit connected to controllers in another unit. Sensors collect physical data from various units and send it to the communication network. The controller then issues corresponding control commands from the communication network.
In the physical transmission network, energy flows through the power grid, thereby achieving the generation, transmission, distribution, and application of electrical energy. Photovoltaic power generation, wind turbines, and other means of power generation, as well as energy storage and loads, constitute the key physical network of the entire energy system. The integrated energy system consists of multiple physical subsystems, including photovoltaic power stations, wind turbines, diesel generators, energy storage devices, electric vehicle charging facilities, and distributed energy supply equipment, among others. The common coupling point is the connection method between the integrated energy system and the distribution network.
In the communication network, information flow is accomplished through communication networks for communication, computation, analysis, and decision-making. The communication network is the link of the digital world, carrying the exchange of energy and wisdom. Of the physical network and the power network, the data are collected into the communication network through the powers of the IoT and the Internet. The communication network consists of intermediaries corresponding to energy production equipment, terminal devices for energy consumers, and corresponding communication networks. Intermediaries are used to receive data from sensors and send control commands, as well as store basic data for each energy production device and monitor device status. Network terminals are used by power users and operators to retrieve and distribute network data, as well as manage power generation equipment or loads.
Our research put forward an STGNN-based cross-domain anomaly detection model. The STGNN was utilized to process several information networks obtained from sensor measurements, with the intention of forecasting the state of the information network at future moments and simulating dynamic changes of the state of the power network. Subsequently, we use domain adaptation techniques to follow frontier studies [10,11,12] and extract potential representations of nodes in different domains using a shared encoder. In this way, the anomaly information from the communication systems and the physical transmission network is used to assist the power system in anomaly detection to tackle the costly issue of obtaining anomaly labels for power systems.
The key contributions are summarized below:
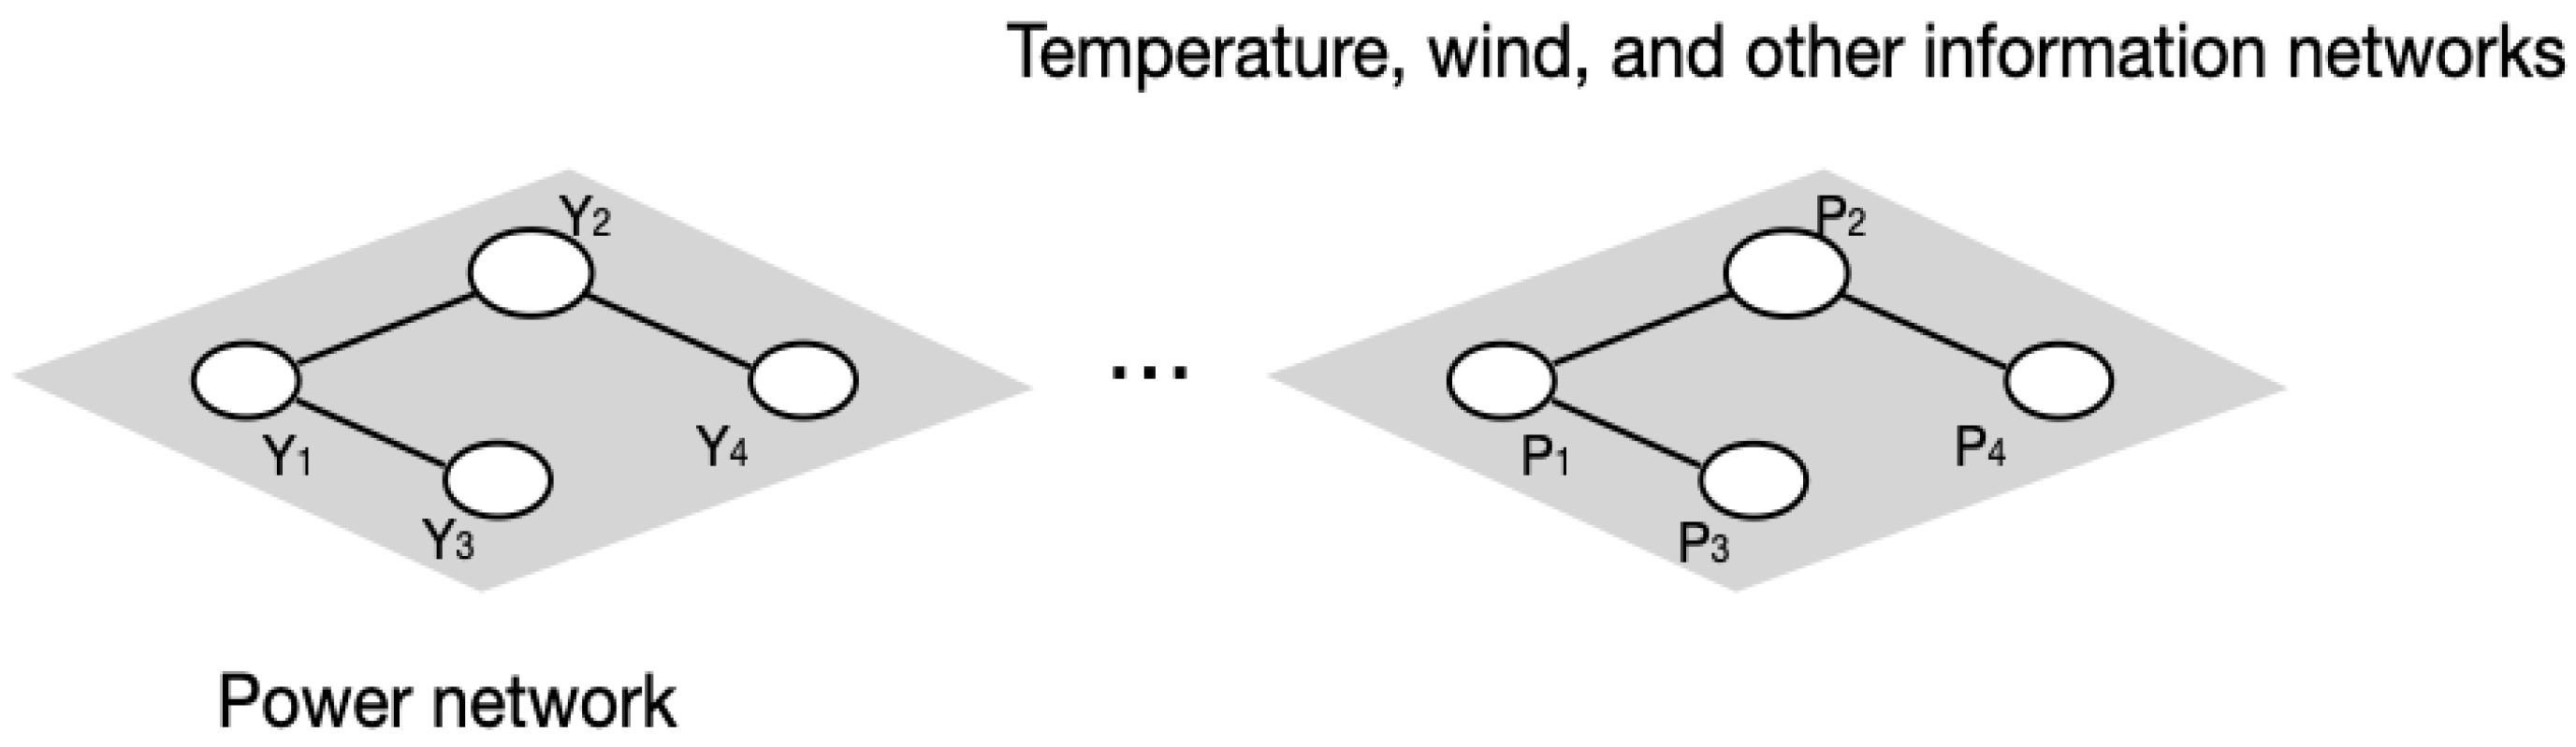
  • The information graph was modeled by aggregating the structure and features of the network. The graph processed the communication layer dataset, converted the traffic data into graph structures, and used them as inputs for the model to ensure effective integration of the feature information.
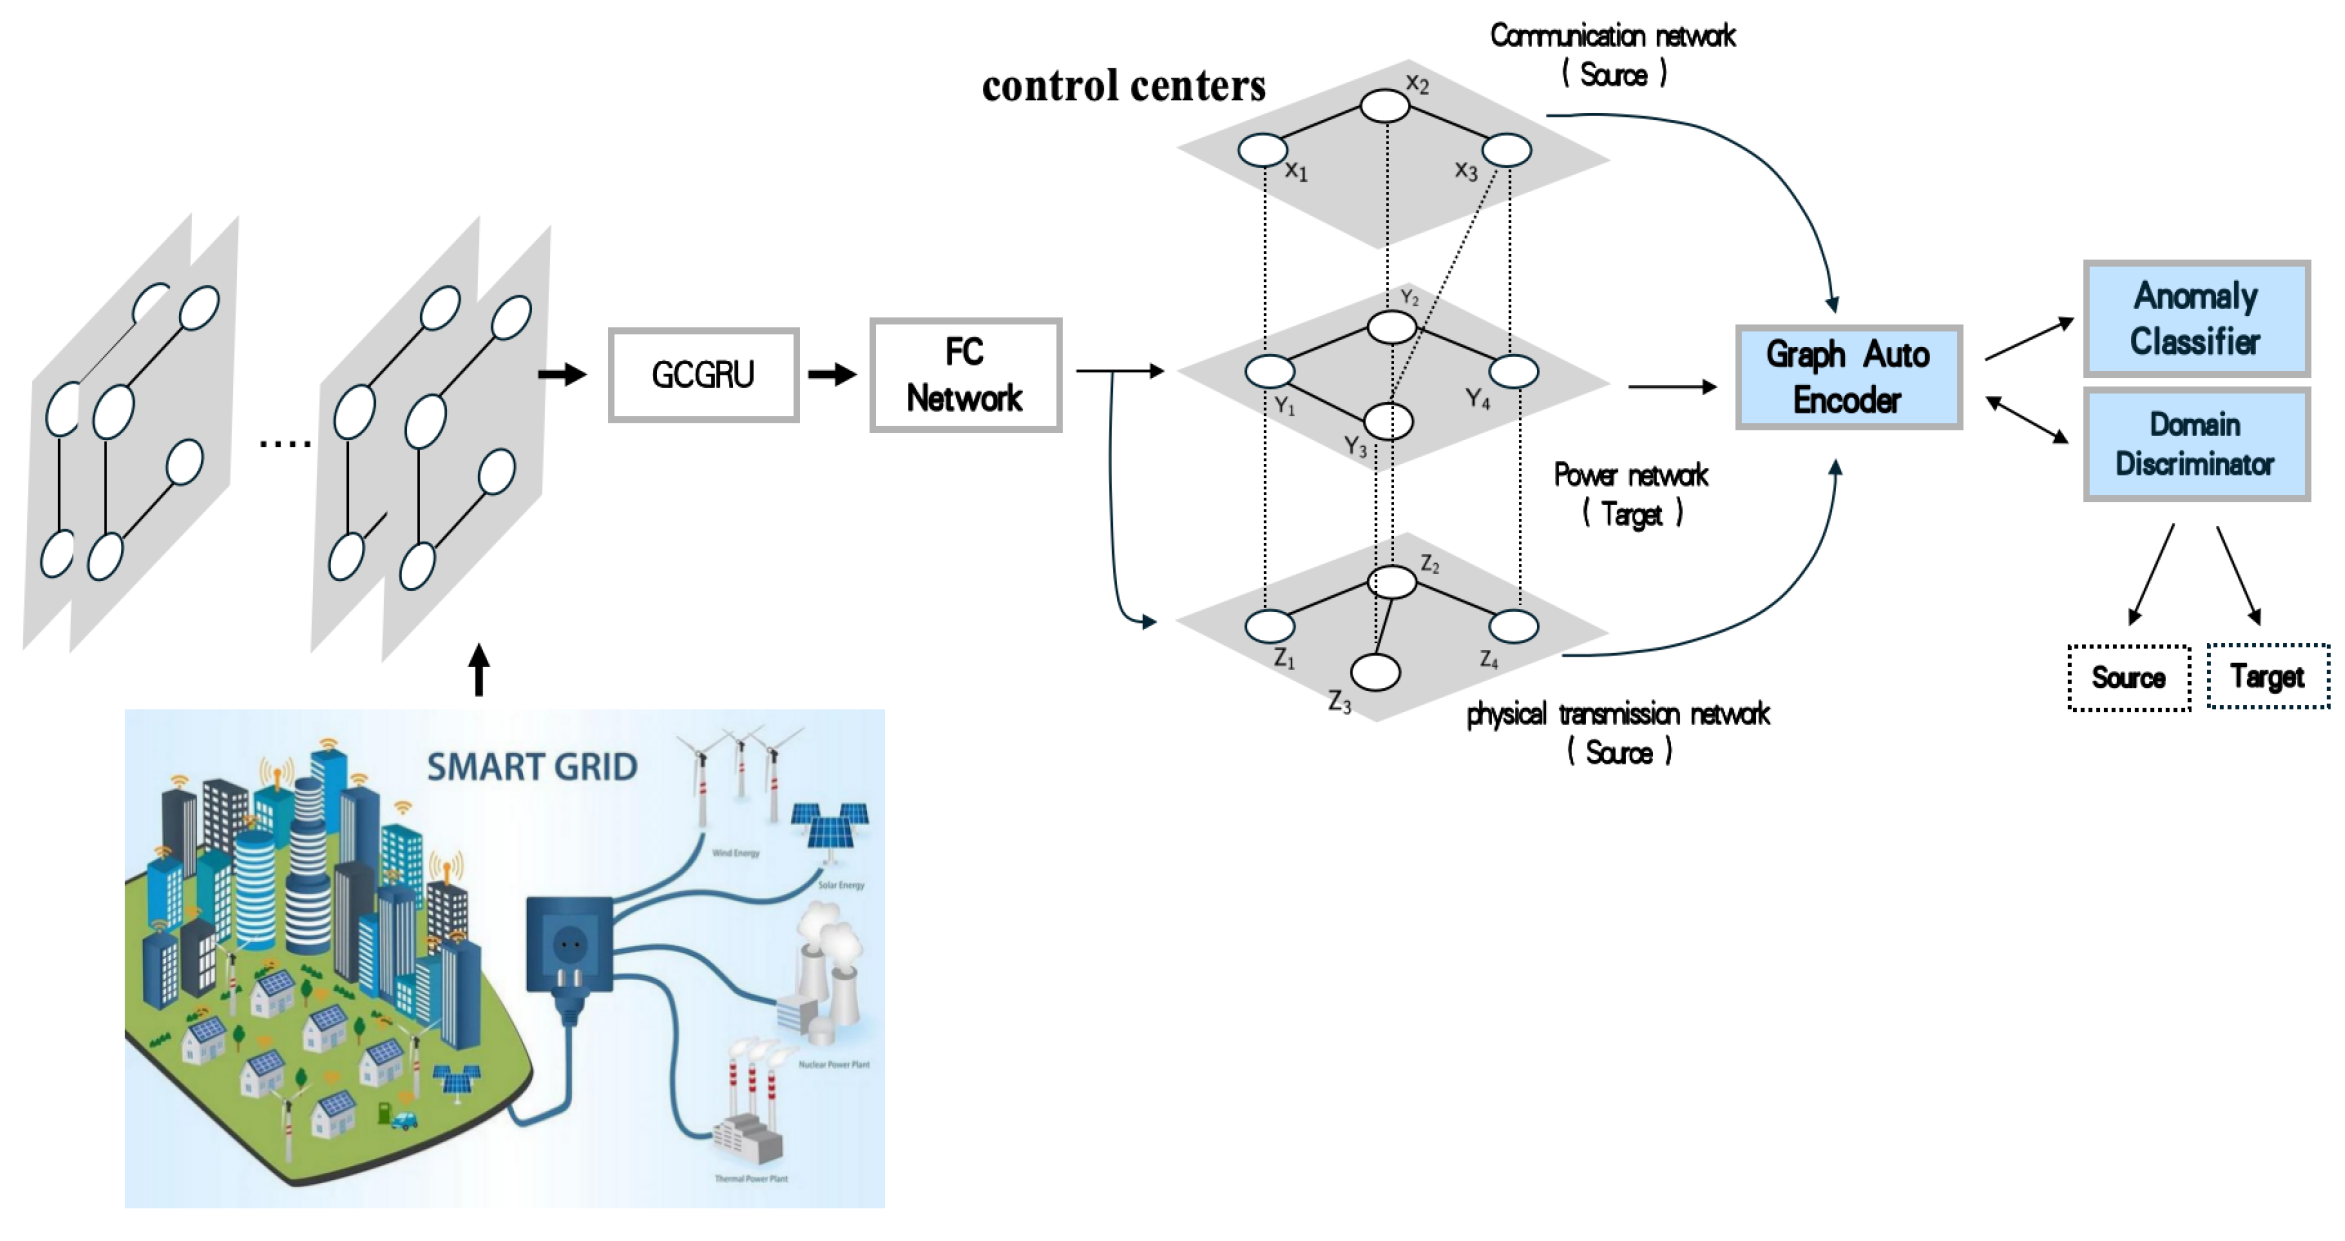
  • A spatio-temporal graph neural network (STGNN) was developed to process several information networks obtained from sensor measurements to forecast the network state.
  • A loss function was designed to bridge the differences between different domains. The abnormal information from communication and transmission systems was utilized to analyze and detect anomaly information between real data and normal data.
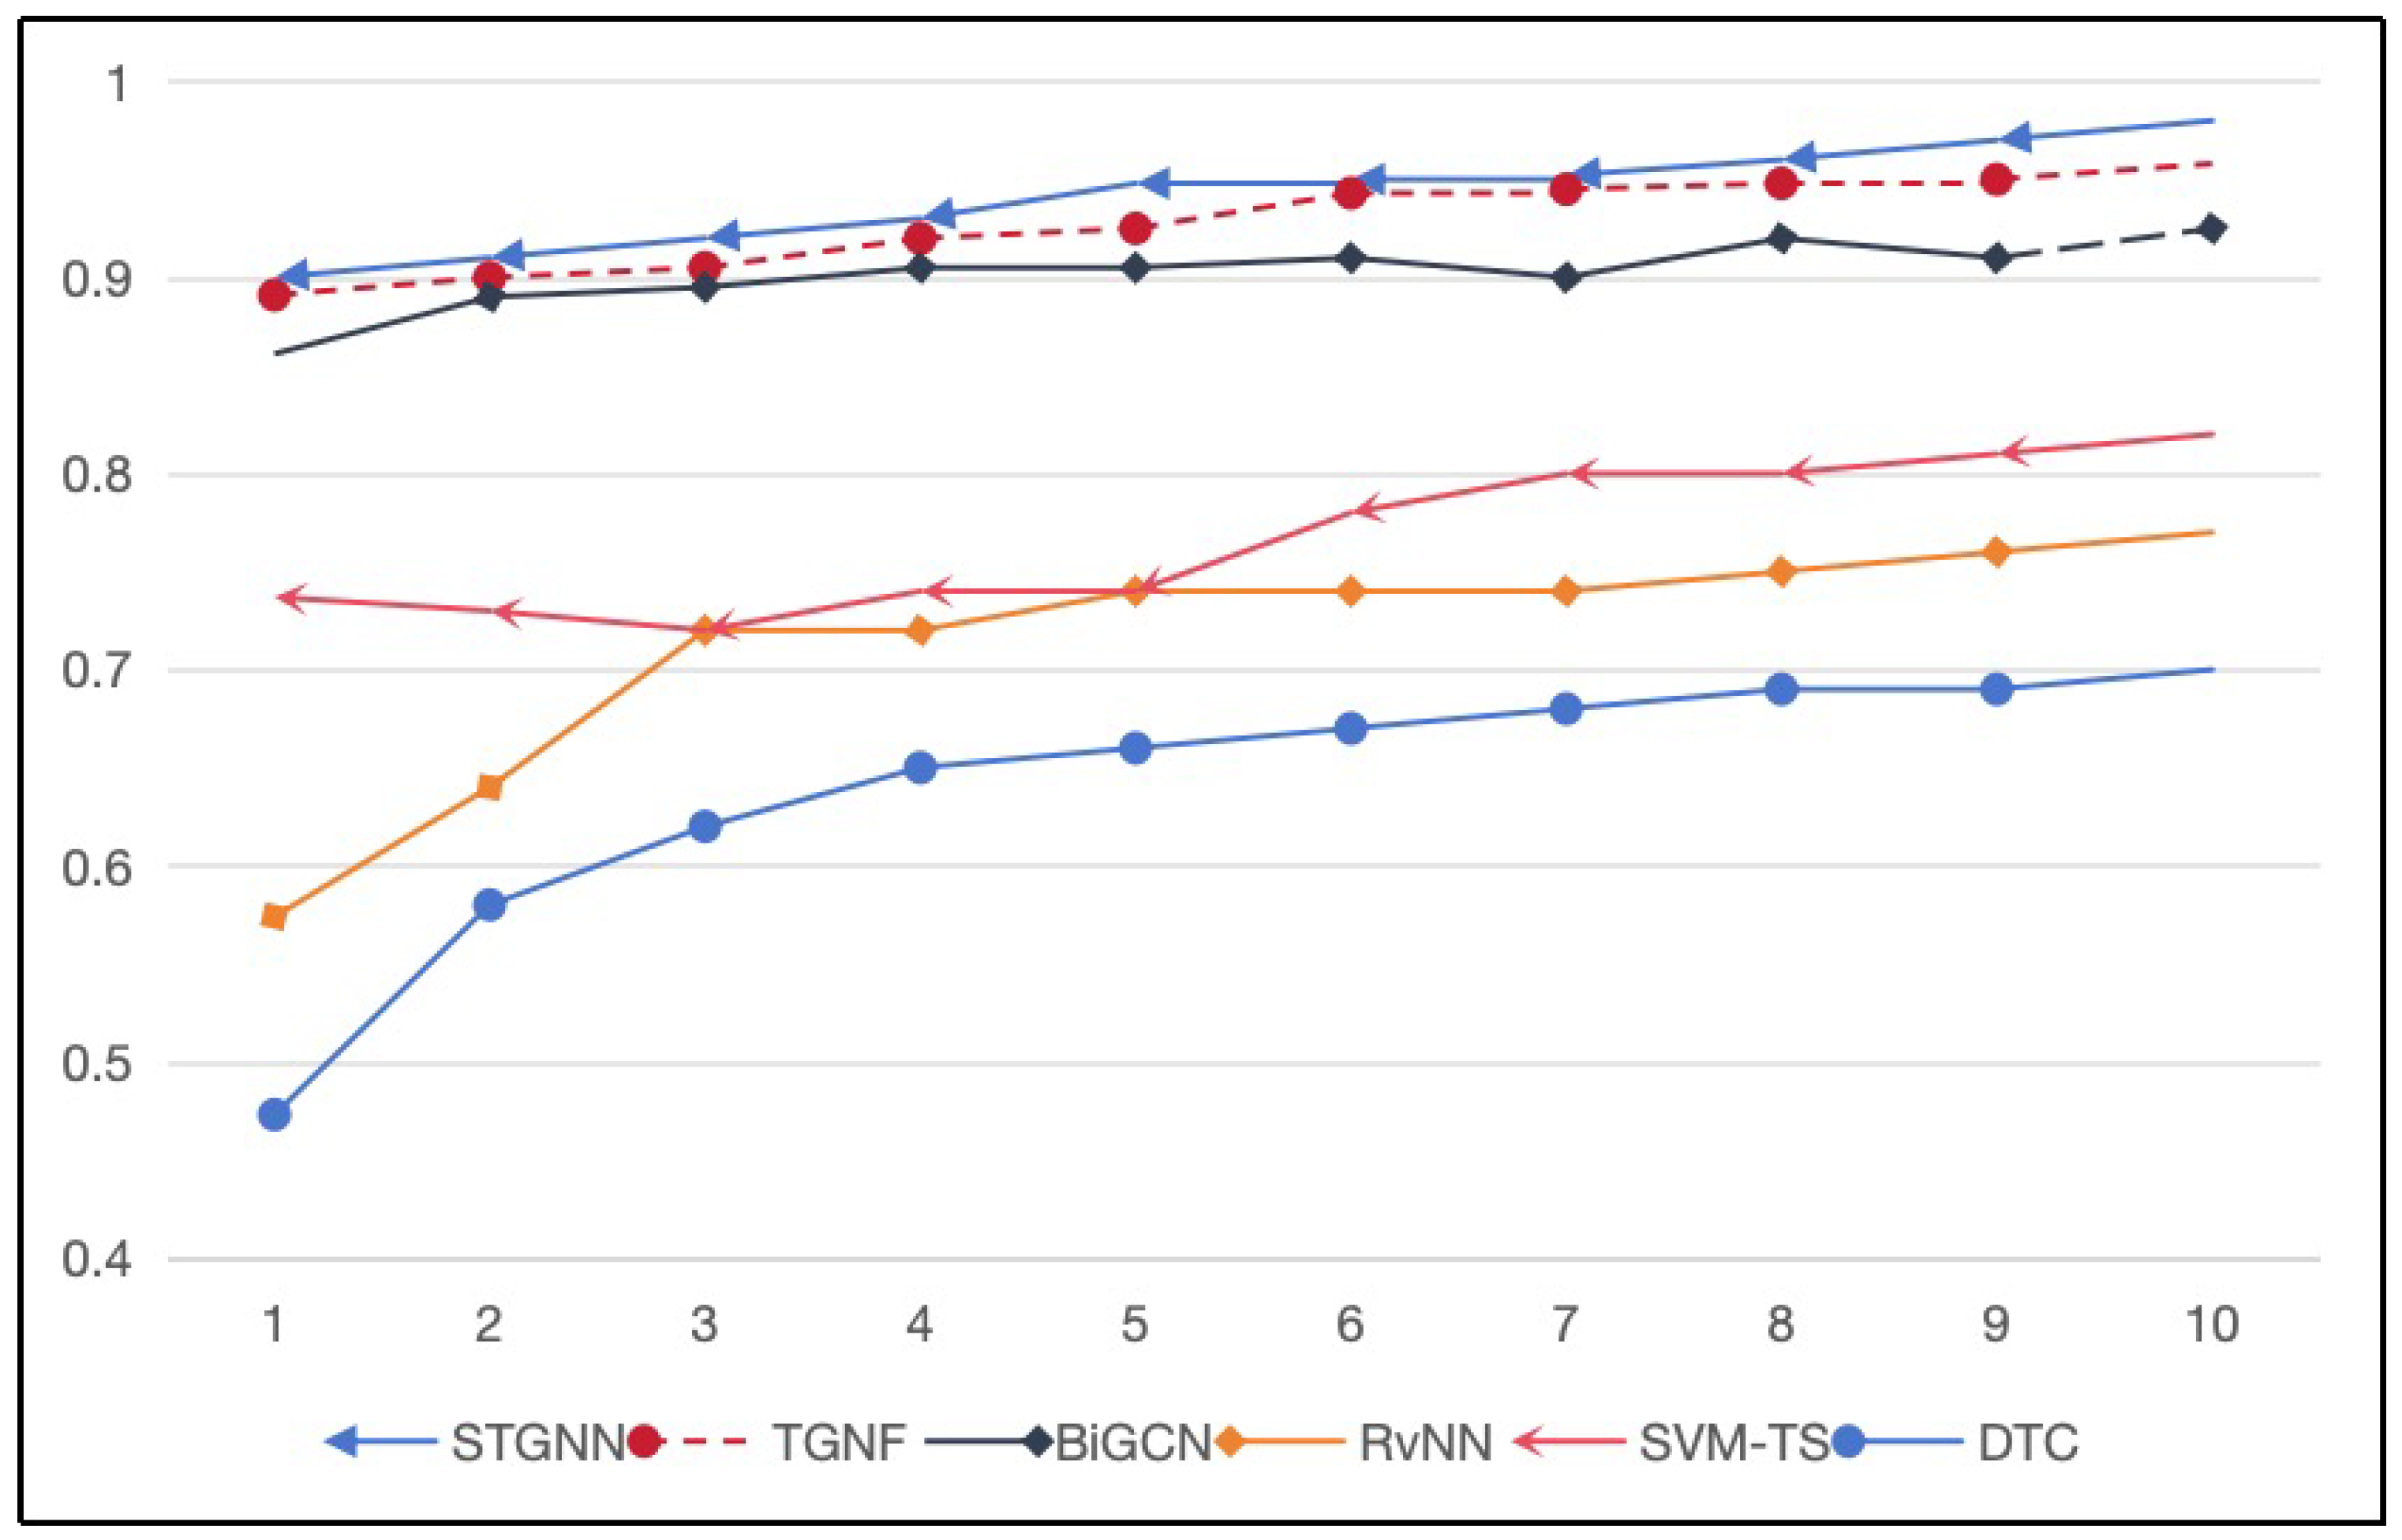
  • The experiment revealed that the proposed scheme outperformed other comparative methods with respect to anomaly detection tasks and could accurately identify anomalous data in the early stages of data transmission.
The remainder of this paper is organized in five additional sections. In the next section, we illustrate the relevant work. Section 3 summarizes the preliminaries. Section 4 proposes the GNN-based false data detection scheme. Section 5 presents the experimental evaluation. Significantly, the last section offers concluding remarks and prospective ideas.

2. Related Work

2.1. Anomaly Detection

In terms of anomaly detection among attributed graphs, research has recently been gaining growing attention lately owing to extensive applications in diverse high-impact fields. Lately, anomaly detection on log data through DL has been actively explored. In [13], the authors  conducted a comprehensive review of currently published papers on anomalous trajectories, highlighting important research trends and future directions. The authors in [14] proposed a causality-guided counterfactual debiasing for anomaly detection. The authors in [15] proposed an adaptive correlation-aware unsupervised deep learning to detect anomalies in CPS. In [16], the authors proposed a knowledge-driven image anomaly detection framework for social production systems. In [17], the authors proposed an innovative general-purpose method of identifying anomalies in multivariate time series. This method allowed for both the temporal and feature dimensions using an adaptive masking system, aiming to enhance interpretability and precision. The authors in [18] presented a novel approach for diagnosing open switch (OS) and current sensor (CS) faults among induction motor (IM) drives using a designed reduced-order interval observer.

2.2. Spatial Temporal Graph Neural Networks, STGNNs

A Spatio Temporal Graph Neural Network (STGNN) has become a category of neural network devised to model data that has both space and time dependencies. These networks are exceedingly beneficial to tasks where the data has a dynamic structure that changes over time and involves interactions across different locations or entities, such as traffic prediction, social network analysis, and climate modeling. In an STGNN, the spatial component obtains the correlations among discrepant nodes, while the temporal component models captures how these relationships evolve over time. The network is typically composed of graph convolutional layers that operate on the spatial graph and recurrent or temporal-based layers that capture the time dynamics. The graph structure in STGNN refers to a data structure containing nodes and edges, wherein nodes stand for spatial positions, with edges indicating relationships and temporal dependencies between spatial positions. The data processing module utilizes raw input data to construct spatiotemporal graph data, providing input data for the spatiotemporal graph learning module. The spatiotemporal graph learning module captures the spatiotemporal dependencies present in complex data, and organically combines spatial and temporal networks through a certain spatiotemporal fusion neural network architecture.
Graph neural networks could efficiently model spatial information. In [19], the authors designed an unsupervised anomaly detection model using a sequence-to-sequence (seq2seq) embedding method and GCNs for the spatio-temporal information capture in the time series of water treatment networks (WTNs). The authors in [20] used multiscale one-dimensional convolutions for the temporal pattern capture and subsequently utilized the graph attention network (GAT) to make predictions of time series. In [21], the authors employed two graph attention layers to capture the correlations between various features and temporal dependencies across different timestamps. The anomaly score is formulated on the reconstruction error from the prediction model and the reconstruction model itself, which suggests whether further adjustments are needed. In [22], the authors used a graph convolutional gated recurrent unit (GCGRU) and LSTM to obtain the high correlation of traffic dynamics in the temporal and spatial dimensions and the trend of traffic dynamics, respectively. While using the adversarial framework, the strong correlation between adjacent nodes in both space and time dimensions, as captured by GCGRU and LSTM, made generators and discriminators effectively learn the spatial-temporal patterns of traffic data and anomalies, respectively. In smart graid, a series of historical data in communication networks, due to the influence of air humidity, gradually became abnormal over time. The node in the physical transmission network corresponding to these abnormal data had malfunctioned, which would affect the quality of neighboring nodes.

3. Preliminaries

3.1. Problem Formulation

The set of time slices are denoted as T and | T | = T . We were concerned about semi-supervised graph anomaly detection in an attributed graph G = ( A , X ) ; here, A R n × n signifies the symmetric adjacency matrix containing n nodes. X R T × n × d indicates the node characteristic matrix over T time slices; here, d represents the dimension of node characteristics. Particularly, A i j = 1 indicates that an edge emerges between node i and j, or else, A i j = 0 . We aimed to predict the node at time T + 1 . Then, based on geographical location, the node features obtained from the prediction at time T + 1 are used as the features of the power network and the physical transmission network for the detection of cross-domain anomalies. To offer more interpretable outcomes, the anomaly detection of graphs was typically regarded as a ranking problem [22,23]. Optimistically, in our cross-domain anomaly detection model, the ranking of abnormal nodes should be higher than that of normal nodes.

3.2. Graph Neural Networks

Graph neural networks effectively captured node representations by integrating structural information and node features from the network [24,25]. We employed the“message passing” to characterized the GNN:
H ( l ) = R e L U A ˜ H ( l 1 ) W ( l )
Here, H ( l ) R n × d are the embeddings computed following l-step spreading of the GNN, A ˜ = D ˜ 1 2 ( A + I ) D ˜ 1 2 represents the symmetrically normalized adjacency matrix, and W ( l ) indicates a weight matrix, wherein H ( 0 ) = X R n × d .

4. The GNN-Based False Data Detection Scheme

The key idea of our scheme was that obtaining several data measured by the sensor nodes of the power network had an impact on the grid load. We utilized the STGNN to obtain the spatio-temporal dependence of these data, predicted next moment measurements, and assigned the predictions to the power network as well as the physical transmission network based on the principle of geographical proximity as a feature of the network for the next moment. Moreover, we used a cross-domain model to generalize the knowledge from the attributed graph Source to detect any anomaly on the target graph Target. The framework is shown in Figure 2.

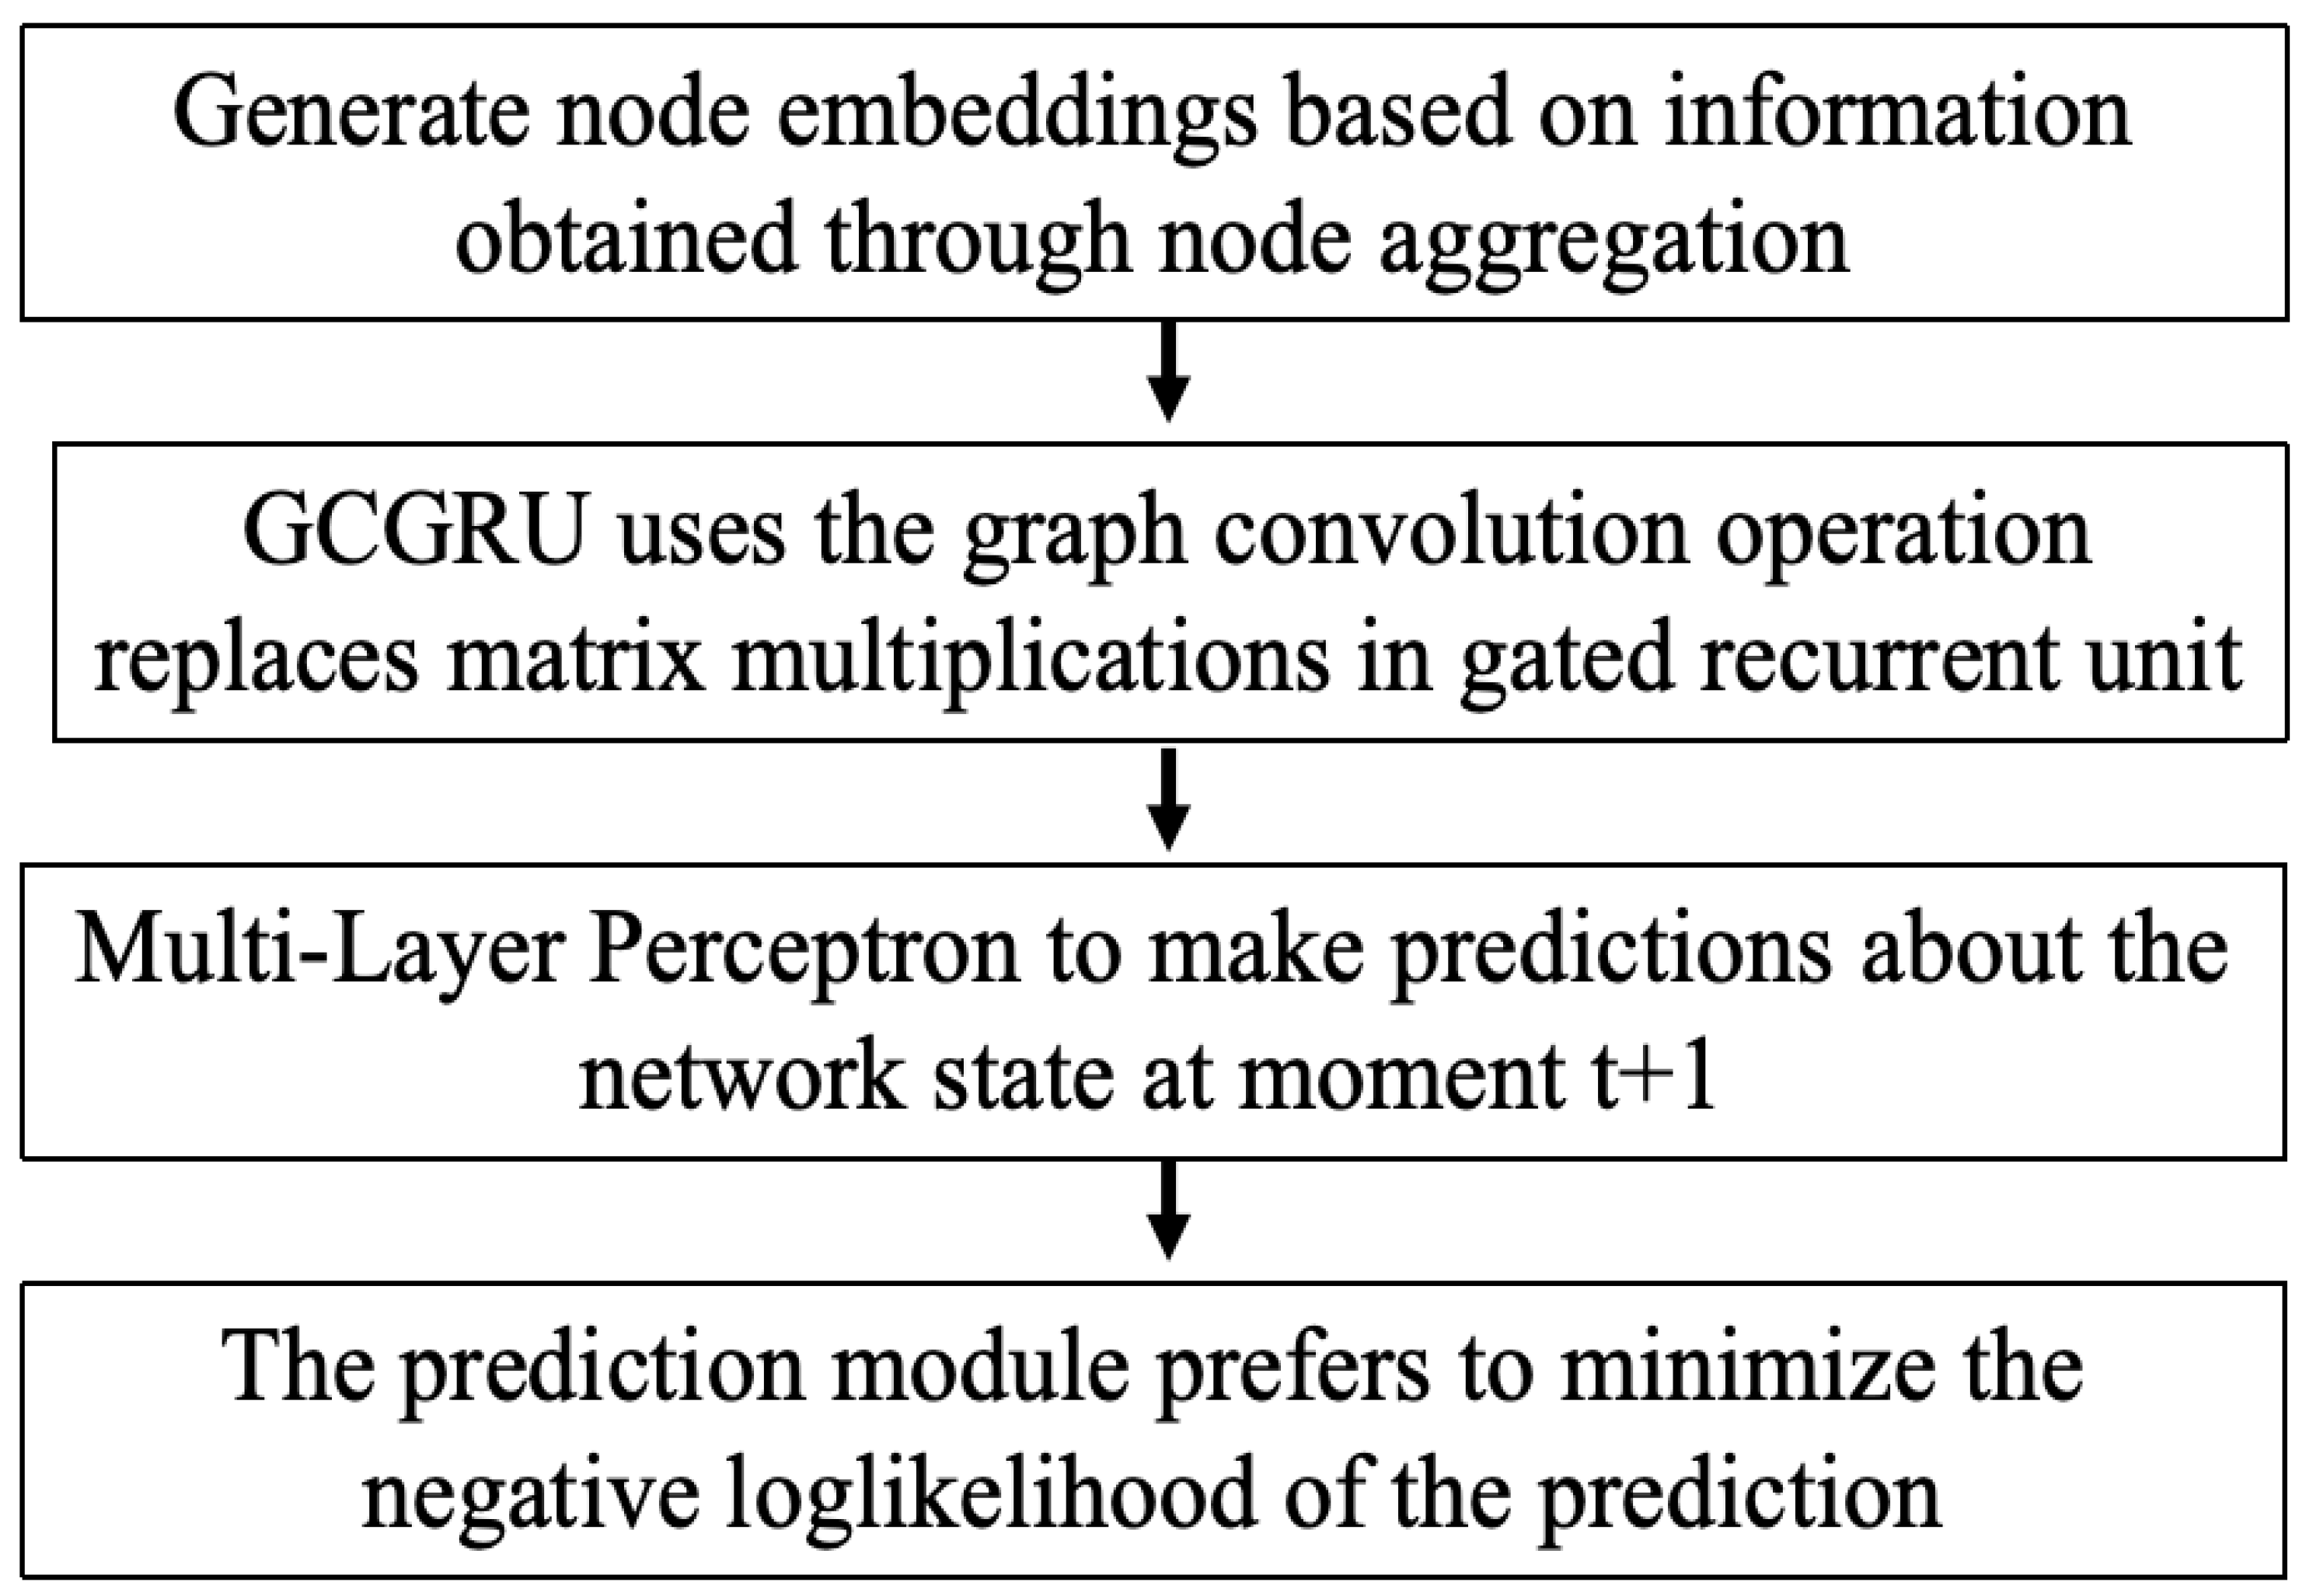
4.1. STGNN for Information Network Prediction

As shown in Figure 3, the information network prediction unit was devised to simultaneously obtain the high correlation in space and time dimensions of several neighboring data points of the information network obtained from sensor node measurements to make accurate predictions of the state of the information network at future moments. It contained a graph convolution gated recursive unit (GCGRU) [26] layer and a fully connected layer.
As shown in Algorithm 1, the research represented the network composed of sensor measurement data as an undirected graph. To better model spatial and temporal dependencies, the GCGRU used the graph convolution operation shown in Equation (2) to replace matrix multiplications in the gated recurrent unit (GRU) [27]. The GCGRU can be defined as follows:
r ( t ) = σ R e L U ( A ˜ [ X ( t ) , H ( t 1 ) ] W r ) u ( t ) = σ R e L U ( A ˜ [ X ( t ) , H ( t 1 ) ] W u ) C ( t ) = t a n h R e L U ( A ˜ [ X ( t ) , ( r ( t ) H ( t 1 ) ) ] W C ) H ( t ) = u ( t ) H ( t 1 ) + ( 1 u ( t ) ) C ( t )
Here, σ denotes the nonlinear activation function. X ( t ) and H ( t ) signify the input and output at time t, separately. r ( t ) and u ( t ) signify the reset gate and update gate at time t, separately.
After obtaining the hidden variable H ( t ) of the information network at time t, we used Multi-Layer Perceptron (MLP) to forecast the network state at moment t + 1:
X ˜ ( t + 1 ) = σ ( W H ( t ) + b )
The prediction module prefers to minimize the negative log-likelihood of the prediction, given the predicted value X ˜ ( t + 1 ) . The loss function of this module is
L P = | | X ˜ ( t + 1 ) X ( t + 1 ) | | 2
We minimized the loss function L p , which contributed to our predicting the next information network state.
Algorithm 1 STGNN for Information Network Prediction
Input: A attributed graph G = ( A , X ) , time slices T
Output: The network state at moment t + 1
  for  r ( t ) , u ( t ) , C ( t ) do
      H ( t ) = u ( t ) H ( t 1 ) + ( 1 u ( t ) ) C ( t )
     for  H ( t )  do
         X ˜ ( t + 1 ) = σ ( W H ( t ) + b )
     end for
  end for
  return given the predicted value X ˜ ( t + 1 )

4.2. Cross-Domain Anomaly Detection

As shown in Figure 2, after obtaining the next attribute values related to the power network, we assigned the attribute values to the power network, as well as the nodes of the physical transmission network to represent the values of the relevant factors that affected the nodes at the future time based on geographical proximity. As shown in Algorithm 2, to use anomaly information of the communication network and the the physical transmission network for the power network anomaly detection. First, we should perform domain adaptation for different domain graphs, which involved learning a domain-invariant representation from the combined samples of the Source and Target domains.
Algorithm 2 Cross-Domain Anomaly Detection
Input: Layer l, node v i
Output: function of cross-domain anomaly detection
    1:
for  r ( t ) , u ( t ) , C ( t )  do
    2:
    h i ( l + 1 ) = σ j N i W · MEAN ( h i ( l ) h j ( l ) )
    3:
   for the latent representation z i of the node i do
    4:
        p i = t a n h ( W d z i + b d ) , y ˜ i = s i g m o i d ( u c T q i )
    5:
       for  y ^ , u do
    6:
           L C = 1 N S i = 1 N S y i ł y ˜ i + ( 1 y i ) log ( 1 y ˜ i )
    7:
       end for
    8:
   end for
    9:
end for
  10:
return  L C
We used GraphSage [25] to construct a shared encoder that extracts a potential representation of each node in the source and target graphs. In a formal manner, in the layer l, the node v i obtained a representation of layer l + 1 by integrating the features of neighboring nodes through the following equation:
h i ( l + 1 ) = σ j N i W · MEAN ( h i ( l ) h j ( l ) )
where N i stands for the set of neighbors for v i .
By stacking multiple GraphSage layers, an encoder that maps the learned nodes from different graphs into a shared embedding space was built. This encoder also facilitated the transfer of knowledge between graphs from different domains.
To enhance the encoder’s domain adaptation capacity, we employed the approach from [28]; here, a domain discriminator was employed to determine whether the node embedding originate in the source or target graph. Then, the encoder was trained adversarially to fool the domain discriminator, effectively performing adversarial domain adaptation as described by [29] in a two-player minimax framework.
The domain discriminator D i s was constructed by an MLP with tanh nonlinearity:
p i = t a n h ( W d z i + b d ) d ˜ i = s i g m o i d ( u d T p i )
where p i is the output of the MLP, y ^ denotes the predicted domain label, and u denotes a trainable weight vector. The discriminator loss could be formulated as follows:
L D = 1 N i = 1 N d i log d ˜ i + ( 1 d i ) log ( 1 d ˜ i )
Here, N represents the total number of nodes in different graphs. d i denotes the domain label of node i.
We closed the differences between discrepant domains via maximizing the above loss function. In other words, the domain labels of nodes in different graphs were not accurately identified by the domain discriminator.
Adapting to learning tasks in other domain, we developed an anomaly classifier following a shared encoder to determine whether a node in the source graph was anomalous or not. The anomaly classifier C l s was formulated through an MLP with tanh nonlinearity and then a sigmoid function:
q i = t a n h ( W c z i + b c ) y ˜ i = s i g m o i d ( u c T q i )
Anomaly classification loss is formulated as follows:
L C = 1 N S i = 1 N S y i log y ˜ i + ( 1 y i ) log ( 1 y ˜ i )
Here, N S represents the number of nodes selected from the labeled source graph. y i is the ground truth anomaly label, and y ˜ i is the predicted anomaly label of node i. The anomaly classifier could be directly utilized to explore anomalies in the target graph after the embedding of the nodes was generated using a shared encoder.
The completed function of cross-domain anomaly detection could be expressed as the following formulas:
L = L D + L C = 1 N i = 1 N d i log d ˜ i + ( 1 d i ) log ( 1 d ˜ i ) 1 N S i = 1 N S y i log y ˜ i + ( 1 y i ) log ( 1 y ˜ i )
By minimizing the loss function, the shared encoder completed the domain shift between the source and target graphs while maintaining a strong anomaly classifier.

5. Performance Evaluation

We evaluated our method using accuracy, precision, recall, and F1. T P was the actual value and was true, yet the model predicted true samples. T N was the actual value and was false, and the model considered the data as false. F N was the actual value and was true, yet the model predicted a sample size. F P was the actual value and was false, yet the model predicted the number as true.
Accuracy refers to the proportion of accurate results predicted by a model to the total sample size.
A c c u r a c y = T P + T N T P + T N + F N + F P
Precision refers to how many samples predicted as positive by the model were true samples of that class.
P r e c i s i o n = T P T P + F P
Recall refers to the proportion of truly authentic data in a sample that is accurately predicted.
R e c a l l = T P T P + F N
F1 refers to harmonic value to perform a comprehensive evaluation of the model.
F 1 = 2 × P r e c i s i o n × R e c a l l P r e c i s i o n + R e c a l l

Experimental Settings

This section verified the performance evaluation of our raised methods via simulation experiments. The several methods compared with our scheme were DTC, SVM-TS, RvNN, BiGCN, and TGNF. Among them, DTC and SVM-TS were machine learning-based detection methods, RvNN was a deep learning-based detection method, and BiGCN and TGNF were graph neural network-based detection methods.
DTC [30]: This method designed statistical features and used a decision tree model for anomaly categorization.
SVM-TS [31]: This method extracted text features of false and distorted data, user features involved in transmitting data, and temporal information and features during the transmission process, and used a linear support vector machine model to determine the authenticity of the data.
RvNN [32]: This method constructs the data transmission process into a bidirectional propagation tree and learns the structural information in the bidirectional propagation tree through a recursive neural network, using it as the basis for classifying abnormal data.
BiGCN [33]: This method used graph convolutional networks to separately study the top-down transmission graph and bottom-up diffusion graph formed during data transmission, to obtain the diffusion and propagation characteristics of events, and aggregated the two to capture the ultimate event representation for abnormal data classification tasks.
TGNF [34]: This method modeled the event propagation process as a dynamic graph, aggregated data structure information at different times through an attention mechanism, and used adversarial learning to focus on the differences between structural information.
Early anomaly detection aimed to accurately determine the authenticity of data transmission in the early stages, which required the method to extract key clues that could distinguish between false and distorted data from a small amount of information. This was another important indicator for measuring the effectiveness of the method. Figure 4 is the result of early anomaly detection in IEEE 118-bus. We could see that, compared to other methods, the STGNN achieved better performance in various periods of early data transmission. With increasing data transmission time, the accuracy of anomaly detection of various methods was improved to varying degrees. This was because, in the early stage of data transmission, the relevant information was relatively scarce, resulting in poor classification performance of the methods. With the transmission and diffusion of data, the available information related to it continued to increase, enabling the method to learn more key features, so the accuracy would continue to rise. Deep learning-based anomaly detection methods exhibited superior classification performance at the beginning of transmission and could achieve high classification accuracy even in situations where available information was scarce. This indicated that, compared to manually designed features, deep learning-based methods could extract clues from limited information that were beneficial for identifying the authenticity of events.
The data in the data set were divided into normal data (N), false data (F), correct data (C), and distorted data (D). According to Table 1 and Table 2, it can be found that, compared to machine learning-based anomaly detection methods, deep learning-based anomaly detection methods have achieved better results in various evaluation metrics. This is mainly because the efficacy of machine learning-based methods is highly dependent on the quality of feature engineering, that is, whether the various features carefully designed by humans are discriminable. This task relies heavily on the professional knowledge of researchers and can only obtain relatively superficial features. Deep learning methods can automatically learn high-level hidden representations in samples, thereby generating more effective representation vectors. Therefore, utilizing deep learning methods to identify anomalies in smart grid networks plays an important role. Secondly, the anomaly detection methods BiGCN, TGNF, and STGNN based on graph neural networks perform better than the traditional deep learning technique RvNN. This is because convolutional neural networks and recurrent neural networks cannot handle non-Euclidean data such as graph data, which makes it difficult for these methods to fully learn the graph structure information during data transmission. Therefore, there is still room for improvement in their results. Our raised STGNN performed better than BiGCN because, although BiGCN considered bidirectional features during data transmission, it does not take into account its dynamics, resulting in its inability to learn temporal features. The STGNN has achieved better performance compared to TGNF because TGNF only focuses on the dynamics of data transmission while ignoring the bottom-up backward diffusion characteristics, whereas the SRGNN can obtain more structural information from bidirectional transmission graphs.

6. Conclusions

Our research presented a smart grid anomaly detection model on the grounds of a spatio-temporal graph neural network. Specifically, the model contained two units, that is, an information network prediction unit and a cross-domain anomaly detection unit. In the first unit, we used the spatio-temporal graph neural network model for the spatial temporal dependencies between several relevant information network nodes above the smart grid to predict the next information network state. In the second unit, we used the predicted state information as attributes of the power network and traffic network, and we used a cross-domain graph anomaly detection model to assist the power network in anomaly detection using tagged anomalies in the communication and traffic networks. Results manifest that the abnormal data detection proportion of our scheme reaches 90% in the initial stage of data transmission and outperforms other comparative methods.
In the future, we can design a scheme for the spatiotemporal highly dependent fusion of smart grids, with the intention of enhancing the diversity of anomaly data detection.

Author Contributions

Conceptualization, J.Q. and X.Z.; methodology, J.Q.; software, T.W.; validation, X.Z., H.H. and T.Y.; formal analysis, S.W.; investigation, J.Q.; resources, X.Z.; data curation, T.W.; writing—original draft preparation, H.H.; writing—review and editing, X.Z.; visualization, S.W.; supervision, T.Y.; project administration, S.W.; funding acquisition, J.Q. All authors have read and agreed to the published version of the manuscript.

Funding

The Key Special Projects of Henan Province (No. 231111212400), the Natural Science Project of the Henan Provincial Department of Education (No. 24B520005), and the Doctoral Fund Project of Henan University of Technology (2023BS032).

Data Availability Statement

The data presented in this study are available in the article.

Acknowledgments

This work is supported by the Key Special Projects of Henan Province (No. 231111212400), the Natural Science Project of the Henan Provincial Department of Education (No. 24B520005), and the Doctoral Fund Project of Henan University of Technology (2023BS032).

Conflicts of Interest

Author Junhong Qiu, Tao Wang and Siyuan Wang were employed by the company XJ Electric Corporation of China Electrical Equipment. The remaining authors declare that the research was conducted in the absence of any commercial or financial relationships that could be construed as a potential conflict of interest.

References

  1. Lee, E.A. Cyber physical systems: Design challenges. In Proceedings of the 2008 11th IEEE International Symposium on Object and Component-Oriented Real-Time Distributed Computing (ISORC), Orlando, FL, USA, 5–7 May 2008; pp. 363–369. [Google Scholar]
  2. Li, D.; Chen, D.; Jin, B.; Shi, L.; Goh, J.; Ng, S. MAD-GAN: Multivariate anomaly detection for time series data with generative adversarial networks. In Proceedings of the 28th International Conference on Artificial Neural Networks, Munich, Germany, 17–19 September 2019; pp. 703–716. [Google Scholar]
  3. Li, B.; Wu, Y.; Song, J.; Lu, R.; Li, T.; Zhao, L. Deepfed: Federated deep learning for intrusion detection in industrial cyber-physical systems. IEEE Trans. Ind. Inform. 2021, 17, 5615–5624. [Google Scholar] [CrossRef]
  4. Devanny, J.; Goldoni, L.; Medeiros, B. The 2019 venezuelan blackout and the consequences of cyber uncertainty. Rev. Bras. Estud. Def. 2020, 7, 2. [Google Scholar] [CrossRef]
  5. Audibert, J.; Michiardi, P.; Guyard, F.; Marti, S.; Zuluaga, M.A. USAD: Unsupervised anomaly detection on multivariate time series. In Proceedings of the 26th ACM SIGKDD Conference on Knowledge Discovery and Data Mining (KDD ’20), Virtual, 23–27 August 2020; pp. 3395–3404. [Google Scholar]
  6. Zhang, X.; Ma, X.; Huyan, N.; Gu, J.; Tang, X.; Jiao, L. Spectral-difference low-rank representation learning for hyperspectral anomaly detection. IEEE Trans. Geosci. Remote Sens. 2021, 59, 10364–10377. [Google Scholar] [CrossRef]
  7. Zheng, Z.; Yang, Y.; Niu, X.; Dai, H.; Zhou, Y. Wide and deep convolutional neural networks for electricity-theft detection to secure smart grids. IEEE Trans. Ind. Inform. 2018, 14, 1606–1615. [Google Scholar] [CrossRef]
  8. Liao, W.; Yang, D.; Wang, Y.; Ren, X. Fault diagnosis of power transformers using graph convolutional network. CSEE J. Power Energy Syst. 2021, 7, 241–249. [Google Scholar]
  9. Qi, P.; Li, D.; Ng, S. MAD-SGCN: Multivariate anomaly detection with self-learning graph convolutional networks. In Proceedings of the 2022 IEEE 38th International Conference on Data Engineering (ICDE), Kuala Lumpur, Malaysia, 9–12 May 2022; pp. 1232–1244. [Google Scholar]
  10. Li, Z.; Wei, Y.; Zhang, Y.; Yang, Q. Hierarchical attention transfer network for cross-domain sentiment classification. Proc. AAAI Conf. Artif. Intell. 2018, 32, 5852–5859. [Google Scholar] [CrossRef]
  11. Shu, Y.; Cao, Z.; Long, M.; Wang, J. Transferable curriculum for weakly-supervised domain adaptation. Proc. AAAI Conf. Artif. Intell. 2019, 33, 4951–4958. [Google Scholar] [CrossRef]
  12. Ding, K.; Shu, K.; Shan, X.; Li, J.; Liu, H. Cross-domain graph anomaly detection. IEEE Trans. Neural Netw. Learn. Syst. 2022, 33, 2406–2415. [Google Scholar] [CrossRef]
  13. Kong, X.; Wang, J.; Hu, Z.; He, Y.; Zhao, X.; Shen, G. Mobile trajectory anomaly detection: Taxonomy, methodology, challenges, and directions. IEEE Internet Things J. 2024, 11, 19210–19231. [Google Scholar] [CrossRef]
  14. Tang, W.; Liu, J.; Zhou, Y.; Ding, Z. Causality-guided counterfactual debiasing for anomaly detection of cyber-physical systems. IEEE Trans. Ind. Inform. 2024, 20, 4582–4593. [Google Scholar] [CrossRef]
  15. Xi, L.; Miao, D.; Li, M.; Wang, R.; Liu, H.; Huang, X. Adaptive-correlation-aware unsupervised deep learning for anomaly detection in cyber-physical systems. IEEE Trans. Dependable Secur. Comput. 2024, 21, 2888–2899. [Google Scholar] [CrossRef]
  16. Li, Z.; Xu, X.; Hang, T.; Xiang, H.; Cui, Y.; Qi, L.; Zhou, X. A knowledge-driven anomaly detection framework for social production system. IEEE Trans. Comput. Soc. Syst. 2024, 11, 3179–3192. [Google Scholar] [CrossRef]
  17. Zhu, H.; Yi, C.; Rho, S.; Liu, S.; Jiang, F. An interpretable multivariate time-series anomaly detection method in cyber-physical systems based on adaptive mask. IEEE Internet Things J. 2024, 11, 2728–2740. [Google Scholar] [CrossRef]
  18. Xu, S.; Yu, H.; Wang, H.; Chai, H.; Ma, M.; Chen, H.; Zheng, W.X. Simultaneous diagnosis of Open-Switch and current sensor faults of inverters in IM drives through reduced-order interval iObserver. IEEE Trans. Ind. Electron. 2024, 1–12. [Google Scholar] [CrossRef]
  19. Wang, D.; Wang, P.; Zhou, J.; Sun, L.; Du, B.; Fu, Y. Defending water treatment networks: Exploiting spatio-temporal effects for cyber attack detection. In Proceedings of the 2020 IEEE International Conference on Data Mining (ICDM), Sorrento, Italy, 17–20 November 2020; pp. 32–41. [Google Scholar]
  20. He, Q.; Zheng, Y.J.; Zhang, C.; Wang, H. MTAD-TF: Multivariate time series anomaly detection using the combination of temporal pattern and feature pattern. Complex 2020, 8846, 608:1–608:9. [Google Scholar] [CrossRef]
  21. Zhao, H.; Wang, Y.; Duan, J.; Huang, C.; Cao, D.; Tong, Y.; Xu, B.; Bai, J.; Tong, J.; Zhang, Q. Multivariate time-series anomaly detection via graph attention network. In Proceedings of the 2020 IEEE International Conference on Data Mining (ICDM), Sorrento, Italy, 17–20 November 2020; pp. 841–850. [Google Scholar]
  22. Deng, L.; Lian, D.; Huang, Z.; Chen, E. Graph convolutional adversarial networks for spatiotemporal anomaly detection. IEEE Trans. Neural Netw. Learn. Syst. 2022, 33, 2416–2428. [Google Scholar] [CrossRef]
  23. Akoglu, L.; Tong, H.; Koutra, D. Graph based anomaly detection and description: A survey. Data Min. Knowl. Discov. 2015, 29, 626–688. [Google Scholar] [CrossRef]
  24. Xu, K.; Hu, W.; Leskovec, J.; Jegelka, S. How powerful are graph neural networks? In Proceedings of the 7th International Conference on Learning Representations, New Orleans, LA, USA, 6–9 May 2019. [Google Scholar]
  25. Hamilton, W.L.; Ying, Z.; Leskovec, J. Inductive representation learning on large graphs. Adv. Neural Inf. Process. Syst. 2017, 30, 1024–1034. [Google Scholar]
  26. Seo, Y.; Defferrard, M.; Vandergheynst, P.; Bresson, X. Structured sequence modeling with graph convolutional recurrent networks. In Proceedings of the Neural Information Processing: 25th International Conference, ICONIP 2018, Siem Reap, Cambodia, 13–16 December 2018; pp. 362–373. [Google Scholar]
  27. Chung, J.; Gülçehre, Ç.; Cho, K.; Bengio, Y. Empirical evaluation of gated recurrent neural networks on sequence modeling. arXiv 2014, arXiv:1412.3555. [Google Scholar]
  28. Goodfellow, I.J.; Pouget-Abadie, J.; Mirza, M.; Xu, B.; Warde-Farley, D.; Ozair, S.; Courville, A.C.; Bengio, Y. Generative adversarial nets. In Proceedings of the NeurIPS 2014, Montreal, QC, Canada, 8–13 December 2014; pp. 2672–2680. [Google Scholar]
  29. Pan, S.; Hu, R.; Fung, S.; Long, G.; Jiang, J.; Zhang, C. Learning graph embedding with adversarial training methods. IEEE Trans. Cybern. 2020, 50, 2475–2487. [Google Scholar] [CrossRef]
  30. Castillo, C.; Mendoza, M.; Poblete, B. Information credibility on twitter. In Proceedings of the 20th International Conference on World Wide Web, Hyderabad, India, 28 March–1 April 2011. [Google Scholar] [CrossRef]
  31. Ma, J.; Gao, W.; Wei, Z.; Lu, Y.; Wong, K. Detect rumors using time series of social context information on microblogging websites. In Proceedings of the 24th ACM International on Conference on Information and Knowledge Management, Melbourne, Australia, 18–23 October 2015. [Google Scholar] [CrossRef]
  32. Ma, J.; Gao, W.; Mitra, P.; Kwon, S.; Jansen, B.J.; Wong, K.; Cha, M. Detecting Rumors from Microblogs with Recurrent Neural Networks. JCAI. 2016. Available online: http://www.ijcai.org/Abstract/16/537 (accessed on 27 February 2025).
  33. Bian, T.; Xiao, X.; Xu, T.; Zhao, P.; Huang, W.; Rong, Y.; Huang, J. Rumor detection on social media with bi-directional graph convolutional networks. AAAI 2020, 34, 549–556. [Google Scholar] [CrossRef]
  34. Song, C.; Shu, K.; Wu, B. Temporally evolving graph neural network for fake news detection. Inf. Process. Manag. 2021, 58, 102712. [Google Scholar] [CrossRef]
Figure 1. Several information networks with the same topology measured by power network sensors.
Algorithms 18 00166 g001
Figure 2. Framework of our STGNN-based cross-domain anomaly detection model.
Algorithms 18 00166 g002
Figure 3. Strutural diagram of the STGNN.
Algorithms 18 00166 g003
Figure 4. Result of early anomaly detection in IEEE 118-bus.
Algorithms 18 00166 g004
Table 1. Results of various indicators in IEEE 118-bus.
ModelAccuracyEvent TypePrecisionRecallF1
DTC0.473F0.8260.8140.821
N0.8130.8240.847
SVM-TS0.574F0.8010.8870.894
N0.8750.8240.847
RvNN0.737F0.9080.890.899
N0.8970.9140.905
BiGGCN0.861F0.9210.920.915
N0.920.9190.914
TGNF0.897F0.9480.9370.942
N0.9380.9490.944
STGNN0.892F0.9510.960.955
N0.960.9510.955
Table 2. Experimental results of F1 in IEEE 118-bus.
ModelAccuracyF1
D F C N
DTC0.4730.2540.080.190.482
SVM-TS0.5740.7550.420.5710.526
RvNN0.7370.6620.7430.8350.708
BiGGCN0.8610.7720.8670.9310.861
TGNF0.8970.9130.8570.9380.876
STGNN0.8920.9050.8930.9080.897
Disclaimer/Publisher’s Note: The statements, opinions and data contained in all publications are solely those of the individual author(s) and contributor(s) and not of MDPI and/or the editor(s). MDPI and/or the editor(s) disclaim responsibility for any injury to people or property resulting from any ideas, methods, instructions or products referred to in the content.

