Article

Spatial Shape-Aware Network for Elongated Target Detection

1
Smart Urban Future Laboratory, Zhejiang University, University of Illinois Urbana-Champaign Institute, Haining 314400, China
2
Zhejiang Provincial Engineering Research Center for Multimodal Transport Logistics Large Models, Haining 314400, China
*
Author to whom correspondence should be addressed.
Algorithms 2025, 18(3), 125; https://doi.org/10.3390/a18030125
Submission received: 6 January 2025 / Revised: 5 February 2025 / Accepted: 7 February 2025 / Published: 21 February 2025
(This article belongs to the Section Combinatorial Optimization, Graph, and Network Algorithms)

Abstract

:
In remote sensing detection, targets often exhibit unique characteristics such as elongated shapes, multi-directional rotations, and significant scale variations. Traditional convolutional networks extract features using convolution kernels and rely on predefined anchor boxes and sample selection to frame the targets. However, this approach leads to several issues, including imprecise regional feature extraction, the neglect of object shape information, and variations in the potential of positive samples, all stemming from shape variations, ultimately impacting the detector’s performance. To overcome these challenges, we propose a novel Spatial Shape-Aware Network for Elongated Target Detection. Specifically, we introduce three key modules: a Boundary-Guided Spatial Feature Perception Module (BGSF), a Shape-Sensing Module (SSM), and a Potential Evaluation Module (PEM). The Boundary-Guided Spatial Feature Perception Module adjusts the sampling positions and weights of convolution kernels, aligning the feature maps produced by the backbone network to the actual shape and location of the target, while reducing feature responses to irrelevant noise. The Shape-Sensing Module incorporates shape information into the sample selection process, allowing high-potential anchor boxes—which may have low IoU but capture critical target features—to be temporarily retained for further training. The Potential Evaluation Module integrates the potential information of positive samples into the loss function, providing stronger training feedback for high-potential positive samples. Experiments demonstrate that, compared with existing detection networks, our proposed network structure achieves superior detection performance on two widely used datasets, UCAS-AOD and HRSC2016.

1. Introduction

Remote sensing (RS) detection, which obtains valuable information from visible light RS imagery captured by devices such as drones, is a key area of current research. It has broad applications in various fields, including surface ecological status detection, geological change detection, structural health monitoring, and intelligent transportation. The rapid advancement of UAV technology, coupled with the increased performance of graphics processing units, has been a growing demand for processing RS imagery in recent years. Consequently, neural network-based object detection algorithms have gained significant attention and widespread application.
Existing RS detection frameworks can be broadly categorized into single-stage and two-stage detection. Single-stage detection uses predefined anchor boxes for rotated target detection, which requires a large number of anchor boxes. Convolutional operations are then applied to extract image features, followed by regression and classification to determine the target’s position. Single-stage algorithms, including YOLO [1] and SSD [2], have been the starting point for many subsequent improvements. FE-YOLOv5 [3] introduces a global attention mechanism to reduce information loss and capture more discriminative features for small targets. It also employs a spatial attention module that uses sparse sampling and adaptive filtering to address the issue of small targets being overwhelmed by background noise in RS detection. MRFF-YOLO [4] method introduces a multi-receptive field algorithm and the Res2Net and DenseNet modules, which represent multi-scale features with finer granularity at each layer, increase the receptive field range, and enhance feature propagation, thereby improving the detection capability of small targets in RS scenes without adding depth to the network. PAG-YOLO [5] incorporates an attention mechanism to highlight the importance of specific target categories or regions by adjusting the resource allocation weights, demonstrating superior performance in complex scenes or when there are many object categories. Reppoints [6] discards the traditional anchor box approach and directly regresses the target boundary points for localization. In two-stage detection, potential candidate regions are first screened, followed by preliminary regression and classification. Positive candidate regions are then selected and passed to pooling layers for feature extraction, leading to refined regression and classification. R-CNN [7] is a representative two-stage algorithm that initially generates candidate regions through a selective search and then performs scale normalization, and finally, features are extracted for the classification of the support vector machine and the regression of the bounding box. DONG et al. [8] proposed an improved NMS module that does not directly discard detection boxes with a high IoU with the optimal box, but rather penalizes their confidence scores, allowing them to be considered in subsequent selections. This approach helps retain small targets in RS detection in overlapping regions, reducing false negatives. REN et al. [9] optimized sensitivity to small and partially occluded targets through a multi-layer feature fusion mechanism. They combined features from different depths via skip connections, which improved detection accuracy for partially occluded targets in RS imagery.
In the context of traditional convolutional neural networks (CNNs), the primary limitation in detecting elongated targets in remote sensing imagery arises from the mismatch between detection network and the varying geometries of elongated targets. These anchor boxes are typically designed for objects with standard aspect ratios and fixed orientations, which makes them ineffective in accurately capturing the features of elongated and rotated objects. This misalignment leads to poor feature extraction and the failure to capture critical shape and directional information, significantly reducing the detection accuracy for elongated targets. Furthermore, traditional methods often rely on fixed Intersection over Union (IoU) thresholds for anchor box selection, which fails to account for the unique characteristics of elongated objects. As a result, anchors that may contain important features are discarded simply due to minor changes in their angle or aspect ratio. This issue exacerbates the challenge of detecting objects with extreme elongation or multi-directional rotation, which is common in remote sensing imagery.
Label assignment methods, using specific IoU-based adaptive assignment strategies, alleviate this issue, making detection more shape-adaptive. Meanwhile, label assignment methods have gained popularity as a research focus due to their ability to improve detection accuracy without significantly increasing complexity, and they can be easily integrated into other detectors. RS detection networks assign labels to positive and negative samples by setting anchor boxes or point sets on feature maps, based on the spatial relationship between ground truth boxes and predefined boxes. Ming et al. [10] pointed out that different sample assignment strategies affect detection accuracy and proposed a dynamic anchor box assignment (DAL) method, which uses a positive–negative sample metric factor to evaluate the positioning ability of anchor boxes for a better sample assignment. ATSS [11] adaptively selects the most representative anchor boxes as positive samples based on statistical properties (e.g., center distance and IoU distribution) of each candidate box and the true boxes. ATSS reduces reliance on hyperparameters and enables the model to focus more accurately on effective training samples, thereby significantly improving accuracy and efficiency of detection. The OTA method [12] frames label assignment as an Optimal Transport (OT) problem, defining the unit transportation cost between anchors and ground truth boxes as a weighted combination of regression and classification losses. Through cost minimization, OTA achieves globally optimal label assignment in one-to-many matching scenarios. However, research regarding these typically addresses the stages of feature extraction and anchor box assignment independently, neglecting the impact of the actual content of the intersection between predefined anchor boxes and targets on the assignment strategy. This oversight is particularly evident in the following three aspects as shown in Figure 1.
(1)
Feature Level—Within Anchor Boxes: When detecting complex shapes, especially elongated objects, convolution operations introduce significant background noise, resulting in insufficient and inaccurate feature extraction for the target.
(2)
Instance Level—Anchor Box Properties: Methods based on IoU thresholds to filter anchor boxes may ignore shape information. Minor changes in the anchor box’s angle can cause significant fluctuations in IoU, leading to the exclusion of potentially high-quality anchor boxes.
(3)
Potential Level—Outside Anchor Boxes: Existing methods do not consider the potential differences between positive samples. Internal feature points of the target usually carry more semantic and classification information compared to boundary or external points, especially when the object is elongated, causing feature points to cluster near the long edges, thus exacerbating the issue.
Figure 1. Illustration of key challenges and solutions for detecting elongated targets in remote sensing imagery. The left panel highlights the challenge of noise interference during feature sampling for elongated targets. The middle panel emphasizes the necessity of shape adaptive anchor box selection during training for slender object detection. The right panel illustrates the issue of significant differences in anchor box potential caused by the content enclosed within the anchor boxes for high-aspect-ratio targets in complex scenarios. These challenges form the foundation of the research questions tackled in this study.
Algorithms 18 00125 g001
We propose a novel shape-aware elongated target detector to address these challenges. At the feature level, we introduce a Boundary-Guided Spatial Feature Perception Module (BGSF), which is part of the detection head rather than embedded within the backbone network. This reduces the algorithm’s complexity. The detector uses this module to improve feature extraction and achieve better feature coverage. BGSF uses ground truth box boundary information along with classification information to guide the training and optimization of the anchor box offsets and positions. At the instance level, in addition to considering the traditional IoU factor, we incorporate the overall shape of the target into the assignment process. We introduce a Shape-Sensing module (SSM) that calculates a shape coefficient derived from the aspect ratio properties of the ground truth box, which serves as a factor for determining the threshold for positive sample assignment. This threshold is dynamically adjusted according to new statistical features from the generated positive samples. Furthermore, at the comparison level, we introduce a Potential Evaluation Module (PEM) that estimates the relative position of anchor boxes on the target based on statistical information from the predicted samples. This module assesses the potential of each sample and reflects the importance of different potential anchor boxes in the loss function. Our contributions are as follows:
(1)
We introduce a Boundary-Guided Spatial Feature Perception Module in the detection head to adjust the output of the backbone network for generating class and position information.
(2)
We propose a shape-sensing sample selection module that adjusts the discrimination threshold based on aspect ratio, allowing low-IoU anchor boxes with regression potential to be temporarily retained.
(3)
We introduce a Potential Evaluation Module that evaluates the potential of positive samples and provides stronger training feedback for high-potential positive samples.

2. Literature Review

Due to the current limitations of convolutional structures, such as insufficient feature extraction and the inability of predefined boxes to accurately describe the pose, shape, and distribution of targets, existing deep learning detectors face difficulties in precisely and compactly locating targets with complex poses, irregular shapes, and varying scales. To address these issues, current research focuses on several aspects of improvement, including more accurate feature extraction, candidate box generation and feature alignment, regression optimization, and label assignment. The advantages and disadvantages of the relevant detection methods, as well as the application stage analysis, are shown in Table 1.
In the field of more precise feature extraction and representation for targets, deformable convolution [13] has significantly improved the CNN’s ability to model geometric transformations by introducing additional offsets that alter the spatial sampling positions within the module. This approach learns the offsets from existing task supervision information, eliminating reliance on supplementary information, and has shown better performance in complex visual tasks. Pan et al. [14] introduced an adaptive optimization network comprising a feature selection module (FSM) and a dynamic refinement head (DRH), aimed at identifying rotated and closely arranged targets. FSM facilitates the calibration of neurons’ receptive fields based on the target’s configuration and orientation, which ensures accurate feature routing to the detection head. Meanwhile, DRH equips the model to adjust and make predictions dynamically in response to the characteristics of each object, enhancing adaptability in reasoning for unique targets. Deng et al. [15] proposed an innovative approach to multi-scale object detection. Firstly, to enhance the diversity of receptive fields, they redesigned the feature extractor. This is followed by a multi-scale object candidate region generation network (MS-OPN) that generates candidate regions from intermediate layers with different receptive fields. A refined object detection network (AODN) then processes these regions based on fused feature maps, resulting in stronger responses for small and dense objects. R3DET [16] introduces a feature refinement module (FRM) that realigns features by reconstructing the feature map, mitigating the sensitivity of IoU to changes in rotational angle and thus improving performance in dense scenes and tasks with high aspect ratios. Cheng et al. [17] applied two regularizers to CNN features. The rotation-invariant regularizer forces the CNN feature representations of training samples before and after rotation to be closely mapped, achieving rotational invariance. The Fisher discriminative regularizer constrains CNN features to have smaller intra-class variance and larger inter-class separation, thereby enhancing the extraction of class-specific information.
In the area of candidate box generation and feature alignment, RRPN [18] improves upon Faster R-CNN by proposing a novel framework that generates slanted anchor boxes during the initial stage and adjusts the angles during learning for bounding box regression, improving the detection of rotated objects. However, this approach struggles with multi-angle, variably sized, and densely distributed RS targets. Guide Anchor [19] employs an anchor box generation module with position and shape prediction branches to generate object position probability maps and object shapes for high-probability regions. Additionally, it introduces a feature-adaptive module that uses predicted offsets for deformable convolutions to address feature inconsistency, thus enabling more efficient handling of complex visual tasks in intricate scenes. AlignDet [20] points out that Im2col operation in single-stage detectors is essentially a special form of RoIAlign that implicitly aligns bounding boxes, but is inefficient. To address this, AlignDet proposes the ROI-Conv module, which replaces standard convolutions by predefined convolutional offsets at specific locations on the feature map. This enables single-stage detectors to perform dense feature alignment similar to two-stage detectors. ReDet [21] incorporates a rotation-equivariant network into the backbone, followed by a new rotation-invariant RoI alignment (RiRoI Align) method, that distorts and aligns region features for a better extraction of directional information. RADet [22] identifies the high efficiency of the traditional mask branch in detecting multi-directional targets, utilizing the mask branch to predict the shape information of the target for generating rotational bounding boxes without the need for predefined rotational anchor boxes, thereby reducing computational load.
In terms of regression optimization, APE [23] uses two 2D periodic vectors to represent angular information in rotated bounding boxes, simplifying the angle computation process. A new cascading R-CNN method was subsequently proposed, employing a length-independent IoU (LIIoU) to detect long target objects. This allows detectors that only cover part of the target in the first stage to be considered positive samples, thereby generating longer bounding boxes and improving the detection of high-aspect-ratio rotated targets. PolarDet [24] points out that traditional parameter regression methods can cause a significant drop in the network’s convergence performance. To address this, it introduces a rotational bounding box representation using polar coordinates, utilizing multiple angles and short-polar-diameter ratios to represent the target. This approach allows the network to increase the angle loss and avoid the convergence performance degradation caused by the sharp variations in target size and aspect ratio. PIoU [25] highlights that the loss calculated by the traditional five-parameter method is inconsistent with the IoU value. Specifically, even when the IoU value differs significantly, the loss can remain the same due to the excessive optimization of the angular error. Therefore, PIoU computes the IoU pixel-by-pixel, improving the consistency between the loss and IoU values.
In terms of label assignment, SASM strategy [26] proposes shape-adaptive selection (SA-S) and shape-adaptive measurement (SA-M) strategies, using a new decision threshold based on shape information to dynamically select samples and evaluate the potential of positive samples based on normalized shape distances, thus distinguishing the potential of positive samples more effectively and considering the target’s shape information in label assignment. RFLA [27] models the receptive field of each feature point as a Gaussian distribution and introduces a novel receptive field distance (RFD) to directly measure the similarity between the Gaussian receptive field and the target object. Based on the RFD, the method designs a hierarchical label assignment (HLA) module. This approach ensures that the distribution of feature points aligns more closely with the actual distribution of the target, thereby improving the effectiveness of detecting small targets. TOOD [28] redefines the label assignment scheme and loss function to provide training signals that incorporate both classification and regression information. These signals are then passed to a new detection head to compute interaction features for the classification and regression tasks. This allows for the alignment of the spatial distributions of features learned by both tasks from the convolutional layers, thus better coordinating the two tasks and obtaining the optimal anchor box for both tasks.
Table 1. A review of the research on rotating object detection.
ReferenceContributionLimitationImprovement Stage
[13]A new convolution kernel sampling pattern is designed to enhance feature extraction.May introduce unnecessary computational costs in simple scenarios.
[14]Flexible adjustment of receptive field; Dynamic modeling for target shapes and orientations.Increased computational complexity due to dynamic modules, resulting in slower inference speed.
[15]Fused multi-level feature maps, enabling the network to handle targets of varying sizes in remote sensing images.No significant improvement in simpler scenarios, possibly increasing algorithm complexity.Improvement in feature extraction for remote sensing detection.
[16]Introduced feature refinement module (FRM), addressing sensitivity to rotation angles in traditional IoU methods.Sensitive to hyperparameter settings.
[17]Introduced regularizers to shallow features, enhancing the extraction of rotation-invariant features and class-specific information.Increased algorithmic complexity.
[18]Introduced rotational anchor box generation mechanism in two-stage detection.Limited rotation parameters, excessive redundant rotational boxes.
[19]Generated sparser and shape-variable anchor boxes.Performance suffers with scale-imbalanced detection objects.
[20]Enhanced feature alignment ability in single-stage detectors.Introduced extra hyperparameters, increasing computational complexity.Improvement in candidate region generation and feature alignment.
[21]Designed rotationally invariant networks and a Rotationally Invariant RoI Align (RiRoI Align) method.Minimal improvements in simple scenarios, increased algorithm complexity.
[22]Using a mask branch for shape prediction to generate rotational bounding boxes.Suffered from boundary discontinuity issues.
[23]Simplified angle calculation, alleviating discontinuity and parameter inconsistency in rotation box regression.The structure is complex, resulting in slower detection speed.
[24]Proposed a polar-coordinate-based rotation box representation.Requires a dataset specifically designed for polar-coordinate-based representation.Improvement in regression optimization.
[25]Introduced a pixel-wise IoU calculation method, optimizing the loss function.Faces boundary-related issues that could arise when targets are too small or have extreme rotations.
[26]Introduced shape-adaptive selection and shape-adaptive measurement strategies for sample selection and training.Inaccurate or insufficient shape information may affect sample selection effectiveness.
[27]Proposed a new Gaussian distribution-based label assignment approach.The receptive field in a few scenes may not follow the Gaussian distribution assumption.Improvement in label assignment stage.
[28]Redesigned the detection head to better align the features learned for classification and regression tasks.Introducing additional complexity in the detection head results in increased computational overhead and slower inference.

3. Method

In our research, we focus on the issue of inadequate content analysis within anchor boxes for detecting elongated and rotated targets in RS tasks. To address this challenge, we introduce a Boundary-Guided Spatial Feature Sampling Module (BGSF), a Shape-Sensing Module (SSM), and a Potential Comparison Module (PEM). Specifically, BGSF utilizes supervisory information to guide the sampling positions of convolutional kernels, making feature extraction more aligned with the true shape of the target. To select samples adaptively, SSM modifies the decision threshold according to the shape features of the object. Subsequently, PEM estimates the potential of positive samples by evaluating their standardized shape distance relative to the target. The pipeline of the method is shown in Figure 2.
The datasets used in this study, namely HRSC2016 [29] and UCAS-AOD [30], may contain inherent biases that could influence model performance. To ensure the robustness of SSAD-Net, we employed data augmentation techniques to simulate the variations in visual conditions encountered in real-world scenarios. These included scaling, rotation, and flipping operations to accommodate different target orientations and scales. Additionally, we applied normalization to standardize the input images, ensuring consistency across different types of remote sensing data.

3.1. Boundary-Guided Spatial Feature Perception Module

When the target object is elongated and curved, its complex geometry may lead to incomplete and inaccurate coverage throughout the feature extraction process. Consequently, this situation enables convolutional kernels to assimilate substantial background noise, complicating the accurate capture of the target’s specific regional features and shape details, which ultimately results in inaccurate geometric localization. Additionally, during feature extraction, the contribution of each pixel differs, indicating that the convolutional process may be disrupted by noise from less significant pixels.
Figure 2. The design of the Shape-Aware Network (SSAD-Net) targets the detection of elongated objects. The input image undergoes processing via the ResNet50 backbone network and a multi-scale feature pyramid. The modules work collaboratively to optimize feature extraction, anchor selection, and loss computation, enabling precise detection of elongated targets, as shown in the lower examples with ships and orientation-aligned anchors.
Algorithms 18 00125 g002
To optimize the feature extraction process for complex-shaped targets, we introduce a novel Boundary-Guided Spatial Feature Perception Module (BGSF). In addition to the standard feature extraction by convolution, BGSF incorporates a learnable parameter, Δ d k and a weight factor w k 2 , which represent the positional offset and weight information, respectively. Here, p represents the sampling position at the center of the convolution kernel, and Δ p k to spread into complex, non-grid shapes. The weight factor denotes the relative position of the sampling points to position. For each output value y ( p ) , the sampling positions are initially derived from the center of the original convolution kernel, but with an added offset Δ d k . This adjustment allows the sampling positions, Δ p k , to spread into complex, non-grid shapes. The weight factor w k 2 allocates weights to each sampling position, specifically assigning lower weights to pixels with minimal potential contribution to the target information, thereby mitigating noise impact. The relationship between the output value y ( p ) and the sampling points x is defined as follows:
y p = k = 1 K ω k · ω k 2 · x p + p k + Δ d k
Here, the offset Δ p k and w k 2 are obtained through two separate convolutional layers. Initially, a standard feature map is produced from the input, which is then augmented by layers that calculate the offset map and a weight map with dimensions 2 k , matching the input feature map’s size. The weight factor is then normalized using an activation function to confine its values to the range [ 0 , 1 ] . The parameter k matches the size of the convolution kernel, enabling the deformable convolution to be compatible with other typical convolutional setups.

3.2. Shape-Sensing Module

In remote sensing contexts, frequently encountered targets like vehicles and ships usually display elongated shapes and multiple directions of rotation. Traditional sampling methods generally depend on static IoU thresholds to separate positive from negative samples. However, these fixed thresholds, designed with standard anchor boxes in mind, may not fully accommodate the unique characteristics of elongated targets. Although this approach simplifies the implementation, it risks incorrectly eliminating anchor boxes with lower IoU values that may still represent high-potential samples with essential features.
To address this limitation, we introduce the Shape-Sensing module (SSM) that dynamically recalibrates the IoU calculations to reflect the target’s shape and feature distribution more accurately. First, we introduce a dynamically computed IoU threshold for each true bounding box, enabling the IoU value to better reflect the specific geometric features of elongated targets. For the i-th true bounding box, the IoU threshold T i I o U is computed as
T i I o U = f ( α i ) · J ¯ + σ 2
where
J ¯ = 1 J j = 1 J G i , j , σ = 1 J j = 1 J ( G i , j J ¯ ) 2
where J represents the total count of predicted boxes, and G i , j denotes the IoU value between the i-th ground truth box and the j-th predicted box. J ¯ represents the mean IoU value for the predicted boxes with respect to the i-th true bounding box. σ indicates the standard deviation of these IoU values.
As previously analyzed, elongated targets tend to exhibit lower IoU values as their aspect ratios increase, causing them to be mistakenly excluded. By incorporating a weight factor, the IoU threshold dynamically decreases for targets with higher aspect ratios, ensuring that elongated targets are paired with anchor boxes that better match their unique geometry. To adjust for the effect of the aspect ratio, we introduce a weight adjustment function, f ( α i ) , defined as
f ( α i ) = e γ i w
where w is an empirically determined constant, set to 4 in our experiments, used to adjust the scaling factor for aspect ratios. γ i denotes the aspect ratio of the target, defined as the ratio of the longest to the shortest side of the actual bounding box.
This function ensures that elongated targets receive appropriately scaled weight adjustments, preventing the IoU threshold from being excessively reduced. When the data predominantly contain targets with large aspect ratios, this approach effectively assigns suitable thresholds, enhancing the overall detection performance.

3.3. Anchor Potential Comparison Module

Compared to points located within the interior of a target object, points near the object’s boundary tend to include more background information or even information from nearby targets. The points located deep within the object, distant from its boundary, especially those near the target’s centroid, are better representatives of the object’s features than points near its boundary. Assigning uniform weights to all positive samples could cause high-potential positive samples located farther from the object’s center to be overwhelmed by low-potential background points which are closer to the center. For instance, in remote sensing contexts that deal with targets characterized by high aspect ratios, critical points on the long edges of the objects that are far from the center could be suppressed by background points on the short edges near the center. This analysis underscores that the identification of each point is intimately connected not only with its proximity to the object’s center but also with the characteristics of the object’s shape.
To reflect the quality differences among positive samples during neural network training, we propose SSM to extract and utilize the potential information of each sample. Specifically, the potential of a sample being positive is calculated based on its standardized distance from the center of the targets. The standardized distance is calculated using the Euclidean distance between the centers of the target and the positive sample, combined with the shape information of the target. Five parameters ( x , y , w , h , θ ) are used to represent each ground truth box, where ( x , y ) are the center coordinates of the target, w is the length of the long side of the ground truth box, h is the length of the short side, and θ is the angle of rotation. The standardized values of w and h along the x-axis or y-axis are determined by the angle θ rotation angle. The standardized shape distance between the i-th object and the center of the j-th positive sample is calculated as follows:
Δ D i j = ( x i x j ) 2 ω i + ( y i y j ) 2 h i i f 0 θ i π / 2 ( x i x j ) 2 h i + ( y i y j ) 2 ω i o t h e r w i s e
where ( x i , y i ) are the coordinates of the object’s center. ( x j , y j ) are coordinates of the positive sample. ( ω i , h i ) are the width and height of the ground truth. θ i represents the rotation angle of the object. Once the standardized shape distance is obtained, the potential of the positive sample, P i j , is calculated using an activation function (sigmoid function):
P i j = 1 1 + e Δ D i j
Through the standardization of shape distances, each positive sample is assigned unique potential information. This approach alleviates the suppression of high-potential positive samples, which are critical for representing important target features, by low-potential background points near the object’s center. As a result, it mitigates issues in high-aspect-ratio remote sensing targets where key features on the long edges are overshadowed by less relevant short-edge points near the center.

4. Loss Functions

4.1. Regression Loss Function Design

The regression task for this study focuses on predicting the precise locations of target objects. To ensure scale invariance and position invariance, thereby providing consistent training feedback for samples of different sizes and locations, we adopt a distance vector Δ = ( d x , d y , d w , d h , d θ ) approach as follows:
d x = ( t x b x ) / b w , d y = ( t y b y ) / b h
d w = l o g ( t w / b w ) , d h = l o g ( t h / b h )
d θ = t a n ( t θ ) t a n ( b θ )
Here, the ground truth bounding box and the predicted bounding box are represented by b and g, respectively. t x , t y , t w , t h , t θ represent the ground truth values for the center coordinates, width, height, and angle. b x , b y , b w , b h , b θ are predicted values for the corresponding parameters. The regression loss L reg is calculated as the sum of the Smooth L 1 losses for these residuals across the five parameters in Δ , given by
L reg = i = 1 5 L smooth ( Δ g Δ p i )
The L smooth is defined as
L smooth ( x ) = 0.5 x 2 if | x | < 1 | x | 0.5 otherwise
where Δ p i represents the distance vector of the predicted box while Δ g represents the distance vector of the ground truth box. The discrepancy between ground truth boxes and predicted bounding boxes is measured using Smooth L 1 loss, ensuring numerical stability and robustness against outliers.
By leveraging the Smooth L 1 loss, the model achieves balanced optimization, where large residuals are penalized less severely than by L 2 loss, and small residuals are effectively minimized. This design facilitates more precise boundary regression.

4.2. Classification Loss Function Design

The classification loss is calculated as
L i c = 1 N + 1 s j S + P i j i j P i j L i j c l s
where j is the index of the sample associated with the i-th detection object. s j represents the predicted box corresponding to the parameter j. N + represents the total number of prediction boxes assigned to the i-th prediction object. S + represents the set of positive sample–anchors assigned to the i-th object. P i j is the potential evaluation weight for the positive sample–anchor pair. L i j c l s is the Focal loss function [31].

4.3. Total Loss Function Design

The total loss is calculated as
L = λ 1 L c + λ 2 L R
where L c represents classification loss. L R represents regression loss. λ 1 , λ 2 are the balancing coefficients set to 1.0 and 0.5, respectively, based on empirical results. The regression loss L i R is expressed for the i-th object as follows:
L i R = 1 N + · 1 s j S + P i j i j P i j L i j r e g
where L i j r e g is the smooth L 1 regression loss between the ground truth and predicted bounding boxes. P i j is the weight determined by the potential evaluation metric.

5. Parameter Settings

Mean Average Precision (mAP): An image may contain multiple object categories, with each target exhibiting significant randomness in its position, distribution, shape, and size in object detection tasks involving non-natural scenes. The goal is to detect every object in the image, regardless of its category, while minimizing false detections. To address these aspects, precision (P) and recall (R) are introduced as key evaluation metrics:
Precision = T P T P + F P = True Positives True Positives + False Positives
Recall = T P T P + F N = True Positives True Positives + False Negatives
where T P is True Positive, the correctly detected objects. F P is False Positive, the incorrectly detected objects. F N is False Negative, the ground truth objects that were missed. Using two separate metrics to evaluate a model’s performance often complicates the quantitative comparison of different models. Therefore, a single comprehensive metric is needed to balance both precision and recall. For a well-trained model, precision and recall typically exhibit an inverse relationship. To address this, a PR curve is constructed with P and R as its axes, and the area under this curve, known as the Average Precision (AP), is used as a unified metric. This approach effectively integrates the influence of both precision and recall on detection performance. The calculation method is as follows:
A P = 0 1 P ( R ) d R
where P(R) is the precision at a given recall level. A single-object detection model may detect multiple categories, so we require an overall evaluation metric that considers the detection performance across all categories. The mean Average Precision (mAP) is defined as
m A P = i = 1 C A P i C
where A P i is the Average Precision for the i-th category. C is the number of categories.
Frames Per Second (FPSs): Apart from detection accuracy, a critical performance evaluation metric is obtained by processing the speed of the model. For this purpose, FPSs are introduced to estimate the processing speed of the network. FPSs measure how many images are processed per second by the model, offering a practical indication of real-time performance.

6. Experimental Setup

We utilized ResNet-50 as the backbone network for our model. Multi-scale detection employed feature pyramid levels P3 to P7. The IoU threshold for positive sample selection was set to 0.5. The batch size was configured to 16, and the model was trained for a total of 100 epochs.
For backpropagation, the Adam optimization algorithm was used. The initial learning rate was set to 0.001 and decayed by a factor of 10 after 1000 iterations. The momentum parameter was set to 0.9. All experimental trials were carried out on a server configured with an NVIDIA 4090 GPU, utilizing the PyTorch framework.

7. Results and Discussion

7.1. Ablation Study Analysis

(1)
Ablation Study on Module Effectiveness
Ablation studies were carried out on the HRSC2016 and UCAS-AOD datasets to assess the impact of different modules on performance. The results on the HRSC2016 dataset are presented in Table 2. An mAP of 85.1% was achieved by the baseline model, primarily because standard CNN convolution structures struggle to effectively model and extract features for elongated targets with multiple rotational directions.
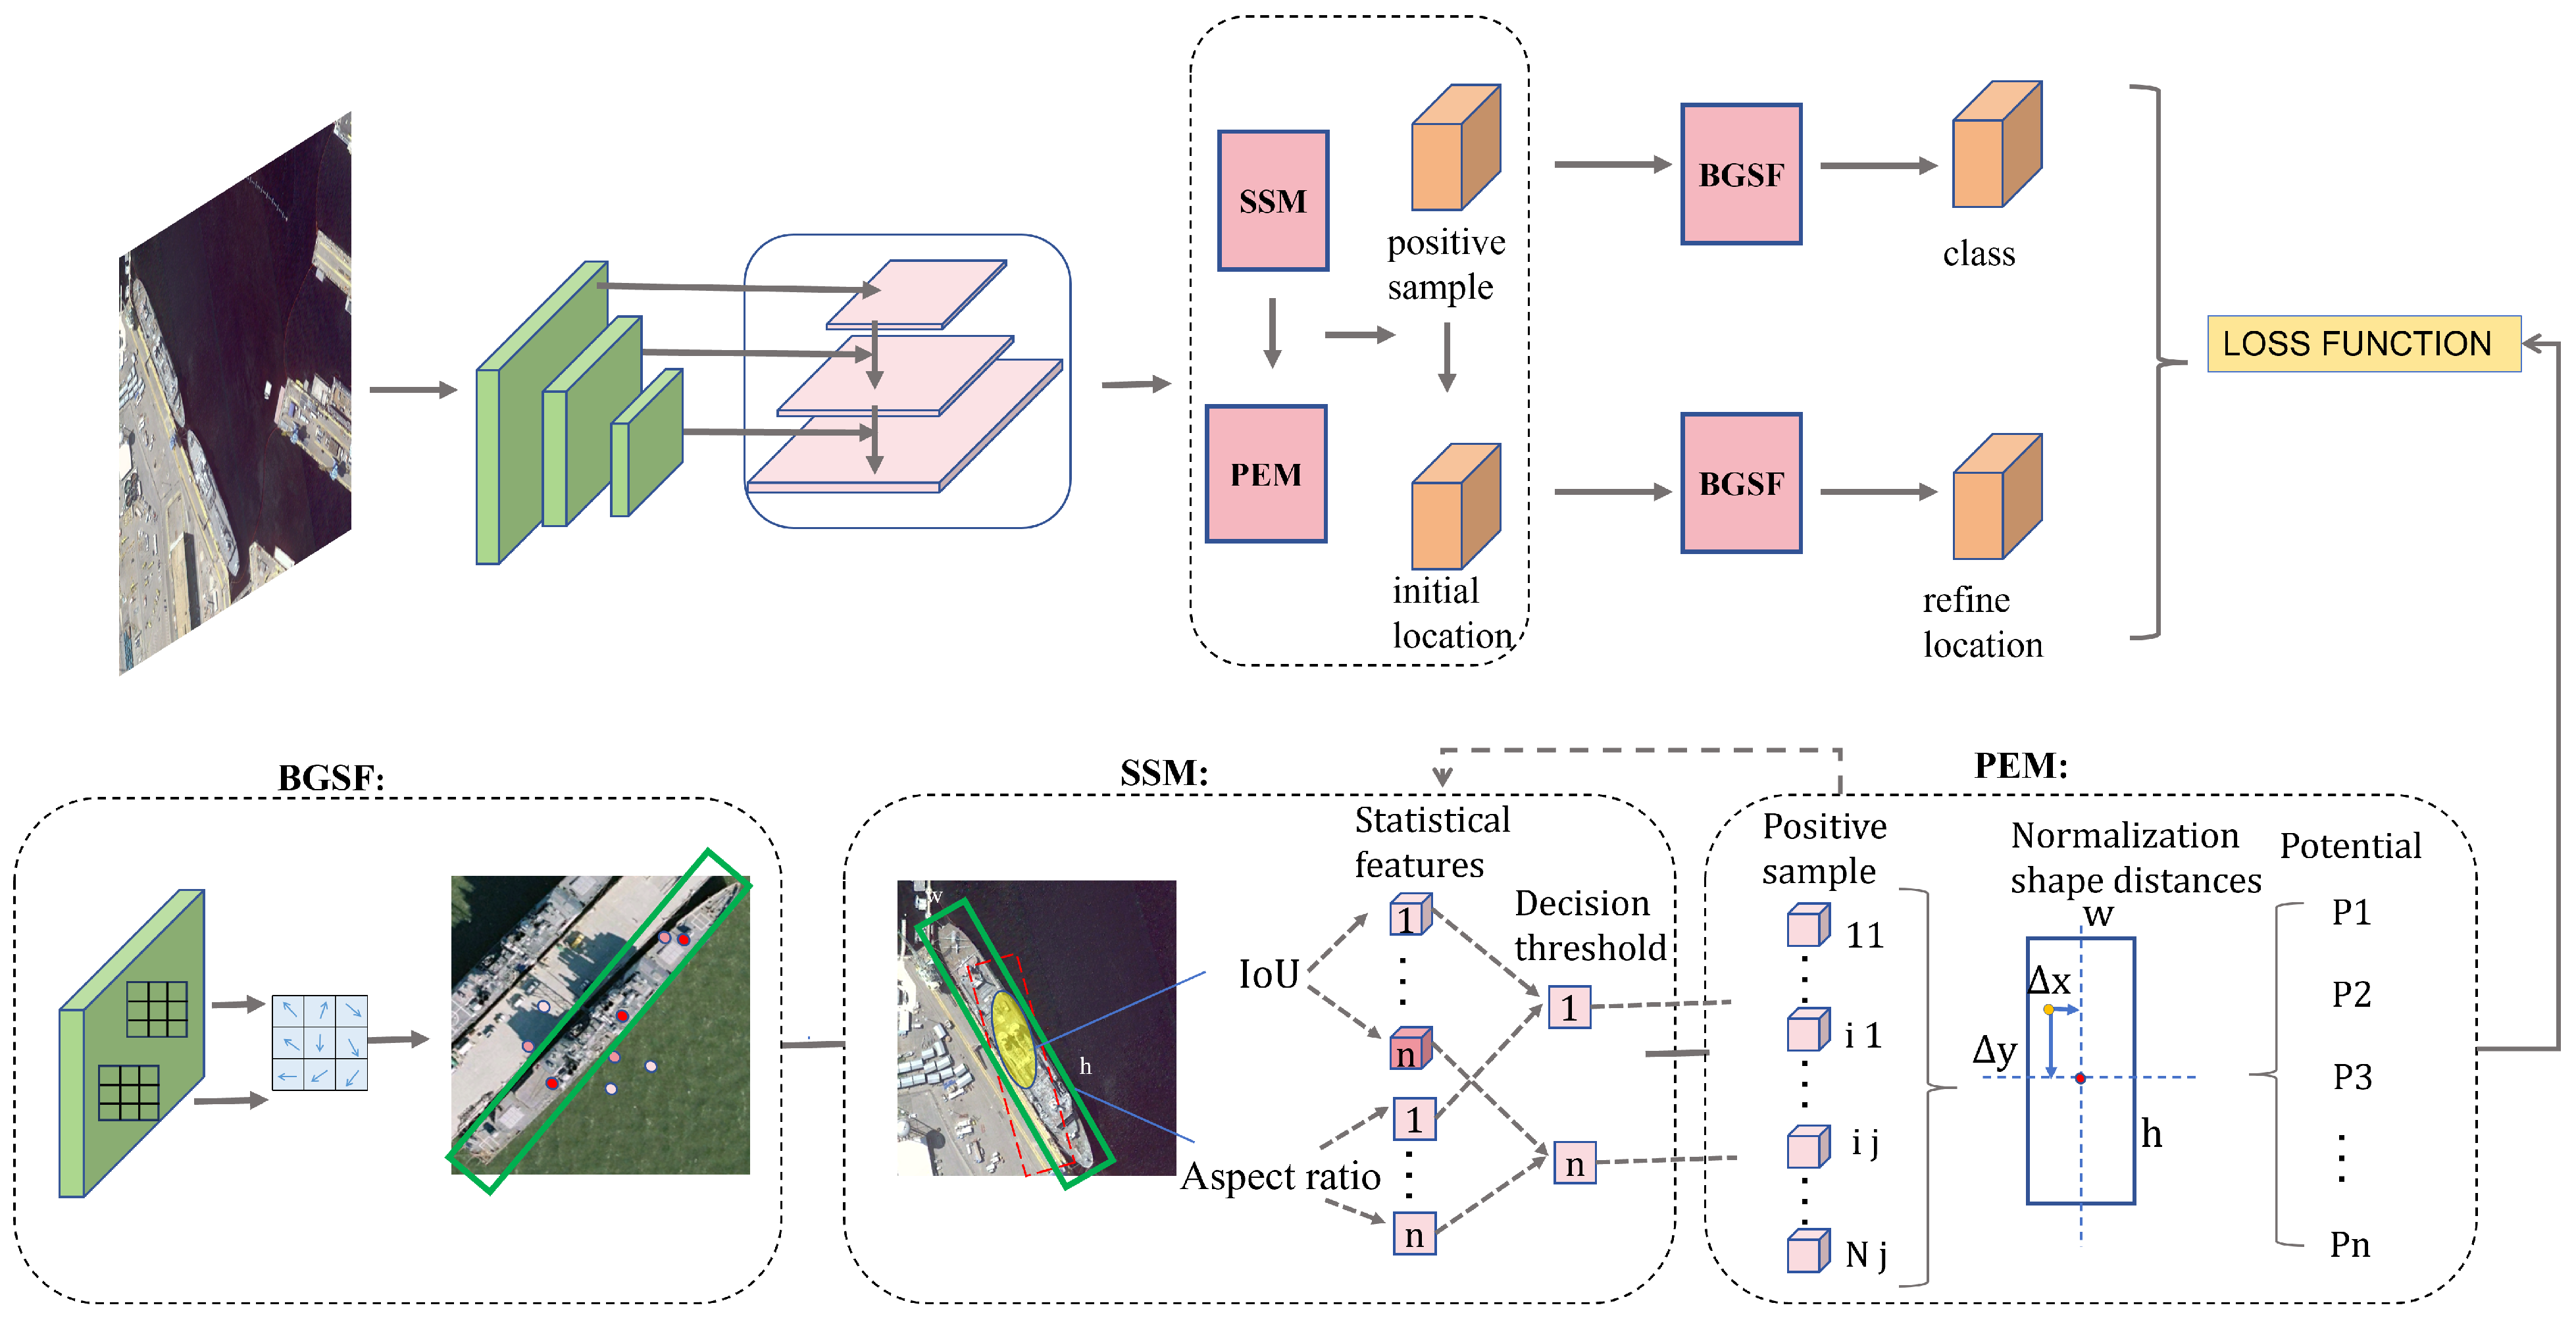
After incorporating BGSF, the detector’s performance improved by 3.4%. This demonstrates that, in rotation detectors, guiding the convolution kernel at each position within the receptive field based on edge location features enables free deformation and displacement. The targets’ shape and directional information is better captured by the network due to this, thereby enhancing the detector’s performance.
After incorporating SSM, the detector’s performance further improved by 2.1%. This is because the module introduces shape-related parameters into the sample selection process, enabling a more comprehensive representation of elongated targets during threshold-based discrimination. This improvement benefits subsequent regression and classification tasks.
Adding PEM resulted in an additional performance gain of 1.8%. By incorporating positional information of each sample in the loss function, the model prioritizes high-potential positive samples during the training process, thereby further boosting detector performance.
When both SSM and PEM were used simultaneously, the detector achieved a performance increase of 4.1%. When both BGSF and SSM were used simultaneously, the detector achieved a performance increase of 4.7%. Finally, when all three modules (BGSF, SSM, and PEM) were used together, the detector’s performance improved by 6.1%, showcasing the complementary nature of these modules.
As shown in Table 3, similar experimental outcomes were observed on the UCAS-AOD dataset. The integration of different modules demonstrated superior performance compared to using a single module. BGSF and SSM collectively enhanced feature extraction by adapting to target shapes while enabling high-potential sample selection, resulting in better classification and regression outcomes. Additionally, the experiments confirmed that the proposed modules do not conflict with one another. When all modules were used together, the model achieved an mAP of 91.3%, demonstrating the effectiveness of the proposed network.
(2)
Evaluation of Internal Module Parameters
In SSM, w is set to 4 by default, and is used to adjust the gradual reduction of the weighting parameter as the aspect ratio of objects increases. In datasets featuring predominantly high-aspect-ratio objects, increased values of w typically enhance performance.
Experiments were carried out on the HRSC2016 and UCAS-AOD dataset to further validate the effectiveness of SSM. The outcomes are comprehensively presented in Table 4 and Table 5. We introduced a weighted factor function based on the elongation ratio to adjust the threshold parameter for sample selection. As shown in Table 4, the HRSC2016 dataset contains a high proportion of elongated targets. When the parameter w approached 0, such as w = 0.3, the decision threshold was close to 0, causing nearly all anchor boxes to be classified as positive samples. This resulted in many low-potential negative samples being incorrectly treated as positives, significantly impairing the model’s training, and the mAP dropped to 89.5%.
As w increased, the decision threshold also increased, leading to improved detection performance. When w was set to around 4, the model achieved its best performance. At this value, the elongated objects in the dataset were assigned an appropriate decision threshold, avoiding premature exclusion while balancing sample selection. The mAP at this setting was 91.3%.
However, when w continued to increase and approached 7, the threshold became overly dependent on statistical information and neglected the shape characteristics of the targets. Consequently, the mAP dropped to 90.1%, indicating a loss of effectiveness in distinguishing elongated targets.

7.2. Comparative Experiments

(1)
Results on the UCAS-AOD Dataset
Our proposed SSAD-Net was compared with several methods on the UCAS-AOD dataset. As shown in Table 6, our approach achieved outstanding results, particularly for the ship and airplane categories, with APs of 89.58% and 94.13%, respectively. Furthermore, we achieved the best overall mAP of 91.34% across all categories.
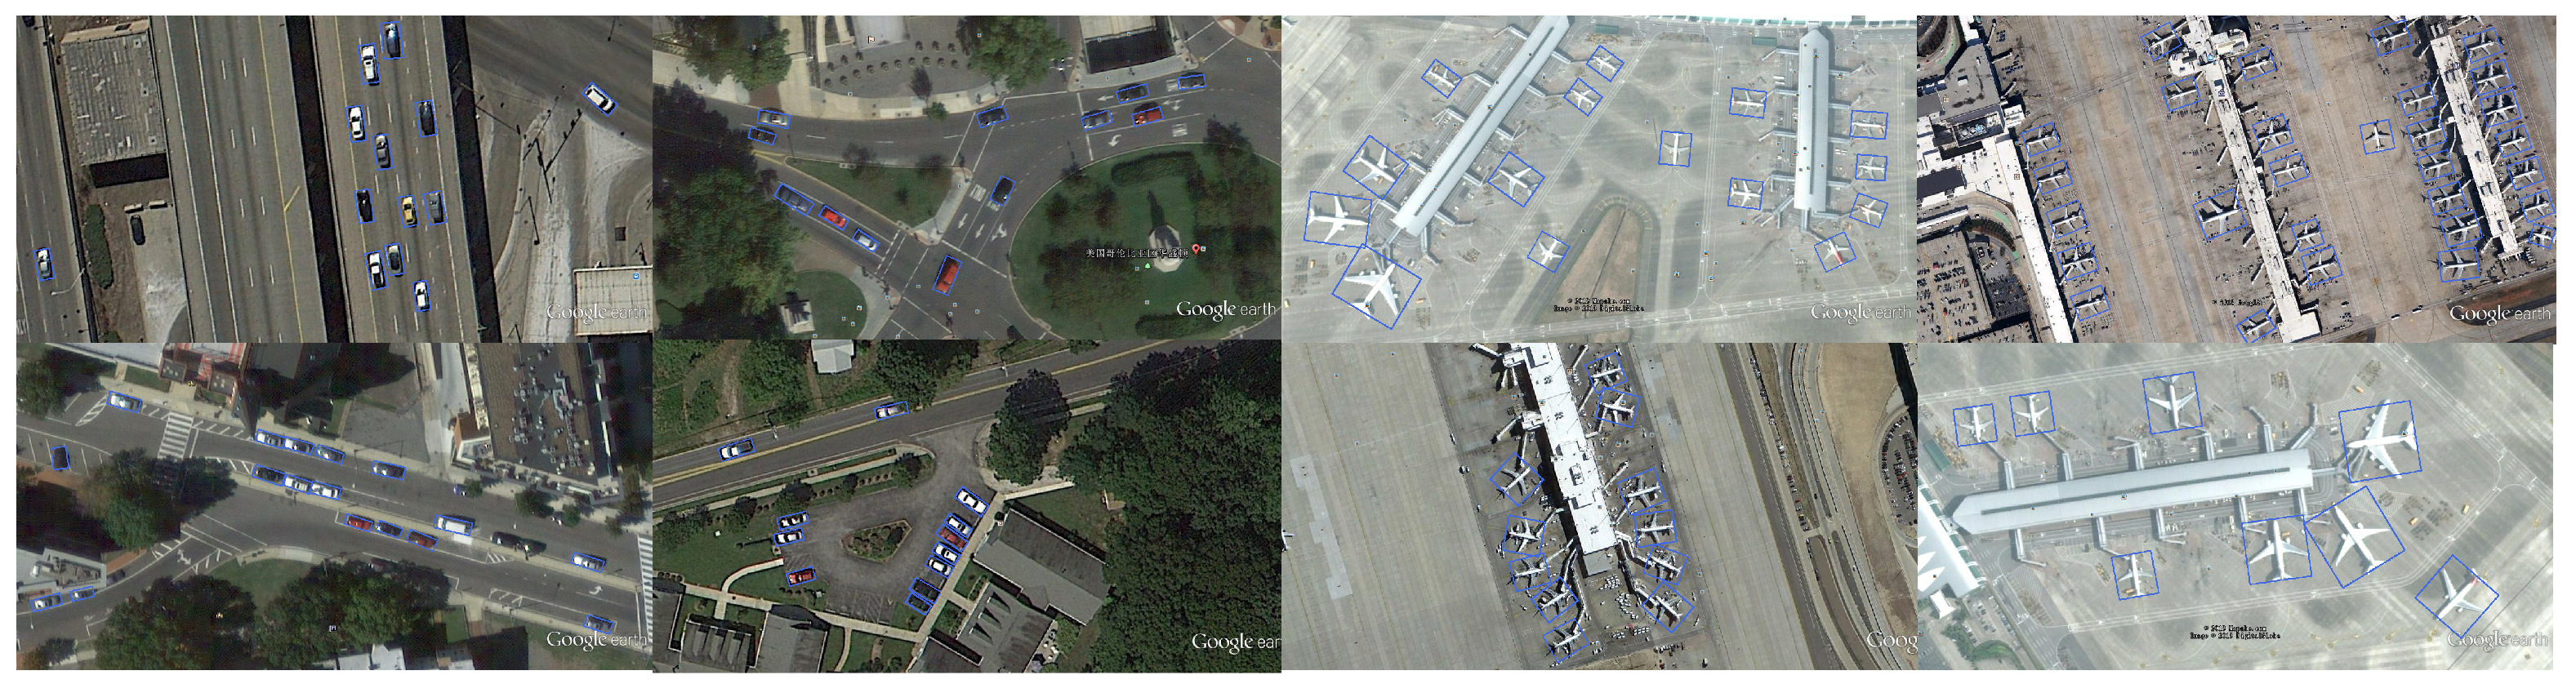
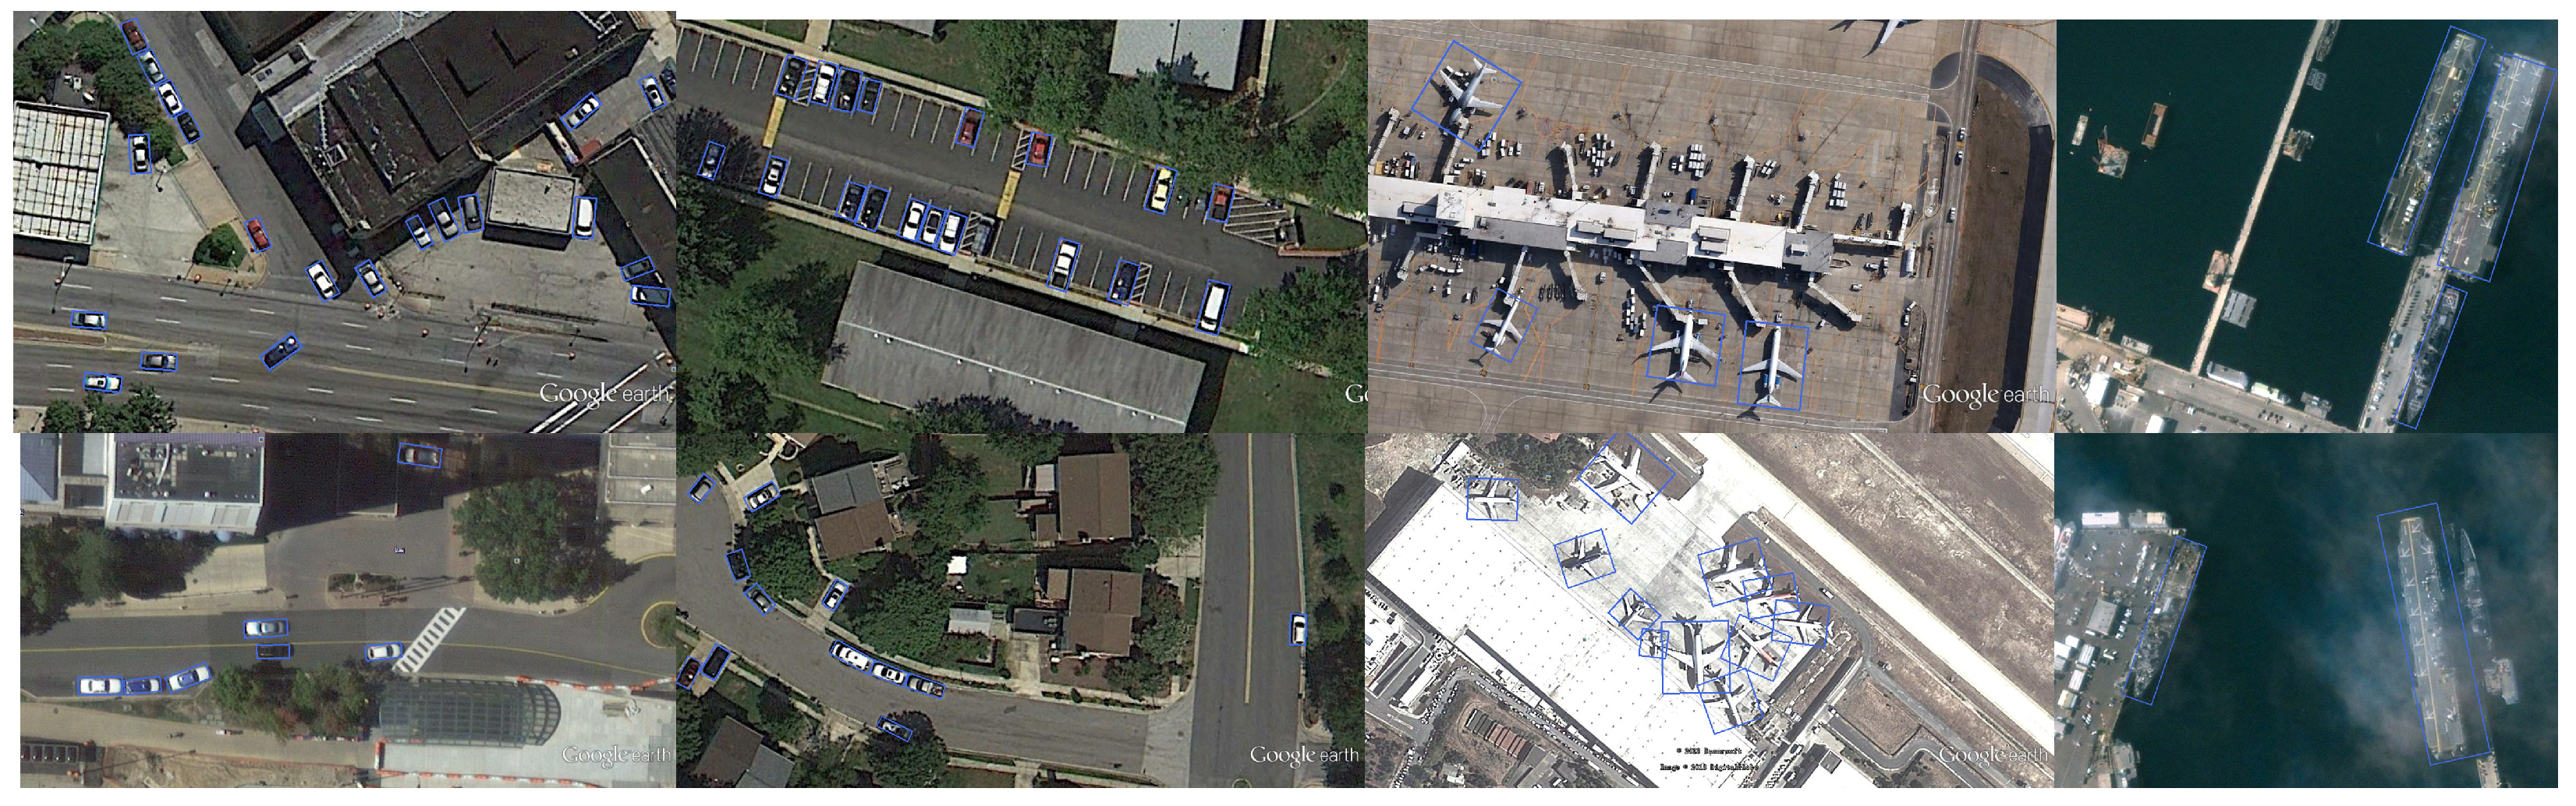
Partial visual detection outcomes for ground targets from the UCAS-AOD dataset are shown in Figure 3. As illustrated, our network can accurately detect densely arranged targets with multiple orientations. For arbitrarily oriented targets, the anchor boxes adaptively align with the spatial orientation of these targets to ensure precise rotation compatibility.
As depicted in the figure, our detector effectively identifies densely packed airplanes of varying sizes and orientations, even in complex scenes with highly intricate spatial arrangements. Additionally, our network demonstrates robust detection performance in urban road environments with dense, small-scale vehicles. These results highlight the ability of our detector to handle densely packed targets across diverse arrangements, indicating strong generalization capabilities.
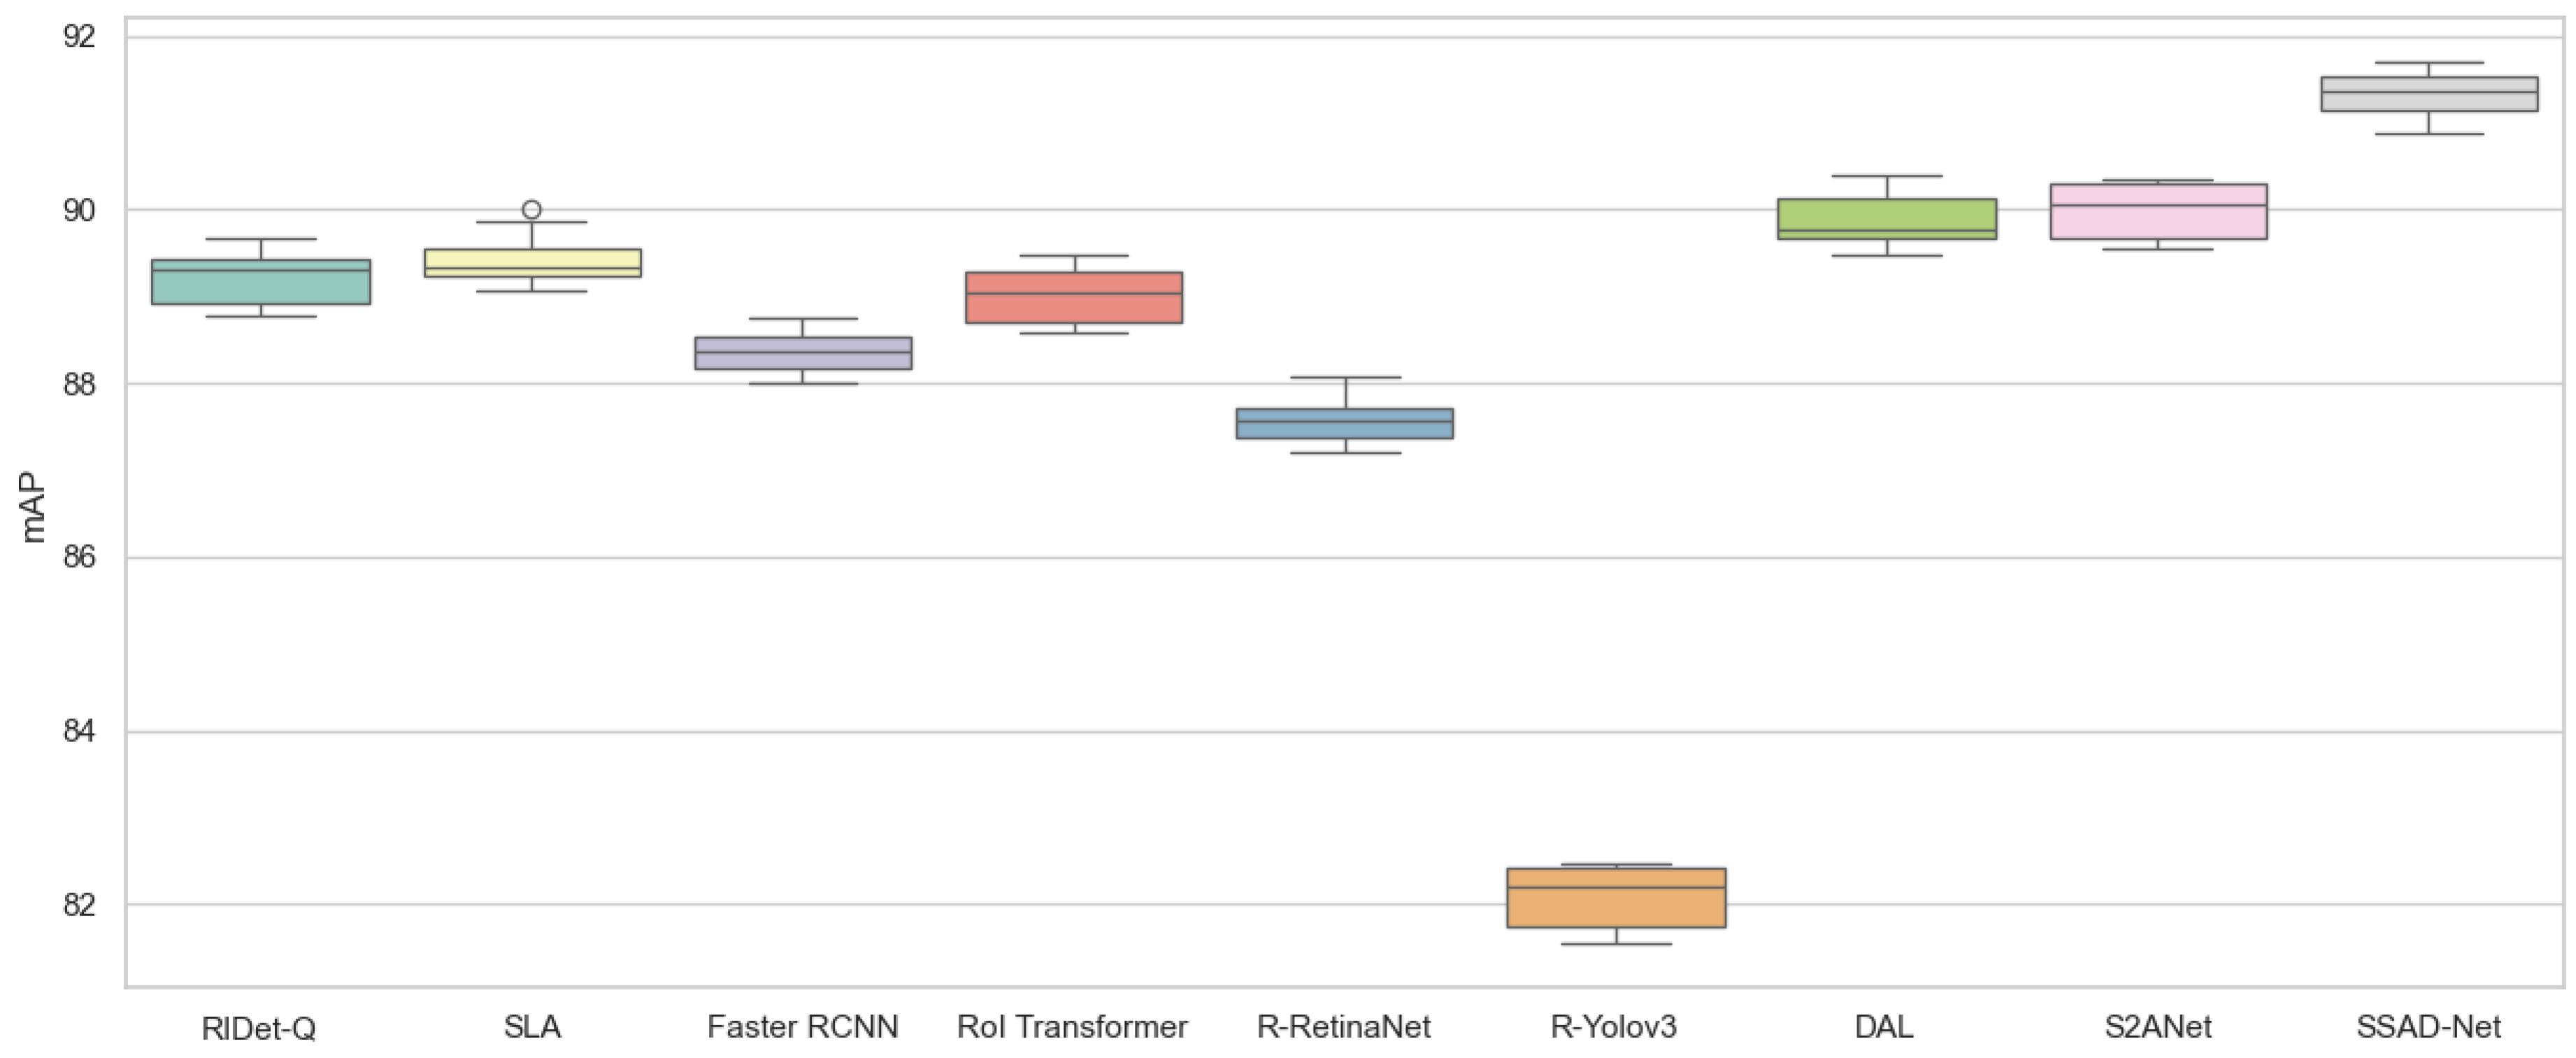
To further explore performance variations, we used box plots to display the distribution of mAP values across different methods. These box plots, as shown in Figure 4 and Figure 5, clearly illustrate the distribution and central tendency of the results. The box plots demonstrate that, compared to the baseline model, SSAD-Net consistently achieves the highest performance in most cases. The relatively narrow interquartile range indicates that the model exhibits stable performance across multiple trials.
For the UCAS-AOD dataset, SSAD-Net achieved an mAP of 91.34%, with a 95% confidence interval of [91.17%, 92.50%], outperforming other methods. This demonstrates that it significantly exceeds the performance of the second-best method, S2ANet, which has an mAP of 89.99% and a confidence interval of [89.78%, 90.20%].
Table 6. Performance comparison of different methods on the UCAS-AOD dataset.
MethodsBackboneCarAirplanemAP (%)
RIDet-Q [32]ResNet5088.5089.9689.23
SLA [33]ResNet5088.5790.3089.44
Faster RCNN [34]ResNet5086.8789.8688.36
RoI Transformer [35]ResNet5088.0290.0289.02
R-RetinaNet [31]ResNet5084.6490.5187.57
R-Yolov3 [36]Darknet5374.6389.5282.08
DAL [10]ResNet5089.2590.4989.87
S2ANet [37]ResNet5089.5690.4289.99
SSAD-NetResNet5089.5894.1391.34
(2)
Results on the HRSC2016 Dataset
Our proposed SSAD-Net was compared with several state-of-the-art methods on the HRSC2016 dataset. Our network achieved the best overall mAP of 91.2% across all categories, as shown in Table 7.
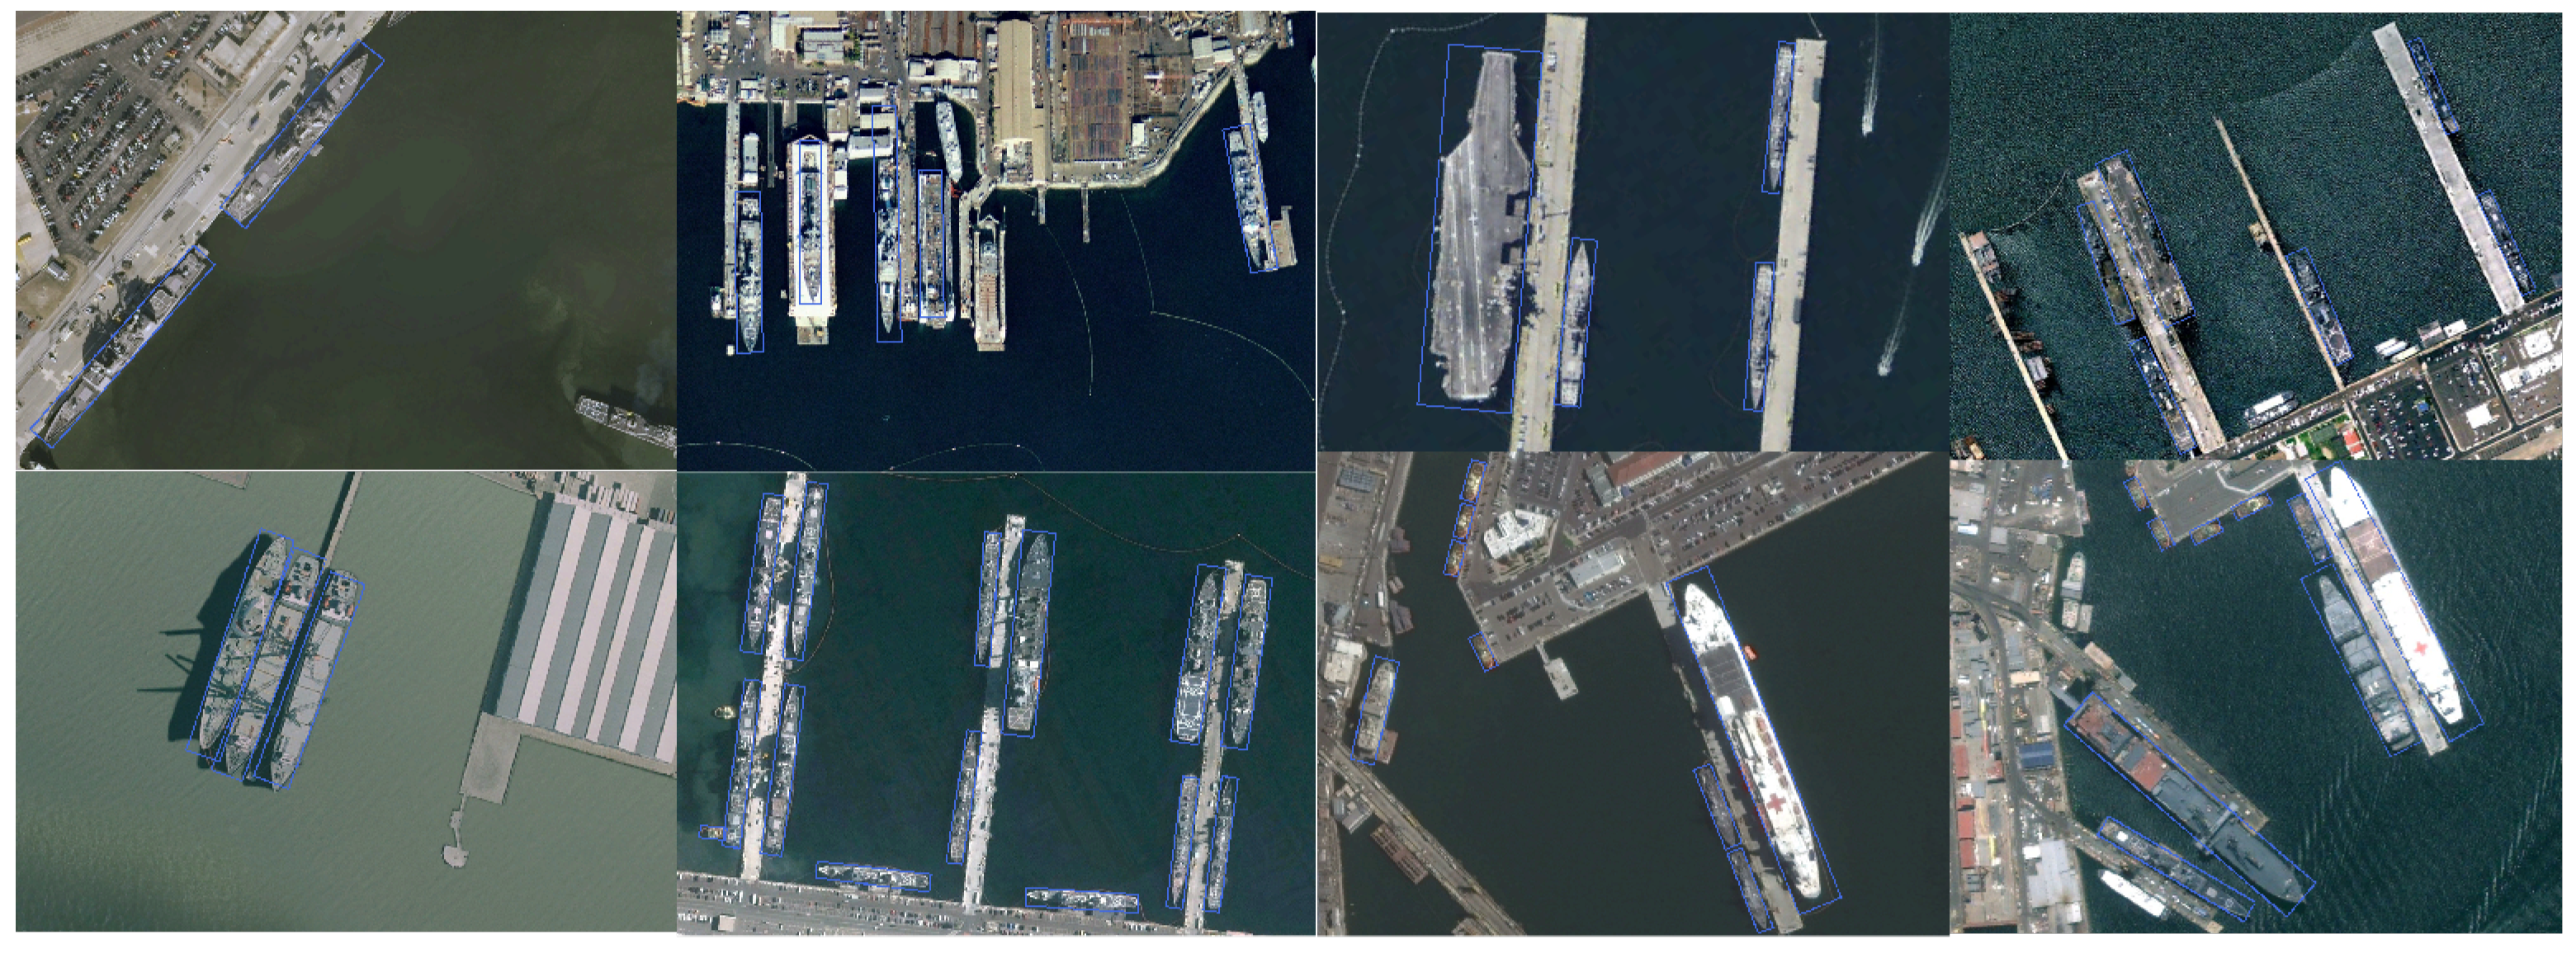
Partial visual detection results for ground targets from the HRSC2016 dataset are shown in Figure 6. It can be observed that our network accurately detects elongated targets. For arbitrarily oriented objects, the anchor boxes precisely align with their spatial orientations, achieving rotational adaptability. Even in scenarios where multiple elongated ships are densely packed together, our detector accurately identifies these targets under various spatial arrangements. Additionally, for ships with different aspect ratios but belonging to the same class, our detector consistently classifies them into the same category.
These results highlight the effectiveness of our network in facilitating the precise detection of elongated targets. BGSF enhances the network’s ability to respond to feature variations across different objects in the image, thereby improving feature extraction for elongated, variably scaled, and multi-directionally rotated targets. SSM adjusts the sample selection strategy based on object shape characteristics, designing reasonable thresholds that prevent high-potential samples from being prematurely discarded. PEM assigns potential information to each positive sample, ensuring that high-potential positive samples—but farther from the object center—receive higher training weights, resulting in stronger feedback during training.
Finally, these modules operate independently in feature extraction and sample selection, ensuring no conflicts arise between them. This modularity enables the network to consistently achieve superior detection results for challenging targets on the HRSC2016 dataset.
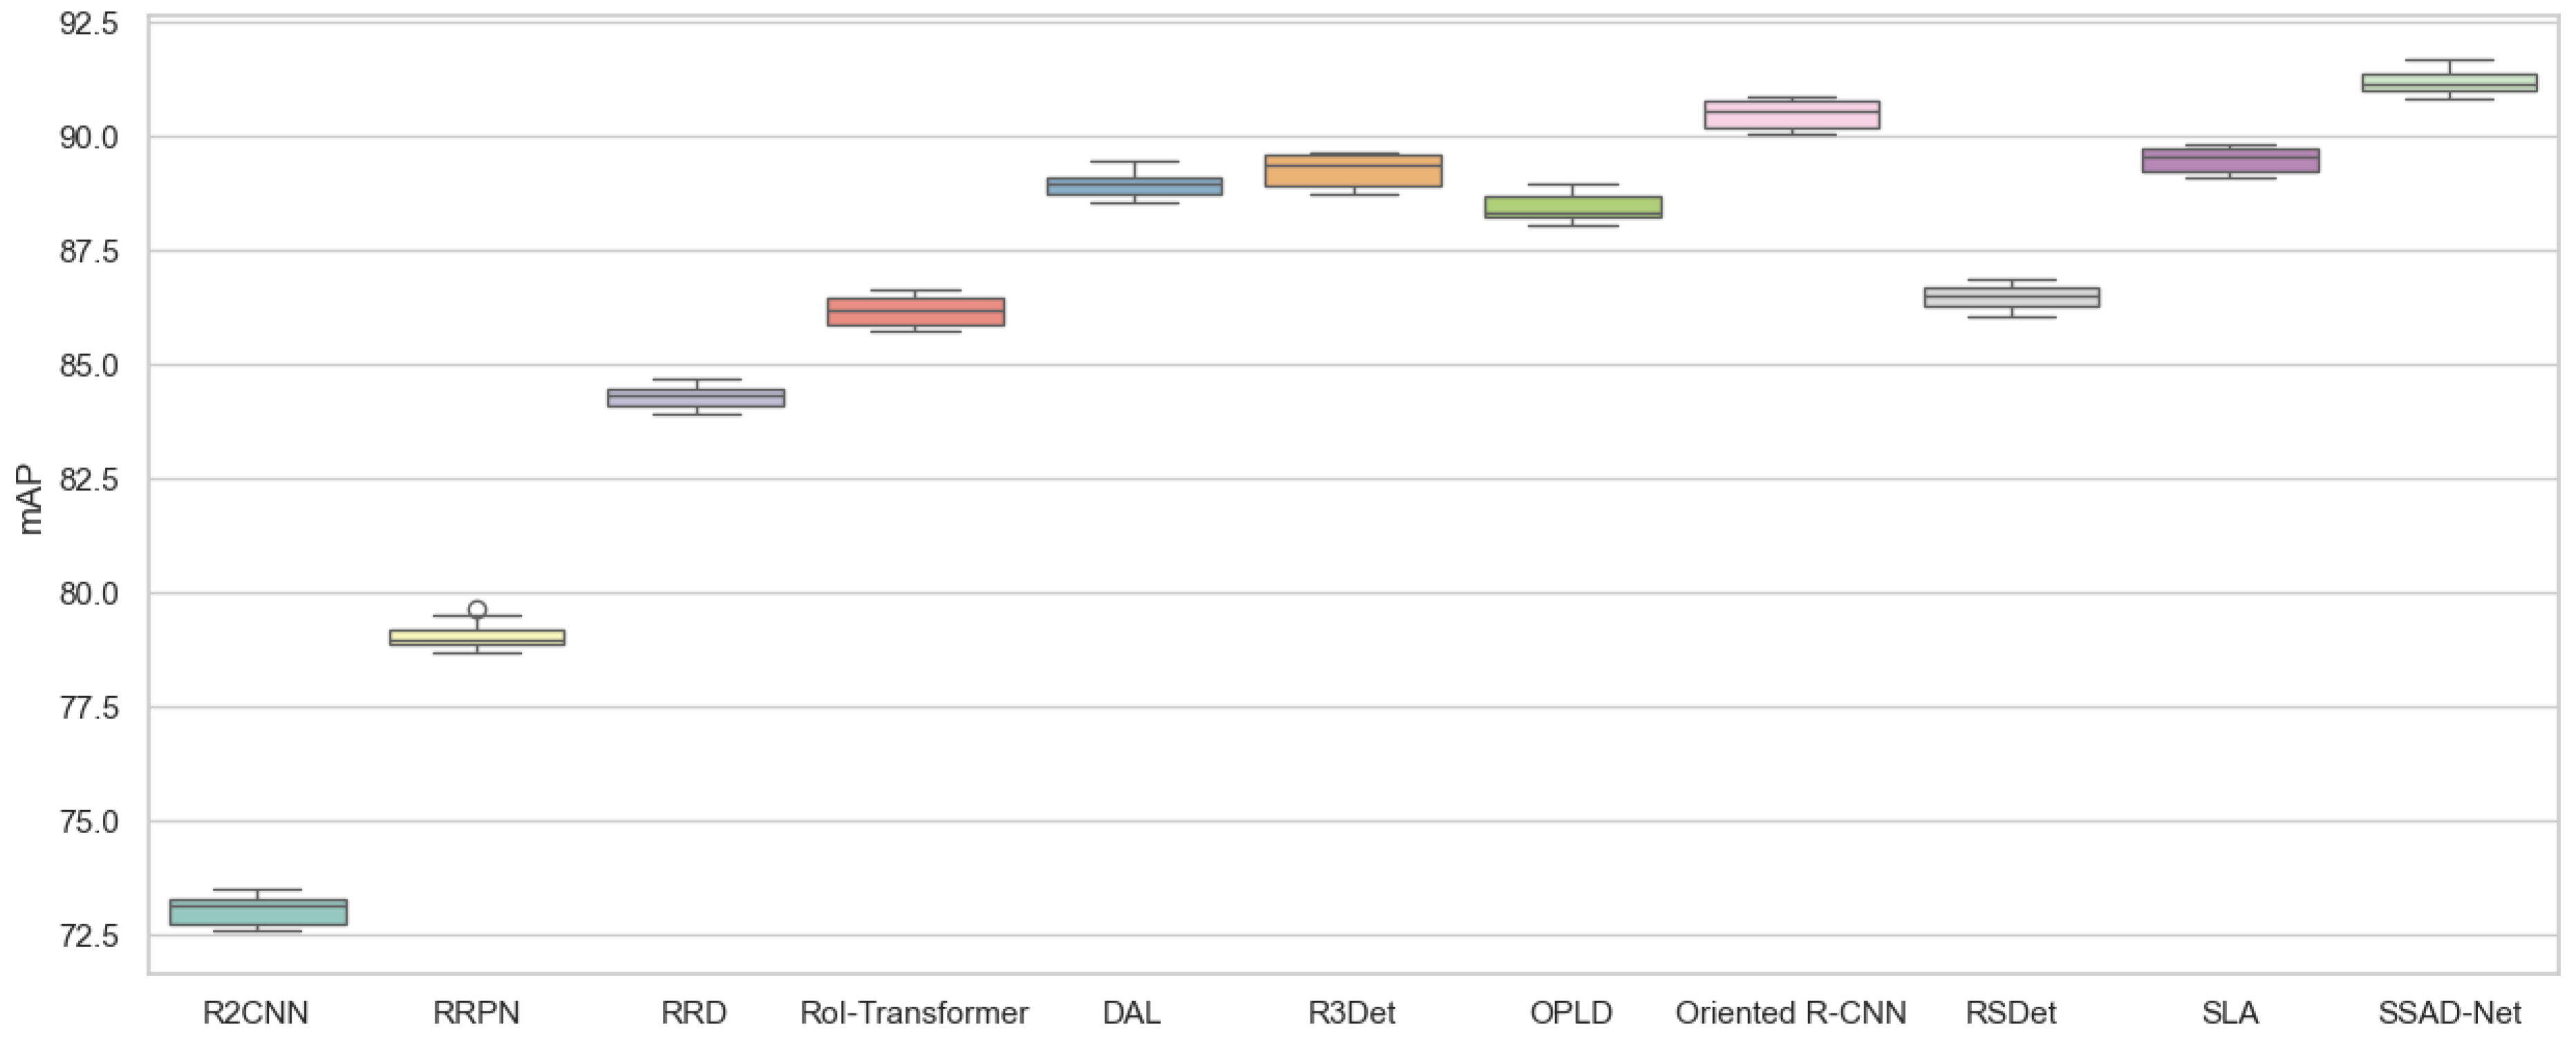
Similarly, as shown in the box plot for the HRSC2016 dataset, SSAD-Net achieved an mAP of 91.2%, significantly outperforming the previous state-of-the-art methods, including RSDet and Oriented R-CNN, with a p-value less than 0.05.
Table 7. Performance comparison of different methods on the HRSC2016 dataset.
MethodsBackbonemAP (%)
R2CNN [38]ResNet10173.07
RRPN [18]ResNet10179.08
RRD [39]VGG1684.30
RoI-Transformer [35]ResNet10186.20
DAL [10]ResNet10188.95
R3Det [16]ResNet10189.26
OPLD [40]ResNet5088.44
Oriented R-CNN [41]ResNet10190.50
RSDet [42]ResNet5086.50
SLA [33]ResNet10189.51
SSAD-NetResNet5091.20
(3)
Comprehensive Discussion
The detection results for scenes with feature bias are shown in Figure 7. These results demonstrate that our detection method performs effectively in addressing issues caused by occlusion, camouflage, and low-light conditions, which often lead to feature discrepancies. This is due to our network’s ability to extract and focus on key features of the target, ensuring robust detection even under challenging conditions. The network’s adaptive feature alignment capabilities, along with the integration of modules like Boundary-Guided Spatial Feature Perception and Shape-Sensing, allow for accurate target identification and localization, even when the object is partially occluded or surrounded by complex backgrounds. This highlights the robustness and effectiveness of our method in real-world remote sensing applications, where environmental factors can significantly impact detection performance.
Our experimental results on the HRSC2016 and UCAS-AOD datasets highlight the effectiveness of SSAD-Net in detecting elongated and multi-directionally rotated targets. In object detection, the focus has often been on the independent aspects of predefined candidate anchor box settings and feature modeling within the ground truth boxes, while neglecting the influence of the intersection form and content between the predefined boxes and ground truth boxes on the detection performance. In SSAD-Net, we address this issue by considering three perspectives: feature extraction, shape sensing, and training feedback. By tackling these key challenges, we demonstrate that SSAD-Net outperforms existing methods and achieves superior performance across various scenarios.
Although SSAD-Net performs well in detecting complex targets, the computational complexity introduced by the dynamic modules may limit its real-time performance, especially when applied to larger datasets. Furthermore, further investigation is needed to improve the model’s performance in cases of highly occluded or cluttered targets, and to reduce its dependence on high-quality, well-annotated data.

8. Conclusions

This study proposed a novel Spatial Shape-Aware Detection Network (SSAD-Net) to address the challenges of detecting elongated and multi-directionally rotated objects in remote sensing imagery. Traditional methods struggle with imprecise feature extraction, anchor misalignment, and inconsistent evaluation of positive samples. To overcome these limitations, SSAD-Net introduces three key components: a Boundary-Guided Spatial Feature Perception Module for shape-aligned feature extraction, a Shape-Sensing Module for shape-adaptive anchor selection, and a Potential Evaluation Module to prioritize high-potential samples during training.
On UCAS-AOD and HRSC2016 datasets, extensive experiments demonstrated that SSAD-Net outperforms state-of-the-art methods, achieving superior accuracy for elongated and complex targets. The results validated the effectiveness and synergy of the proposed modules in enhancing feature alignment, sample selection, and detection precision.
However, there are several limitations in this study. Although SSAD-Net excels at detecting elongated and rotated targets, the introduction of dynamic modules increases computational complexity, which may hinder real-time performance, especially when detecting simple, non-elongated, or non-rotated targets. This can limit its scalability when applied to large-scale datasets. Additionally, the model’s performance relies on the tuning of empirical parameters, which makes the detection process dependent on the quality and diversity of the dataset. When applied to targets with insufficient representation or occlusion, this could result in suboptimal outcomes.
In conclusion, SSAD-Net offered a robust and generalizable solution for remote sensing detection, particularly for elongated objects. Future work will focus on improving real-time efficiency and extending the approach to more challenging scenarios, such as cluttered or occluded environments.

Author Contributions

Conceptualization, S.X.; software, S.X.; validation, S.X.; investigation, S.X.; methodology, S.X.; formal analysis, S.X.; resources, D.-H.L. All authors have read and agreed to the published version of the manuscript.

Funding

National Natural Science Foundation of China, Grant No. 72350710798.

Data Availability Statement

Conflicts of Interest

The authors declare no conflicts of interest.

References

  1. Redmon, J. You only look once: Unified, real-time object detection. In Proceedings of the IEEE Conference on Computer Vision and Pattern Recognition, Las Vegas, NV, USA, 27–30 June 2016. [Google Scholar]
  2. Liu, W.; Anguelov, D.; Erhan, D.; Szegedy, C.; Reed, S.; Fu, C.Y.; Berg, A.C. Ssd: Single shot multibox detector. In Proceedings of the Computer Vision–ECCV 2016: 14th European Conference, Amsterdam, The Netherlands, 11–14 October 2016; Proceedings, Part I 14. Springer: Berlin/Heidelberg, Germany, 2016; pp. 21–37. [Google Scholar]
  3. Wang, M.; Yang, W.; Wang, L.; Chen, D.; Wei, F.; KeZiErBieKe, H.; Liao, Y. FE-YOLOv5: Feature enhancement network based on YOLOv5 for small object detection. J. Vis. Commun. Image Represent. 2023, 90, 103752. [Google Scholar] [CrossRef]
  4. Xu, D.; Wu, Y. MRFF-YOLO: A multi-receptive fields fusion network for remote sensing target detection. Remote Sens. 2020, 12, 3118. [Google Scholar] [CrossRef]
  5. Hu, J.; Zhi, X.; Shi, T.; Zhang, W.; Cui, Y.; Zhao, S. PAG-YOLO: A portable attention-guided YOLO network for small ship detection. Remote Sens. 2021, 13, 3059. [Google Scholar] [CrossRef]
  6. Yang, Z.; Liu, S.; Hu, H.; Wang, L.; Lin, S. Reppoints: Point set representation for object detection. In Proceedings of the IEEE/CVF International Conference on Computer Vision, Seoul, Republic of Korea, 27 October–2 November 2019; pp. 9657–9666. [Google Scholar]
  7. Girshick, R.; Donahue, J.; Darrell, T.; Malik, J. Region-based convolutional networks for accurate object detection and segmentation. IEEE Trans. Pattern Anal. Mach. Intell. 2015, 38, 142–158. [Google Scholar] [CrossRef] [PubMed]
  8. Dong, R.; Xu, D.; Zhao, J.; Jiao, L.; An, J. Sig-NMS-based faster R-CNN combining transfer learning for small target detection in VHR optical remote sensing imagery. IEEE Trans. Geosci. Remote Sens. 2019, 57, 8534–8545. [Google Scholar] [CrossRef]
  9. Ren, Y.; Zhu, C.; Xiao, S. Deformable faster r-cnn with aggregating multi-layer features for partially occluded object detection in optical remote sensing images. Remote Sens. 2018, 10, 1470. [Google Scholar] [CrossRef]
  10. Ming, Q.; Zhou, Z.; Miao, L.; Zhang, H.; Li, L. Dynamic anchor learning for arbitrary-oriented object detection. In Proceedings of the AAAI Conference on Artificial Intelligence, Virtual, 2–9 February 2021; Volume 35, pp. 2355–2363. [Google Scholar]
  11. Zhang, S.; Chi, C.; Yao, Y.; Lei, Z.; Li, S.Z. Bridging the gap between anchor-based and anchor-free detection via adaptive training sample selection. In Proceedings of the IEEE/CVF Conference on Computer Vision and Pattern Recognition, Seattle, WA, USA, 13–19 June 2020; pp. 9759–9768. [Google Scholar]
  12. Ge, Z.; Liu, S.; Li, Z.; Yoshie, O.; Sun, J. Ota: Optimal transport assignment for object detection. In Proceedings of the IEEE/CVF Conference on Computer Vision and Pattern Recognition, Nashville, TN, USA, 20–25 June 2021; pp. 303–312. [Google Scholar]
  13. Dai, J.; Qi, H.; Xiong, Y.; Li, Y.; Zhang, G.; Hu, H.; Wei, Y. Deformable convolutional networks. In Proceedings of the IEEE International Conference on Computer Vision, Venice, Italy, 22–29 October 2017; pp. 764–773. [Google Scholar]
  14. Pan, X.; Ren, Y.; Sheng, K.; Dong, W.; Yuan, H.; Guo, X.; Ma, C.; Xu, C. Dynamic refinement network for oriented and densely packed object detection. In Proceedings of the IEEE/CVF Conference on Computer Vision and Pattern Recognition, Seattle, WA, USA, 13–19 June 2020; pp. 11207–11216. [Google Scholar]
  15. Deng, Z.; Sun, H.; Zhou, S.; Zhao, J.; Lei, L.; Zou, H. Multi-scale object detection in remote sensing imagery with convolutional neural networks. ISPRS J. Photogramm. Remote Sens. 2018, 145, 3–22. [Google Scholar] [CrossRef]
  16. Yang, X.; Yan, J.; Feng, Z.; He, T. R3det: Refined single-stage detector with feature refinement for rotating object. In Proceedings of the AAAI Conference on Artificial Intelligence, Virtual, 2–9 February 2021; Volume 35, pp. 3163–3171. [Google Scholar]
  17. Cheng, G.; Han, J.; Zhou, P.; Xu, D. Learning rotation-invariant and fisher discriminative convolutional neural networks for object detection. IEEE Trans. Image Process. 2018, 28, 265–278. [Google Scholar] [CrossRef] [PubMed]
  18. Ma, J.; Shao, W.; Ye, H.; Wang, L.; Wang, H.; Zheng, Y.; Xue, X. Arbitrary-oriented scene text detection via rotation proposals. IEEE Trans. Multimed. 2018, 20, 3111–3122. [Google Scholar] [CrossRef]
  19. Wang, J.; Chen, K.; Yang, S.; Loy, C.C.; Lin, D. Region proposal by guided anchoring. In Proceedings of the IEEE/CVF Conference on Computer Vision and Pattern Recognition, Long Beach, CA, USA, 15–20 June 2019; pp. 2965–2974. [Google Scholar]
  20. Li, M.; Wu, J.; Wang, X.; Chen, C.; Qin, J.; Xiao, X.; Wang, R.; Zheng, M.; Pan, X. Aligndet: Aligning pre-training and fine-tuning in object detection. In Proceedings of the IEEE/CVF International Conference on Computer Vision, Paris, France, 1–6 October 2023; pp. 6866–6876. [Google Scholar]
  21. Han, J.; Ding, J.; Xue, N.; Xia, G.S. Redet: A rotation-equivariant detector for aerial object detection. In Proceedings of the IEEE/CVF Conference on Computer Vision and Pattern Recognition, Nashville, TN, USA, 20–25 June 2021; pp. 2786–2795. [Google Scholar]
  22. Li, Y.; Huang, Q.; Pei, X.; Jiao, L.; Shang, R. RADet: Refine feature pyramid network and multi-layer attention network for arbitrary-oriented object detection of remote sensing images. Remote Sens. 2020, 12, 389. [Google Scholar] [CrossRef]
  23. Zhu, Y.; Du, J.; Wu, X. Adaptive period embedding for representing oriented objects in aerial images. IEEE Trans. Geosci. Remote Sens. 2020, 58, 7247–7257. [Google Scholar] [CrossRef]
  24. Zhao, P.; Qu, Z.; Bu, Y.; Tan, W.; Guan, Q. Polardet: A fast, more precise detector for rotated target in aerial images. Int. J. Remote Sens. 2021, 42, 5831–5861. [Google Scholar] [CrossRef]
  25. Chen, Z.; Chen, K.; Lin, W.; See, J.; Yu, H.; Ke, Y.; Yang, C. Piou loss: Towards accurate oriented object detection in complex environments. In Proceedings of the Computer Vision–ECCV 2020: 16th European Conference, Glasgow, UK, 23–28 August 2020; Proceedings, Part V 16. Springer: Berlin/Heidelberg, Germany, 2020; pp. 195–211. [Google Scholar]
  26. Hou, L.; Lu, K.; Xue, J.; Li, Y. Shape-adaptive selection and measurement for oriented object detection. In Proceedings of the AAAI Conference on Artificial Intelligence, Online, 22 February–1 March 2022; Volume 36, pp. 923–932. [Google Scholar]
  27. Xu, C.; Wang, J.; Yang, W.; Yu, H.; Yu, L.; Xia, G.S. RFLA: Gaussian receptive field based label assignment for tiny object detection. In Proceedings of the European Conference on Computer Vision, Tel Aviv, Israel, 23–27 October 2022; Springer: Berlin/Heidelberg, Germany, 2022; pp. 526–543. [Google Scholar]
  28. Feng, C.; Zhong, Y.; Gao, Y.; Scott, M.R.; Huang, W. Tood: Task-aligned one-stage object detection. In Proceedings of the 2021 IEEE/CVF International Conference on Computer Vision (ICCV), Montreal, BC, Canada, 10–17 October 2021; IEEE Computer Society: Washington, DC, USA, 2021; pp. 3490–3499. [Google Scholar]
  29. Liu, Z.; Yuan, L.; Weng, L.; Yang, Y. A high resolution optical satellite image dataset for ship recognition and some new baselines. In Proceedings of the International Conference on Pattern Recognition Applications and Methods, Porto, Portugal, 24–26 February 2017; SciTePress: Setúbal, Portugal, 2017; Volume 2, pp. 324–331. [Google Scholar]
  30. Zhu, H.; Chen, X.; Dai, W.; Fu, K.; Ye, Q.; Jiao, J. Orientation robust object detection in aerial images using deep convolutional neural network. In Proceedings of the 2015 IEEE International Conference on Image Processing (ICIP), Quebec City, QC, Canada, 27–30 September 2015; IEEE: Piscataway, NJ, USA, 2015; pp. 3735–3739. [Google Scholar]
  31. Ross, T.Y.; Dollár, G. Focal loss for dense object detection. In Proceedings of the IEEE Conference on Computer Vision and Pattern Recognition, Honolulu, HI, USA, 21–26 July 2017; pp. 2980–2988. [Google Scholar]
  32. Ming, Q.; Miao, L.; Zhou, Z.; Yang, X.; Dong, Y. Optimization for arbitrary-oriented object detection via representation invariance loss. IEEE Geosci. Remote Sens. Lett. 2021, 19, 1–5. [Google Scholar] [CrossRef]
  33. Ming, Q.; Miao, L.; Zhou, Z.; Song, J.; Yang, X. Sparse label assignment for oriented object detection in aerial images. Remote Sens. 2021, 13, 2664. [Google Scholar] [CrossRef]
  34. Ren, S.; He, K.; Girshick, R.; Sun, J. Faster R-CNN: Towards real-time object detection with region proposal networks. IEEE Trans. Pattern Anal. Mach. Intell. 2016, 39, 1137–1149. [Google Scholar] [CrossRef]
  35. Ding, J.; Xue, N.; Long, Y.; Xia, G.S.; Lu, Q. Learning RoI transformer for oriented object detection in aerial images. In Proceedings of the IEEE/CVF Conference on Computer Vision and Pattern Recognition, Long Beach, CA, USA, 15–20 June 2019; pp. 2849–2858. [Google Scholar]
  36. Farhadi, A.; Redmon, J. Yolov3: An incremental improvement. In Proceedings of the Computer Vision and Pattern Recognition, Salt Lake City, UT, USA, 18–22 June 2018; Springer: Berlin/Heidelberg, Germany, 2018; Volume 1804, pp. 1–6. [Google Scholar]
  37. Han, J.; Ding, J.; Li, J.; Xia, G.S. Align deep features for oriented object detection. IEEE Trans. Geosci. Remote Sens. 2021, 60, 1–11. [Google Scholar] [CrossRef]
  38. Jiang, Y.; Zhu, X.; Wang, X.; Yang, S.; Li, W.; Wang, H.; Fu, P.; Luo, Z. R2CNN: Rotational region CNN for orientation robust scene text detection. arXiv 2017, arXiv:1706.09579. [Google Scholar]
  39. Liao, M.; Zhu, Z.; Shi, B.; Xia, G.s.; Bai, X. Rotation-sensitive regression for oriented scene text detection. In Proceedings of the IEEE Conference on Computer Vision and Pattern Recognition, Salt Lake City, UT, USA, 18-22 June 2018; pp. 5909–5918. [Google Scholar]
  40. Song, Q.; Yang, F.; Yang, L.; Liu, C.; Hu, M.; Xia, L. Learning point-guided localization for detection in remote sensing images. IEEE J. Sel. Top. Appl. Earth Obs. Remote Sens. 2020, 14, 1084–1094. [Google Scholar] [CrossRef]
  41. Xie, X.; Cheng, G.; Wang, J.; Yao, X.; Han, J. Oriented R-CNN for object detection. In Proceedings of the IEEE/CVF International Conference on Computer Vision, Montreal, QC, Canada, 11–17 October 2021; pp. 3520–3529. [Google Scholar]
  42. Qian, W.; Yang, X.; Peng, S.; Yan, J.; Guo, Y. Learning modulated loss for rotated object detection. In Proceedings of the AAAI Conference on Artificial Intelligence, Virtual, 2–9 February 2021; Volume 35, pp. 2458–2466. [Google Scholar]
Figure 3. Partial detection results on the UCAS-AOD dataset.
Algorithms 18 00125 g003
Figure 4. Box plot of detection results for different models on the UCAS-AOD dataset.
Algorithms 18 00125 g004
Figure 5. Box plot of detection results for different models on the HRSC2016 dataset.
Algorithms 18 00125 g005
Figure 6. Partial detection results on the HRSC2016 dataset.
Algorithms 18 00125 g006
Figure 7. Partial detection results in scenarios with feature bias.
Algorithms 18 00125 g007
Table 2. Effects of each component of SSAD-NET on HRSC2016 dataset.
With BGSFWith SSMWith PEMmAP (%)
×××85.1
××87.2
××86.9
××88.5
×89.8
×89.2
91.2
Table 3. Effects of each component of SSAD-Net on UCAS-AOD dataset.
With BGSFWith SSMWith PEMmAP (%)
×××85.7
××87.4
××87.1
××88.7
×90.1
×89.4
91.3
Table 4. Impact of parameter w on mAP performance on the UCAS-AOD dataset.
Parameterw = 0.3w = 1w = 4w = 5w = 7
mAP (%)89.490.191.290.690.2
Table 5. Impact of parameter w on mAP performance on the HRSC2016 dataset.
Parameterw = 0.3w = 1w = 4w = 5w = 7
mAP (%)89.590.291.390.890.1
Disclaimer/Publisher’s Note: The statements, opinions and data contained in all publications are solely those of the individual author(s) and contributor(s) and not of MDPI and/or the editor(s). MDPI and/or the editor(s) disclaim responsibility for any injury to people or property resulting from any ideas, methods, instructions or products referred to in the content.

