Article

MORA: A Multicriteria Optimal Resource Allocation and Decision Support Toolkit for Wildfire Management

by
Theofanis Orphanoudakis
1,2,*,
Christos Betzelos
3 and
Helen Catherine Leligou
1,2
1
Department of Industrial Design and Production Engineering, University of West Attica, 250 Thivon & P. Ralli Str., GR12241 Egaleo, Greece
2
Netcompany SEE & EUI, Fragkokklisias 13, GR15125 Maroussi, Greece
3
Department of Informatics and Computer Engineering, University of West Attica, Ag. Spyridonos Str., GR12243 Egaleo, Greece
*
Author to whom correspondence should be addressed.
Algorithms 2025, 18(11), 677; https://doi.org/10.3390/a18110677
Submission received: 9 August 2025 / Revised: 4 October 2025 / Accepted: 13 October 2025 / Published: 23 October 2025

Abstract

Forest ecosystems are vital to sustainable development, contributing to economic, environmental and social well-being. However, the increasing frequency and severity of wildfires threaten these ecosystems, demanding more effective and integrated fire management (IFM) strategies. Current suppression efforts face limitations due to high resource demands and the need for timely, informed decision-making under uncertain conditions. This paper presents the SILVANUS project’s approach to developing an advanced Decision Support System (DSS) designed to assist incident commanders in optimizing resource allocation during wildfire events. Leveraging Geographic Information Systems (GIS), real-time data collection, AI-enhanced analytics and multicriteria optimization algorithms, the SILVANUS DSS component integrates diverse data sources to support dynamic, risk-informed decisions. The system operates within a cloud-edge infrastructure to ensure scalability, interoperability and secure data management. We detail the formalization of the resource allocation problem, describe the implementation of the DSS within the SILVANUS platform, and evaluate its performance in both controlled simulations and real-world pilot scenarios. The results demonstrate the system’s potential to enhance situational awareness and improve the effectiveness of wildfire response operations.

1. Introduction

Forest ecosystems are of paramount importance as part of all three pillars of sustainable development, contributing to economic, social and environmental sustainability and development. They act as key players in the daily routine of both rural and urban communities. Sustainable forest management serves as a crucial mechanism to combat desertification and deforestation and they protect against natural disasters such as soil erosion, fires and floods. However, forest fires pose a significant threat to these ecosystems, despite being an integral part of forest life. In recent years, their frequency has increased, leading to potentially catastrophic damage and loss [1].
The preservation of forests, as ecosystems, is becoming critical not only for the forests themselves but also for their impact on the sustainability of other life forms. The reasons for protecting forests from potential hazards such as fire are obvious, given that forests and all of their structural and biological components are an integral part of the natural environment. Unfortunately, modern land use practices have caused the accumulation of biomass and flammable fuels, leading to more severe fires. Wildfire management typically includes the actions taken to protect people, property and natural resources from the hazards posed by wildfires. Effective management requires attention to several elements, including prevention, detection, (pre)suppression and restoration, which are fully interdependent, incorporating the concept of Integrated Fire Management (IFM) [2]. During the prevention and detection stage, the vulnerability of the land to fire is assessed and tools such as Geographic Information Systems (GIS) mapping are used to identify time periods and areas that are most susceptible to fire development. The (pre)suppression stage involves the rational use of firefighting means and resources and minimizing the impacts of the fire. Restoration efforts aim to restore the landscape after the fire has occurred.
While it is evident that wildfires present a major risk to human life and infrastructure, and it is of paramount importance to minimize their impact, the fact that suppression operations demand substantial personnel and resources imposes severe limitations on effective firefighting. While recent improvements in situational awareness tools and communication technologies have significantly supported incident commanders in managing response efforts, there remains a critical gap in effective, autonomous decision support systems. Specifically, systems capable of dynamically recommending resource allocation are lacking tools that could assist commanders in navigating the uncertainty and time constraints inherent in rapidly evolving fire conditions. Fire behavior is influenced by factors such as the type of fuel, the topography of the area, weather conditions and the ability to intervene to extinguish the fire. Thus, an effective decision support system (DSS), should first have access to the widest possible set of required input data and then to a number of interoperable tools to process these sets of data represented under common formats, manage and constantly update them, and finally efficiently process them in order to extract knowledge and deliver actionable insights to the first responders and incident commanders. This requires an effective combination of diverse knowledge sources into a unified framework by employing information fusion techniques and algorithms, such as data association, state estimation and decision fusion.
In this work, we present the approach of the SILVANUS project toward developing a multi-faceted DSS [3]. Beyond data collection, storage and real-time visualization, the platform provides the firefighters and other stakeholders with communication and information sharing tools, knowledge extraction capabilities, AI-boosted analytics and a decision support system dedicated to forest monitoring and fire management. Specifically, we focus on the development and evaluation of the DSS component that optimizes resource allocation of response teams (RART) based on the projection of fire spread and different properties of the affected geographical areas. The geospatial distribution of population and other GIS-related land properties as well as the distribution of fire units with their unique properties are taken into account and a multicriteria optimization problem can be formulated and solved in order to lead to cost minimization in terms of the minimum total risk of fire impact given the available resources to plan for the mitigation of this impact. This component is designed to support commanders in making optimal decisions on allocating response teams in the field, based on the progression of a wildfire incident and the operational status of available teams, leveraging the SILVANUS data and communication infrastructure. Its primary goal is to optimize area coverage and resource utilization using data collected from the monitoring systems. Consequently, the proposed platform is tailored to address real and practical requirements and needs, enhancing the effectiveness of mitigation efforts.
The remainder of this manuscript is structured as follows: In Section 2, we present the approaches toward DSS to assist response to wildfire incidents that have appeared in previous literature. In Section 3, we describe the architectural framework in which our resource allocation solution is designed. In Section 4, we formalize the optimization problem under the set of selected parameters and based on the available data sources. In Section 5, we present the results of our model validation in a controlled small-scale scenario, which helps us gain insight into the operation of the algorithm, the results of real-life scenarios executed using data from the SILVANUS pilot sites, and the results of the operation of the RART component integrated into the SILVANUS platform and dashboard. Finally, in Section 6 we make an overview of our work, summarize our main findings and provide concluding remarks.

2. Related Work

While measures and actions are equally important in all three phases of preparedness/prevention, suppression and restoration, it is a fact that wildfires are increasing in frequency and severity globally due to climate change, land use patterns and extreme weather events. Thus, measures to increase the efficiency of firefighting teams are becoming even more important. Starting from early detection to minimize response times and proceeding to complicated DSS tools to increase the situational awareness of first responders and incident commanders during the suppression phase is of highest importance. Previous research on wildfire management modeling has explored various aspects, including how fuel management and IFM strategies can be achieved through GIS spatial analysis modeling (a recent review appears in [4]), forecasting wildfire spread and cost-effective suppression planning (a recent review appears in [5]), and evacuation coordination during fire incidents (a recent review appears in [6]).

2.1. The Role of GIS Spatial Analysis and Modeling for Decision Support Systems

One of the primary factors influencing wildfire spread is land characteristics. All modeling approaches need specific values and characteristics of the specific position in the globe where a wildfire spread. Satellite technology and Geographic Information Systems (GIS) appropriately support the process from input, management, processing, spatial analysis, cartographic modeling and visualization of complex environmental data, referenced in space and time for forest fire risk management.
Such models can initially be used during the first phase of IFM to mitigate the risk of potential wildfires by enforcing proactive measures—commonly referred to as “fuel management”—such as the removal of live and dead vegetation. The authors in [7] developed several models aimed at reducing the impact of wildfires through such preventive actions, as well as preparing more effectively for suppression efforts [8]. Similarly, the authors in [9] proposed a model for assessing worst-case scenarios in specific wildfire settings, incorporating terrain features and mitigation strategies. GIS data were used in [10] to develop the forest fire risk map using the Forest Resource Inventory Database. The database used four types of date, namely topographical, human activity, climate and forest characteristics, to develop the so-called forest fire index (FRI). A GIS database was also developed for forest fire resources allocation in Lam Dong, Vietnam using a machine learning (ML) method and reported promising results for developing an alternative fire risk map in [11]. The ways fourteen different data sources influence the forest fire risk are shown in [12] and can be aggregated into a single DSS dashboard to characterize specific areas in terms of fire risk probability or optimal resource allocations during fire incidents in accordance with the area’s size, relative impact or other factors.
However, existing models often fall short of simultaneously addressing resource preparedness, modeling fire spread and capturing the dynamic impact of response efforts, highlighting the need for more comprehensive approaches as we discuss in the remainder of this section.

2.2. Forecasting Wildfire Spread Methods and Models

Accurate forecasting of fire front spread is essential for operational fire management, risk assessment and policymaking. Modeling wildfire management presents significant challenges, primarily due to the uncertainty in fire size and the dynamic nature of fire containment. Wildfires can spread unpredictably in various directions and at varying speeds, influenced by numerous factors. An effective model (either mathematical or ML-based) must account for a range of potential fire scenarios, incorporating different spread rates and directions. Even when the fire’s initial conditions are known shortly after ignition, the evolving actions of firefighting crews continue to influence the fire’s behavior, adding complexity to the modeling process. Moreover, in fast-moving fire events, available containment resources may be insufficient during the critical early response phase, posing an additional challenge for effective containment planning.
In the past decade, significant advancements have been made in modeling wildfire behavior, integrating multi-scale data and (lately) leveraging machine learning (ML). Fire spread models can broadly be categorized into five broad groups, namely empirical, physics-based, cellular automata/agent-based, machine learning, and hybrid approaches [13].
Empirical models use observational data to estimate fire spread based on environmental variables such as wind speed, fuel type and slope. The Rothermel model remains a foundational semi-empirical approach, particularly in tools like BEHAVE and FARSITE [14]. Recent advances include refinements in fuel models improving calibration for Mediterranean and tropical ecosystems [15] and operational applications such as FARSITE and FlamMap now incorporating temporal fuel moisture dynamics [16]. Such methods feature moderate computational complexity, making them suitable for rapid operational use, and can become rather easily well-calibrated for many ecosystems. However, there are limitations that must be taken into account, including their poor performance under extreme fire weather and their limited capacity for simulating crown fires or ember-driven spotting.
Physics-based models simulate fire spread by resolving the fundamental physical processes: combustion, fluid dynamics and heat transfer as used, e.g., in FIRETEC and WFDS [17] and WRF-SFIRE [18]. Their main advantage is that they deliver high-fidelity simulations capturing complex fire behavior, but this inevitably comes at a high computational cost and requires detailed input data.
Cellular Automata (CA) and Agent-Based Models (ABMs) are rule-based, discrete models that simulate local interactions on a spatial grid or among agents. Recent applications include CA models with dynamic fuel and wind effects [19] and ABMs that simulate ember spotting and firefighter behavior [20]. Such models are intuitive, computationally efficient and more flexible. However, these come at the cost of oversimplifying physical fire dynamics and becoming sensitive to rules and parameters.
ML and data-driven models use large datasets (e.g., historical fires, satellite data, weather, etc.) to predict fire spread. Recent developments include deep learning with LSTMs (Long-Short Term Memory) and CNNs (Convolutional Neural Networks) [21], ensemble models [22] and attention-based forecasting [23]. The strength of these methods lies in their ability to handle nonlinear relationships, being adaptable and capable of real-time use.
Hybrid models, finally, integrate physical, empirical and ML components. Examples include FireCast and WRF-SFIRE with ML downscaling [24,25]. These approaches combine the strengths of original models from which they are derived, being adaptable to different scales at the cost of complex integration and calibration.

2.3. Resource Allocation and Cost Minimization

Based on the functionalities provided by the tools discussed above (i.e., GIS spatial analysis data and fire front projection over multiple time intervals through fire spread modeling) more elaborate DSS tools can be developed to support incident commanders in taking optimal decisions with respect to the planning and allocation of the available resources so as to minimize the impact of wildfires and the overall cost of their suppression.

2.3.1. Linear Programming Based Optimization

Much of the operations management literature focuses on resource allocation through operations research models aimed at minimizing overall costs. These models often rely on linear or stochastic programming to optimize suppression efforts. For instance, the authors in [26] developed an integer programming model to minimize the combined costs of suppression, preparation and damage in the case of a single wildfire. For scenarios involving multiple simultaneous fires, the authors in [27] proposed a stochastic optimization model for initial attack resource allocation, supplemented by a simulation of the suppression process. In [28], the author proposes a two-stage stochastic integer goal programming model aimed at optimizing resource allocation across various wildfire scenarios. The model seeks to minimize both the number of people at risk and the total costs associated with fire suppression and land damage. A key feature of this approach is the simultaneous consideration of containment and evacuation decisions, enhancing efficiency and providing a more realistic representation of wildfire response. As urban expansion continues and seasonal fire risks fluctuate, the model emphasizes the importance of proactively scheduling on-duty resources at fire stations to ensure preparedness. Unlike earlier models, this one incorporates population and property density as crucial factors, directly influencing both containment and evacuation strategies. In some of the latest works, the authors in [29,30] introduce in their integer programming model parameters related to the routing of fire units and the required time to respond to fire events at specific places based on their initial position but simplifying all other parameters and not taking population density in the affected areas into account.

2.3.2. Search-Based Optimization and Heuristic-Based Approaches

A recent approach [31] couples a physics-based fire propagation model (based on cellular automata and Lagrangian fire particles) with a Monte-Carlo Tree Search (MCTS) algorithm to optimally allocate firefighting extinction actions such as aerial water drops and firebreaks. This method suggests the best spatial and sequential actions to minimize wildfire damage and protect critical areas, outperforming human intuition. However, it faces significant limitations with respect to the objective of this work, since it does not address joint optimization in terms of population in danger, area burned, property losses and cost of the solution, and furthermore, the simulation is intertwined with a physical model of fire spread, offering no modularity of the solution to work with alternative fire projection models. The spatial optimization models for fire station location and resource allocation proposed in [32] use mathematical and geographical methods like Voronoi diagrams and multi-objective location-allocation models to optimize response times and coverage for wildfire risk areas. They only help in planning where to locate firefighting units and how to allocate equipment and personnel efficiently but also cannot scale to true real-time multi-objective optimization solutions that can be applied during incident management. Ant-Colony Optimization has been used mainly to solve problems formulated mostly as routing or ordering problems [33] and cannot scale to deal with the multicriteria optimization nature of incident management as formulated in this work. Recent approaches have explored the use of Particle Swarm Optimization (PSO) in disaster management [34,35]. For instance, in [34], “SwarmFusion”, a hybrid method combining PSO with deep learning for real-time resource allocation in disaster response, is introduced. While this approach demonstrates the adaptability and fast convergence of PSO under uncertain and dynamic conditions (although statistically varying as shown in [35]), its application remains largely generic and does not account for wildfire-specific constraints such as accessibility limitations, differentiated unit capabilities, or lexicographic prioritization of objectives (e.g., minimizing human risk over property losses and costs). In contrast, our framework integrates these operational realities directly into a constrained optimization model, ensuring that resource allocation decisions are both practically grounded and mathematically rigorous, offering deterministic and transparent solutions within the wildfire management context. Genetic algorithms (GA) and simulation-based optimization techniques are also used to find near-optimal sequences of firefighting actions that maximize unburned areas, taking into account wildfire dynamics and constraints [36,37]. In [36], the authors present a simulation-based optimization approach to determine the scheduling solution of one forest firefighting resource to combat several ignitions, under the uncertainty of certain parameters. The problem consists of determining the optimal schedule for a single resource to travel from its base to all the ignition points and return to the base, in order to maximize the unburned area. Obviously, this problem definition is largely more constrained to the one we address in this work; it has not been able to achieve optimal solutions for critical parameters like people and properties exposed to the danger of fire. The closest GA-based approach to the one we follow in this work is found in [37], applied in a different domain, which, however, as described by the authors, can only be efficiently solved (shown to provide just high quality approximations of the Pareto front) in a GPU equipped supercomputer; thus limiting its applicability as a real-time generic and modular solution.

3. System Architecture, Concept of Operation and Contributions of This Work

3.1. System Architecture and Concept of Operation

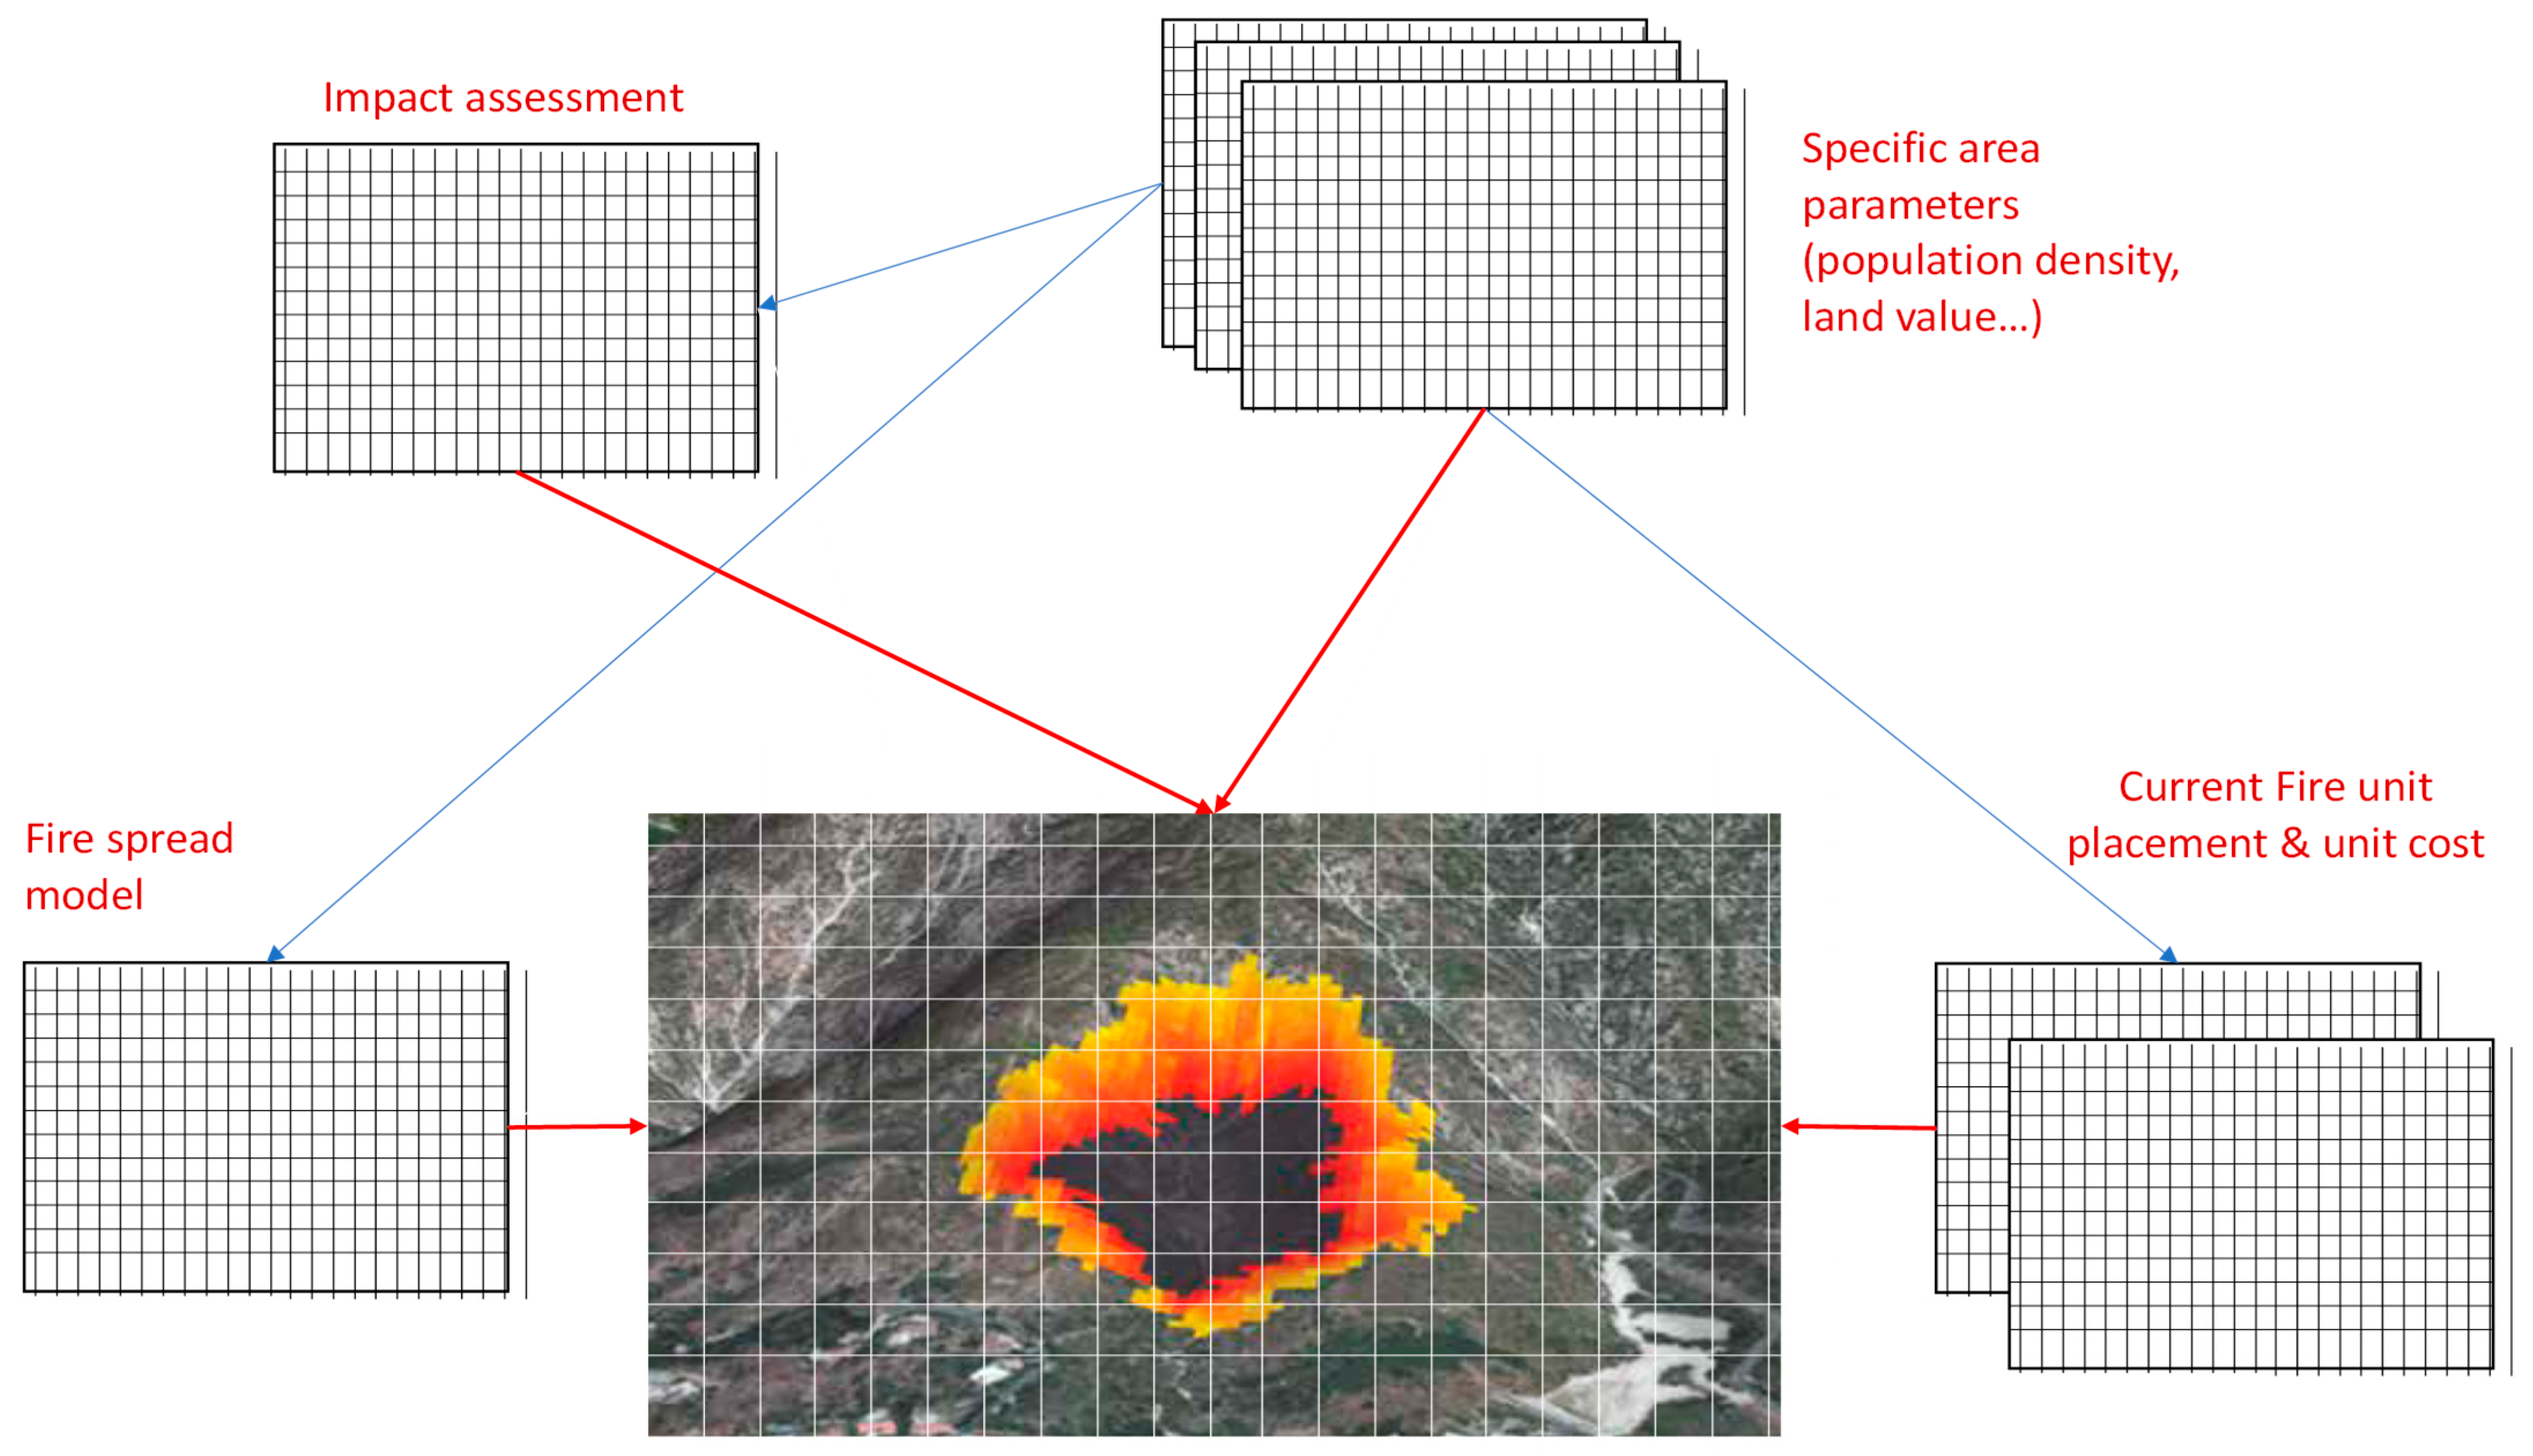
In this work, we focus on the resource allocation of response teams (RART) component developed in the framework of the EU funded Horizon 2020 project SILVANUS. The high-level diagram of the RART integration into the overall SILVANUS DSS is depicted in Figure 1 and presents the general information flow for executing this DSS task among a rich set of functionalities. The main inputs of the process are the fire spread projection, the population distribution, and the initial unit distribution/location, as well as additional parameters that may contribute to the impact of a specific area that may be affected by the approaching fire front (e.g., valuable infrastructure or high-risk infrastructures) and the properties of different types of firefighting units (e.g., capacity, cost of operation etc.) The output is the proposed unit distribution in various time intervals in the future (from next minutes to few hours), taking into account these inputs. Obviously, there are numerous factors that need to be taken into account in this process, highlighting the need to balance trade-offs when optimizing the unit resource allocation, which naturally leads to a multicriteria optimization problem. Hence, the resource optimization process is formulated as a mathematical model for wildfire management, with the primary objective of minimizing the number of people exposed to risk (and above all, loss of life), and the secondary objective of reducing the overall costs related to fire containment and property damage. The model determines optimal resource allocation decisions under the constraints of limited capacity and availability while accounting for both the fire spread and the spatial distribution of the population.
The inputs and outputs of the resource allocation model primarily consist of geospatial data, which can be classified into two main types: raster and vector data. Raster data is stored as a grid of values, which are rendered on a map as pixels, with each pixel representing a specific area on the Earth’s surface. Pixel values may be either continuous or categorical. Vector data structures represent distinct features on the Earth’s surface and assign attributes to those features.
In this study, as depicted in Figure 2, we use raster data because it provides the spatial information that connects the data to a particular location, including the raster’s extent and cell size, the number of rows and columns, and its coordinate reference system (CRS).
The SILVANUS Fire Spread Model (FSM) is an ML tool designed to forecast the progression and spread of wildfires over the next 24-h period. The model incorporates a variety of input parameters, including terrain features (elevation, slope, aspect), meteorological forecasts (temperature, wind speed, wind direction, etc.), fuel characteristics (fuel type, moisture, canopy properties, etc.), barriers (firefighter efforts, roads, bodies of water, etc.), and the current fire front location. Using this information, the FSM generates a series of images showing the predicted fire front positions at 28 indicative time points within the next 24 h. Each image covers an area of one square kilometer (e.g., 1 × 1 km), with a spatial resolution of 10 m by 10 m per pixel.

3.2. Contributions of This Work

The SILVANUS RART model, as will be presented in detail in the following section, presents several innovations compared to the approaches reviewed in Section 2 above. Exploiting the Big Data Framework (BDF) of SILVANUS, RART exploits access through its Storage Abstraction Layer (SAL, [3]) to a wealth of data on which it operates. Such data include both historical data from GIS and databases as well as real-time data from other DSS components like the FSM projection and the actual distribution and location of firefighting units available through its Internet of Things (IoT) infrastructure. Thus, the model that will be described in the following section incorporates a number of parameters beyond those listed in Section 2.3 above, including among others the fire intensity (from which the minimum suppression capacity is derived) over each pixel on the map where the fire spread is projected, the availability of road infrastructure (from which the parameter expressing the limitation of accessibility by land is derived), the availability of different types of firefighting units over different time spans, the properties of each unit and multiple land related parameters. The RART component and the optimization model we developed has been integrated and validated using both raster-based outputs provided by one of the most well-known empirical fire-spread forecasting models (as described in Section 2.2) namely FlamMap [16], as well as the ML-based SILVANUS FSM, providing outputs in vector format (GeoJSON format). Finally, for the model validation, we developed our own Python-based UI for running scenarios locally. We also integrated RART with the SILVANUS dashboard, through which all DSS components can be accessed and all data can be visualized. The SILVANUS dashboard is the ultimate tool, integrating the DSS components and leading to improved situational awareness for incident commanders, providing actionable insights and different modes of data filtering and visualization. In Section 4, indicative results will be presented, demonstrating the efficiency of the proposed algorithm in real-life scenarios with data derived from different SILVANUS pilot sites (validation scenarios have overall been executed in areas of Italy, the Czech Republic, Greece and France).

4. Multicriteria Optimization Based Resource Allocation (MORA)

Estimating impact risk based solely on the population’s geographical distribution only provides a general overview to improve commanders’ situational awareness and cannot lead to specific strategies for actual resource allocation. However, the integration of additional data regarding the firefighting capacity and geographical distribution of fire units, as well as more land properties to be considered for impact minimization (e.g., critical infrastructure), can enable a more sophisticated analytical framework. Taking these inputs into consideration, more advanced recommendations can be generated to solve an even more complex optimization problem by improving the effectiveness of resource allocation and minimizing expected losses. This framework is referred to as Multicriteria Optimization-based Resource Allocation (MORA), and its operation and implementation is described in the following subsections.

4.1. Model Assumptions and Data Sources

The spatial resource allocation problem is approached as a constrained optimization problem (COP). In mathematical optimization, such problems refer to maximizing or minimizing an objective function while satisfying a set of restrictions on the decision variables. In our case, the formulation of the overall cost minimization function requires consideration of the following three separate objective functions:
  • The total population in risk.
  • The total land/property losses.
  • The total cost of resource units.
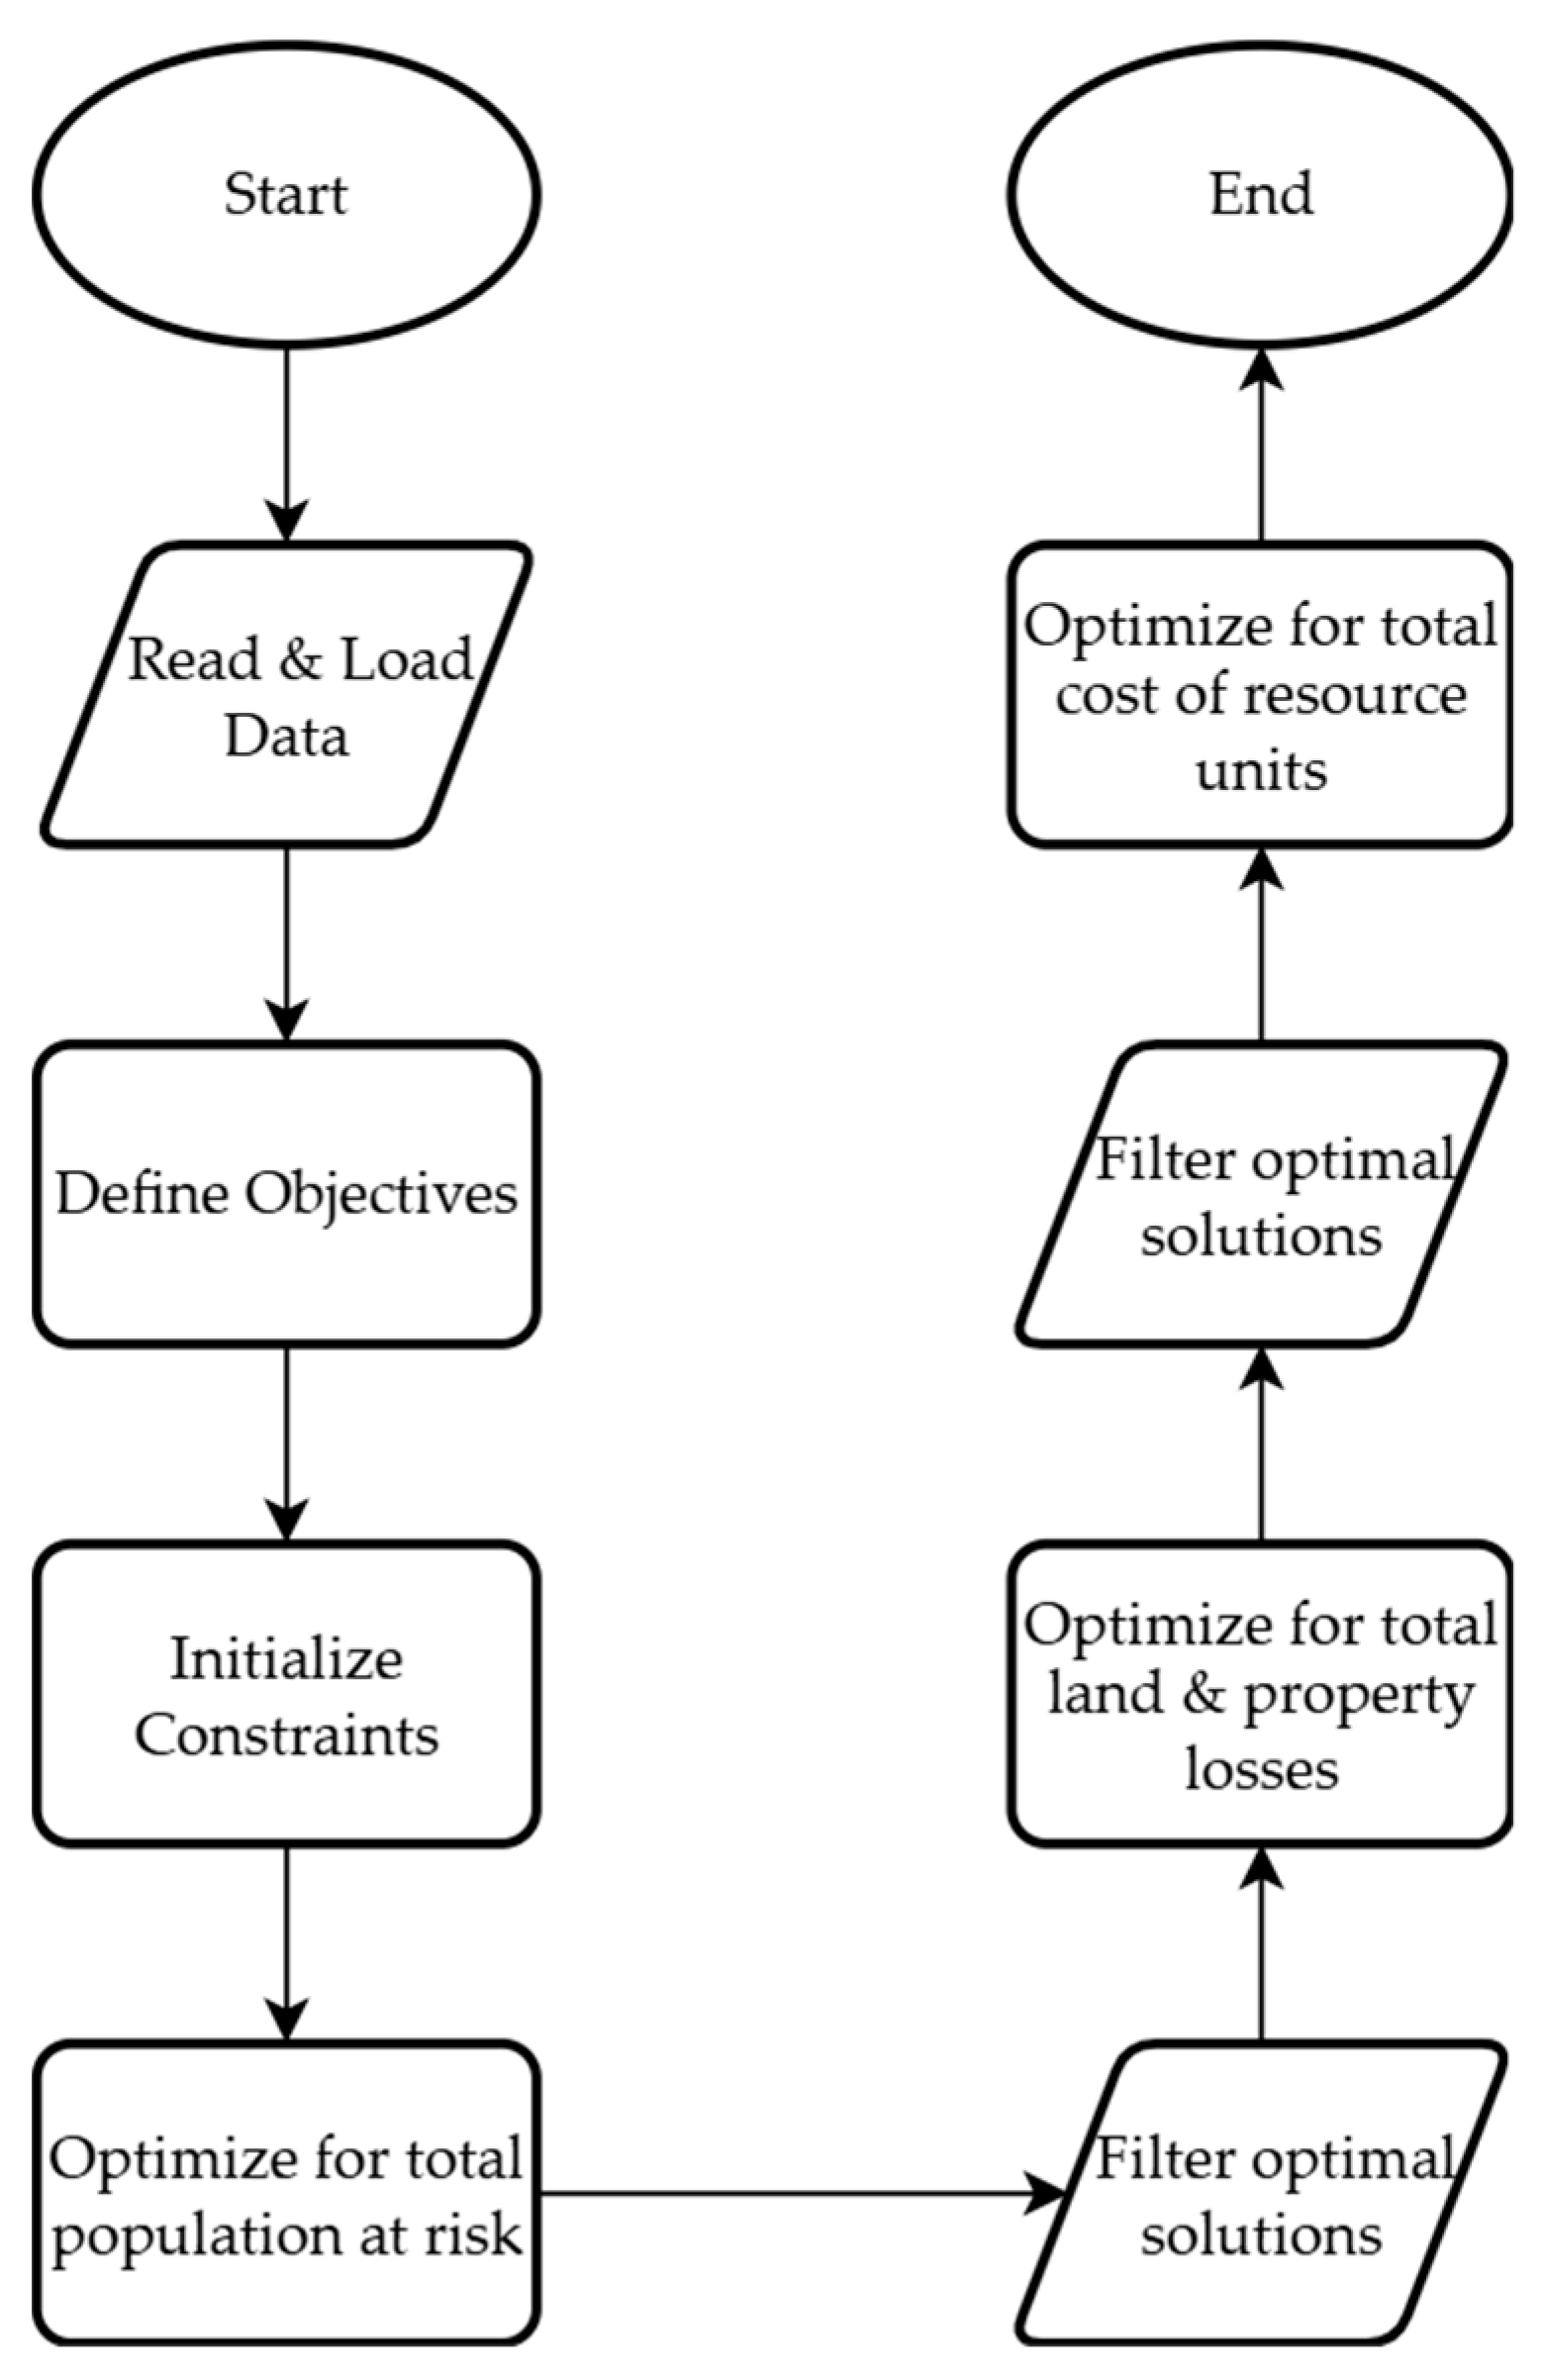
Obviously, the algorithm considers the first objective function as of highest importance compared to the second and third ones. To properly reflect this prioritization, the optimization is not performed by aggregating the three objectives into a single weighted function, but instead by adopting a lexicographic (sequential) optimization strategy. In this approach, the solver first minimizes the population at risk, which represents the critical objective of safeguarding human lives. Among the optimal solutions, the second objective, concerning land and property losses, is then minimized. Finally, within the subset of solutions optimal for both the first and second objective functions, the third objective, related to the cost of resource units, is minimized.
Fire suppression is modeled as a process wherein various types of resource units become available at different time intervals. Once ignition occurs, the fire spread model estimates the time at which the fire will reach each cell, referred to as the fire arrival parameter. Thus, each cell has a fire arrival value, indicating the moment the fire is estimated to start burning the cell and the cell becomes high-risk according to the fire spread model. In this stage, a detailed fire suppression plan is calculated for the corresponding time period. Planning decisions focus on identifying high-risk areas and allocating resources by their availability. Resource availability is time-dependent, meaning some of the resources cannot join fire suppression until a specific period. For instance, aerial firefighting or non-local resources become available after some time. Another important parameter that is taken into account is the accessibility constraint. For instance, the existence of a path or road facilitates the movement of an engine crew resource unit, enabling them to confront the fire more effectively. Conversely, in highly forested areas, deploying an engine crew unit may be impractical or impossible. Therefore, the model considers both the availability of the resources and the accessibility of different areas, ensuring that the units are deployed effectively based on their ability to reach and operate in specific cells.
The model is built on the assumption that resource allocation decisions are guided by the current fire conditions, with more resources directed toward more severe fires. The fire condition determines whether an area is classified as high-risk, completely burned or treated under the protection of firefighting units that have been dispatched to the area. By continuously monitoring the fire conditions in each area, as provided by the fire front projection derived by the fire spread model, resource allocation and evaluation of property losses are determined.
In the presented model, geographical areas are divided into cells to represent the fire spread process. The size of each cell is associated with the fire spread rate and the length of each period. Thus, fire scenarios with faster spread rates are modeled with larger cells, whereas slower spread rate fires correspond to smaller cells. For each scenario, population density and land value per cell are generated from publicly available datasets. In our case, geospatial population distribution data were obtained from the WorldPop research group [39].
When a fire begins, the initial conditions of cells, including the fire-starting point, are updated according to the fire spread model. These initial cell conditions are determined as:
  • High-risk: The cell is about to be affected by the fire or has been partially on fire.
  • Burnt: The cell has been fully burnt and cannot be treated.
  • Treated: The cell is treated by response teams.
There are three prerequisites for a cell to become a new high-risk cell:
  • It should have at least one burnt cell neighbor.
  • It should not have been a burnt cell before.
  • It should have never been treated before.
In the subsequent periods, the outcomes of suppression activities, determined by resource allocation decisions, modify these conditions and result in an update. These updates are performed with the aim of minimizing the total population exposure in high-risk cells and the overall cost associated with land–property value losses and firefighting resources.
To summarize the sequential steps of the proposed multicriteria optimization approach, an overview of the MORA algorithm is depicted in Figure 3. The flowchart presents the workflow from data loading and preprocessing to the definition of objectives and constraints, followed by the sequential lexicographic optimization stages that minimize the population at risk, land–property losses and operational cost of firefighting resource units.

4.2. Model Formulation

The model includes the following sets, parameters, decision variables, objective functions and constraints described below.

4.2.1. Sets

The sets used in our model are the following:
  • A: Set of cells in consideration, indexed by a.
  • I: Set of resource types, indexed by i.
  • T: Set of discrete time periods, indexed by t.

4.2.2. Parameters

As explained above, the model operates based on a number of parameters that need to be taken into account when expressing constraints in the optimization process. Below, we list these parameters with a short description.
  • B: Budget for resource units. This is a control parameter that sets an upper bound to the total cost of resources. Obviously, with an infinite amount of budget there would not be a need to optimize the use of resources, but this is not the case in practice.
  • R: Minimum required suppression rate for each cell (chains/hour). This can be provided as a projection by some of the fire spread models like Flammap.
  • Pa: Population Density at cell α. This is provided by GIS models like Worldpop.
  • Va: Property and land value at cell a. This could be provided by GIS models developed and maintained specifically by authorities like civil protection agencies, etc.
  • Si: Suppression rate of resource i. This is known for each type of unit depending on the water tank capacity of a truck, a plane or helicopter etc.
  • Ci: Unit cost of resource i. This cost is not necessarily expressed solely in monetary terms. It could also be related to other conditions, including the risk of reserving resources in an event, leaving other high-risk areas unprotected, increasing the utilization of units with high cost and long delay in their maintenance, etc. It is directly related to the way of expressing the total available budget B.
  • Ki,t: Capacity (availability) of resource i in period t. This is provided by the firefighting authorities and civil protection agencies, and it is known by the incident commanders. Their availability and geographical dispersion is also facilitated by real-time connectivity through an IoT infrastructure, which is becoming widespread lately.
  • Ha,t: Binary parameter defining whether cell a will be high-risk in period t. The conditions for this were explained in Section 4.1 above.
  • Ga: Binary parameter defining whether cell a is accessible. This is again related to GIS data and expresses the condition that a road is available (and free of danger) so that land units and troops can reach this area.
  • Mi: Binary parameter defining whether resource i has accessibility constraints (i.e., land vs. aerial units).

4.2.3. Decision Variables

  • xi,a,t: Number of resources i sent to cell a in period t.
  • µa,t: Binary variable defining whether cell a becomes high-risk in period t.
  • ka,t: Binary variable defining whether cell a becomes fully burnt in period t.
  • ɸa,t: Binary variable defining whether cell a starts to be treated in period t.
  • Zi,a,t: Binary variable defining whether resource i is allocated to cell a in period t.

4.2.4. Objective Functions

  • O1: Total number of people in fire risk.
  • O2: Total land/property losses.
  • O3: Total cost of resource units.
O 1 = a A P a   t T µ a , t
O 2 = a A V a   t T k a , t
O 3 = i I a A t T x i , a , t   C i
l e x   min ( O 1 , O 2 , O 3 )   s u b j e c t   t o   c o n s t r a i n t s   ( 5 ) ( 21 )

4.2.5. Constraints

Below, we list the bounds that exist in our resource allocation and are related to the parameters taken into account as explained in the previous section or express general conditions and assumptions in our modeling.
  • Total budget for resources must not be exceeded:
    i I a A t T x i , a , t   C i B
  • For each period and for each resource type, the total number of resources must not exceed the capacity (availability):
    a A x i , a , t K i , t   i I , t T
  • All resources sent to each cell are sufficient to contain the fire in this cell:
    i I x i , a , t   S i ɸ a , t   R   a A , t T
  • Resource allocation depends on accessibility:
    z i , a , t G a M i   i I , a A , t T
  • Only high-risk cells will be treated:
    ɸ a t µ a , t a A , t T
  • If a cell is a high-risk in t − 1 and is not treated in t − 1, then it will become a fully burnt cell in t:
    k a , t µ a , t 1 ɸ a , t 1 a A , t 1 , T
  • Each cell can become a high-risk cell, a burnt cell or a treated cell at most once:
    t T µ a , t 1   a A ,   t T
    t T k a , t 1   a A ,   t T
    t T ɸ a , t 1   a A ,   t T
  • Each burnt cell or treated cell needs to be a high-risk cell previously:
    t T k a , t t T µ a , t   a A
    t T ɸ a , t t T µ a , t   a A
  • If a cell has fully burnt, it will never be treated in the future and the opposite:
    t T k a , t + t T ɸ a , t 1 a A
  • Each high-risk cell must become a treated cell or a burnt cell in the end:
    a A t T ɸ a , t + a A t T k a , t a A t T µ a , t
  • To become high-risk, a cell must have at least one fully burnt cell neighbor:
    10   µ a , t = H a , t a   n e i g h b o r s a k a , t a A , t 1 , T
    10   1 µ a , t 1 H a , t a   n e i g h b o r s a k a , t a A , t 1 , T
  • Nonnegativity of the number of resources:
    x i , a , t 0 i I , a A , t T
  • Binary variables limitations:
    µ a , t , k a , t , ɸ a , t 0,1 a A , t T

5. Model Demonstration and Validation

5.1. Model Demonstration

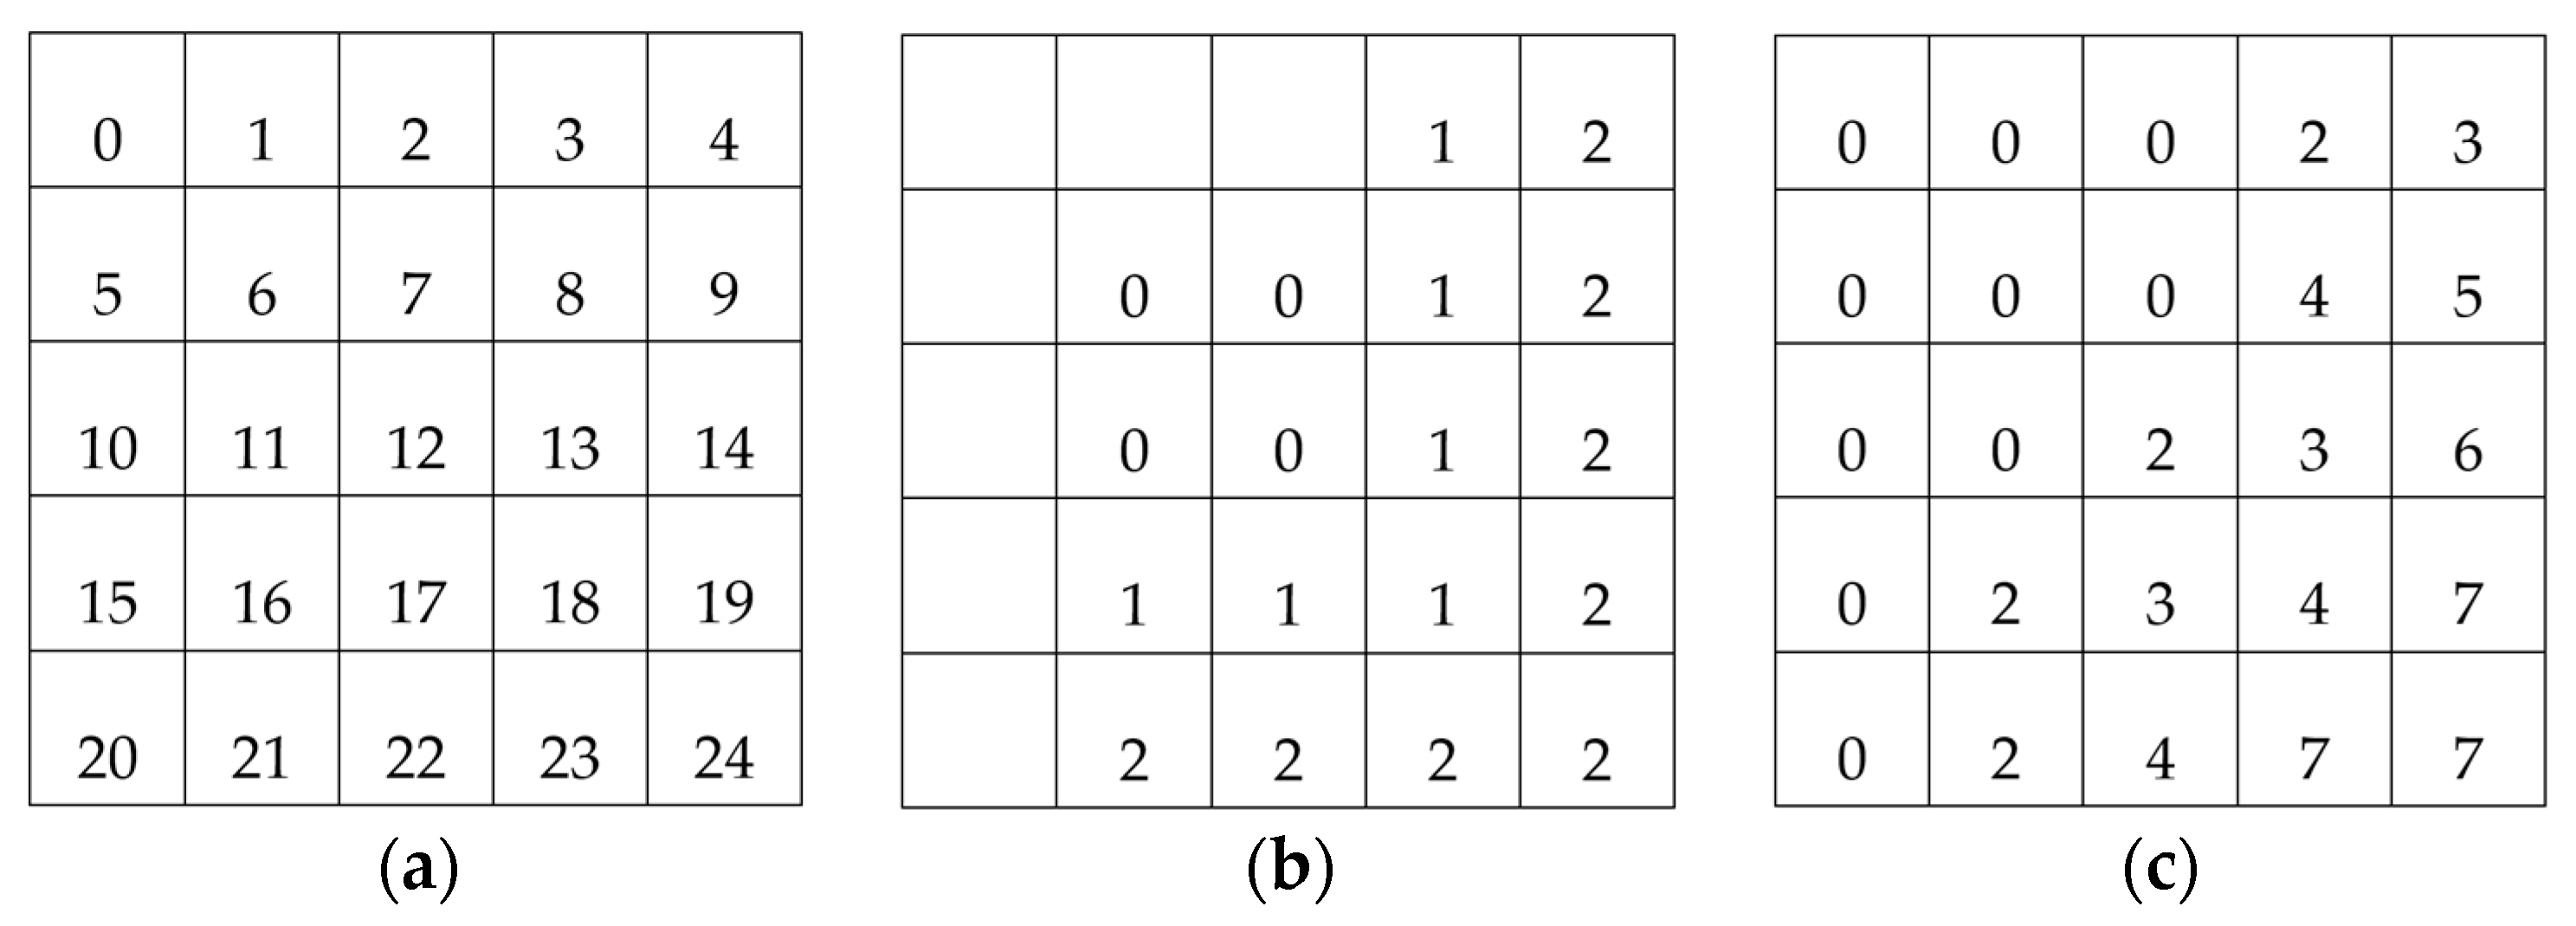
First, we present a scenario over a small area with data values that facilitate easy tracking of results so as to validate that the outputs comply with the model constraints. A simplified scenario with a 5 × 5 cell grid is used to demonstrate the MORA results across three time periods. Each period is assumed to last one hour (as an indicative value). In this experiment, the fire spread rate is considered to be constant per hour, meaning it does not vary over time. Consequently, cell sizes remain unchanged across periods, and both the fire arrival times and population densities within each cell are fixed. Cell indexes and corresponding assumed fire arrival times and population densities are shown in Figure 4. According to fire arrival times, the fire starts at the cells with indexes 6, 7, 11 and 12.
In this simple example, we assume that there are three different resource types of response teams (A, B, C) with different parameters as shown in Table 1. In real life, this could be a helicopter as type C, a fire engine (fire brigade with crew) as type B, and a hand crew as type A. The minimum suppression rate to contain the fire in each cell is 10, while the total budget is 100.
The operation of the MORA algorithm results in allocating the available response teams to different cells in the field over time so as to minimize the total population in high-risk cells and land–property value losses with the lowest possible cost of resources. To simplify the process in this demonstration, it was assumed that the land value is the same and equal to one across all cells. This means that the land value losses are equal to burnt area. Therefore, the solution is expected to lead to the minimum number of burnt cells.
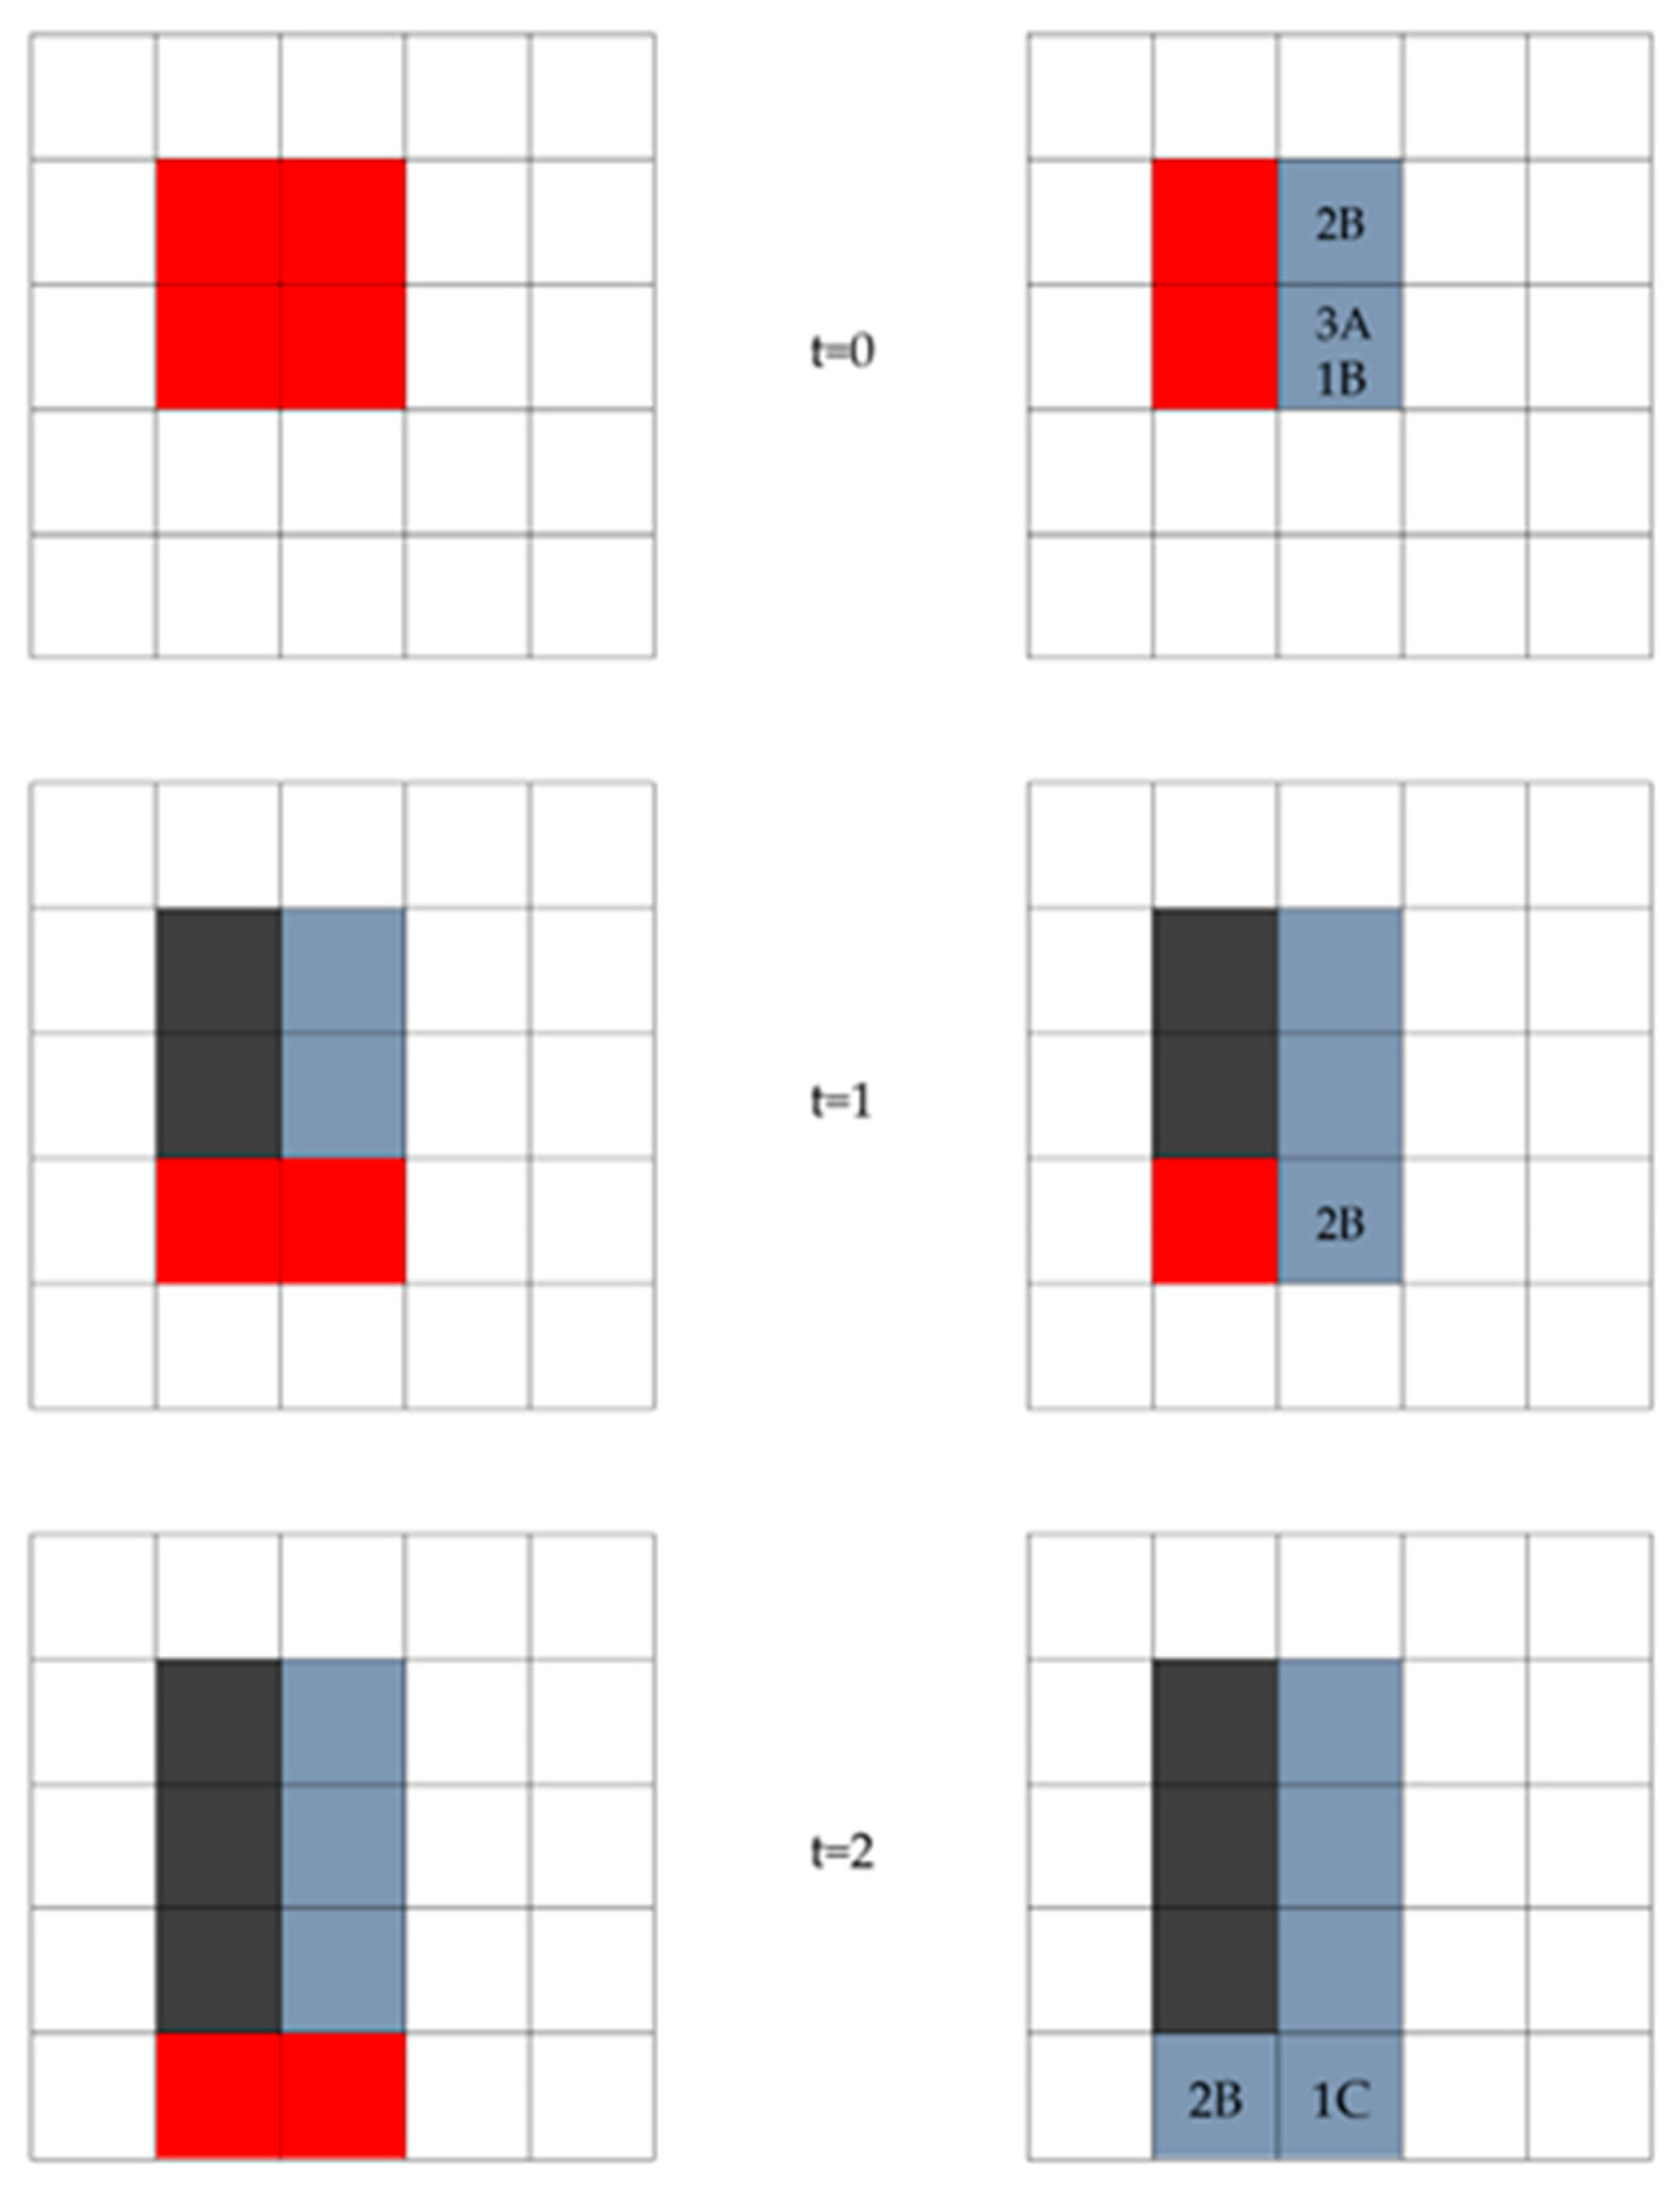
The optimal solution obtained for the constrained optimization model is illustrated in Figure 5. High-risk cells are marked in red, treated cells in gray and burnt cells in black. At t = 0, MORA recommends allocating two type B units to the cell with index 7, and three type A units along with one type B unit to the cell with index 12. No resources remain available to contain the fire in the other two high-risk cells (index 6 and 11), which mirrors a common constraint in realistic scenarios. So, by t = 1, these cells become fully burnt and the fire advances to the neighboring cells. Based on resource availability, MORA suggests assigning two type B units to the cell with index 17. So, at t = 2, the cell with index 16 is fully burnt while the cells with indexes 21 and 22 transition to high-risk cells. At this point, sufficient resources exist to be allocated to these high-risk cells to contain the fire. Specifically, two type B units are placed in the cell with index 21 and one type C unit in the cell with index 22, sufficient to suppress the fire in these cells. The preference for one type C unit over two type B units reflects cost efficiency, as the same level of suppression is achieved at lower expense.
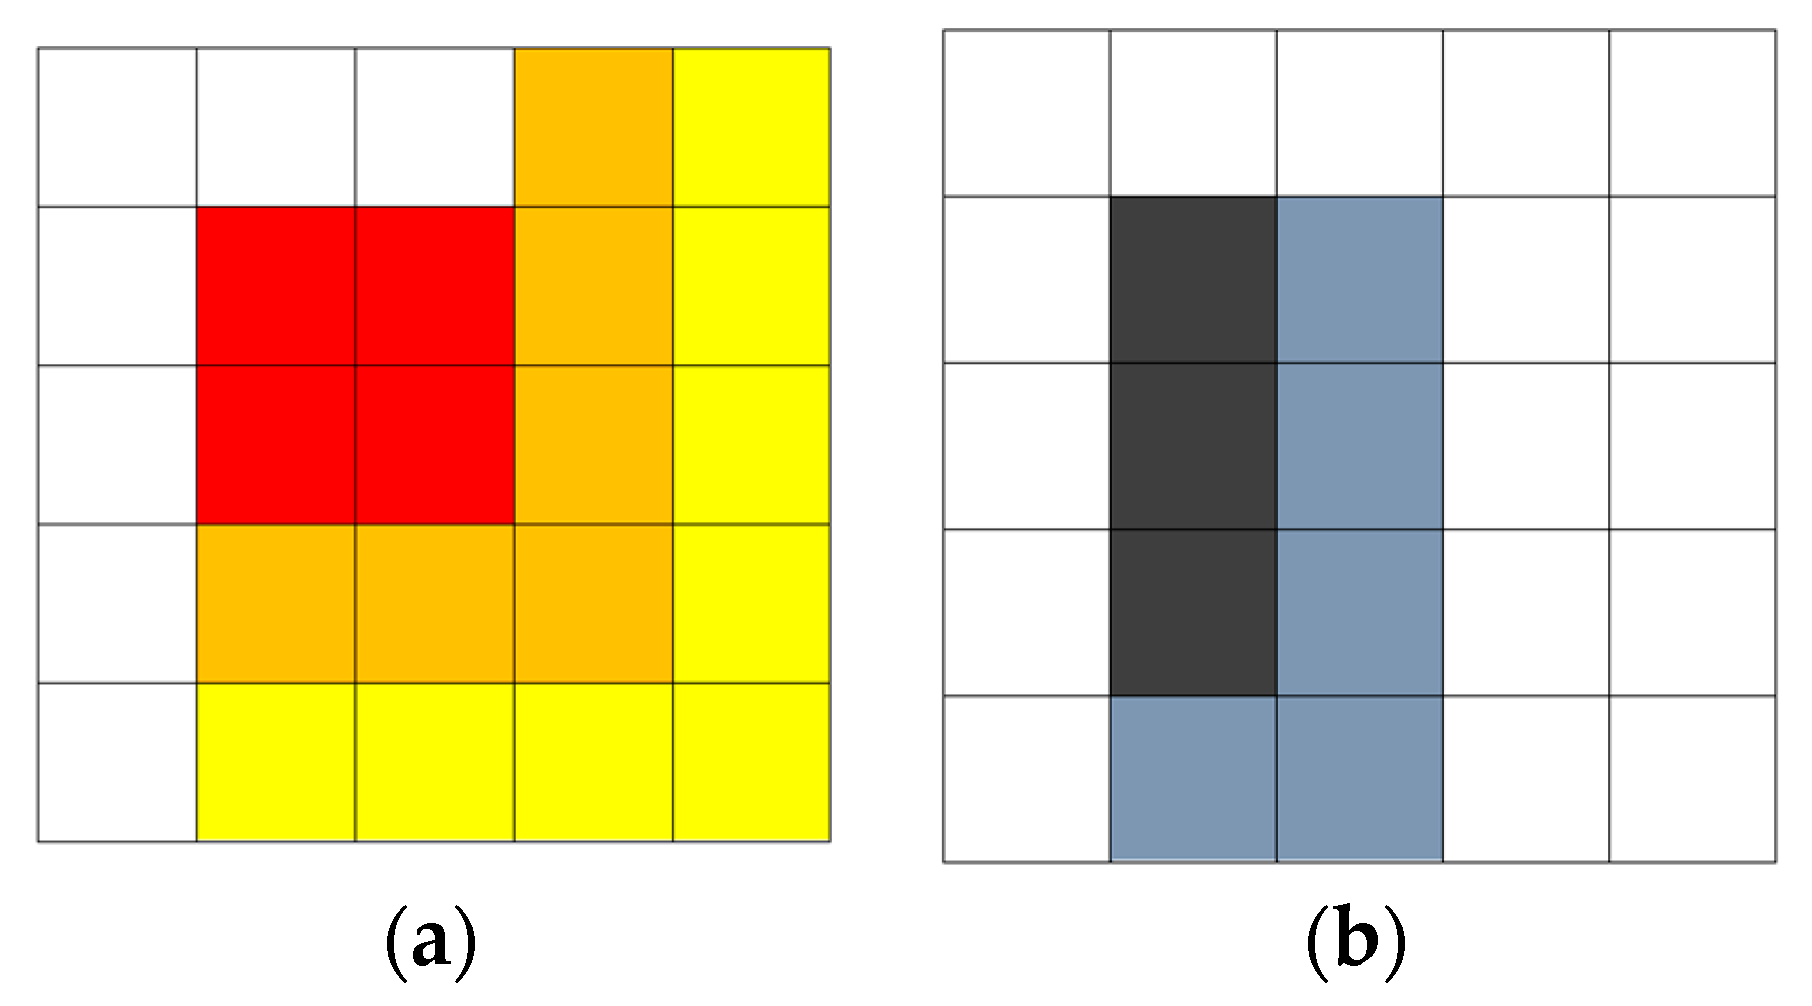
In summary, MORA provides recommendations for allocating the available resources of response teams across specific cells with the objective of reducing both the total population at risk and the total areas burnt. Under this strategy, the fire is contained to the bottom cells rather than spreading to the right-hand cells, where the population density is higher. The demonstration outcome is visualized in Figure 6, where the grid on the left displays the fire spread based on arrival times, while the grid on the right shows the area after the suppression efforts of the response teams.

5.2. Model Validation in in the Gargano, Italy Scenario

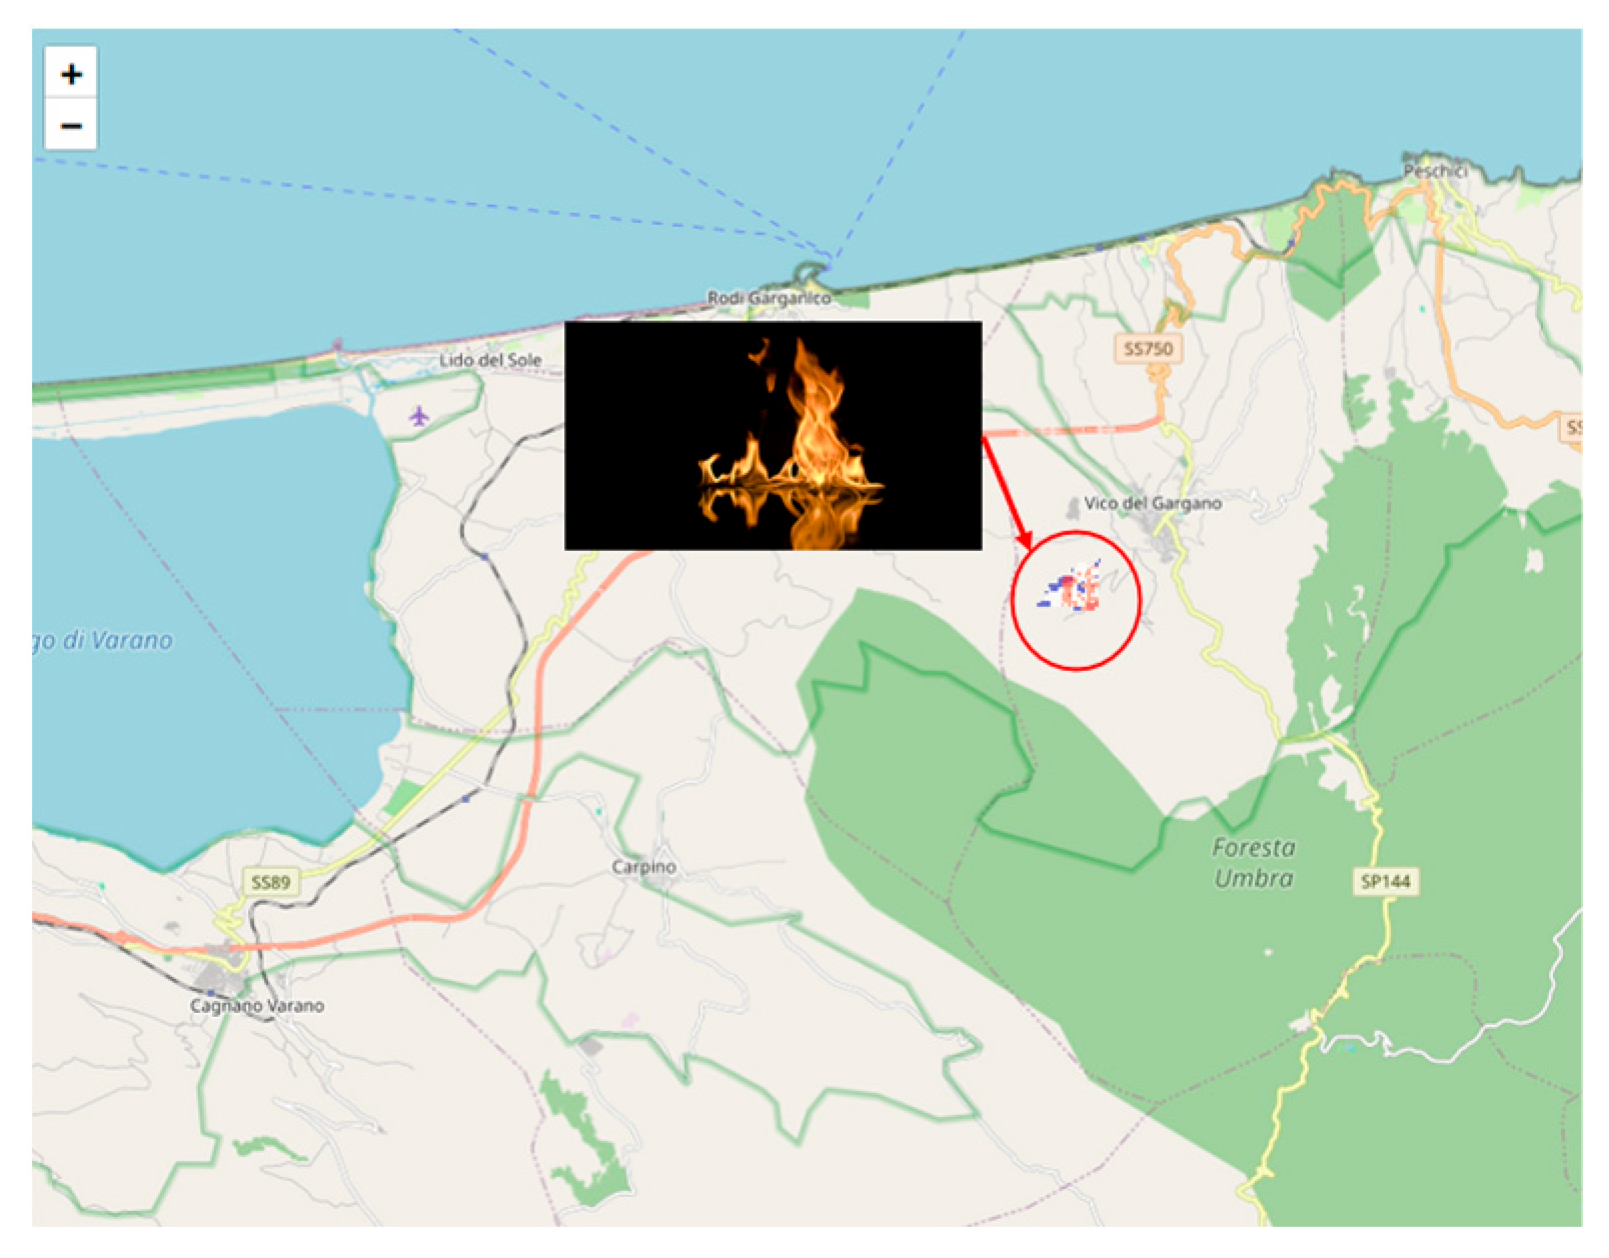
The validation of the MORA implementation in realistic scenarios was initially implemented in Gargano, Italy, as shown in Figure 7 and Figure 8, and then other scenarios were executed for areas in Greece, the Czech Republic and France. The area under examination in this case extended in a rectangle of 1 km by 1 km and a grid of cells with a size around 45 m.
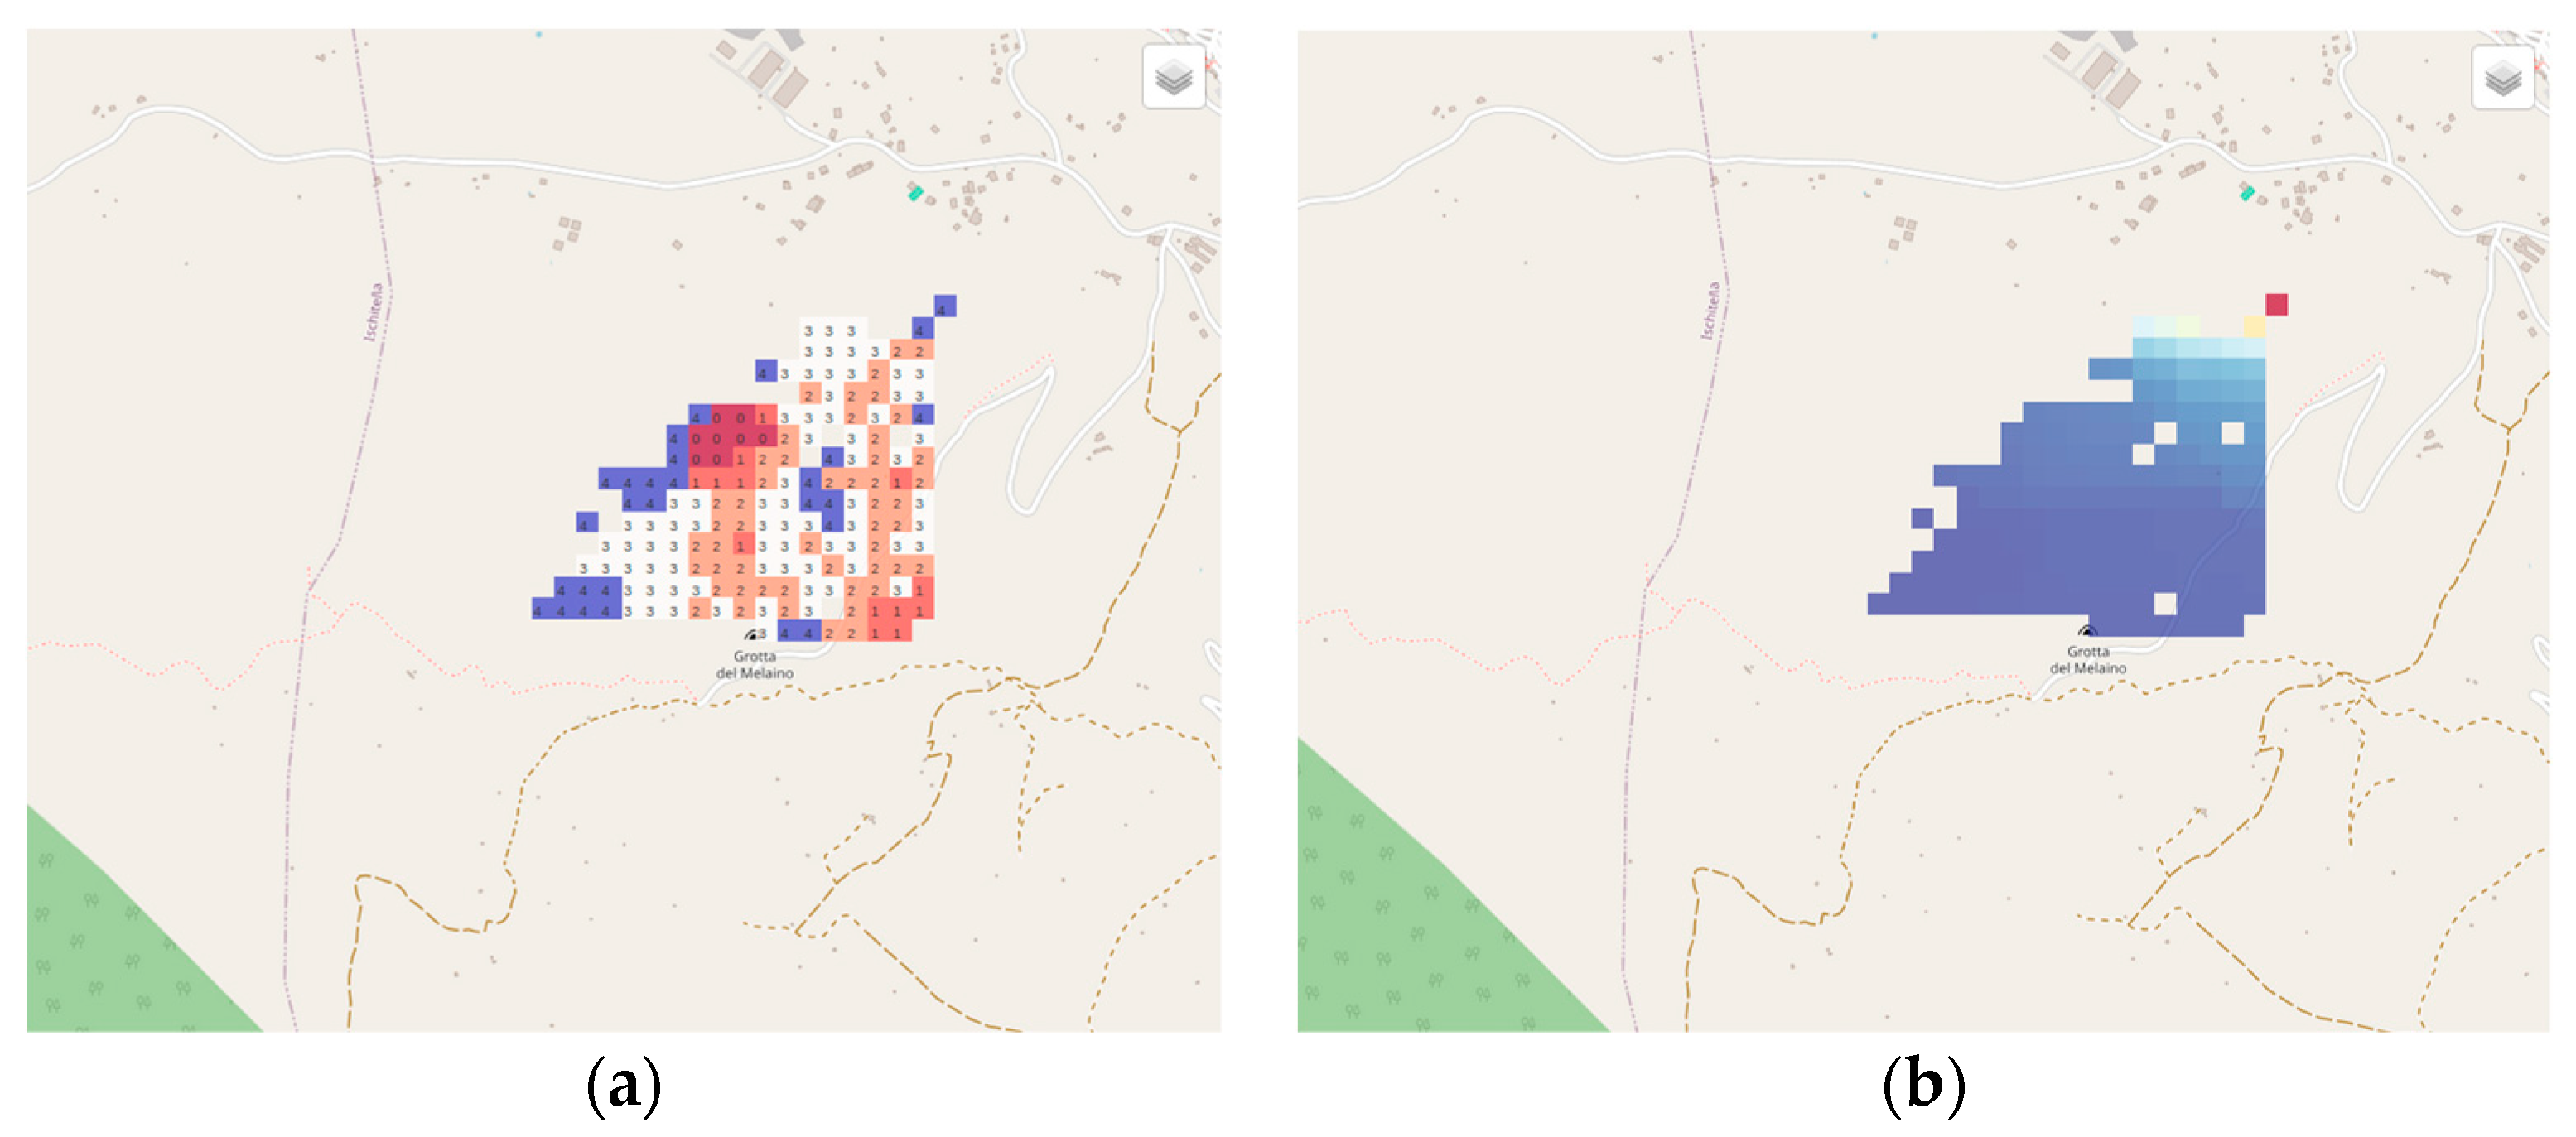
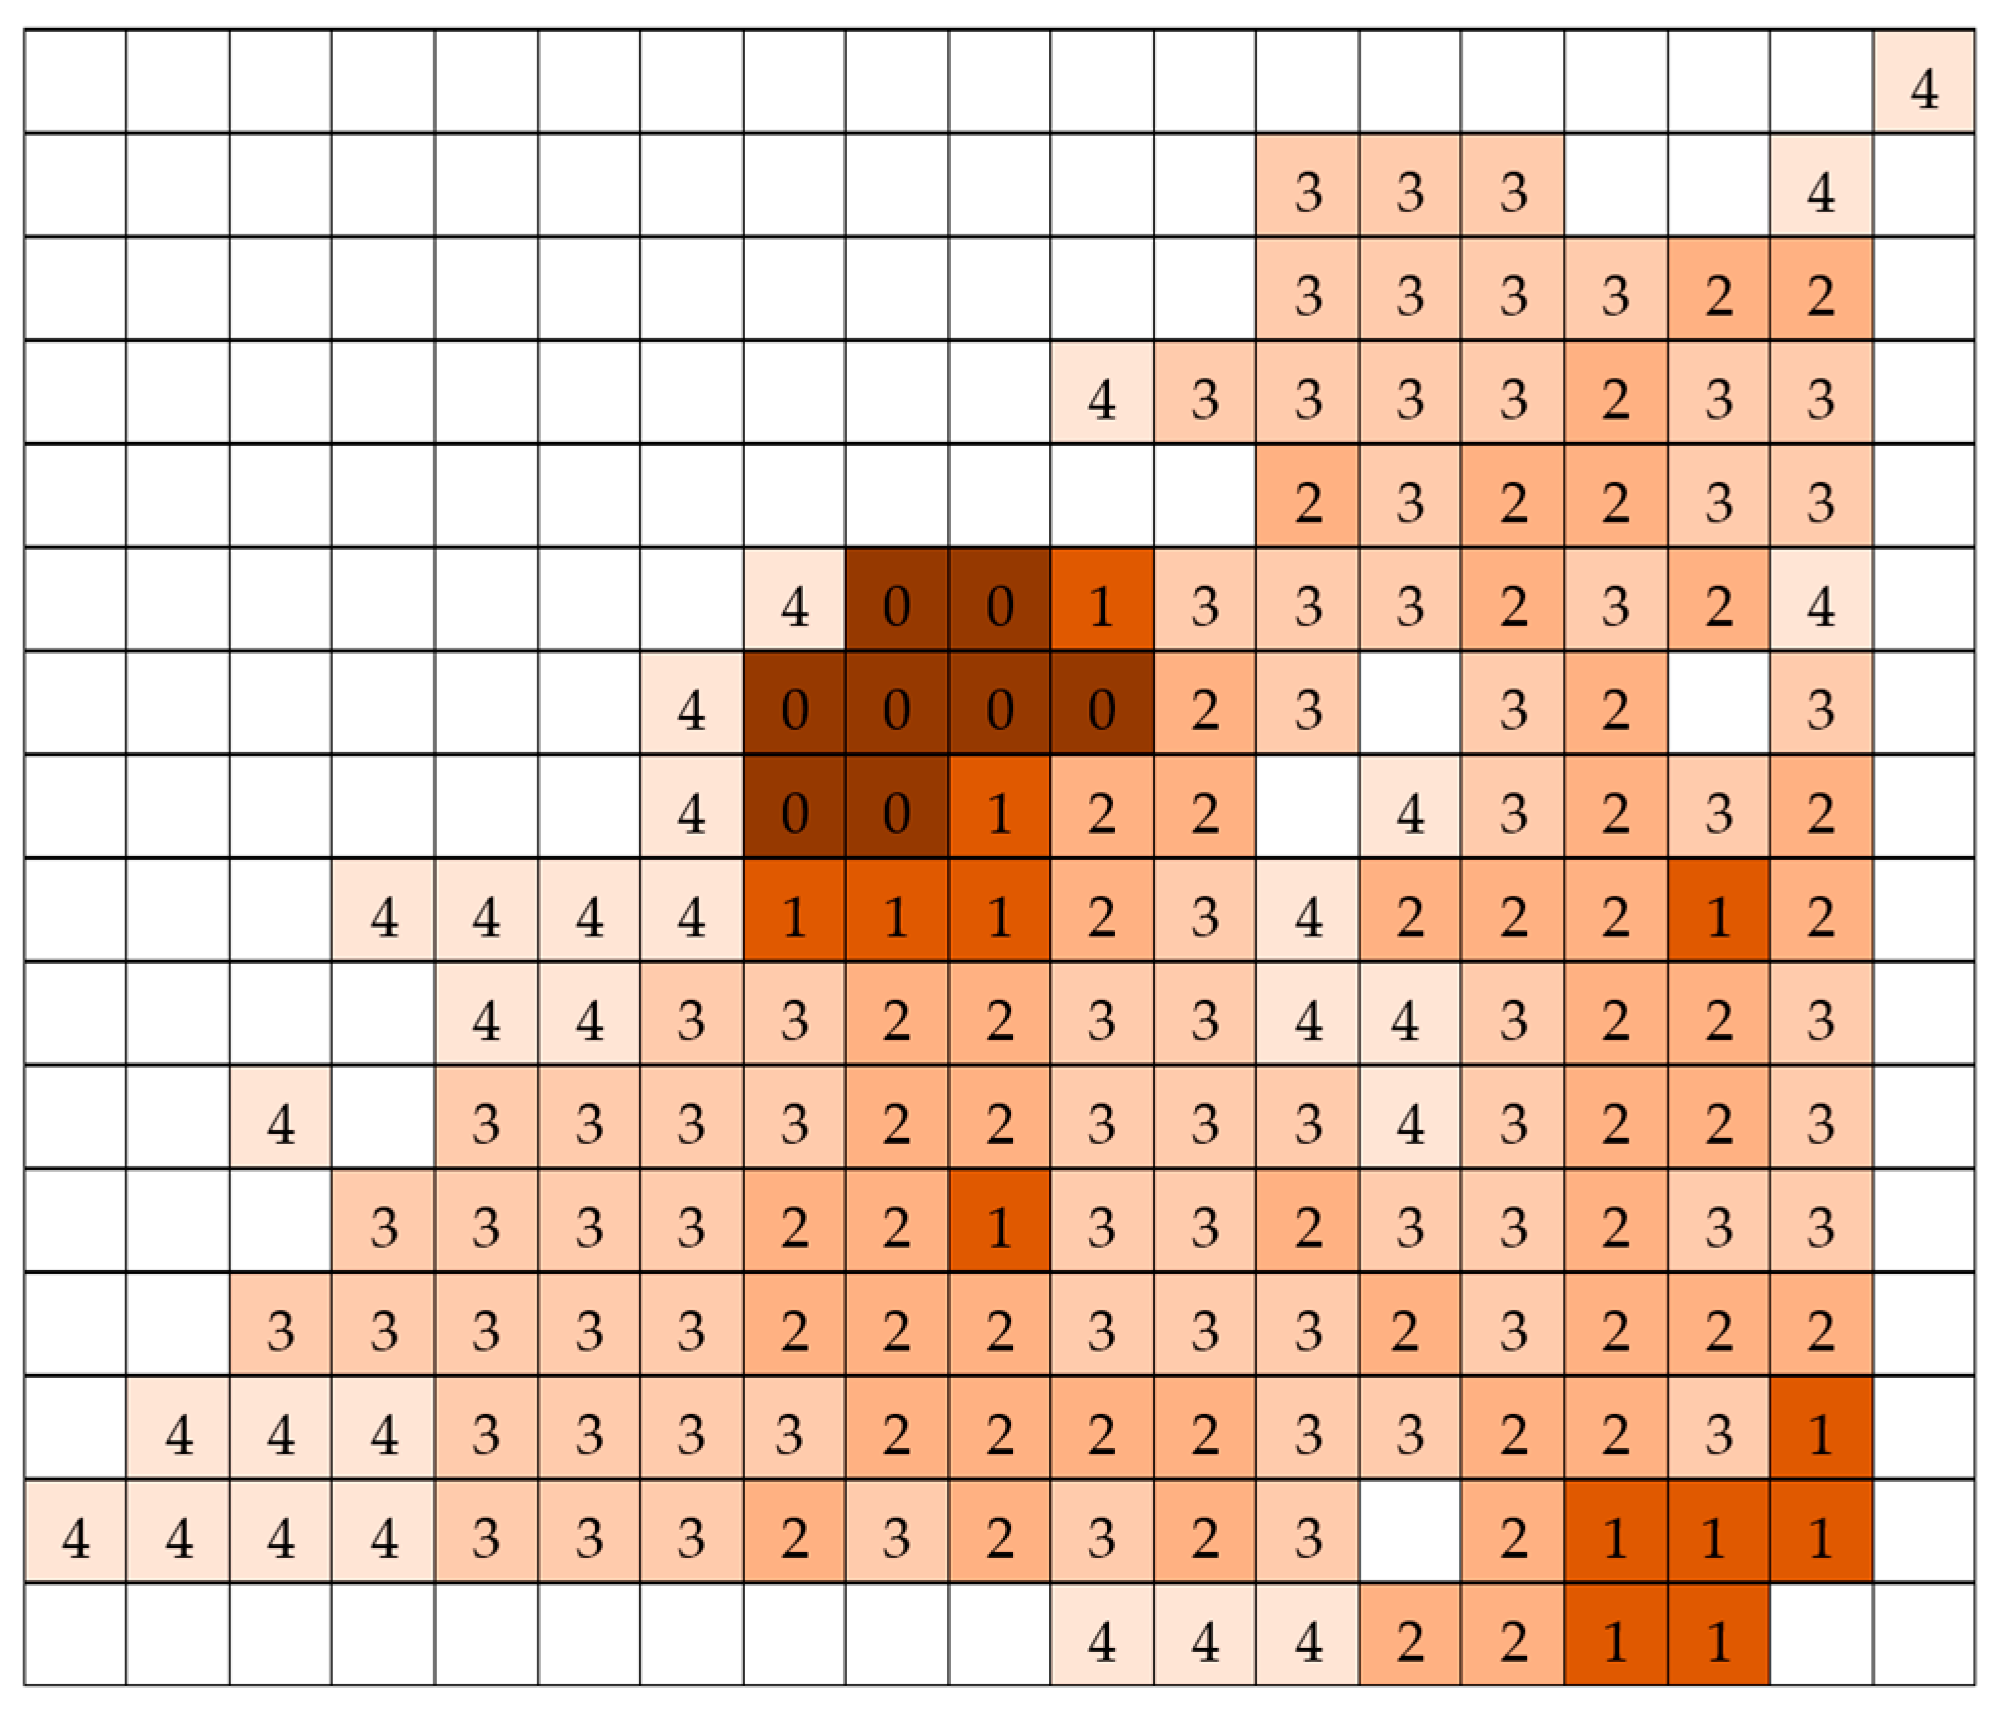
A scenario for an area of 23 × 22 cells is used to demonstrate the model results over four time periods, as provided from the fire spread model (Figure 8). The period times refer to 15, 30, 60 and 120 min after the fire incident, where in the visualization each time interval is depicted as time 1, 2, 3 and 4 accordingly. It is assumed that the fire spread rate does not change over time, so that the cell size stays the same in each period. Thus, fire arrivals and population densities are fixed in each cell. It can be noticed that the population distribution seems dense in the upper right corner, where the village of Gargano is located. The fire arrival times as an output of the FSM for this scenario are shown in Figure 9. According to fire arrivals, the fire starts in the cells with a value equal to 0.
In this validation scenario, it is assumed that there are three different resource types of response teams; the hand crew, the engine crew and the helicopter, with different parameters as shown in Table 2. The minimum suppression rate to contain the fire in each cell is shown in Table 3, while the total budget is 10,000.
During each period, the MORA framework allocates the available response teams in the field with the aim of minimizing both the total population exposed in high-risk cells and the overall cost associated with firefighting resources and land–property value losses. For simplicity in this validation scenario, the land value is assumed to be uniform and set to one across the entire area, making land value losses equivalent to the burned area. Therefore, the solution is expected to result in the smallest possible number of burned cells.
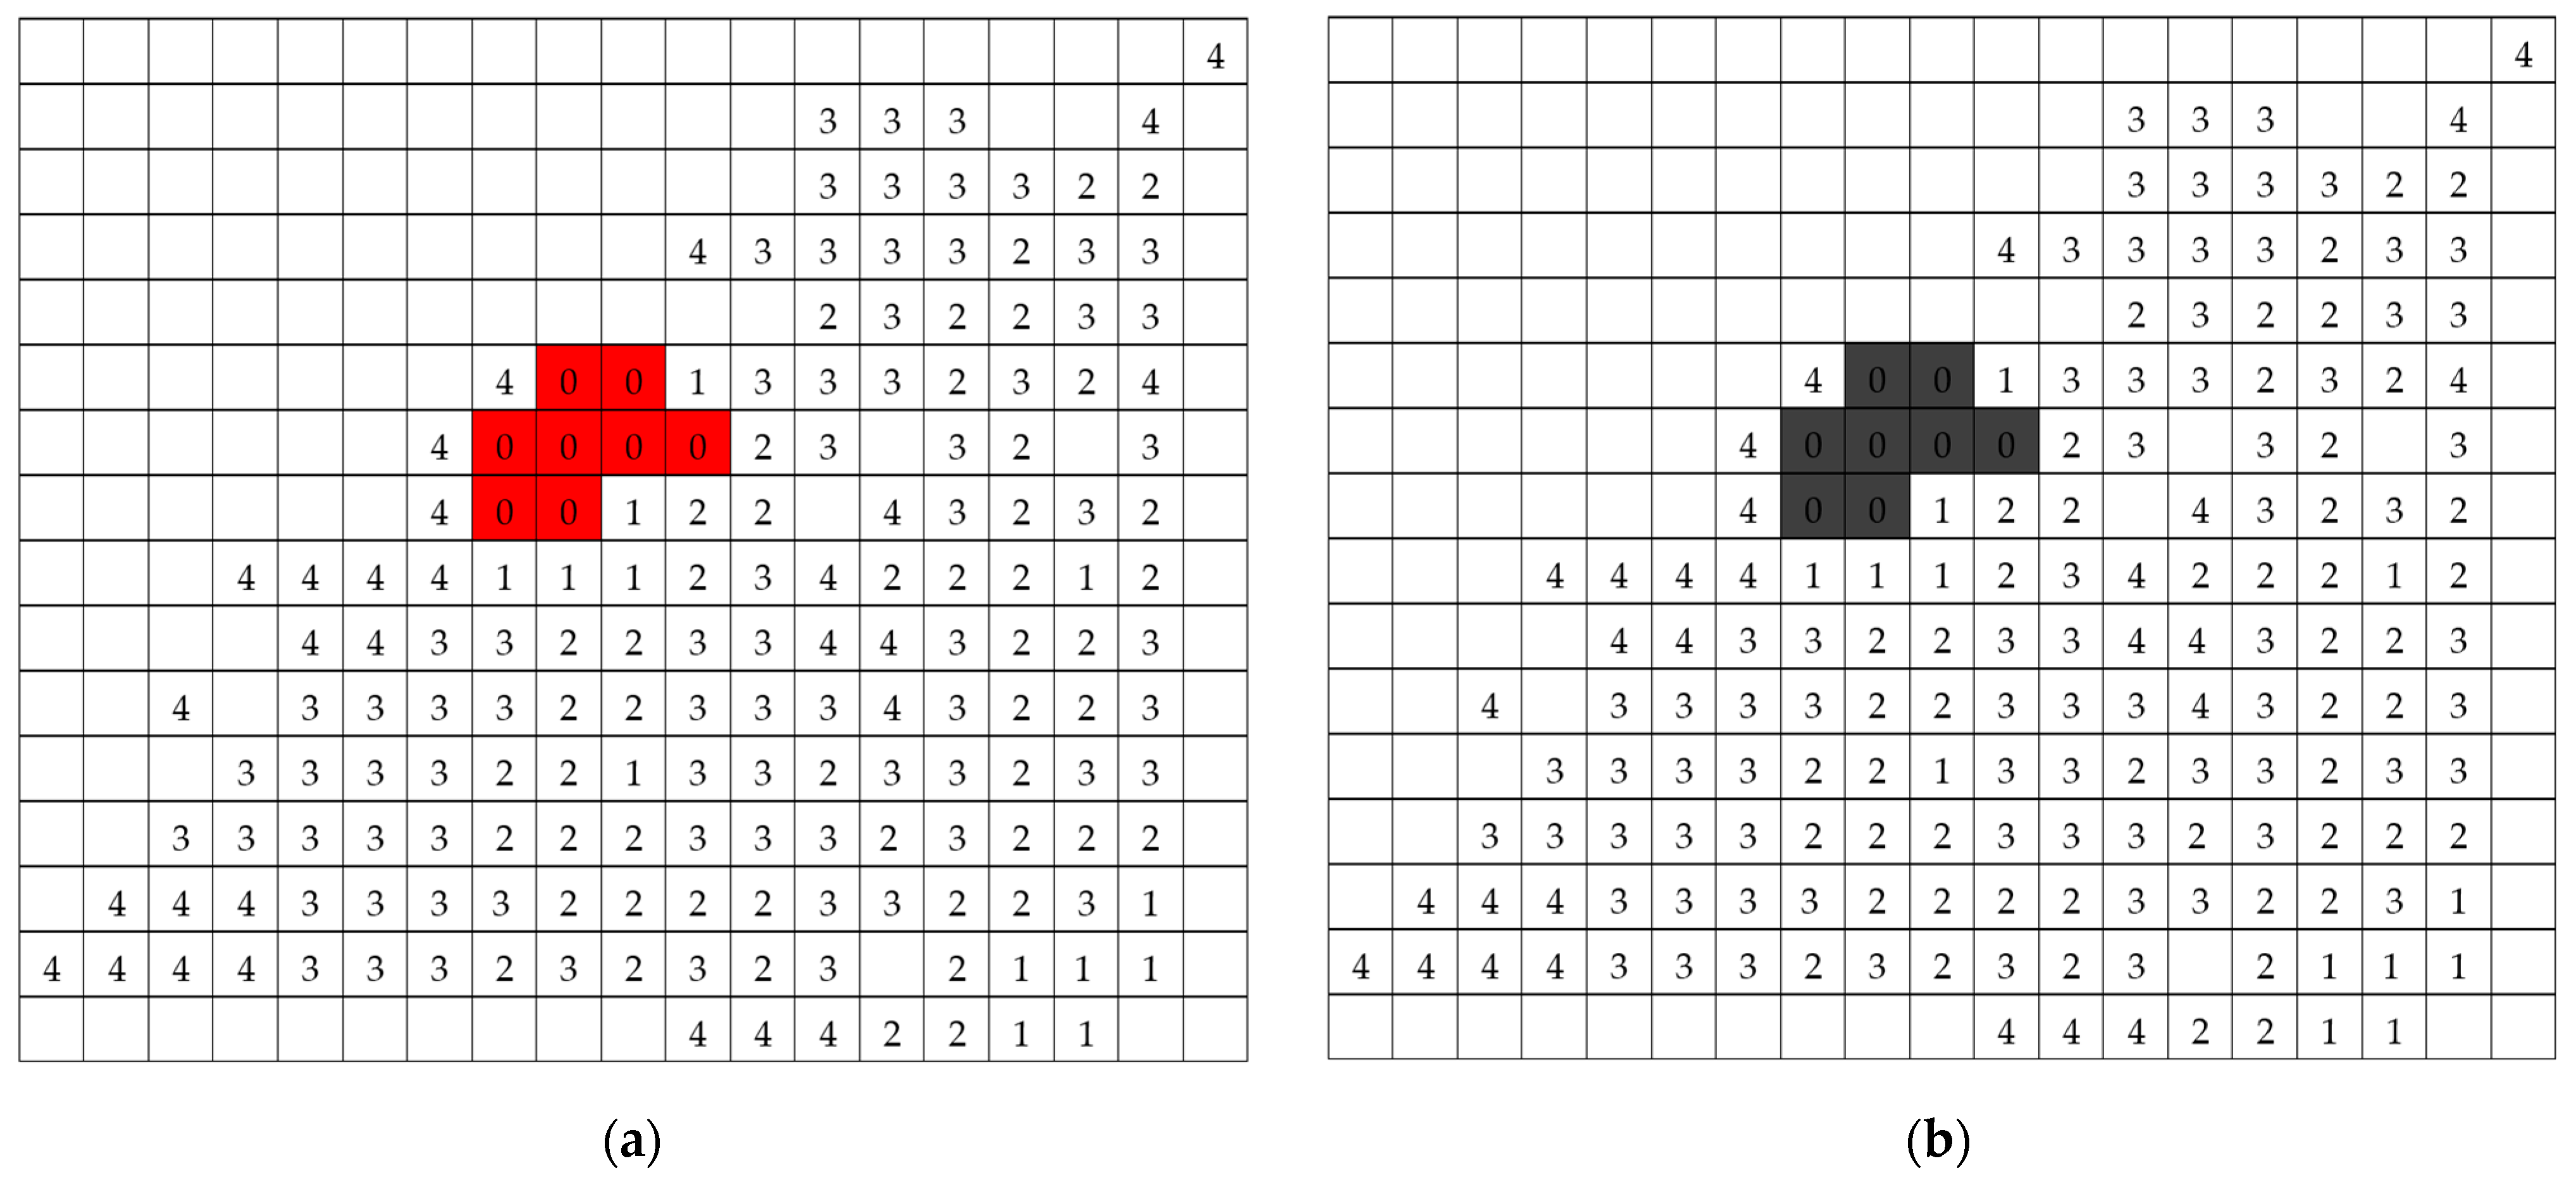
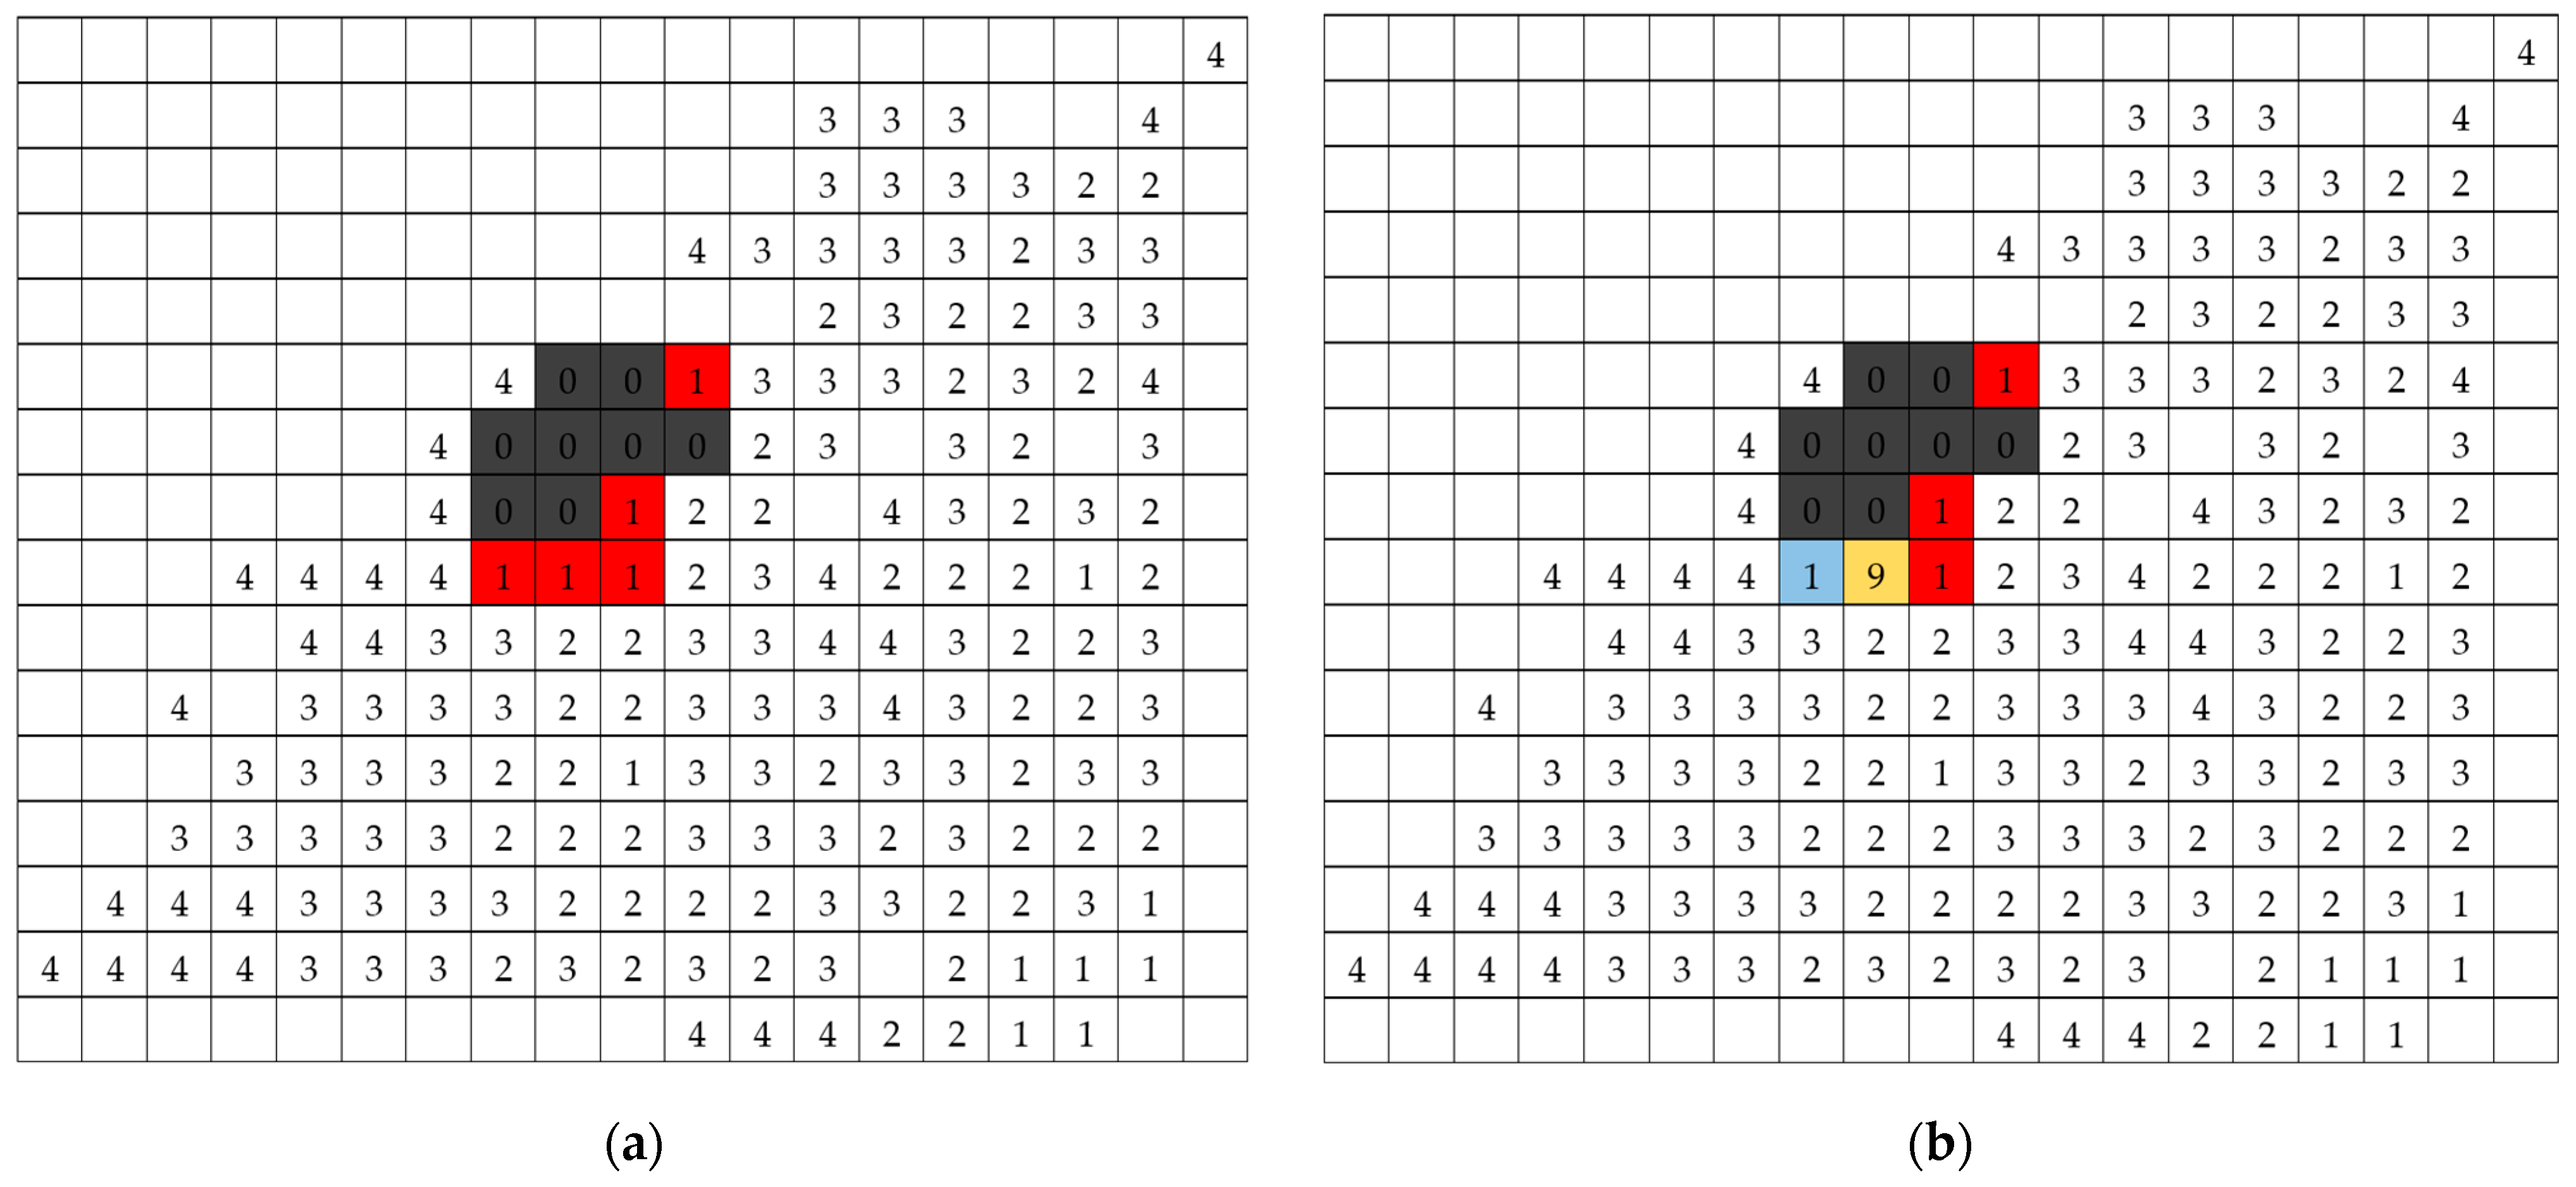
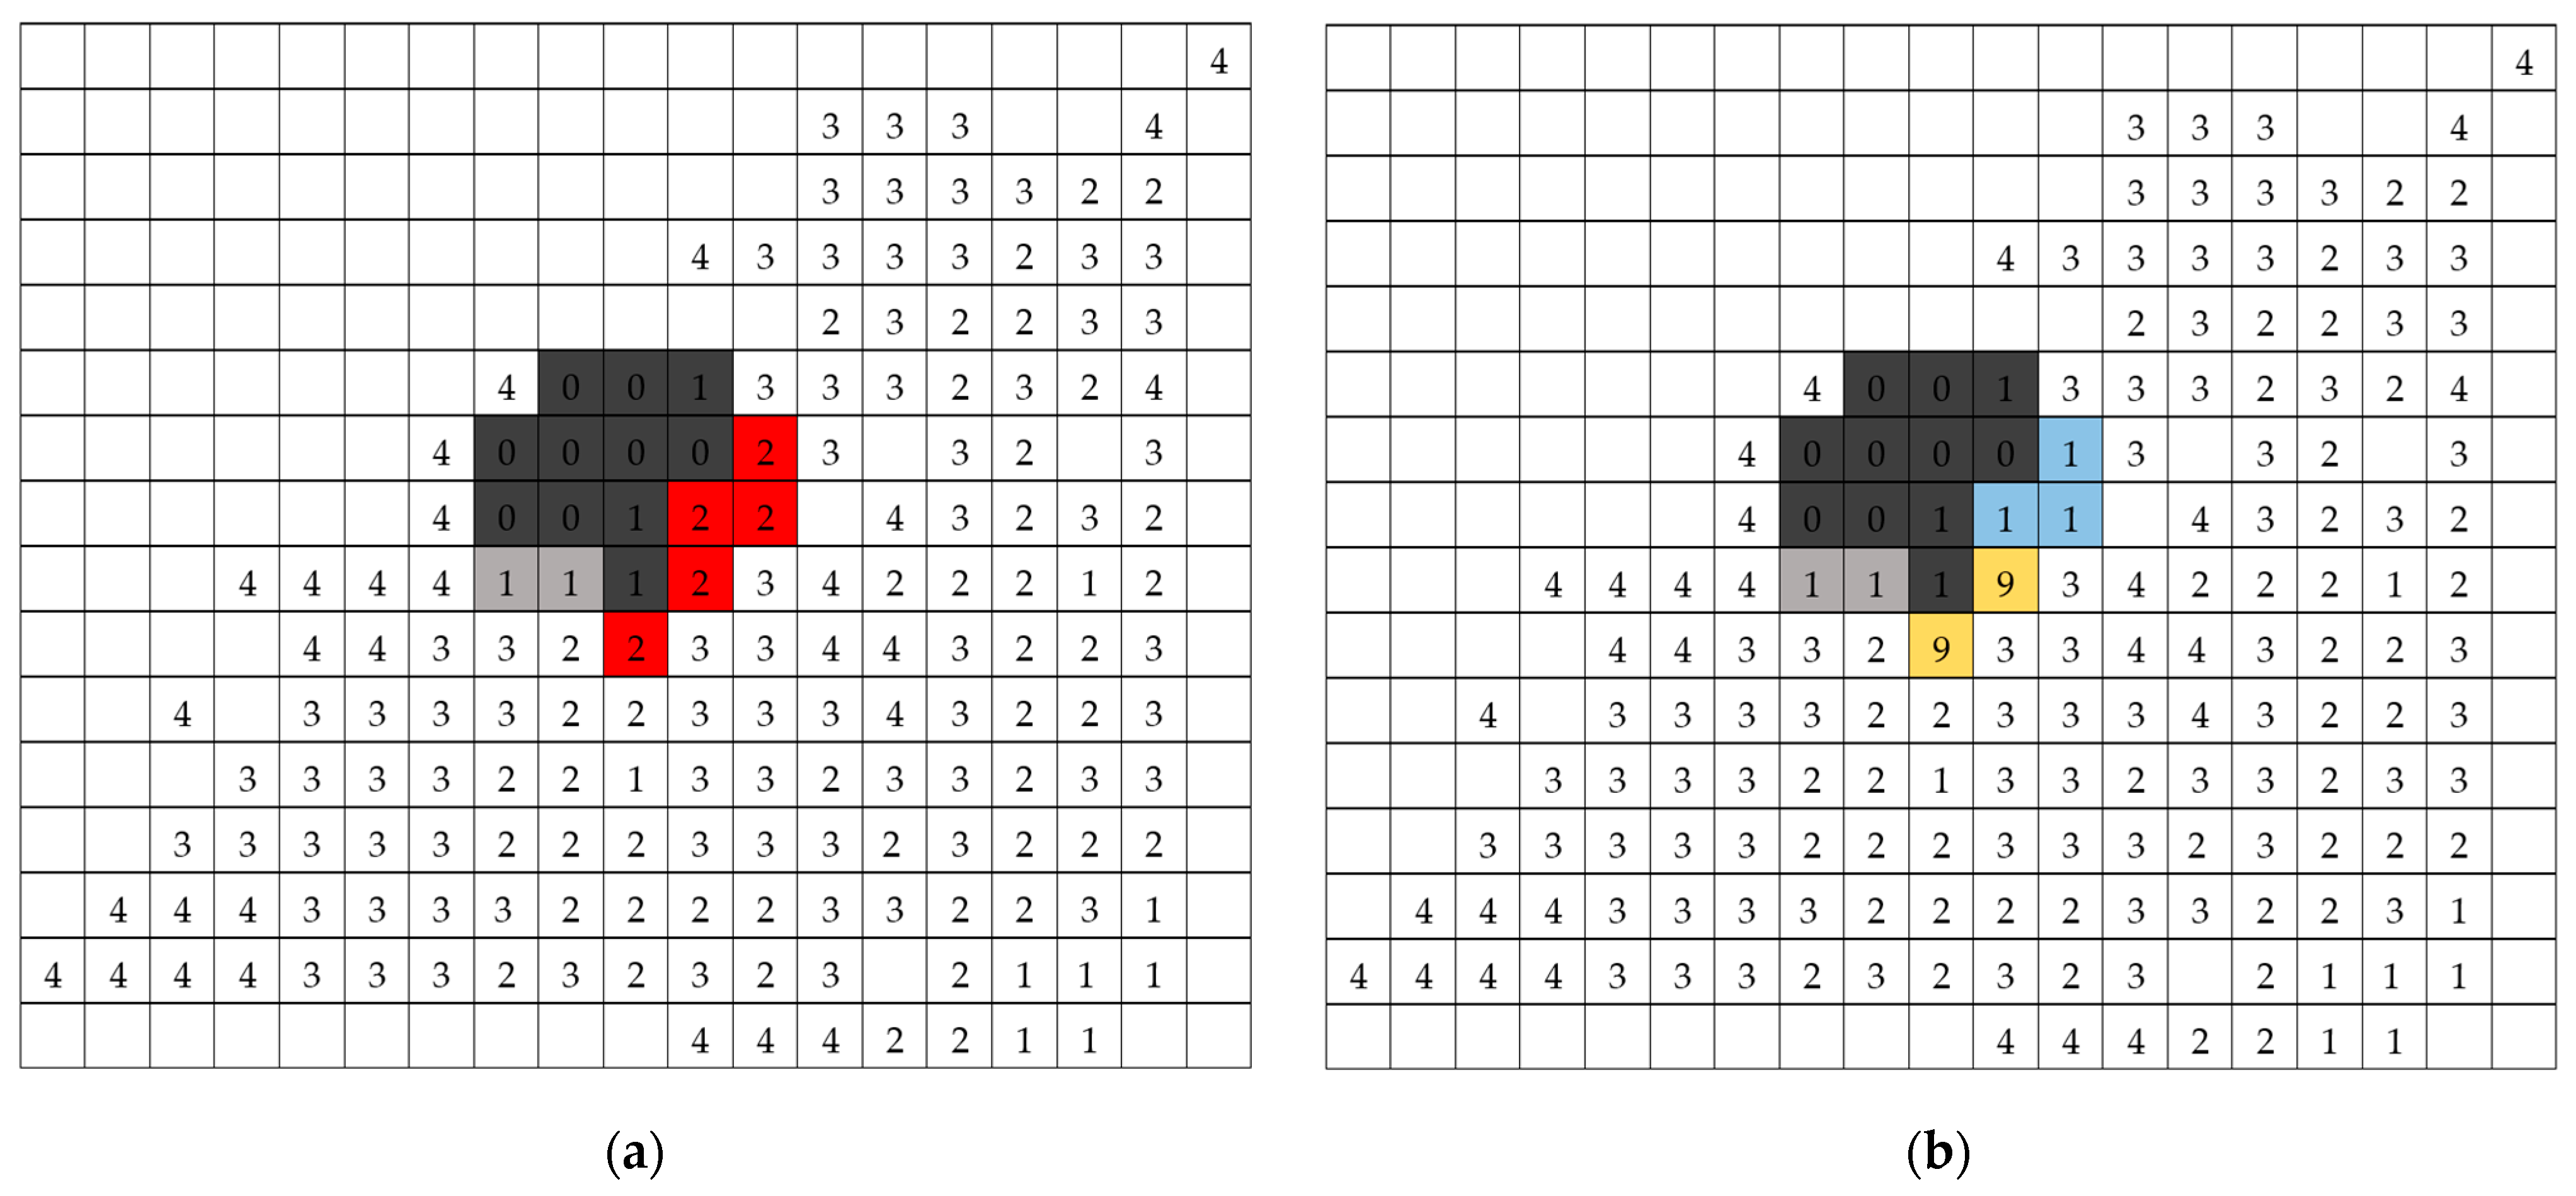
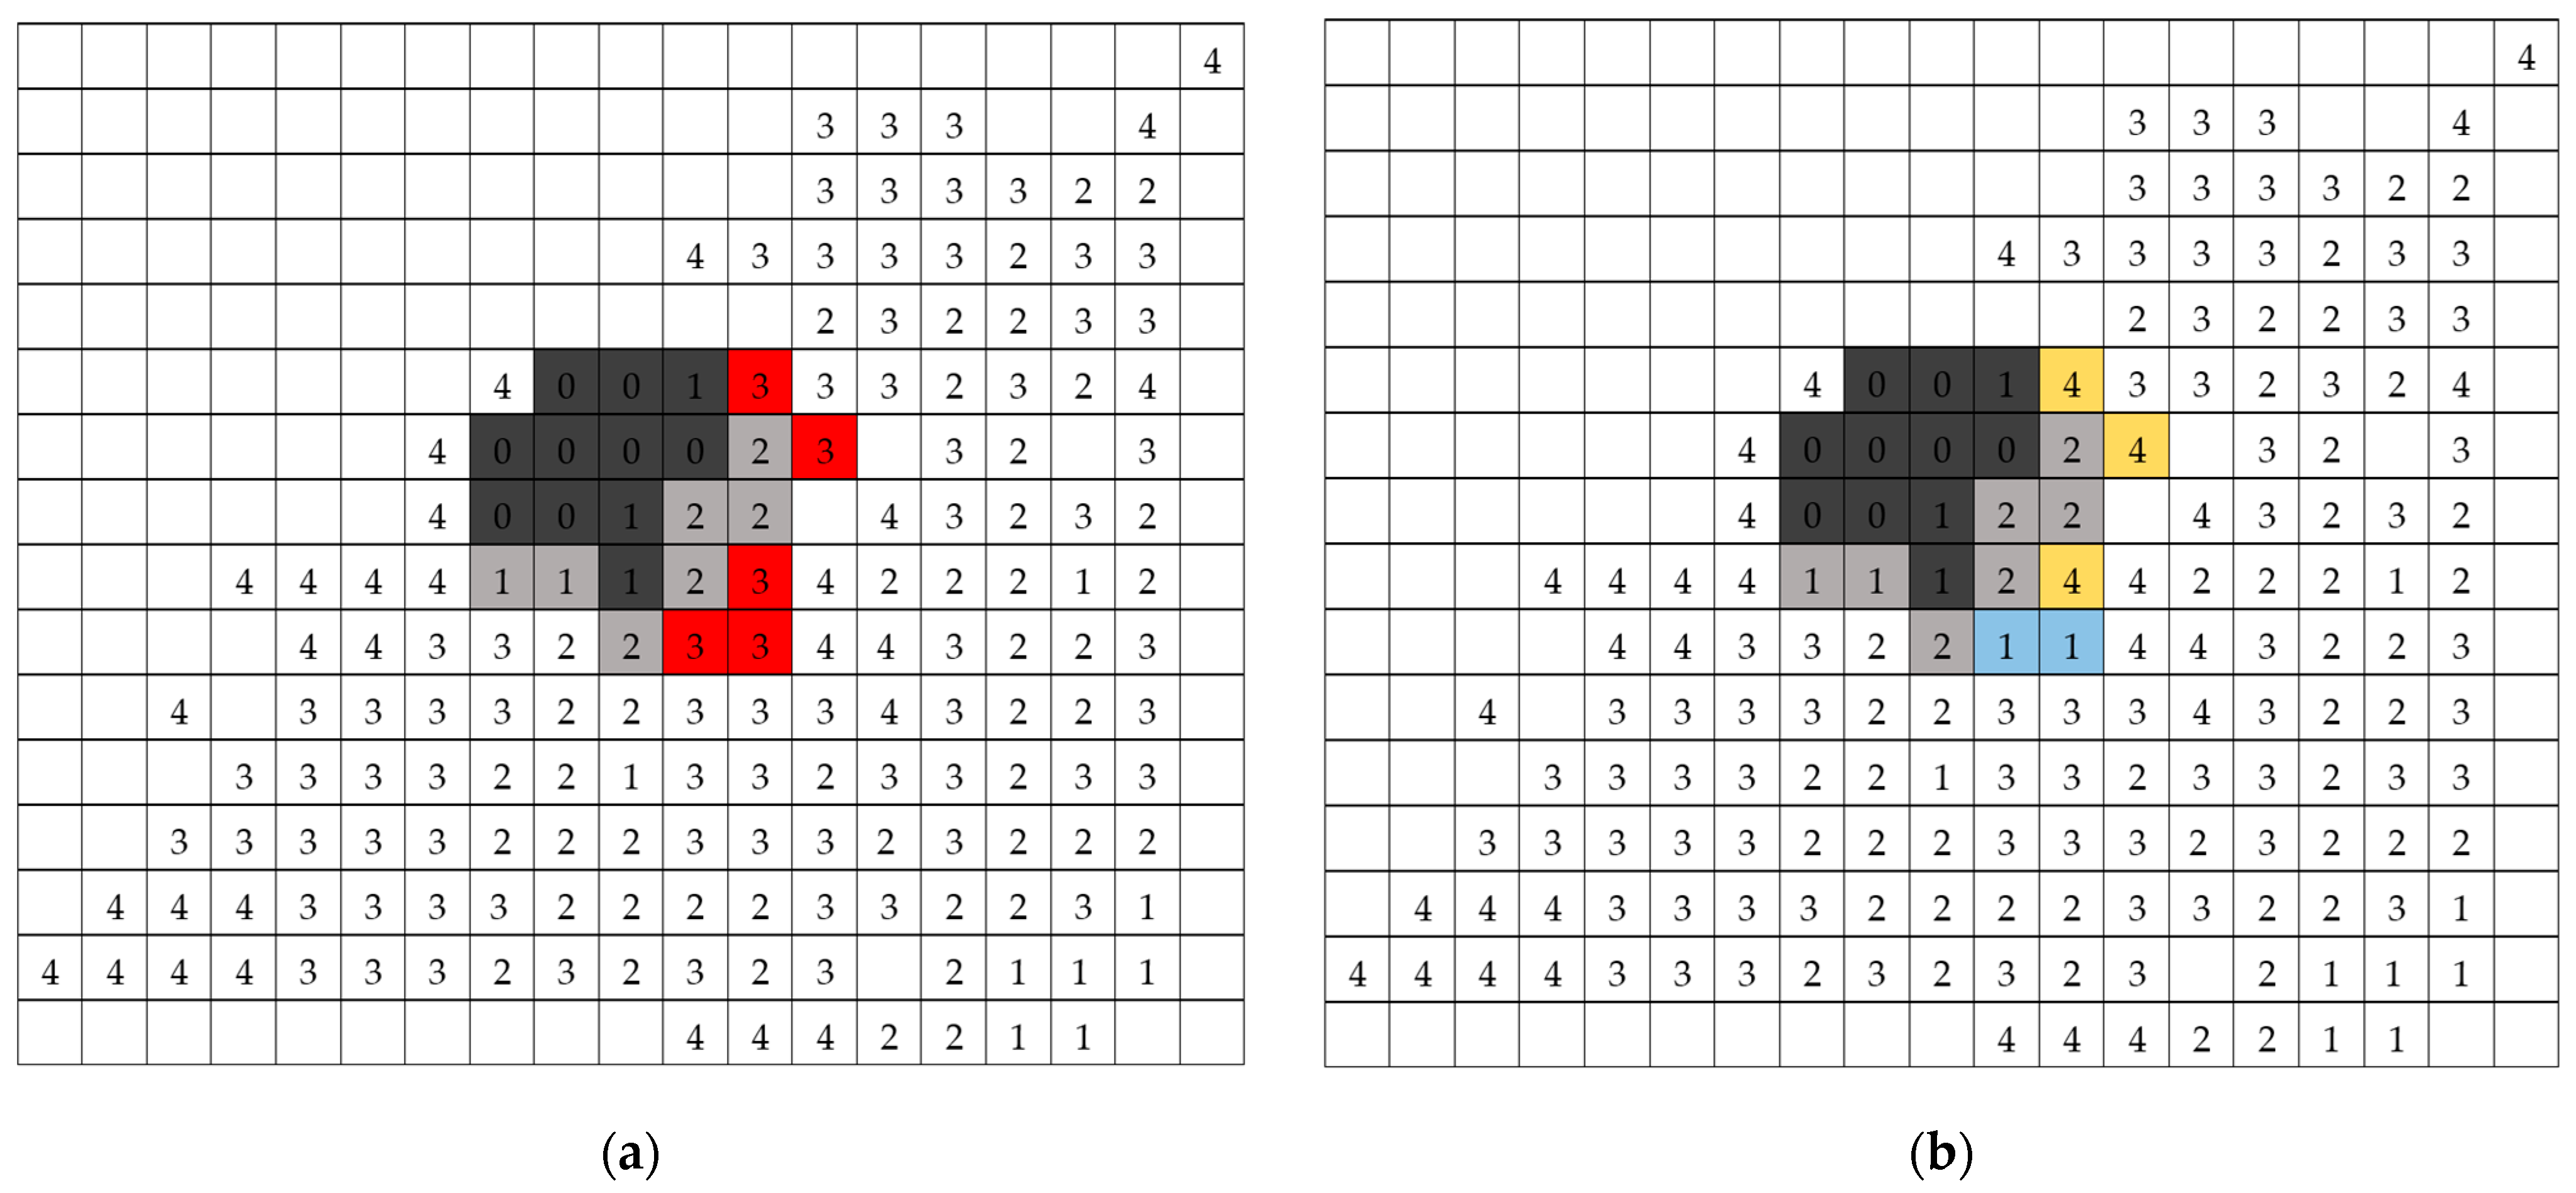
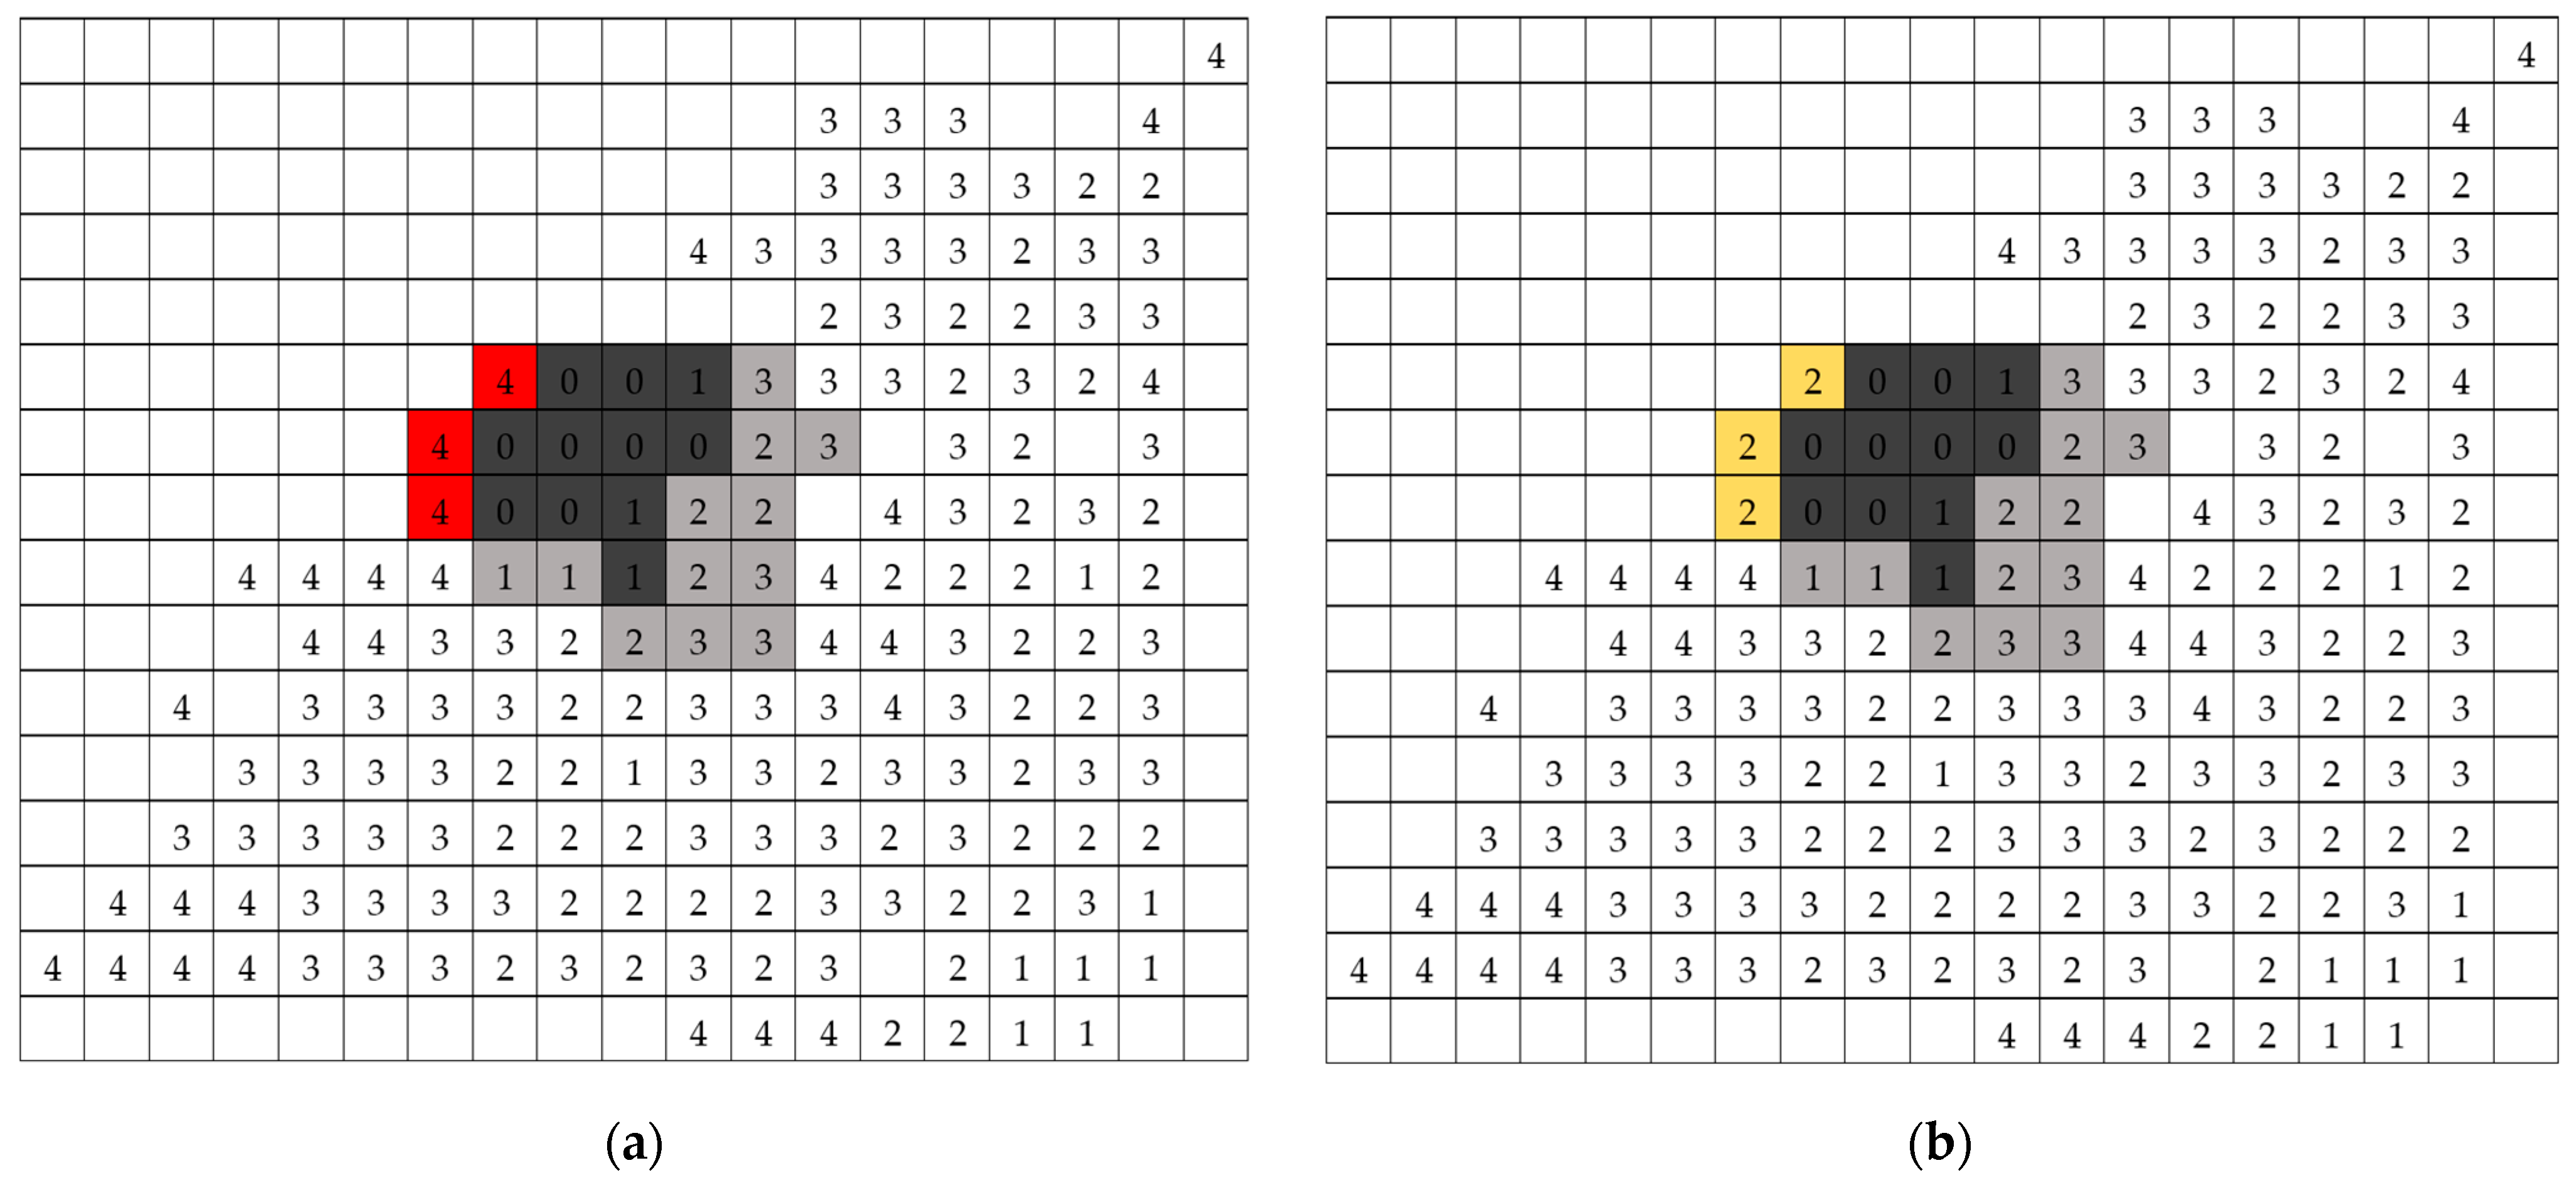
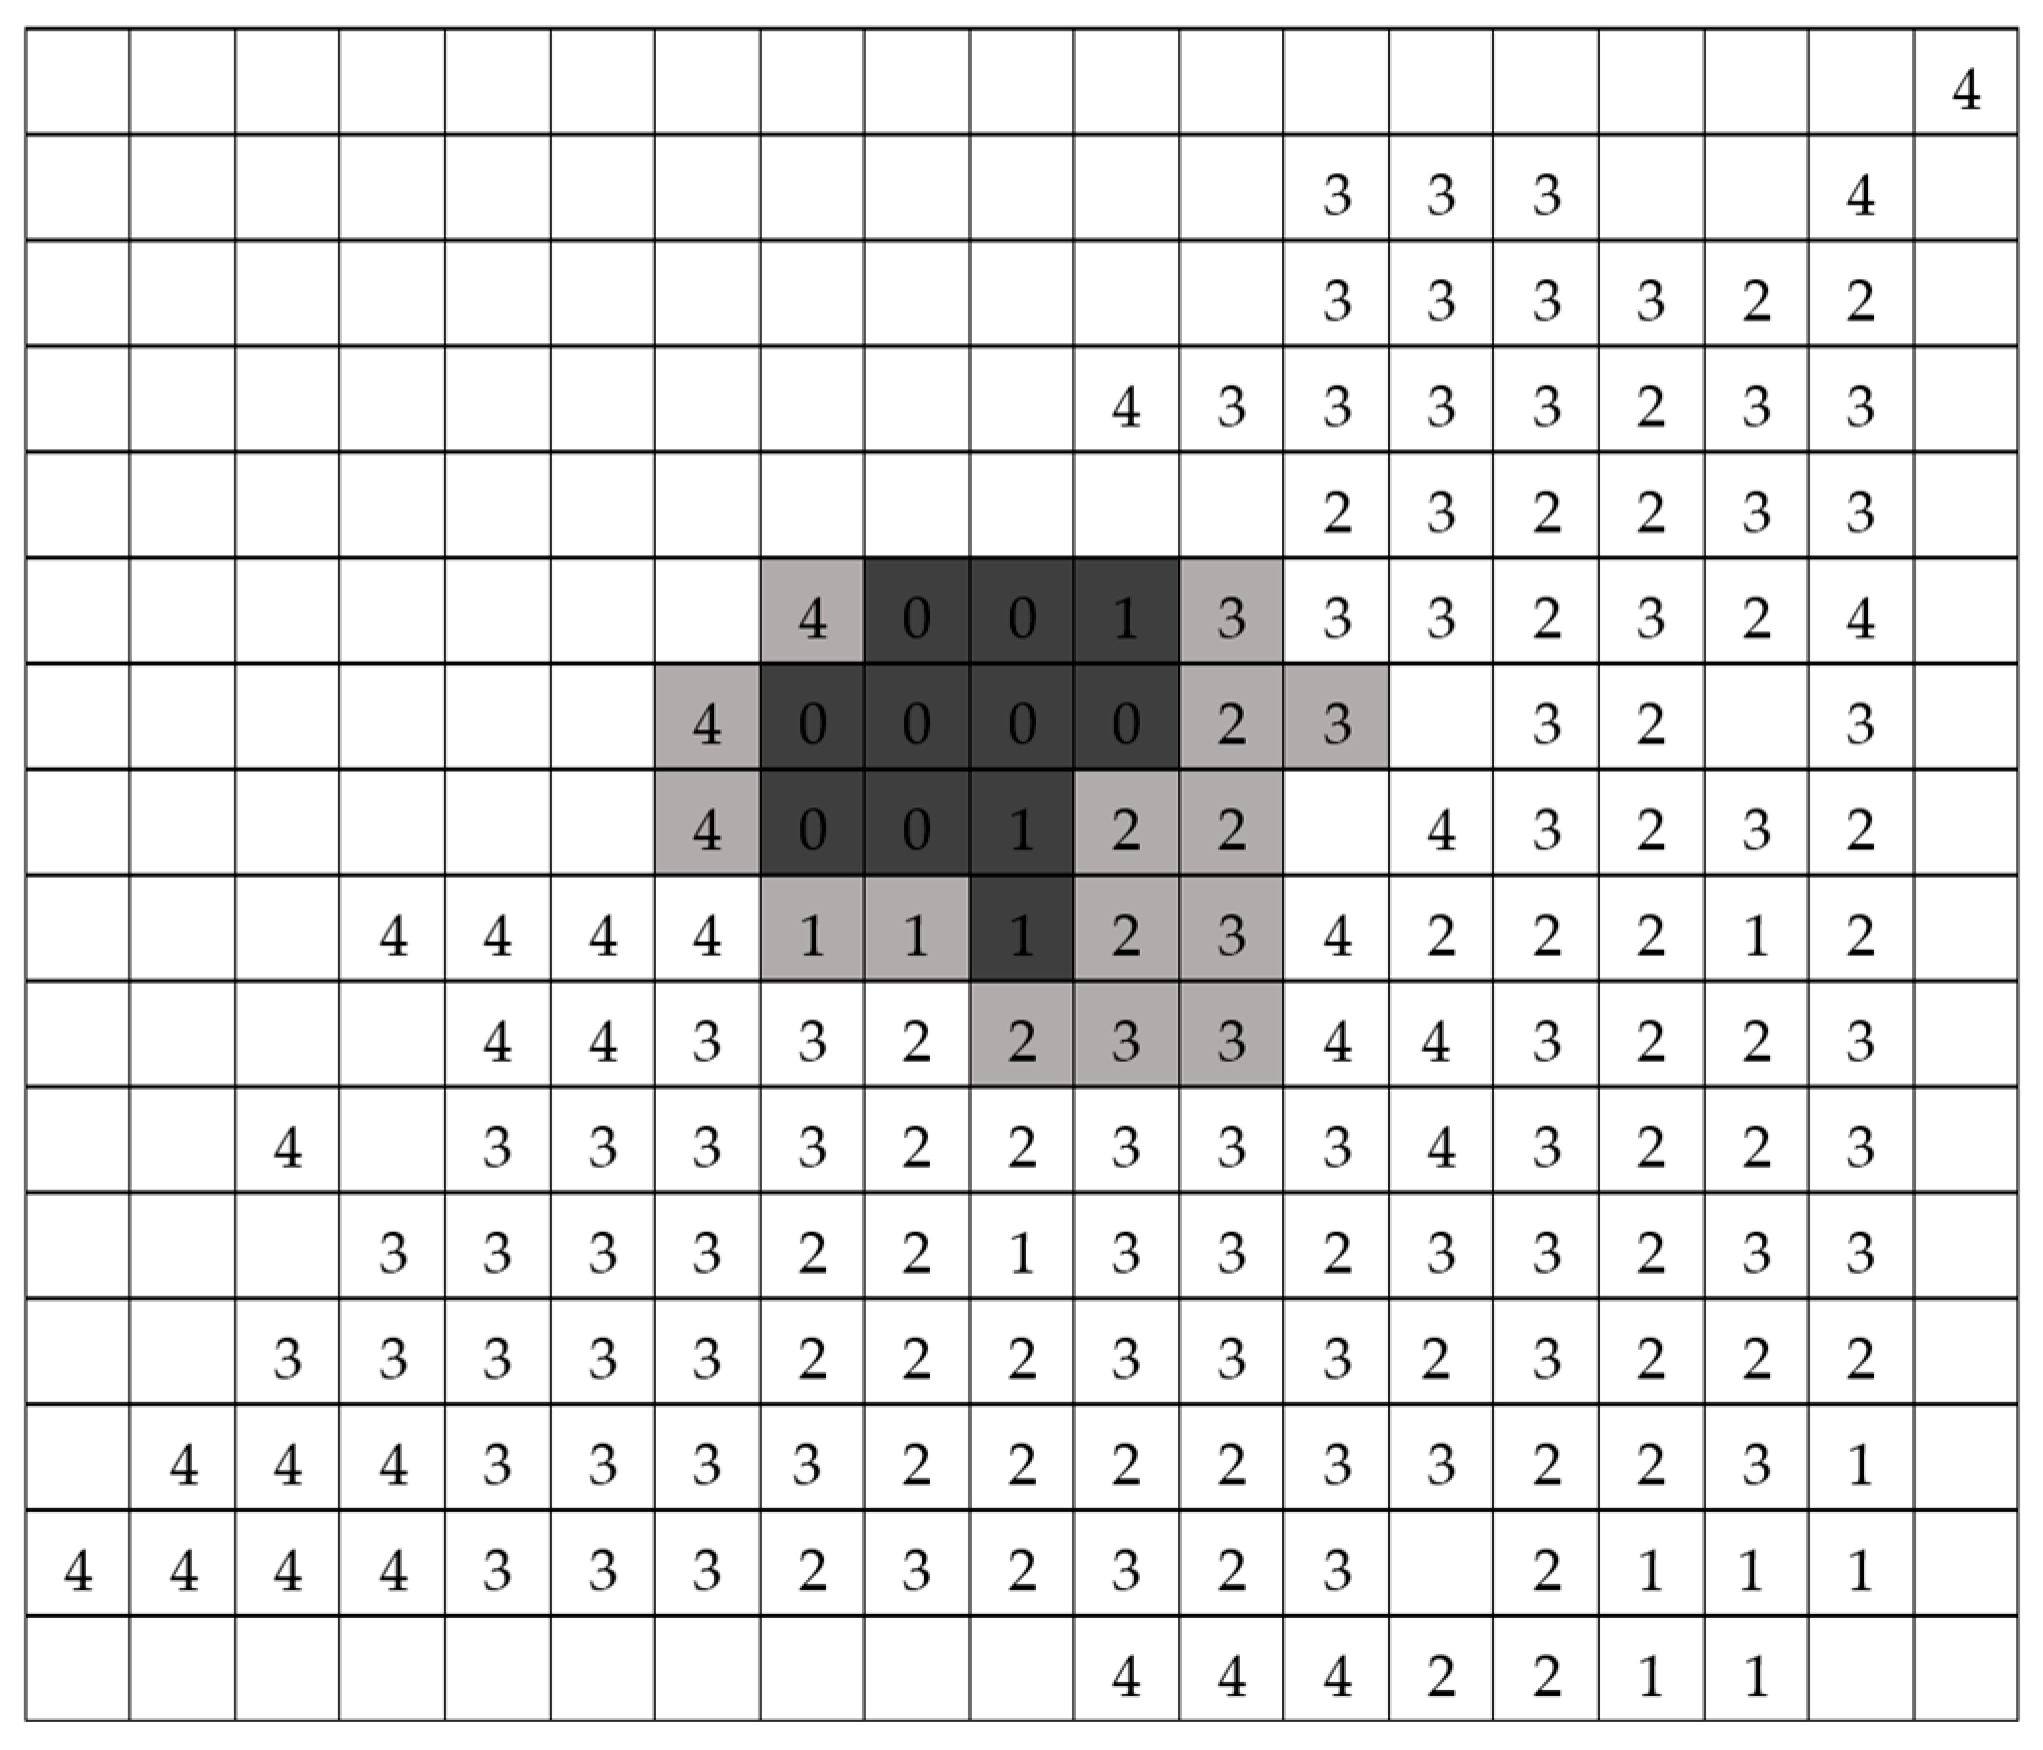
The optimal solution for this constrained optimization problem is depicted as steps in Figure 10, Figure 11, Figure 12, Figure 13, Figure 14 and Figure 15. High-risk cells are shown in red, treated cells in gray and burnt cells in black. Additionally, the allocations of hand crew resource units are shown in yellow, the engine crew resource units in light blue and the helicopter resource units in purple. A solution on the component’s dashboard is also provided in Figure 16.
At t = 0, there are no resources available to allocate in this scenario. So, the cells in which the fire front begins, with the value equal to zero, are totally burnt as depicted in Figure 10.
Then, in t = 1, the high-risk cells are annotated. The MORA algorithm recommends allocating one engine crew resource unit and nine hand crew resource units as depicted in Figure 11. There are no available resources to contain the fire in the other three high-risk cells in this scenario, an inevitable case in most realistic scenarios.
In t = 2, the updated area of interest contains three more burnt cells and two treated cells and again annotates the high-risk cells at that time step. Five cells are depicted as high-risk cells, and the MORA algorithm suggests allocating resource units in all of them, as the resources are enough to contain the fire. It is suggested that nine hand crew resource units be allocated in two cells and one engine crew resource unit be allocated in three cells as depicted in Figure 12.
Later, in t = 3, the burnt areas are not expanded, and five new cells are annotated as high-risk cells. MORA recommends, as there are enough resources, allocating firefighting units in all of them. In three cells, there are four hand crew resource units allocated in the rest of them, one engine crew in each cell, as depicted in Figure 13. It was noticed that to confront the fire in these cells, either one engine crew which has a cost of 4 or 4 units of hand crew with a cost of two each are needed, with a total cost of eight. It is preferable to use an engine crew to contain the fire, but as only two engine crew units are available, the algorithm needs to use the hand crew units, too.
Lastly, in t = 4, three cells are high-risk. The algorithm suggests the allocation of two units of hand crew in each cell at a cost of four for each pair, which is more efficient than allocating the one engine crew unit available at a cost of six, as depicted in Figure 14.
In summary, MORA provides recommendations for allocating the available resources of response teams across specific cells, with the objective of reducing both the total population at risk and the total areas burnt. It does not allow the fire to spread to the upper right cells, where the population distribution is denser. The result of the simulation is depicted in a vector in Figure 15, where burnt areas are depicted in black and treated areas in gray.

5.3. Model Integration

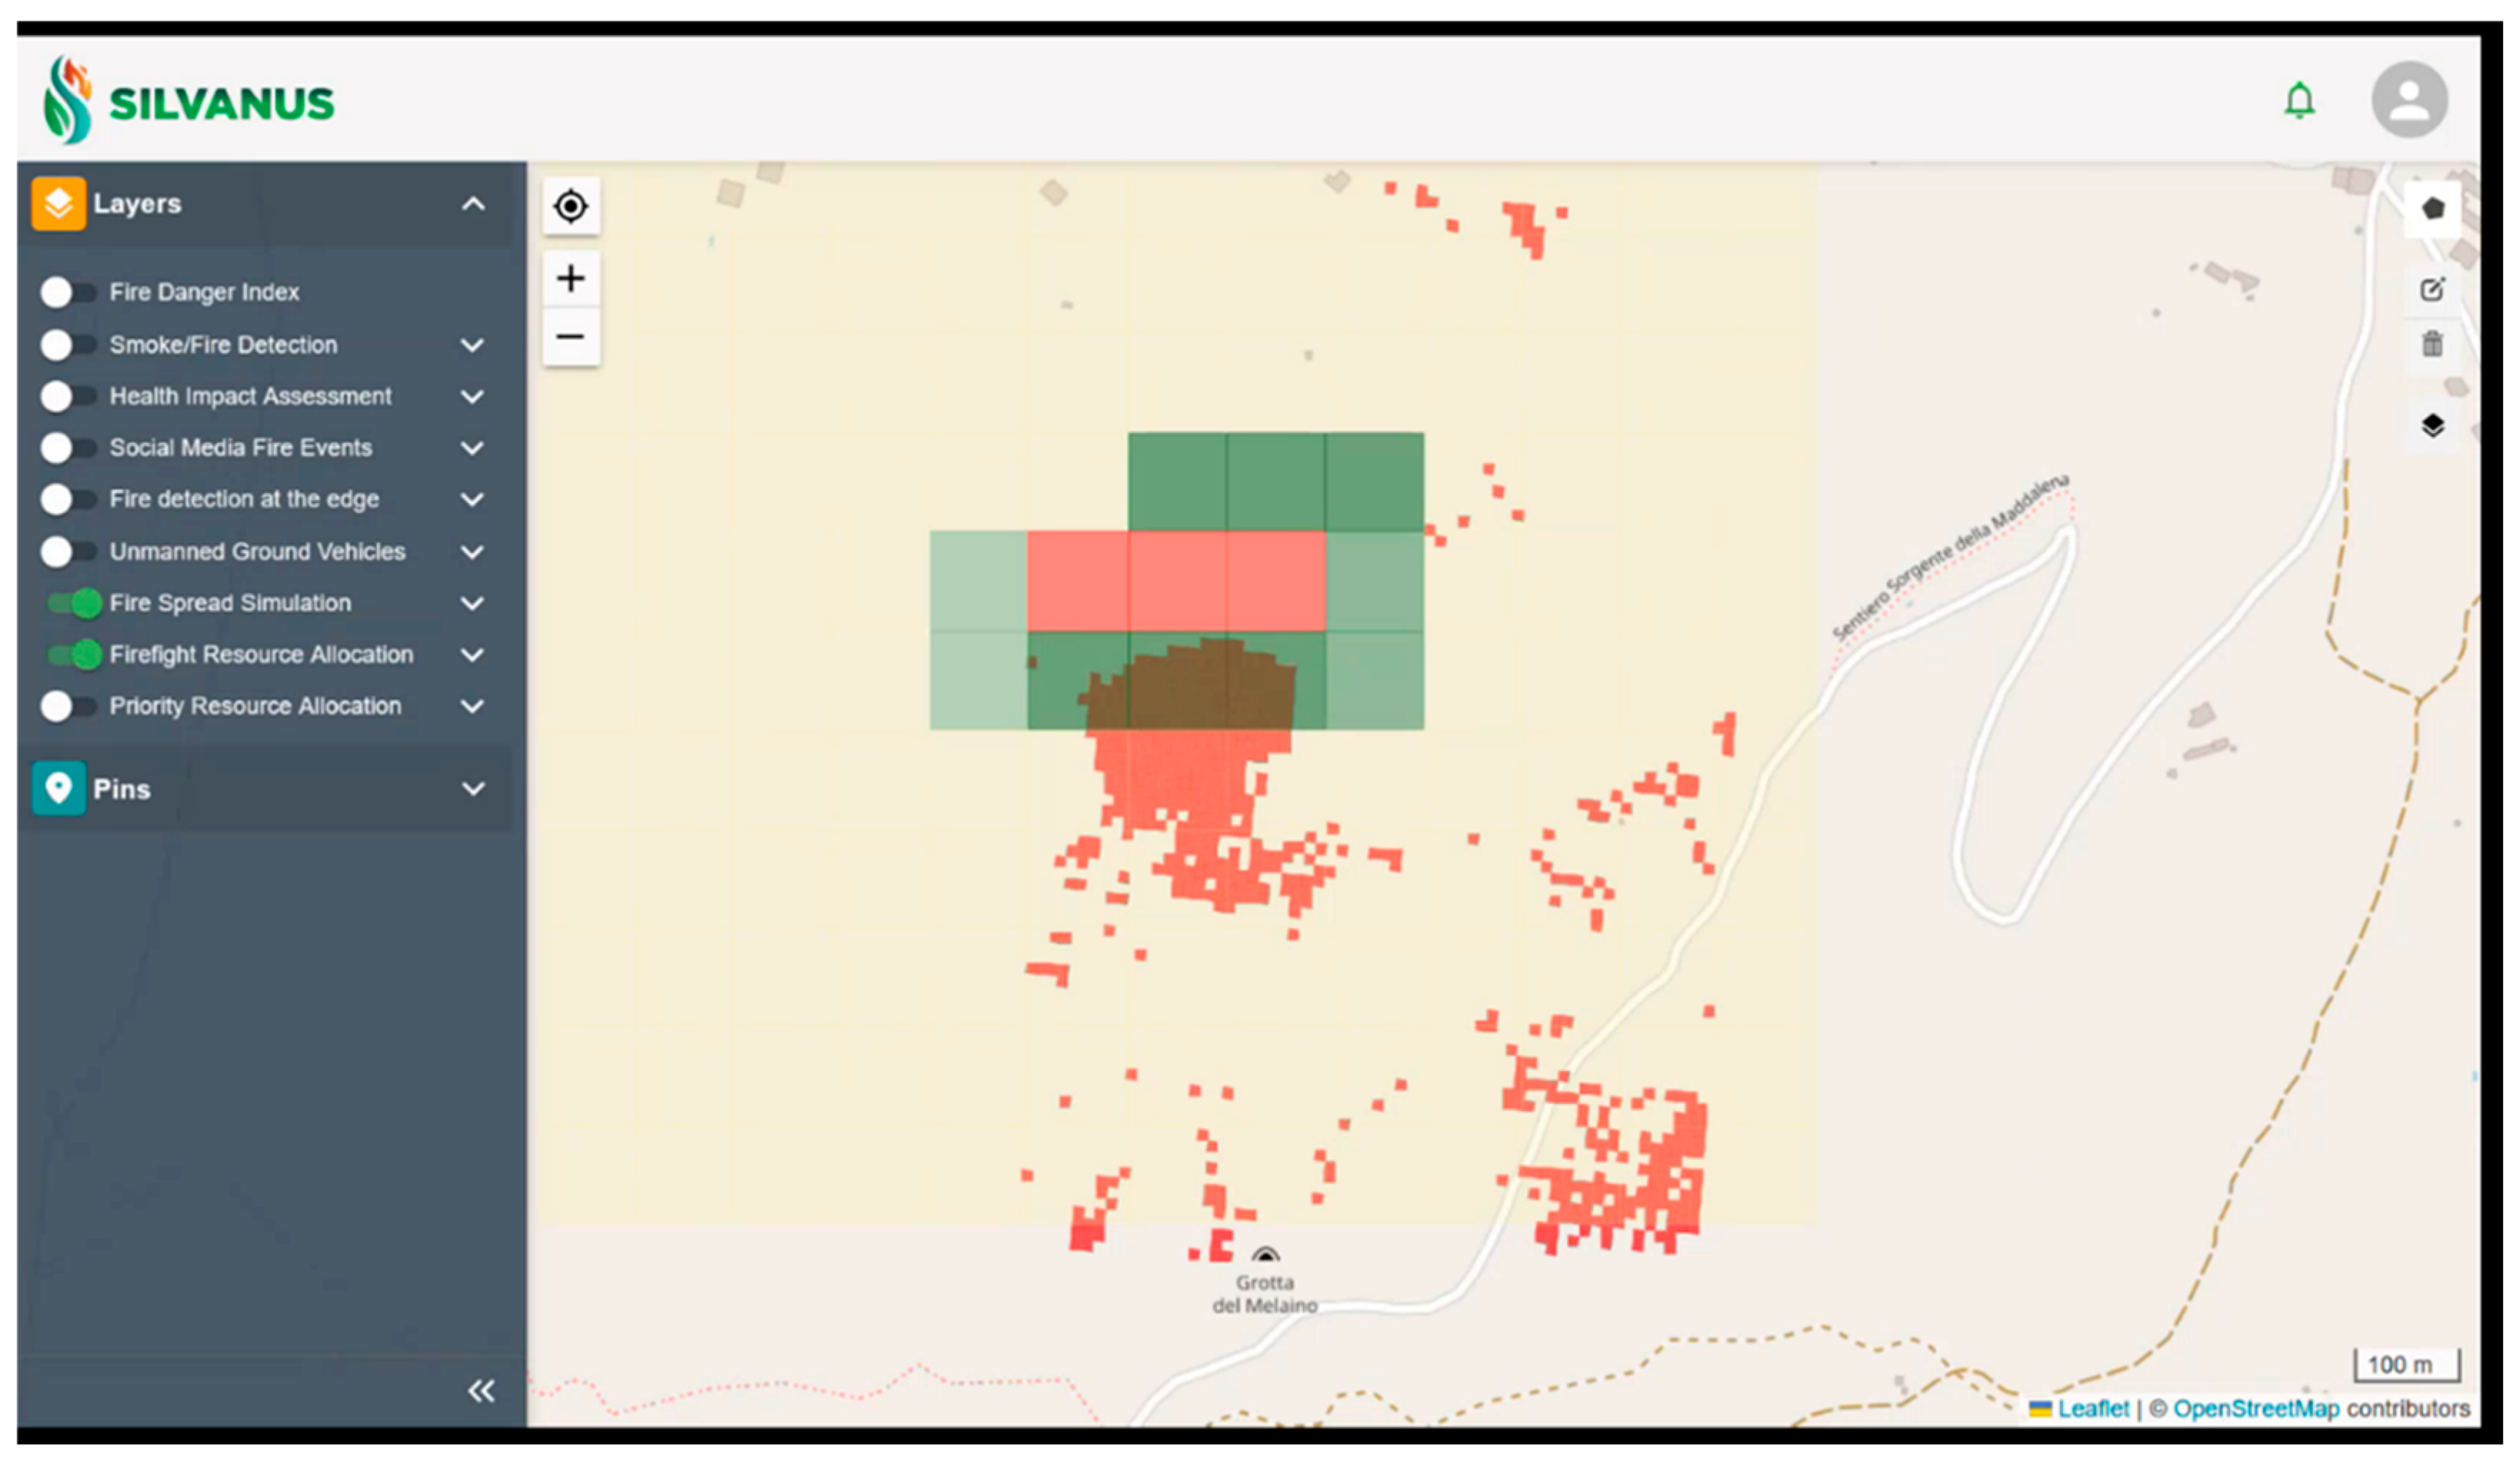
The MORA component has been fully integrated with the SILVANUS platform components, and it is deployed in the SILVANUS Kubernetes Cloud Platform. A consumer pod is subscribed in a channel of a RabbitMq message bus (acting as a bus implementing the communication shown in Figure 1 above), where it awaits until it gets notified when the FSM projection is produced. When the notification is received, the consumer pod triggers a celery application, where our algorithm starts its execution. From the metadata of the notification, the location of the FSM output file is known, as long as the country where the fire incident happens. The system processes this information and retrieves the necessary population data and the FSM data from the Storage Abstraction Layer (SAL). When the output of the system is ready, it publishes it in the SAL and it produces a notification in a different channel of the RabbitMq, where the dashboard consumer is listening. Thus, the output of MORA is accessible in the SILVANUS dashboard. For the example scenario of the previous section, the output is visualized in the SILVANUS dashboard as shown in Figure 16.

6. Discussion and Conclusions

In this work we presented an application of Integer Linear Programming (ILP) for solving a Constrained Optimization Problem (COP), which we developed for modeling the impact of the spreading of a wildfire. Our model considers the dynamic behavior of a wildfire and many realistic constraints that determine the cost of fire reaching specific parts of an area where an incident has occurred in real-life cases. This dynamic behavior introduces uncertainties to incident commanders and generates complex conditions for deciding the optimal response strategy and the allocation of available resources over time. Hopefully, the progress of fire spread modeling tools can produce dependable approximations of the location of the fire front under the dynamic spreading conditions of a wildfire (provided that the required land data are available and maintained properly in data repositories). Thus, it remains to the RART tool to express the conflicting constraints that exist when the commanders need to allocate resources that evidently have limitations in terms of availability, firefighting capacity, means of transport to the different points on a map of the area and upper budget bounds. At the same time, the cost of the fire damaging specific cells in an area of a fire incident is evidently related to the affected population expected to live in those cells and face danger to life and property and infrastructure loss.
We presented a grid-based solution modeling the operation of the above decision support system as a set of cost functions incorporating appropriate control parameters and decision variables. We then solved the resulting COP utilizing a Python solver. Our RART component has been integrated in the operating SILVANUS platform as part of its DSS toolset, which has been demonstrated overall in twelve pilot sites worldwide.
Our model is conceptually close to the one presented in [28] but addresses a higher overall number of constraints than those proposed in the literature [26,27,28,29,30], including the accessibility constraint so as to differentiate the allocation of land crews and vehicles to that of aerial forces. Additionally, MORA overall outperforms solutions like those proposed in [31,32,33,34,35,36,37] achieving: (i) joint optimization in terms of population in danger, area burned, property losses and cost of the solution under time varying conditions regarding the fire spread and resource availability, (ii) ensuring that resource allocation decisions are both practically grounded and mathematically rigorous, offering deterministic and transparent solutions within the wildfire management context and (iii) a modular real-time solution interoperable with state-of-the-art software platforms and other DSS components that can be deployed in operational conditions.
We do not provide a routing function to estimate the time to reach a selected cell, but with available GIS data it is feasible and is included in our future plans. Additionally, our solution has been validated and integrated with both the state-of-the-art empirical-based FLAMAP fire spread modeling tool and the ML-based SILVANUS FSM. It has been integrated as a containerized SW service on the multi-faceted SILVANUS cloud platform, demonstrating its application as part of a complete DSS toolchain to incident commanders and stakeholders worldwide. Through multiple interactions with stakeholders during the SILVANUS piloting events with incident commanders and civil protection authorities we have been motivated to also develop a training solution developing a simulator of human generated decisions on resource allocation, which can result in comparing the results of each solution (manual vs. MORA) and visualizing them on the same map for easy comparison. The lessons learnt are that even though modern systems maintain a lot of valuable information and data related to incident handling (like fire spread projections, routing and GIS data, real-time positioning and conditions of troops, and environmental conditions) through IoT systems and communication infrastructure, the overloading of the human with this data underpins the significance of DSS tools like RART as a means of assisting commanders in gaining improved situational awareness through actionable insights that may lead to optimal decisions.

Author Contributions

Methodology, T.O.; Software, C.B.; Validation, T.O.; Formal analysis, T.O., C.B. and H.C.L.; Investigation, T.O., C.B. and H.C.L.; Writing—original draft, T.O. and C.B.; Writing—review & editing, T.O., C.B. and H.C.L.; Supervision, H.C.L.; Project administration, T.O. All authors have read and agreed to the published version of the manuscript.

Funding

The present work was undertaken in the context of the project SILVANUS (Climate resilient forest management platform to prevent and suppress forest fire), which has received funding from the European Union’s Horizon 2020 research and innovation program under Grant Agreement No. 101037247.

Data Availability Statement

Data sharing is not applicable to this article.

Acknowledgments

The present work was undertaken in the context of the project SILVANUS (Climate resilient forest management platform to prevent and suppress forest fire), which has received funding from the European Union’s Horizon 2020 research and innovation program under Grant Agreement No. 101037247. The contents of this publication are the sole responsibility of the authors and can in no way be taken to reflect the views of the European Commission.

Conflicts of Interest

The authors declare no conflict of interest.

References

  1. Krsnik, G.; Busquets Olivé, E.; Piqué Nicolau, M.; Larrañaga, A.; Cardil, A.; García-Gonzalo, J.; González Olabarría, J.R. Regional level data server for fire hazard evaluation and fuel treatments planning. Remote Sens. 2020, 12, 4124. [Google Scholar] [CrossRef]
  2. Oliveras Menor, I.; Prat-Guitart, N.; Spadoni, G.L.; Hsu, A.; Fernandes, P.M.; Puig-Gironès, R.; Ascoli, D.; Bilbao, B.A.; Bacciu, V.; Brotons, L.; et al. Integrated fire management as an adaptation and mitigation strategy to altered fire regimes. Commun. Earth Environ. 2025, 6, 202. [Google Scholar] [CrossRef]
  3. Marić, L.; Chandramouli, K.; Martinez, J.R.; Maslioukova, M.I.; Christodolou, G.; Avgerinakis, K.; Kosmides, P. Advancement of an Integrated Technological Platform for Wildfire Management Through Edge Computing. In Proceedings of the 8th International Conference on Smart and Sustainable Technologies (SpliTech), Split/Bol, Croatia, 20–23 June 2023; pp. 1–6. [Google Scholar]
  4. Tezcan, B.; Eren, T. Forest fire management and fire suppression strategies: A systematic literature review. Nat. Hazards 2025, 121, 10485–10515. [Google Scholar] [CrossRef]
  5. Granda, B.; León, J.; Vitoriano, B.; Hearne, J. Decision Support Models and Methodologies for Fire Suppression. Fire 2023, 6, 37. [Google Scholar] [CrossRef]
  6. Zehra, S.N.; Wong, S.D. Systematic review and research gaps on wildfire evacuations: Infrastructure, transportation modes, networks, and planning. Transp. Plan. Technol. 2024, 47, 1364–1398. [Google Scholar] [CrossRef]
  7. Minas, J.P.; Hearne, J.W.; Martell, D.L. A spatial optimization model for multi period landscape level fuel management to mitigate wildfire impacts. Eur. J. Oper. Res. 2014, 232, 412–422. [Google Scholar] [CrossRef]
  8. Minas, J.P.; Hearne, J.W.; Martell, D.L. An integrated optimization model for fuel management and fire suppression preparedness planning. Ann. Oper. Res. 2015, 232, 201–215. [Google Scholar] [CrossRef]
  9. Rashidi, E.; Medal, H.; Gordon, J.; Grala, R.; Varner, M. A maximal covering location based model for analyzing the vulnerability of landscapes to wildfires: Assessing the worst case scenario. Eur. J. Oper. Res. 2017, 258, 1095–1105. [Google Scholar] [CrossRef]
  10. You, W.; Lin, L.; Wu, L.; Ji, Z.; Yu, J.A.; Zhu, J.; Fan, Y.; He, D. Geographical information system-based forest fire risk assessment integrating national forest inventory data and analysis of its spatiotemporal variability. Ecol. Indic. 2017, 77, 176–184. [Google Scholar] [CrossRef]
  11. Tien, D.; Van Le, H.; Hoang, N. GIS-based spatial prediction of tropical forest fire danger using a new hybrid machine learning method. Ecol. Inform. 2018, 48, 104–116. [Google Scholar] [CrossRef]
  12. Yuana, K.A.; Kusrini, K.; Setyanto, A.; Laksito, A.D.; Maruf, Z.R.; Johari, M.Z.F.; Adninda, G.B.; Kartikakirana, R.A.; Nucifera, F.; Widayani, W.; et al. GIS data support technique for forest fire management and decision support system: A Sebangau National Park, Kalimantan case. In Proceedings of the 6th International Conference on Information and Communications Technology (ICOIACT) 2023, Hybrid Conference, Yogyakarta, Indonesia, 10–11 November 2023. [Google Scholar]
  13. Silva, J.; Marques, J.; Gonçalves, I.; Brito, R.; Teixeira, S.; Teixeira, J.; Alvelos, F. A Systematic Review and Bibliometric Analysis of Wildland Fire Behavior Modeling. Fluids 2022, 7, 374. [Google Scholar] [CrossRef]
  14. Andrews, P.L. The Rothermel Surface Fire Spread Model and Associated Developments: A Comprehensive Explanation; General Technical Report RMRS-GTR-371; U.S. Department of Agriculture, Forest Service, Rocky Mountain Research Station: Fort Collins, CO, USA, 2018; 121p. [Google Scholar]
  15. Cruz, M.G.; Alexander, M.E.; Sulivan, A.L.; Gould, J.S.; Kilinc, M. Assessing improvements in models used to operationally predict wildland fire rate of spread. Env. Mod. Softw. 2018, 105, 54–63. [Google Scholar] [CrossRef]
  16. FlamMap Updates for Next-Generation Fire Modeling. Available online: https://www.fs.usda.gov/sites/default/files/fire-management-today/00313%20FS%20Pubs%20FMT%2078%283%29_final%20508-Web.pdf (accessed on 10 August 2025).
  17. Mell, W.; Maranghides, A.; McDermott, R.; Manzello, S.L. Numerical simulation and experiments of burning Douglas fir trees. Combust. Flame 2009, 156, 2023–2041. [Google Scholar] [CrossRef]
  18. Coen, J.L.; Cameron, M.; Michalakes, J.; Patton, E.G.; Riggan, P.J.; Yedinak, K.M. WRF-Fire: Coupled Weather–Wildland Fire Modeling with the Weather Research and Forecasting Model. J. Appl. Meteor. Climatol. 2013, 52, 16–38. [Google Scholar] [CrossRef]
  19. Alexandridis, A.; Russo, L.; Vakalis, D.; Bafas, G.V.; Siettos, C.I. Wildland fire spread modelling using cellular automata: Evolution in large-scale spatially heterogeneous environments under fire suppression tactics. Int. J. Wildland Fire 2011, 20, 633–647. [Google Scholar] [CrossRef]
  20. Dorrer, G.; Yarovoy, S. Use of Agent-Based Modeling for Wildfire Situations Simulation. In Proceedings of the 2018 3rd Russian-Pacific Conference on Computer Technology and Applications (RPC) 2018, Vladivostok, Russia, 18–25 August 2018; pp. 1–4. [Google Scholar] [CrossRef]
  21. Xu, Z.; Li, J.; Cheng, S.; Rui, X.; Zhao, Y.; He, H.; Guan, H.; Sharma, A.; Erxleben, M.; Chang, R.; et al. Deep learning for wildfire risk prediction: Integrating remote sensing and environmental data. ISPRS J. Photogramm. Remote Sens. 2025, 227, 632–677. [Google Scholar] [CrossRef]
  22. Andrianarivony, H.S.; Akhloufi, M.A. Machine Learning and Deep Learning for Wildfire Spread Prediction: A Review. Fire 2024, 7, 482. [Google Scholar] [CrossRef]
  23. Zou, Y.; Sadeghi, M.; Liu, Y.; Puchko, A.; Le, S.; Chen, Y.; Andela, N.; Gentine, P. Attention-Based Wildland Fire Spread Modeling Using Fire-Tracking Satellite Observations. Fire 2023, 6, 289. [Google Scholar] [CrossRef]
  24. Ejaz, N.; Choudhury, S. A comprehensive survey of the machine learning pipeline for wildfire risk prediction and assessment. Ecol. Inform. 2025, 90, 103325. [Google Scholar] [CrossRef]
  25. Kale, M.P.; Meher, S.S.; Chavan, M.; Kumar, V.; Sultan, M.A.; Dongre, P.; Narkhede, K.; Mhatre, J.; Sharma, N.; Luitel, B.; et al. Operational Forest-Fire Spread Forecasting Using the WRF-SFIRE Model. Remote Sens. 2024, 16, 2480. [Google Scholar] [CrossRef]
  26. Donovan, G.H.; Rideout, D.B. An integer programming model to optimize resource allocation for wildfire containment. For. Sci. 2003, 49, 331–335. [Google Scholar] [CrossRef]
  27. Arrubla, J.A.; Ntaimo, L.; Stripling, C. Wildfire initial response planning using probabilistically constrained stochastic integer programming. Int. J. Wildland Fire 2014, 23, 825–838. [Google Scholar] [CrossRef]
  28. Zhou, S.; Erdogan, A. A spatial optimization model for resource allocation for wildfire suppression and resident evacuation. Comput. Ind. Eng. 2019, 138, 106101. [Google Scholar] [CrossRef]
  29. Granda, B.; Vitoriano, B.; Figueira, J.R. A mathematical programming approach for a wildfire suppression problem. Oper. Res. 2025, 25, 16. [Google Scholar] [CrossRef]
  30. Tezcan, B.; Eren, T. Forest fire resource planning with integer programming: An application in Turkey. For. Sci. Technol. 2025, 21, 318–325. [Google Scholar] [CrossRef]
  31. Petersen, J.E.; Kapur, S.; Gkantonas, S.; Mastorakos, E.; Giusti, A. Modelling and optimisation of extinction actions for wildfire suppression. Combust. Sci. Technol. 2023, 195, 3584–3595. [Google Scholar] [CrossRef]
  32. Renkas, A.; Popovych, V.; Rudenko, D. Optimization of Fire Station Locations to Increase the Efficiency of Firefighting in Natural Ecosystems. J. Environ. Res. Eng. Manag. 2022, 78, 97–104. [Google Scholar] [CrossRef]
  33. Trachanatzi, D.; Rigakis, M.; Marinaki, M.; Marinakis, Y. A modified Ant Colony System for the asset protection problem. Swarm Evol. Comput. 2022, 73, 101109. [Google Scholar] [CrossRef]
  34. Lankipalle, V. SwarmFusion: Revolutionizing Disaster Response with Swarm Intelligence and Deep Learning. arXiv 2025, arXiv:2507.00005. [Google Scholar] [CrossRef]
  35. de Azevedo Dantas, A.F.O.; Maitelli, A.L.; da Silva Linhares, L.L.; de Araujo, F.M.U. A Modified Matricial PSO Algorithm Applied to System Identification with Convergence Analysis. J. Control Autom. Electr. Syst. 2015, 26, 149–158. [Google Scholar] [CrossRef]
  36. Paiva, E.J.; Matos, M.A.; Rocha, A.M.A.C. A Simulation-Based Optimization Approach to the Firefighting Resource Scheduling Problem. In Computational Science and Its Applications—ICCSA 2024 Workshops; Lecture Notes in Computer Science 2024; Gervasi, O., Murgante, B., Garau, C., Taniar, D.C., Rocha, A.M.A., Faginas Lago, M.N., Eds.; Springer: Cham, Switzerland, 2024; Volume 14816. [Google Scholar] [CrossRef]
  37. Akopov, A.S. MBHGA: A Matrix-Based Hybrid Genetic Algorithm for Solving an Agent-Based Model of Controlled Trade Interactions. IEEE Access 2025, 13, 26843–26863. [Google Scholar] [CrossRef]
  38. SILVANUS Consortium. Deliverable D5.3: Demonstration of SILVANUS Decision Support System for Response Coordination; SILVANUS Project, Grant Agreement No. 101037247 (H2020-LC-GD-2020-3); Horizon 2020 EU. Available online: https://silvanus-project.eu/wp-content/uploads/2023/12/SILVANUS-D5.3.pdf (accessed on 10 August 2025).
  39. Chen, R.; Yan, H.; Liu, F.; Du, W.; Yang, Y. Multiple Global Population Datasets: Differences and Spatial Distribution Characteristics. ISPRS Int. J. Geo-Inf. 2020, 9, 637. [Google Scholar] [CrossRef]
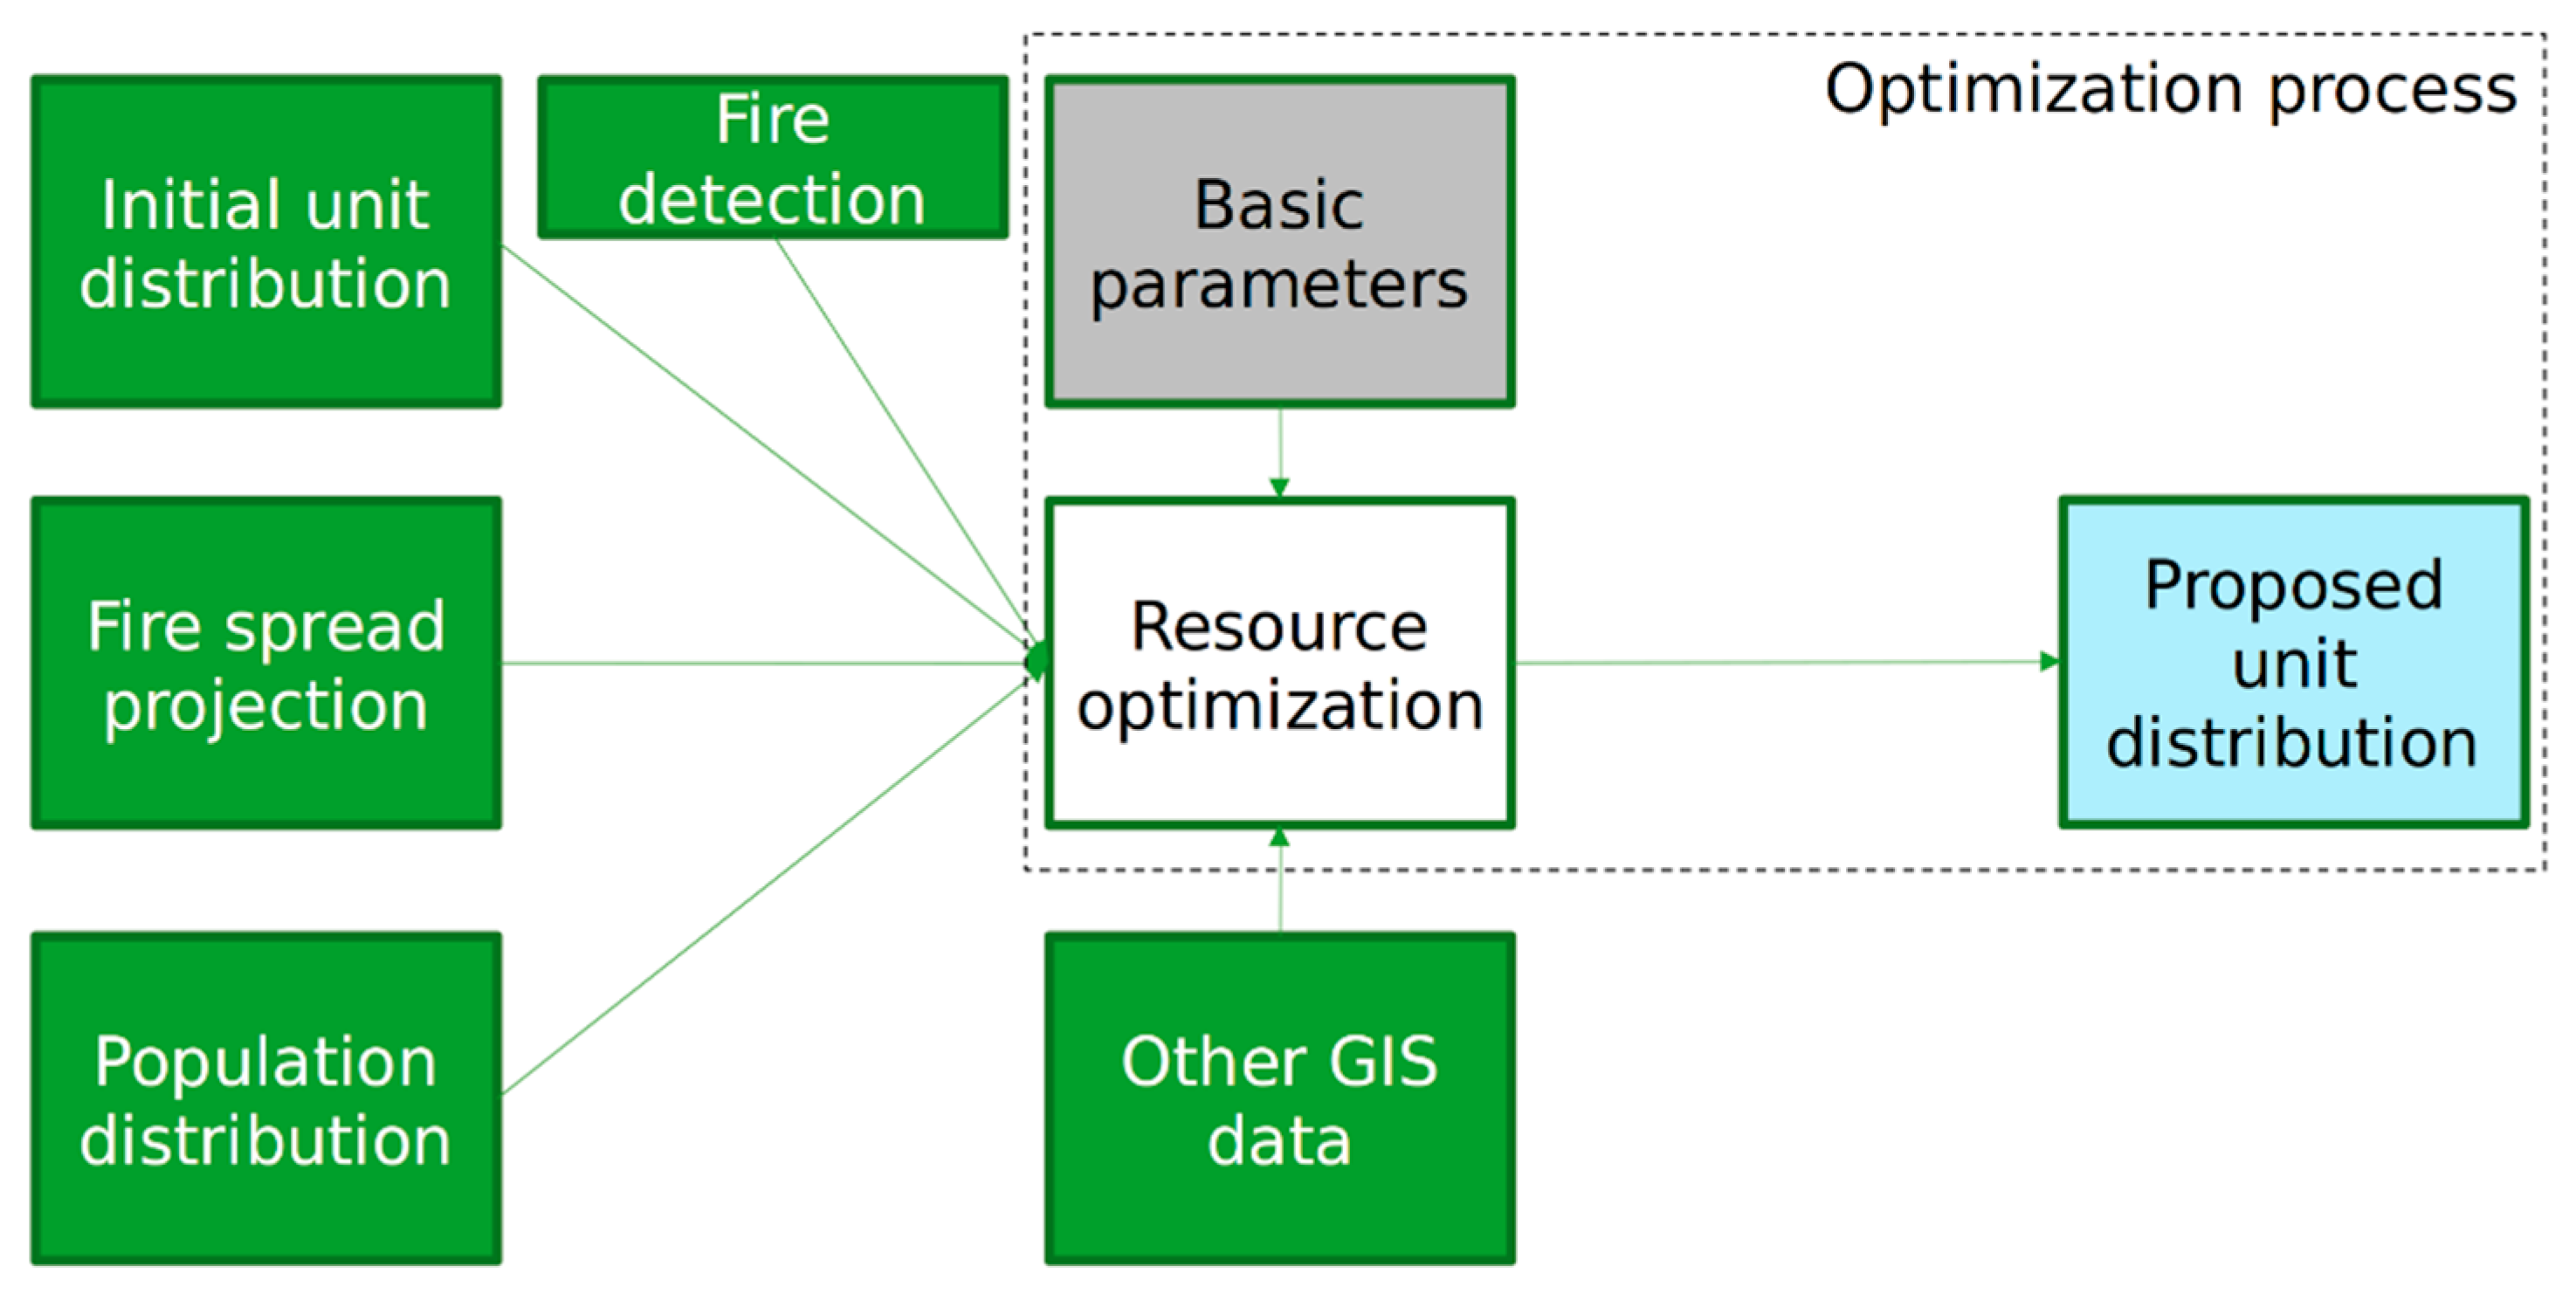
Figure 1. Resource Allocation Diagram (reproduced with permission from [38]).
Algorithms 18 00677 g001
Figure 2. Resource Allocation Input Raster.
Algorithms 18 00677 g002
Figure 3. Flowchart of the MORA algorithm illustrating the sequential lexicographic optimization.
Algorithms 18 00677 g003
Figure 4. Cell parameters for the area under demonstration: (a) Cell indexes; (b) Fire arrival time periods; (c) Population densities (reproduced with permission from [38]).
Algorithms 18 00677 g004
Figure 5. Optimization solution of the MORA demonstration, with high-risk areas depicted as red, treated areas depicted as grey and burnt areas depicted as black (reproduced with permission from [38]).
Algorithms 18 00677 g005
Figure 6. MORA demonstration inputs and final result: (a) Time periods of fire arrival, with t = 0 depicted as red, t = 1 depicted as orange and t = 2 depicted as yellow; (b) Final result after treatment by the response teams, with burnt areas depicted as black and treated areas depicted as gray (reproduced with permission from [38]).
Algorithms 18 00677 g006
Figure 7. Area under examination (Gargano, Italy) for the MORA validation scenario (area where the fire incident is simulated shown inside the red circle).
Algorithms 18 00677 g007
Figure 8. MORA validation scenario: (a) FSM model output showing fire spread arrival times, displayed with a color gradient from red (earlier arrival) to blue (later arrival); (b) Population distribution, shown with a color gradient from blue (lower density) to red (higher density).
Algorithms 18 00677 g008
Figure 9. Fire arrival, in time periods, according to the fire spread model for the MORA validation scenario (shown with a color gradient from dark brown: cells affected at time 0 to light brown: cells affected at time 5).
Algorithms 18 00677 g009
Figure 10. MORA validation scenario solution for t = 0 in a vector visualization: (a) High-risk cells annotation (red); (b) Output in the end of t = 0 (black).
Algorithms 18 00677 g010
Figure 11. MORA validation scenario solution for t = 1 in a vector visualization: (a) High-risk cells annotation; (b) Output in the end of t = 1 (new assignments: blue = engine-crew, yellow = hand-crew, value indicating number of resources).
Algorithms 18 00677 g011
Figure 12. MORA validation scenario solution for t = 2 in a vector visualization: (a) High-risk cells annotation; (b) Output in the end of t = 2 (grey = treated cells).
Algorithms 18 00677 g012
Figure 13. MORA validation scenario solution for t = 3 in a vector visualization: (a) High-risk cells annotation; (b) Output in the end of t = 3.
Algorithms 18 00677 g013
Figure 14. MORA validation scenario solution for t = 4 in a vector visualization: (a) High-risk cells annotation; (b) Output in the end of t = 4.
Algorithms 18 00677 g014
Figure 15. Final result of the MORA validation scenario.
Algorithms 18 00677 g015
Figure 16. MORA integration to SILVANUS platform (reproduced with permission from [38]).
Algorithms 18 00677 g016
Table 1. The resource type parameters for MORA demonstration (reproduced with permission from [38]).
Resource TypeSuppression RateCostCapacity (vs. Availability at Different Timeslots)
A2 t = 0:4
5t = 1:4
t = 2:4
B5 t = 0:3
15t = 1:2
t = 2:4
C1020t = 0:0
t = 1:0
t = 2:1
Table 2. Minimum suppression rate per time period for the MORA validation scenario.
Resource TypeSuppression Rate
(Chains/Hour)
CostCapacity (vs. Availability at Different Timeslots)
Hand Crew1 t = 0:0
2t = 1:10
t = 2:18
t = 3:20
t = 4:8
Engine Crew96t = 0:0
t = 1:1
t = 2:3
t = 3:2
t = 4:1
Helicopter1510t = 0:0
t = 1:0
t = 2:0
t = 3:0
t = 4:1
Table 3. Minimum suppression rate per time period for each cell for the MORA validation scenario.
Time PeriodTime (Min)Minimum Suppression Rate (Chains/Hour)
009
1159
2309
3604
41202
Disclaimer/Publisher’s Note: The statements, opinions and data contained in all publications are solely those of the individual author(s) and contributor(s) and not of MDPI and/or the editor(s). MDPI and/or the editor(s) disclaim responsibility for any injury to people or property resulting from any ideas, methods, instructions or products referred to in the content.