Article

A GIN-Guided Multiobjective Evolutionary Algorithm for Robustness Optimization of Complex Networks

Guangxi Key Laboratory of Trusted Software, Guilin University of Electronic Technology, Guilin 541004, China
*
Author to whom correspondence should be addressed.
Algorithms 2025, 18(10), 666; https://doi.org/10.3390/a18100666
Submission received: 21 September 2025 / Revised: 13 October 2025 / Accepted: 18 October 2025 / Published: 20 October 2025

Abstract

Network robustness optimization is crucial for enhancing the resilience of industrial networks and social systems against malicious attacks. Existing studies typically evaluate the robustness by simulating the sequential removal of nodes or edges and recording the residual connectivity at each step. However, the attack simulation is computationally expensive and becomes impractical for large-scale networks. Therefore, this paper proposes a multiobjective evolutionary algorithm assisted by a graph isomorphism network (GIN)-based surrogate model to efficiently optimize network robustness. First, the robustness optimization task is formulated as a multiobjective problem that simultaneously considers network robustness against attacks and the structural modification cost. Then, a GIN-based surrogate model is constructed to approximate the robustness, replacing the expensive simulation assessments. Finally, the multiobjective evolutionary algorithm is employed to explore promising network structures guided by the surrogate model, which is continuously updated via online learning to improve both prediction accuracy and optimization performance. Experimental results in various synthetic and real-world networks demonstrate that the proposed algorithm reduces the computational cost of the robustness evaluation by about 65 % while achieving comparable or even superior robustness optimization performance compared with those of baseline algorithms. These results indicate that the proposed method is practical and scalable and can be applied to enhance the robustness of industrial and social networks.

1. Introduction

Network robustness has become increasingly important in both natural systems and engineering applications [1,2,3] due to the growing complexity and interdependence of modern networks, such as power systems [4], communication networks [5], and gene regulatory networks [6]. It describes the ability of a system to maintain its core functionality despite partial failures caused by random or targeted attacks. Consequently, the evaluation and optimization of robustness have emerged as key research topics to ensure the stable operation of complex systems in various attack scenarios.
Robustness evaluation plays crucial roles in both the analysis and enhancement of complex networks. Existing evaluation methods are generally divided into two categories: a priori and a posteriori metrics. A priori metrics offer predictive insights based on inherent structural characteristics, such as the degree distribution [7], average shortest path length [8], and spectral indicators [9,10]. In contrast, a posteriori methods assess robustness by modeling node or edge removals and measuring the resulting loss in network connectivity or performance. Although a posteriori approaches typically require more computational resources than the former, they are better suited to capture network behavior in diverse failure scenarios. As a result, a posteriori methods have become the predominant choice for robustness assessment in real-world applications [1].
Based on robustness evaluation metrics, the methods for optimizing network robustness are generally categorized into two types: identifying and protecting critical components [11,12,13] and restructuring the network through rewiring strategies [14,15]. Existing studies have demonstrated that rewiring plays significant roles in improving infrastructure resilience and balancing system resources. Therefore, this study focuses on the latter approach, aiming to enhance system resilience by optimizing the network topology.
Unlike numerical optimization problems, rewiring-based optimization treats the entire network structure as the decision variable, which is highly discrete and nonlinear in nature [16,17]. As a result, the search space becomes extremely large, and even small-scale networks can have a vast number of possible configurations. Furthermore, these structural variants tend to exhibit similar robustness evaluations, which significantly increase the complexity of the optimization. Traditional heuristic algorithms improve network structures by performing the local search around candidate solutions, such as tabu search and simulated annealing algorithms [18,19]. However, the local search lacks diversity maintenance mechanisms, making it difficult to explore the global space and prone to getting trapped in local optima. To address this limitation, the evolutionary algorithm (EA) has been introduced, which maintains the population diversity through iterative simulations of natural evolution [20]. This mechanism gives evolutionary algorithms stronger flexibility and global search capability, showing good performance in network structure optimization [21,22,23]. Moreover, due to their strong performance in multiobjective optimization problems (MOPs) [24,25,26,27,28], multiobjective evolutionary algorithms (MOEAs) have been increasingly applied to enhance the robustness of complex networks [29,30]. Specifically, different robustness metrics often exhibit conflicting tendencies, making it challenging to simultaneously enhance resilience in various attack scenarios. Multiobjective evolutionary algorithms can generate a set of Pareto-optimal solutions in a single run, each representing a distinct tradeoff among competing objectives. For example, Wang and Liu [31] designed a novel MOEA to simultaneously enhance cooperation and controllable robustness in directed networks. SP-RV-MOEA [15] has been proposed to optimize both node robustness and edge robustness.
However, current research still faces several key challenges. First, the robustness evaluation is typically performed using a posteriori methods that simulate various types of attacks, which are computationally expensive. The computational cost scales rapidly with network size, making large-scale network evaluation particularly challenging. Second, evolutionary algorithms rely on iterative population-based searches, requiring a large number of fitness evaluations. For example, optimizing a network with 500 nodes can take several days [29], which severely limits the practical applicability of such methods in real-world scenarios. Lastly, existing robustness optimization models primarily focus on improving network stability by adjusting the topology while often neglecting the cost and constraints associated with the rewiring process.
In recent years, numerous studies have introduced surrogate models to reduce the computational burden of expensive optimization problems [32,33,34,35]. By approximating the original high-cost objective functions, these models provide low-cost predictions to guide the optimization process. However, most existing methods are primarily designed for continuous numerical problems and are not well suited for handling complex network structures [36,37,38]. Interestingly, deep learning [39,40,41] has demonstrated significant advantages in practical applications involving graph-structured data. In particular, graph neural networks (GNNs) [42,43] have shown strong capabilities in capturing high-order dependencies between nodes, making them especially effective for modeling complex graph relationships. Motivated by this, this study proposes a multiobjective evolutionary algorithm assisted by a graph isomorphism network (GIN) to optimize the network robustness, referred to as MOEA-GIN. The main contributions are summarized as follows:
  • The network robustness enhancement task is formulated as a multiobjective optimization problem, which simultaneously considers node robustness against targeted attacks and the cost of structural modifications;
  • A GIN-based surrogate model is employed to efficiently approximate the expensive robustness evaluation. Compared to traditional surrogate models, the GIN model directly learns from graph-structured data. It has relatively few parameters, which makes it easier to train and particularly suitable for high-cost optimization problems with limited sample sizes;
  • A novel surrogate-assisted multiobjective evolutionary algorithm is developed, in which a GIN model is employed to efficiently guide the search for robust network structures. Moreover, the GIN is iteratively updated via online learning to improve prediction accuracy during the optimization;
  • Extensive experiments on various complex networks demonstrate that the proposed MOEA-GIN framework achieves superior performance.
The remainder of this paper is structured as follows. Section 2 reviews the preliminary knowledge related to multiobjective robustness optimization. Section 3 elaborates on the proposed MOEA-GIN along with some insightful observations. Section 4 gives the experimental setup details and results. Section 5 concludes this work.

2. Preliminary Knowledge

2.1. Complex Network

Complex network systems are typically modeled as a graph ( G ( V , E ) ), where individuals or entities are represented as nodes, and the relationships between them are abstracted as edges. V = { 1 , 2 , , N } denotes the set of N nodes, and E = { e i j | i , j V , i j } represents the set of M edges. For unweighted and undirected graphs, if there is a connected edge between nodes i and j, then e i j = 1 ; otherwise, e i j = 0 .
During network operation, nodes or edges may be destroyed due to failures, random attacks, or targeted attacks, which can lead to functional degradation. To systematically describe these attack scenarios, the following threat model is adopted. The attacker seeks to minimize the network connectivity by removing key nodes or edges, simulating the failure of critical system components. Notably, it is typically assumed that the attacker has complete knowledge of the network topology, including node degrees, connectivity, and edge information, but lacks knowledge of internal node semantics or dynamic attributes. This structural-level assumption allows the network’s defense mechanisms to be evaluated under extreme conditions.
The attack strategies can be divided into two main scenarios. The first is random removal, where nodes or edges are randomly selected and removed, simulating failures or device malfunctions. The second type prioritizes the removal of highly important nodes or edges to simulate malicious attacks. The importance of nodes or edges is typically measured using the following metrics:
Degree. The degree of node i is the number of incident edges, denoted k i . Following [44], the degree of edge e i j can be defined as
k i j = k i × k j ,
where k i and k j are the degrees of nodes i and j, respectively. A higher degree indicates higher local importance.
Betweenness centrality. The betweenness centrality [8] of node l is
c B C l = i j V P i j l P i j ,
where P i j is the number of shortest paths between nodes i and j, and P i j l is the number of those paths that pass through node l. The edge betweenness ( c B C e k l ) is defined analogously as
c B C e k l = i j V P i j e k l P i j ,
where P i j e k l denotes the number of shortest paths passing through edge e k l . Higher c B C values indicate greater global importance.
Given the threat model, the network robustness is used to quantify the network’s structural stability and functional retention under attacks. To date, various strategies have been proposed to evaluate the robustness of complex networks. For example, Albert et al. [45] quantified the degradation of system functionality by analyzing changes in the degree distribution before and after attacks. In [46], spectral features are employed to assess the stability of network structures under perturbations. Additionally, Schneider et al. [19] measured the robustness by tracking the changes in the size of the largest connected component (LCC) during network degradation. Due to its reliability across diverse network scales and structures, the metric R has become a widely used tool for evaluating and improving network robustness. Given a network G ( V , E ) , the metric R can be calculated as follows:
R = 1 N i = 0 N 1 N L C C ( i ) N i ,
where N L C C ( i ) denotes the size of the largest connected component remaining after attacking i nodes. In this study, only malicious node attacks are considered, which are simulated by sequentially removing nodes with the highest degrees. A higher robustness metric (R) indicates a more stable network.
Under the guidance of robustness indicators, numerous algorithms have been developed to enhance network robustness by modifying the topology, including reconnecting existing edges [30] or adding new ones [47]. However, most of these studies only focus on improving robustness while overlooking the cost of structural adjustment. The optimized networks may require significant costs or even lead to a complete reconstruction of the structure. Therefore, this study introduces the cost term (C) in the optimization process, which is defined as follows:
C = | E G | | E G E G | | E G | ,
where E G denotes the edge set of the initial network (G), and E G is the edge set of the modified network ( G ). The intersection | E G E G | represents the number of edges that remain unchanged after the modification. The cost is C [ 0 , 1 ] , where C = 0 implies no change, and C = 1 denotes a completely restructured network.

2.2. Multiobjective Robustness Optimization

To address the tradeoff between improving robustness and minimizing structural modification costs, we model the problem as a multiobjective optimization task as follows:
minimize F ( x ) = { C , 1 R } = | E G | | E G E G | | E G | 1 1 N i = 0 N 1 N L C C ( i ) N i ,
where the individual ( x ) denotes a rewired network, and robustness is reformulated as the minimization objective ( 1 R ). In addition, the degree distribution of the network is required to remain unchanged during the optimization process.
Unlike single-objective optimization, the optimal solution to a multiobjective problem generally consists of a set of non-dominated solutions. Especially, a solution ( x ) is said to dominate solution y ( x y ), if i { 1 , , m } , F i ( x ) F i ( y ) i { 1 , , m } , F i ( x ) < F i ( y ) . A solution ( x * ) is called a Pareto-optimal solution if and only if x * is not dominated by other solutions. The set of all the Pareto-optimal solutions is known as the Pareto set (PS). The corresponding mapping of the PS in the objective space is referred to as the Pareto front (PF).

2.3. Surrogate-Assisted Optimization

Most EAs assume that objective functions are analytically available and computationally inexpensive, allowing tens of thousands of fitness evaluations to progressively approach the optimal solution. However, this assumption often fails in real-world engineering scenarios, where many optimization problems rely on time-consuming numerical simulations or physical experiments. For example, in fields including computational fluid dynamics [48], turbine engine design, drug design [49], and industrial process optimization, a single evaluation may take from minutes to hours or even days. Such problems are referred to as expensive optimization problems (EOPs), where limited computational resources make large-scale evaluations impractical. To address this challenge, numerous studies have employed surrogate models to approximate expensive objectives, thereby assisting the solution of numerical optimization problems.
In [37,38,50], the Kriging has been used to approximate expensive objective functions. By modeling the correlation among sample points via a covariance function, it provides both predictions ( y ^ ( x ) ) and predictive uncertainty ( σ 2 ( x ) ), which is useful for adaptive sampling. The Kriging model consists of a trend function and a Gaussian process, with the prediction expressed as follows:
y ^ ( x ) = f ( x ) T β + z ( x ) , z ( x ) G P ( 0 , k ( x , x ) ) ,
where f ( x ) T β is the trend component, β denotes the regression coefficients, z ( x ) represents the Gaussian process modeling the residuals, and k ( x , x ) is the covariance function characterizing correlations among sample points. However, the computational cost of the Kriging increases significantly as the number of training samples grows.
The radial basis function (RBF) [35,36,51,52] is another widely used surrogate model, as it is relatively insensitive to high-dimensional data. The core idea is to construct local response functions at interpolation points and combine them linearly to approximate the objective function. It can be expressed as follows:
y ^ ( x ) = i = 1 n w i ϕ ( | | x x c | | 2 ) ,
where n is the number of known sample points, w i denotes the weight, and ϕ ( · ) is the radial basis function, with the Euclidean distance ( | | x x c | | ) between the input ( x ) and center ( x c ) as its argument. In addition, inverse distance weighting (IDW) [14] and least squares (LS) regression are commonly used surrogate models, suitable for simple interpolation and large-scale data fitting, respectively.

2.4. Graph Neural Networks

GNNs [42,43] are a class of neural architectures that operate directly on graph-structured data and have proven to be effective for representation in networks. The core idea is message passing, where each node iteratively exchanges information with its neighbors to update its representation.
Given a graph ( G ( V , E ) ), the generic message-passing method can be written as follows:
h v ( l + 1 ) = COMBINE ( h v ( l ) , AGGREGATE ( { h u ( l ) ; u N ( v ) } ) ) ,
where h v ( l ) denotes the feature representation of node v at the lth layer, N ( v ) is the set of its neighbors, the AGGREGATE ( · ) function (e.g., mean, sum, or attention-weighted sum) collects information from neighbors, and the COMBINE ( · ) function merges this message with the node’s current feature. After L layers, each node can encode information from its L-hop neighborhood.
Different GNN variants mainly differ in the design of the AGGREGATE and COMBINE functions. For example, the graph convolutional network (GCN) [53] uses a mean pooling aggregator as follows:
h v ( l + 1 ) = σ u N v { v } a ( v , u ) · h v ( l ) · W ( l ) ,
where a ( v , u ) is a normalization coefficient derived from the symmetrically normalized adjacency matrix, W ( l ) is a learnable weight matrix for the lth layer, and σ ( · ) denotes a nonlinear activation function. Other variants employ more expressive aggregation strategies, such as long short-term memory (LSTM) [54] or attention mechanisms [55], to better capture neighborhood information.
For graph-level tasks, node embeddings are further combined into a graph representation using a permutation-invariant READOUT function [56,57] as follows:
H G = READOUT h v ( L 1 ) , v V .
This graph-level embedding ( H G ) provides a compact, order-invariant representation of the entire graph, suitable for downstream tasks, such as graph classification, regression, or prediction problems.

3. Proposed Algorithm

3.1. Framework

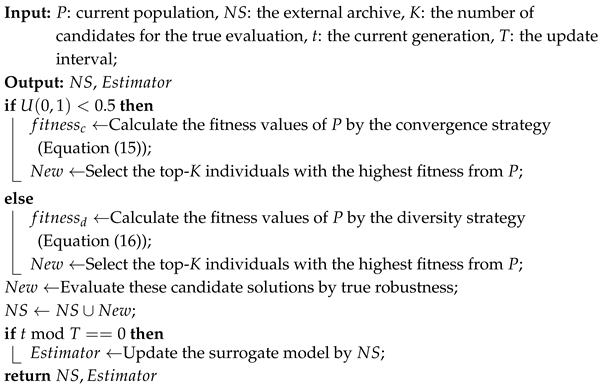
Algorithm 1 presents the overall framework of MOEA-GIN, which includes three key components: model construction, evolutionary optimization, and online learning. In the model construction phase, the algorithm establishes a database based on the initial network ( G 0 ) and trains a surrogate model to estimate network robustness, thereby replacing expensive real evaluations. In the evolutionary optimization phase, the algorithm conducts an evolutionary search guided by the trained surrogate model. It begins by initializing the population (P) and the external archive ( N S ). The archive ( N S ) is designed to store solutions that have been evaluated by the real robustness model and serves as a high-quality reference set for sampling and model updates. Offspring are then generated through evolutionary operators, such as crossover, mutation, and local search. Subsequently, an environmental selection mechanism is applied to choose high-quality individuals as parents for the next generation. In the online learning phase, a subset of elite candidate solutions is sampled for real evaluation, thereby updating the external archive set ( N S ) and surrogate model. With the help of this online feedback mechanism, the algorithm can continuously improve the prediction accuracy and solution quality. Once the termination criterion is met, the obtained Pareto-optimal solutions are output.
Algorithm 1: MOEA-GIN.
Algorithms 18 00666 i001
In addition, Figure 1 illustrates the overall workflow of MOEA-GIN, highlighting the interactions among its three core components: model construction, evolutionary optimization, and online learning.

3.2. Model Construction

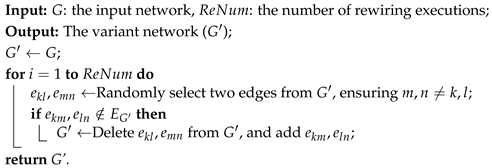
During the model construction phase, MOEA-GIN first applies a topological rewiring operator to the initial network ( G 0 ) to generate a set of structurally diverse variants. These variants are then evaluated using the real robustness metric to construct the dataset for training the surrogate model. The pseudo-code of the topological rewiring operator is shown in Algorithm 2. It modifies the network topology by repeatedly selecting and rewiring two pairs of edges while strictly preserving the original degree distribution. Specifically, it randomly selects two edges ( e k l and e m n ) without overlapping nodes from the network ( G ). If the new edges ( e k m and e l n ) do not already exist in the network, the original edges are replaced. The rewiring procedure is repeated R e N u m times to ensure sufficient structural perturbation. This operator can generate network individuals with significantly different structures but consistent topological properties, thereby improving the diversity of the training data without introducing structural bias.
Algorithm 2: Topological rewiring operator.
Algorithms 18 00666 i002
After collecting sufficient labeled network variants through the real robustness evaluation, we construct a surrogate model to approximate the robustness metric. Given the graph-structured nature, a graph neural network [42,43] is employed to effectively capture topological and structural information. Among various GNN architectures, we adopt the graph isomorphism network (GIN) [53], which has been theoretically proven to achieve the maximum discriminative power among message-passing GNNs, being as expressive as the Weisfeiler–Lehman (WL) graph isomorphism test. This property allows GIN to better distinguish subtle structural differences between networks, which is critical for robustness optimization, as small topological changes may lead to significant performance variations. In addition, it can generate graph-level representations that preserve the overall topological features, making it particularly suitable for network robustness prediction and other graph-level regression tasks. The node representations are updated iteratively via neighborhood aggregation as follows:
h v ( l ) = MLP ( l ) ( 1 + ϵ ( l ) ) · h v ( l 1 ) + u N ( v ) h u ( l 1 ) ,
where h v ( l ) represents the feature of node (v) at the lth layer, ϵ ( l ) is a learnable or fixed scalar, and N ( v ) denotes the set of neighbors of node v. The initial feature ( h v ( 0 ) ) is set as the degree of node v, i.e., [ k v ] . After multiple GIN layers, the graph-level representation is obtained by first applying a READOUT operation (i.e., SUM) to node features from each layer and then concatenating the resulting vectors across all the layers as follows:
H G = CONCAT SUM H ( l ) | l = 0 , 1 , , L 1 .
The overall framework of the surrogate model is illustrated in Figure 2. First, the input graph is processed through five GIN convolutional layers, each followed by BatchNorm and ReLU activation. The node features produced at each layer are then aggregated with a READOUT operation and concatenated to form a comprehensive graph-level representation. Finally, this representation is passed through fully connected layers to predict the robustness score of the input network.
The model is trained to minimize the mean squared error (MSE) between predicted and true robustness scores as follows:
L M S E = 1 n i = 1 n | | R ( i ) R ( i ) | | ,
where R ( i ) represents the predicted robustness of the ith sample network, R ( i ) is the true robustness, and | | · | | is the Euclidean norm.

3.3. Evolutionary Optimization

In the evolutionary optimization phase, MOEA-GIN aims to improve the network robustness under the guidance of a surrogate model. Given the unique characteristics of network structures, it is essential to preserve key properties, such as the degree distribution, connectivity, and clustering coefficient, during the optimization. To address this challenge, MOEA-GIN employs evolutionary operators specifically designed for network structure optimization.
First, MOEA-GIN applies the topological rewiring operator (Algorithm 2) to the original network ( G 0 ) to generate an initial population of size P O P , and the surrogate model is employed to predict the robustness of each individual. The corresponding pseudo-code is provided in Algorithm 3.
Algorithm 3: Initialization.
Algorithms 18 00666 i003
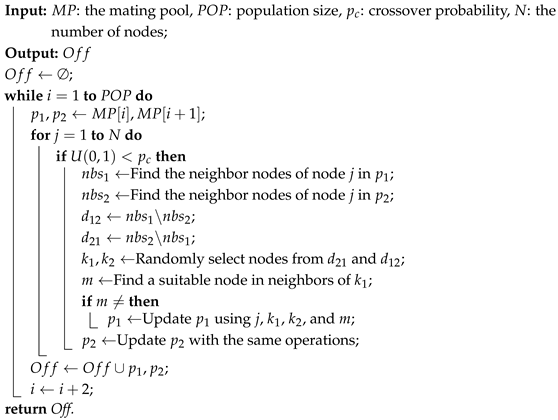
Subsequently, special crossover and mutation operators are introduced to generate new candidate solutions. In particular, the crossover operator aims to exchange partial topological information between individuals, thereby promoting structural diversity and enhancing exploration capability. The corresponding pseudo-code is provided in Algorithm 4. On lines 1–3, the algorithm selects two parent individuals ( p 1 and p 2 ) from the mating pool ( M P ) to perform crossover. On lines 4–13, for each node (j), it attempts to exchange the connection information between two parents with a probability of p c . Specifically, if U ( 0 , 1 ) < p c , the neighbors of node j in p 1 and p 2 are first identified as n b s 1 and n b s 2 , respectively, and their difference sets ( d 12 and d 21 ) are calculated. Two nodes ( k 1 and k 2 ) are then randomly selected from d 21 and d 12 . Subsequently, a node (m) is searched from the neighbors of k 1 such that no edge exists between k 2 and m in p 1 . If such a node (m) is found, the edge between j and k 2 is removed and replaced by an edge between j and k 1 in p 1 . Meanwhile, the edge between k 1 and m is removed, and an edge between k 2 and m is added in p 1 . The same operations are performed on p 2 . On line 15, the newly generated individuals ( p 1 and p 2 ) are added to O f f . This process repeats until P O P offspring individuals are generated and returned.
Algorithm 4: Crossover operator.
Algorithms 18 00666 i004
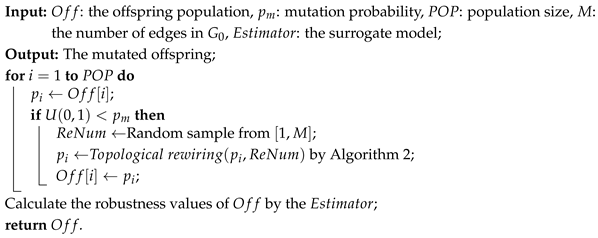
After the crossover, the mutation operator is applied to further enhance the diversity of the offspring population. It applies the topological rewiring operator to adjust the network structure of each offspring individual with a probability of p m . This operator introduces small, controlled perturbations to the network topology, thereby facilitating the exploration of new regions in the search space. The corresponding pseudo-code is provided in Algorithm 5.
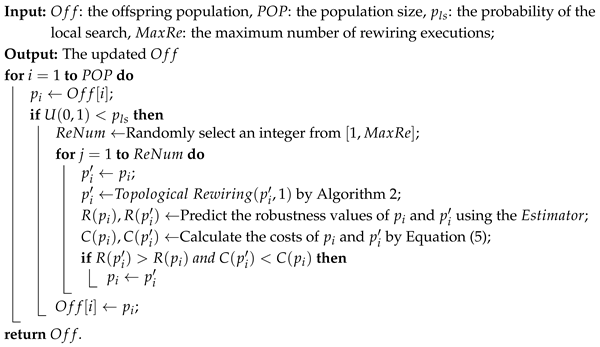
Next, a local search operator is performed on the offspring population to exploit potential high-quality solutions. Unlike previous studies [29,30], MOEA-GIN relies entirely on low-cost robustness estimations provided by the surrogate model to guide this process, significantly reducing the computational overhead. The corresponding pseudo-code is shown in Algorithm 6. For each individual ( p i ) in the offspring population ( O f f ), the algorithm performs a local search with a probability of p l s . If triggered, a random integer is selected from the interval [ 1 , M a x R e ] to determine the number of topological rewiring attempts ( R e N u m ), where M a x R e is a predefined hyperparameter. In each attempt, a candidate individual ( p i ) is generated through a single rewiring operation. The surrogate model and Equation (5) are then used to calculate the robustness and cost of p i . The modification is accepted only if p i achieves better performance in both robustness and cost compared to those of the original individual ( p i ). After all the attempts are completed, the final improved individual is updated to the offspring population.
Algorithm 5: Mutation operator.
Algorithms 18 00666 i005
Algorithm 6: Local search.
Algorithms 18 00666 i006
Finally, the environmental selection based on the non-dominated sorting and crowding distance [58] is employed to select individuals with better convergence and diversity to form the next generation.

3.4. Online Learning

Although the search guided by the surrogate model can significantly reduce the computational costs, the prediction errors may lead the optimization process away from truly robust solutions, thus affecting the quality of the final results. In contrast, the search based on the true evaluation can directly improve the individual fitness and help the algorithm to escape the local optimum. However, it will significantly increase the computational overhead. Therefore, MOEA-GIN actively incorporates an online learning mechanism to continuously improve the prediction accuracy of the surrogate model while maintaining the optimization performance. This mechanism dynamically corrects the deviation of the surrogate model by performing real evaluation on a small number of representative candidate solutions, thereby achieving a good tradeoff between efficiency and accuracy.
Specifically, in each generation, a set of K candidate solutions is selected from the current population (P) for the true robustness evaluation. To ensure the informativeness of the evaluated samples, MOEA-GIN adopts a dual-strategy sampling mechanism, which randomly alternates between two selection criteria:
  • Convergence-oriented strategy. This strategy selects individuals based on their dominance over solutions in N S . It is defined as the sum of the times that an individual is superior to other individuals in each objective, expressed as follows:
    C D R ( x ) = i = 1 , x P , y N S m f i ( x ) < f i ( y ) ,
    where f i ( · ) denotes the ith objective function ( i { 1 , 2 , , m } ). N S is the set of solutions that have been evaluated using the real robustness function during the optimization process. By leveraging the reliable reference set, it enables the algorithm to select promising solutions that are likely near the true Pareto front, thus guiding the search more effectively. Moreover, if such individuals turn out to be false positives, their feedback can effectively guide model correction and reduce prediction bias.
  • Diversity-oriented strategy. To promote exploration in unexplored regions, shift-based diversity estimation (SDE) [59] is employed to guide the sampling. For an individual ( x ), SDE is calculated as follows:
    S D E ( x , N S ) = S F { d i s t ( x , y 1 ) , , d i s t ( x , y | N S | ) } ,
    where d i s t ( · ) represents the Euclidean distance between individuals, the function S F ( · ) is used to quantify the similarity between x and the individuals in N S , and y is the shifted individual as follows:
    f i ( y ) i { 1 , 2 , , m } = f i ( x ) , f i ( y ) < f i ( x ) f i ( y ) , o t h e r w i s e .
    This strategy improves the coverage of the Pareto front by encouraging exploration in underrepresented regions. In addition, diverse samples can enhance the generation ability of the surrogate model and mitigate the risk of overfitting.
Once selected, these K candidates are evaluated using the real robustness metric and added to the external archive ( N S ). Every T generations, the surrogate model is updated based on N S . This online feedback mechanism enables MOEA-GIN to continuously adapt to the search space landscape and progressively enhance the accuracy of the model. The pseudo-code is shown in Algorithm 7.
Algorithm 7: Online learning.
Algorithms 18 00666 i007

4. Experimental Analysis

4.1. Experimental Setting

To assess the effectiveness of MOEA-GIN, we performed a series of comparative experiments on both synthetic and real-world networks. The synthetic networks include Erdős–Rényi (ER) random graphs [60], Barabási–Albert (BA) scale-free networks [46], and Watts–Strogatz small-world networks (SW) [61]. The ER model generates networks by randomly connecting nodes, resulting in highly stochastic topologies. The BA model produces scale-free networks characterized by a power-law degree distribution through a preferential attachment process, leading to a few highly connected hub nodes. The WS model constructs small-world networks by rewiring edges in regular lattices with a certain probability, preserving short average path lengths while increasing randomness. These models capture key structural features observed in real-world networks, making them suitable benchmarks for evaluating MOEA-GIN.
To comprehensively evaluate the optimization performance of the proposed algorithm, three variants of MOEA-GIN were selected as benchmarks for comparison. The first variant (MOEA0) is the classical NSGA-II algorithm [58], which has has demonstrated robust performance across various practical applications [62,63,64,65,66]. Thus, it can provide a reliable baseline for fair comparison. The second variant is the Multiobjective Memetic Algorithm, i.e., MOEA-LS [29], which enhances the solution accuracy of NSGA-II by incorporating a local search strategy and has shown satisfactory performance in robustness optimization. Moreover, in discrete combinatorial optimization problems, especially in applications such as complex network robustness optimization [15,30,62], the vehicle-routing problem [67], and critical node detection, memetic algorithms are among the main optimization methods. The third variant, MOEA-OL-LS, incorporates an offline learning mechanism [68] and serves to validate the effectiveness of online learning in the optimization process. Unlike offline learning, which does not update the surrogate model during the optimization, online learning continuously refines the model during the evolutionary process, potentially enhancing the optimization performance. The specific parameter settings are listed in Table 1. For MOEA-OL-LS, the size of the initial training set is set at 500, i.e., n = 500 .
To evaluate the quality of the obtained Pareto sets, two widely used indicators are employed: hypervolume (HV) [69] and spacing [70]. The HV quantifies the total objective space dominated by the solutions relative to a reference point, thus reflecting both convergence toward the true Pareto front and the diversity of the obtained solutions. It is defined as follows:
HV ( P ) = Vol x P i = 1 m [ f i ( x ) , r i ] ,
where P is the searched Pareto set, f i ( x ) is the ith objective of solution x , and r i is a reference point coordinate. A higher HV indicates better convergence and diversity.
The spacing indicator ( Δ ) evaluates the uniformity of the solution distribution as follows:
Δ = 1 N 1 i = 1 N ( d i d ¯ ) 2 , d i = min j i k = 1 m ( f k ( x i ) f k ( x j ) ) 2 , d ¯ = 1 N i = 1 N d i ,
where N is the number of solutions, d i denotes the distance between solution x i and its nearest neighbor, and d ¯ is the mean of all the distances. Lower Δ values indicate more evenly distributed solutions.

4.2. Validation and Verification of the Surrogate Model

To verify the effectiveness of the surrogate model in approximating the network robustness, we conducted comprehensive experiments with three representative baseline models: GE_SU [14,15], CNN [40], and GCN [53,71]. Specifically, GE_SU first extracts low-dimensional features of network nodes using the SDNE algorithm, which effectively preserves the structural information of the network topology. Subsequently, it incorporates an ensemble-learning framework that fuses prediction results from three base models (RBF, LS, and IDW) to ultimately achieve the surrogate prediction of the network robustness. The CNN-based model focuses on leveraging the feature extraction capability of convolutional neural networks. It has been widely applied in two types of network-robustness-related tasks: first, network connectivity robustness prediction [72,73]; second, controllable robustness prediction [40]. The GCN is a representative graph neural network model, which directly aggregates feature information from nodes’ local neighborhoods to learn topological patterns of graphs. In the experiments, three types of typical synthetic networks (ER, BA, and SW) were selected, with four node scales (200, 500, 1000, and 2000 nodes). All the networks had a fixed average degree of six to ensure consistent network density across different configurations. For each network type and scale, training sets (200 samples) and test sets (100 samples) were generated via topological rewiring.
Table 2 summarizes the prediction errors, inference times, and real robustness evaluation times of the four surrogate models in different network configurations, where the bold values indicate the best performances. In terms of the prediction accuracy, it is evident that the GIN model exhibits significant advantages over the other three baseline models, achieving the lowest prediction errors in nine out of twelve network configurations. This demonstrates its superior capability in approximating the network robustness. The GCN model shows certain competitiveness and achieves relatively good accuracy in SW200 and SW500 networks. However, due to its neighborhood-averaging aggregation mechanism, GCN struggles to capture high-order structural dependencies and fails to generate distinctive graph-level representations, resulting in a slightly inferior overall performance compared with that of GIN. In contrast, the GE_SU and CNN models present relatively lower prediction accuracies and exhibit noticeable performance degradations as the network scale increases. The GE_SU model relies on SDNE-based node embeddings and an ensemble of base regressors, where the feature extraction and prediction stages are independent, leading to insufficient utilization of structural information. Furthermore, its high number of parameters makes it prone to overfitting when the sample size is limited. Similarly, although the CNN model possesses local feature extraction capability, it fails to capture high-order topological dependencies, and its parameter count grows rapidly with increasing network size, resulting in higher prediction errors in complex networks.
In addition to prediction accuracy, the GIN model also demonstrates a clear advantage in inference speed. For instance, in BA1000 networks, the average inference time of GIN is only 0.44 s, compared to 7.20 s for GE_SU and 15.75 s for CNN. This advantage becomes even more pronounced as the network scale increases: The true robustness evaluation requires 73.20 s and 289.41 s in BA1000 and BA2000 networks, respectively, whereas GIN maintains inference times of below 0.6 s. In contrast, the inference times of GE_SU and CNN grow substantially with increasing network scale due to the increase in model parameters, reaching 16–46 s in 2000-node networks. These results indicate that GIN achieves 2–3-order-of-magnitude acceleration while maintaining high prediction accuracy, substantially reducing the computational cost in large-scale network optimization.

4.3. Experimental Results in Synthetic Networks

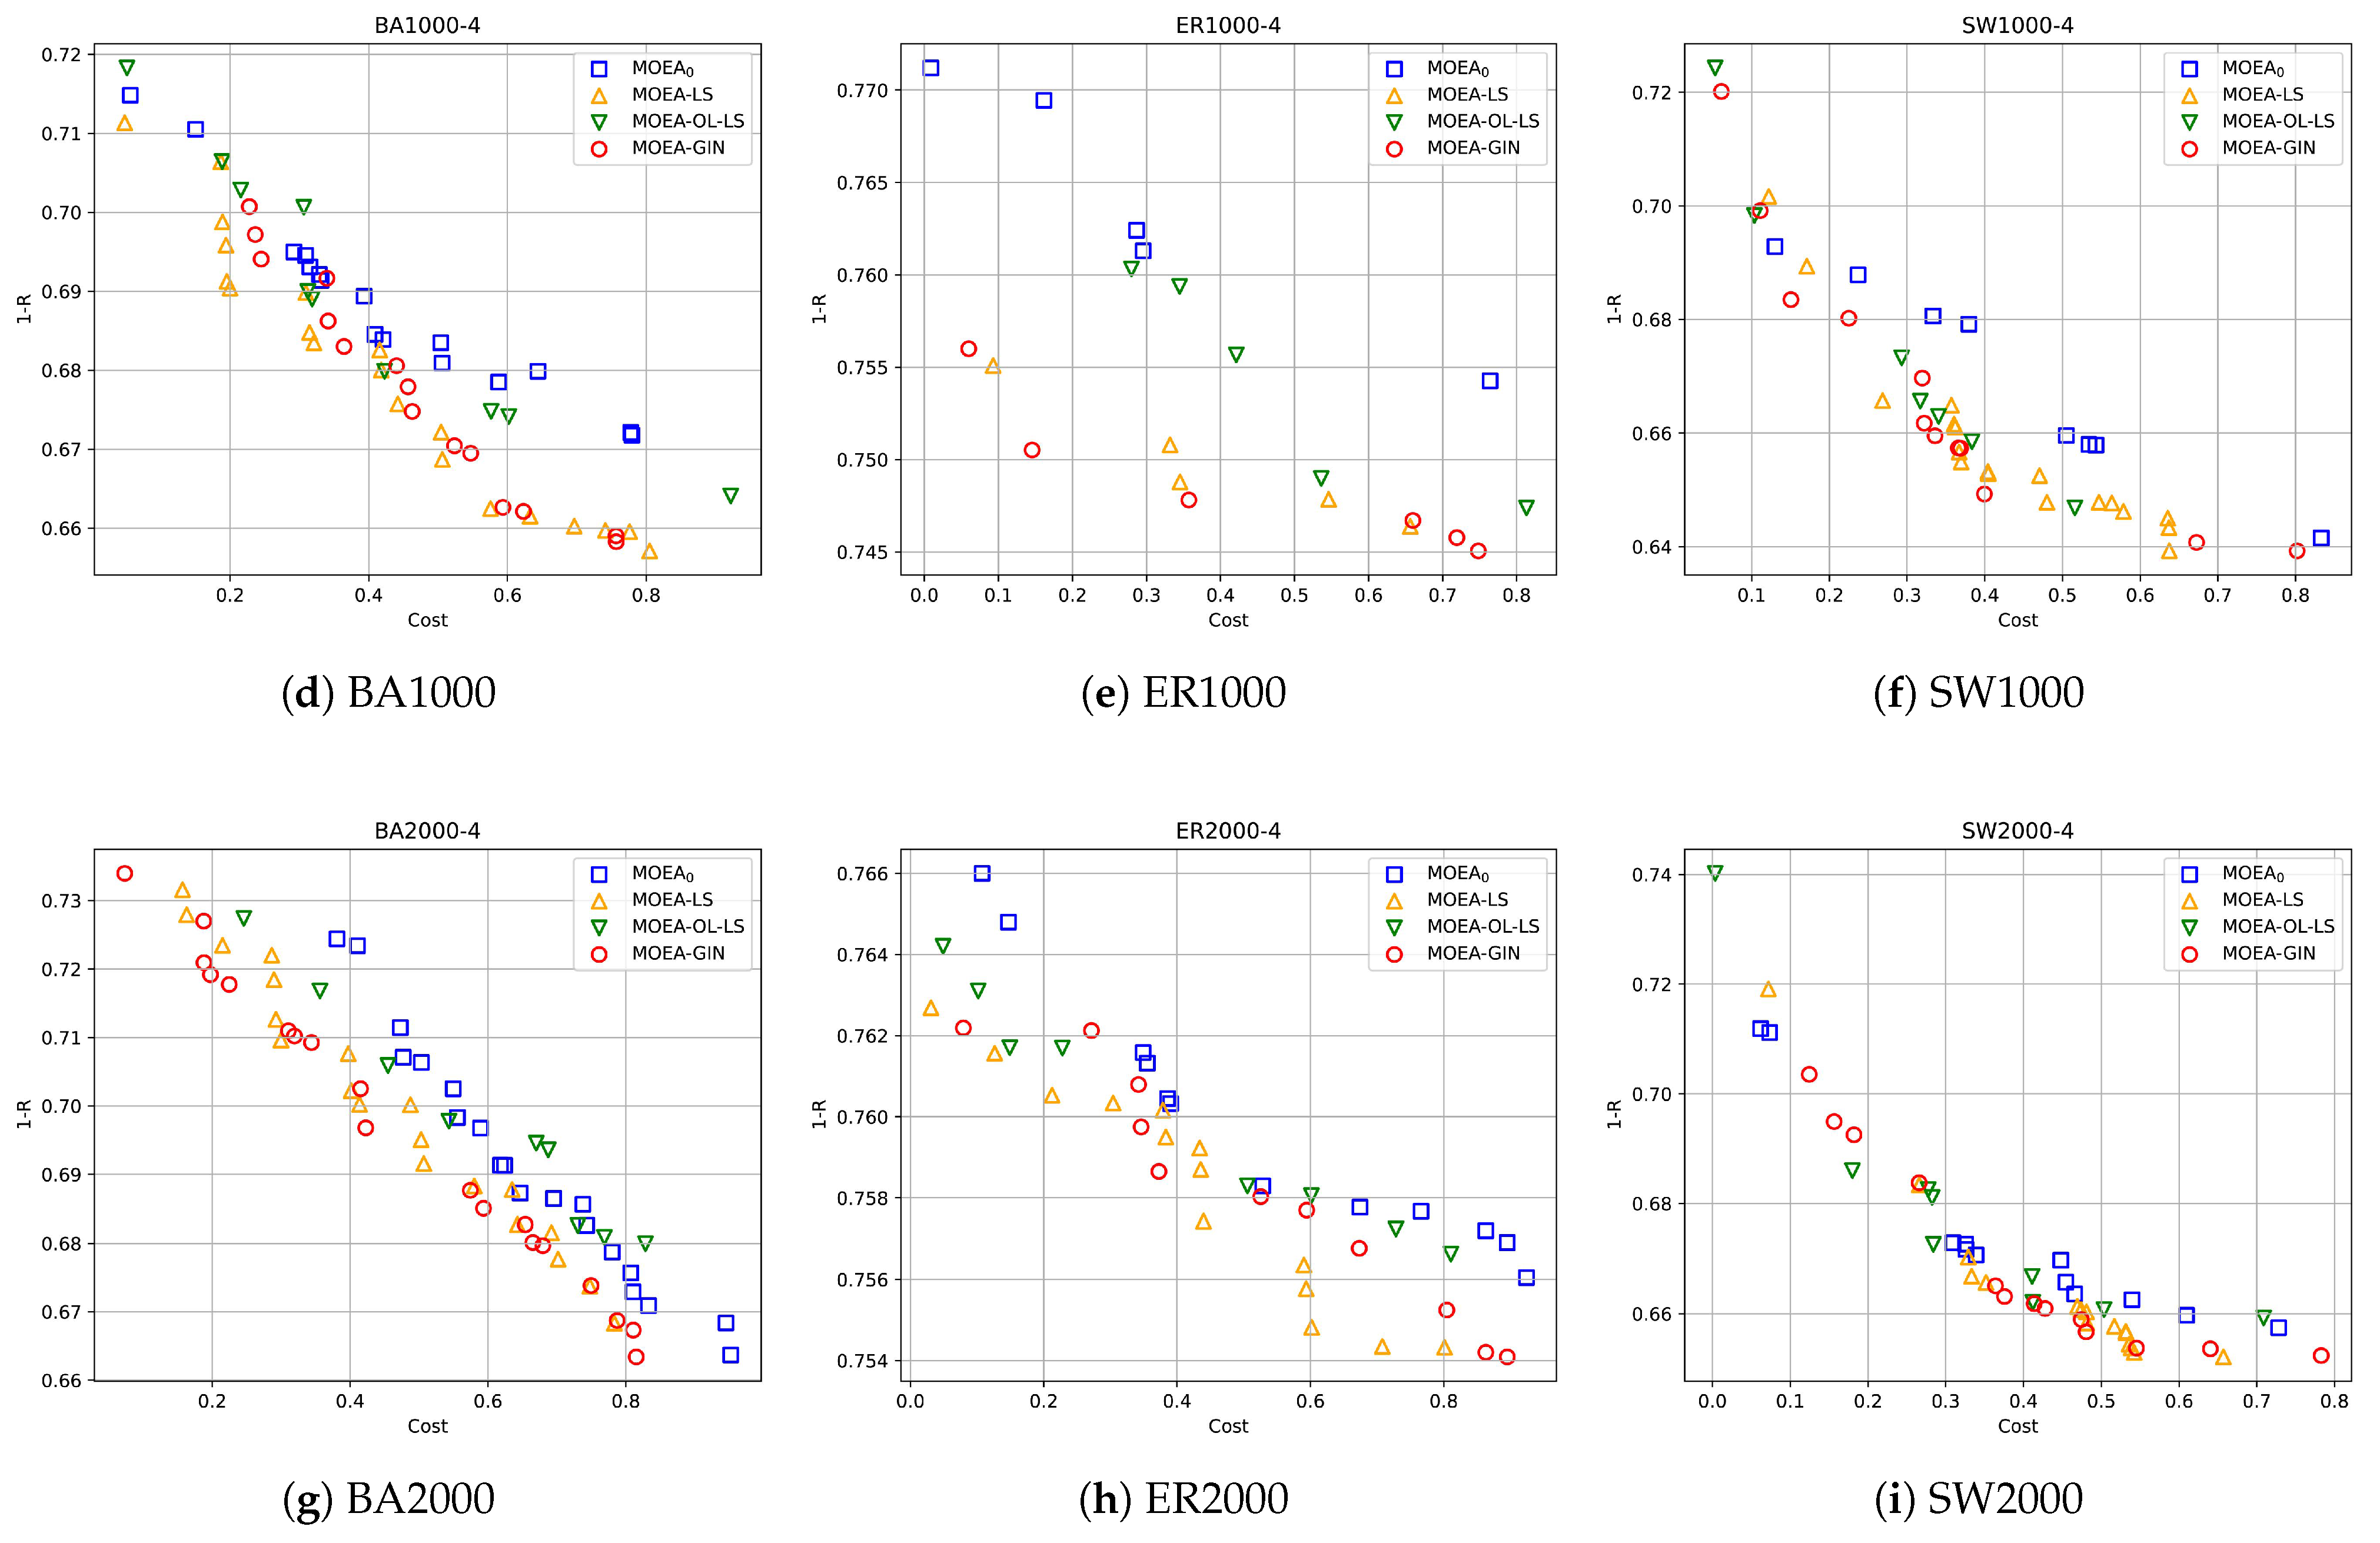
In the experiments on synthetic networks, we evaluated the optimization performance of the proposed MOEA-GIN across different network topologies. Each network type was tested at three scales (500, 1000, and 2000 nodes), with the average degree fixed at < k > = 4 . Table 3 summarizes the experimental results of four algorithms in synthetic networks. It shows the average HV, Δ , and total runtime of each algorithm in different network configurations. The Wilcoxon rank-sum test with a significance level of 0.05 was employed to assess whether there were statistically significant differences between the algorithms, and “−”, “+”, and “≈” indicate that MOEA-GIN performs significantly better or worse or equivalently well compared to the baseline algorithms, respectively. In addition, the best value is highlighted in bold for clarity.
From the results, we can observe that MOEA-GIN achieves a competitive or a superior performance across most instances. In small-scale networks (i.e., 500 nodes), MOEA-GIN obtains the best HV values in BA and ER networks, demonstrating its excellent convergence capability while maintaining a relatively short runtime. MOEA-LS achieves the highest HV in SW. However, the local search strategy invokes a high number of expensive true robustness evaluations, which significantly increases the computational burden and causes its running time to be about three times that of MOEA-GIN. In contrast, MOEA-GIN effectively reduces dependence on true evaluations by leveraging surrogate-model-guided searches, substantially improving the optimization efficiency. For MOEA0, it excludes the local search, achieving the shortest runtime but exhibiting a poorer optimization performance. Although MOEA-OL-LS employs offline surrogate model training and a local search strategy, its performance is worse than that of MOEA-GIN. This demonstrates the effectiveness of online learning in maintaining the accuracy of the surrogate model and improving the optimization performance. For the spacing metric, MOEA-GIN achieves lower Δ values in most instances, showing that it can maintain good diversity. MOEA0 exhibits good diversity but shows insufficient convergence due to its limited search capability. MOEA-LS achieves higher HV values in some instances but shows higher Δ values, indicating relatively poor diversity.
As the network size increases to 1000 and 2000 nodes, the computational cost of the optimization rises sharply, making MOEA-GIN’s advantages more pronounced. First, MOEA-GIN consistently maintains the shortest runtime across all the network sizes. Its runtimes in 1000- and 2000-node networks not only outperform those of MOEA0 but also are more than four to five times faster than those of MOEA-LS, significantly improving computational efficiency for large-scale networks. Second, MOEA-GIN achieves the best or near-best HV values in most instances, demonstrating a strong convergence performance. Furthermore, according to the Δ values, MOEA-GIN maintains good uniformity in solution distribution, indicating that it can preserve Pareto set diversity while optimizing efficiently. These results indicate that as the network scale increases, MOEA-GIN not only demonstrates higher optimization efficiency but also achieves satisfactory convergence and diversity.
Figure 3 illustrates the non-dominated solutions obtained by four algorithms in synthetic networks. It is clear that MOEA-GIN demonstrates a performance comparable to that of MOEA-LS, effectively searching for a well-distributed set of solutions in the objective space and achieving better tradeoffs among multiple objectives. In contrast, MOEA0 exhibits clear limitations, with poor convergence of the solution set, making it difficult to find more robust networks. This is mainly due to the absence of a local search mechanism. MOEA-OL-LS maintains the quality of the non-dominated solution set to a certain extent under the guidance of the offline proxy model. However, due to the limited coverage of the initial training dataset, it lacks the ability to thoroughly explore complex objective spaces and fails to accurately approximate the Pareto front. Overall, by integrating online learning with a surrogate-assisted search, MOEA-GIN ensures a balanced tradeoff between convergence and diversity, enabling the generation of high-quality Pareto-optimal solutions.

4.4. Experimental Results in Real-World Networks

To further evaluate the generalization ability and practical performance of the MOEA-GIN, we conducted experiments on a set of real-world networks selected from the Network Repository [74], covering domains such as biology, power systems, and communications. These networks differ significantly in scale and complexity, offering a rigorous benchmark for assessing the model’s performance and scalability. Table 4 summarizes their key topological properties, including the numbers of nodes and edges, maximum degrees, average degrees, and aggregation coefficients.
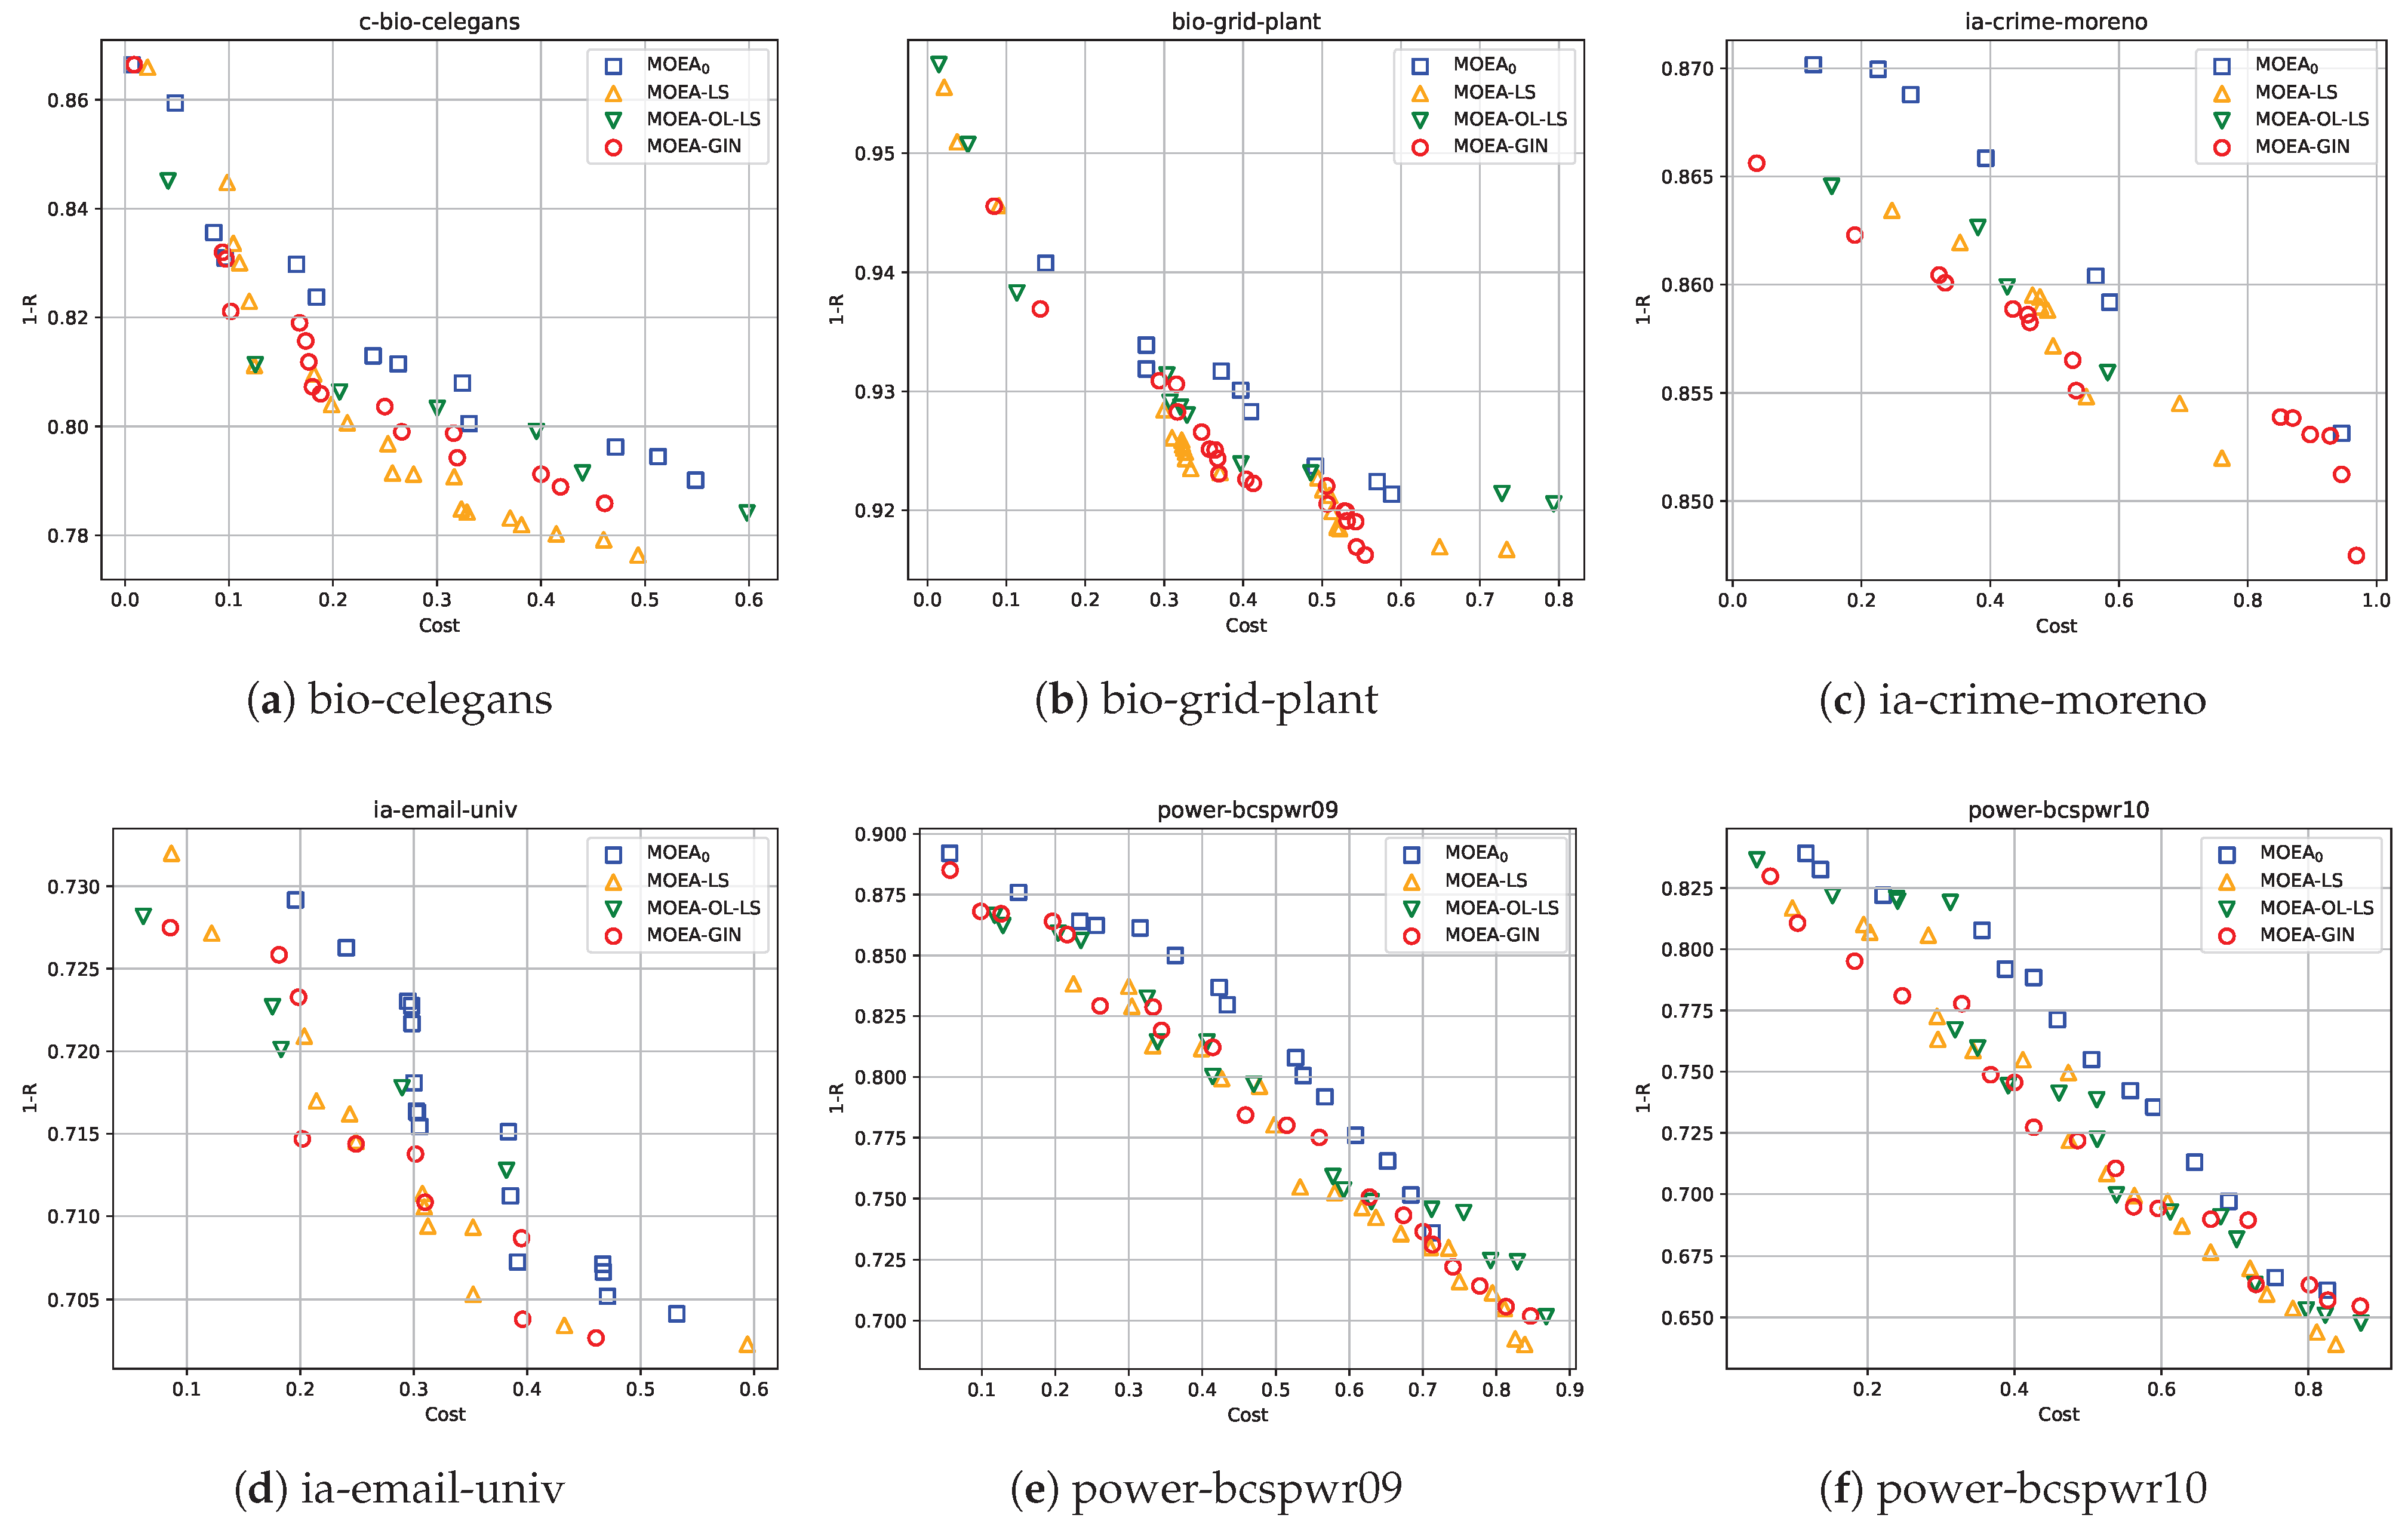
The experimental results in real-world networks are presented in Table 5. It can be observed that the performance trends are largely consistent with the results in synthetic networks. In most networks, MOEA-GIN achieves HV and Δ values comparable to or higher than those of other algorithms while significantly reducing the computational cost. For example, in the ia-crime-moreno and power-bcspwr09 networks, MOEA-GIN not only obtains the highest HV but also attains the shortest runtime, clearly demonstrating its effectiveness in both optimization quality and computational efficiency. In networks such as bio-grid-plant, power-bcspwr09, and power-bcspwr10, MOEA-GIN achieves the lowest Δ values, indicating that it can maintain good solution diversity while ensuring strong convergence. Although MOEA-LS performs slightly better than MOEA-GIN in some networks, its runtime is substantially longer. Notably, as the network size increases to 5000 nodes, the runtime of MOEA-LS grows to nearly seven times that of MOEA-GIN, further confirming the superior scalability and efficiency of MOEA-GIN.
In addition, Figure 4 illustrates the non-dominated solution sets obtained by the four algorithms in selected real-world networks, providing an intuitive comparison of their distributions and coverages in the objective space. It is evident that MOEA-GIN is capable of searching a set of solutions with both good convergence and diversity.
Overall, MOEA-GIN has shown high optimization efficiency and excellent robustness in both synthetic and real-world network experiments. In synthetic networks, MOEA-GIN effectively leverages surrogate models to adapt to diverse network structures and complexities, achieving efficient robustness optimization. Faced with more complex and changeable topological features in real networks, MOEA-GIN consistently maintains stable and superior performance, highlighting its strong generalization capability and practical applicability. In summary, MOEA-GIN achieves a favorable balance between solution quality and computational efficiency, providing an effective and scalable method for robustness optimization in large-scale complex networks.

5. Conclusions

To address the problem of robustness optimization in complex networks, this paper proposes a surrogate-assisted multiobjective evolutionary algorithm named MOEA-GIN. It leverages a graph isomorphism network to effectively capture both local and global structural features of complex networks and constructs a surrogate model to replace expensive real robustness evaluations. Guided by the surrogate model, MOEA-GIN employs specialized evolutionary operators to search for more robust network structures. Additionally, an online learning strategy is incorporated to continuously improve the predictive accuracy of the surrogate and the search capability of the algorithm. Extensive experiments on both synthetic and real-world networks demonstrate that MOEA-GIN achieves promising performances in terms of both optimization efficiency and solution quality.
Despite the promising efficiency and optimization quality of MOEA-GIN, there are still several issues worthy of further research. First, when faced with networks with significant structural differences, the generalization ability of the surrogate model may decrease, making it difficult for the algorithm to explore the optimal solution. Second, the sampling strategy used in the online learning mechanism has a substantial impact on the model’s performance—improper sampling may lead to overfitting and reduced robustness. In the future, we will focus on enhancing the predictive accuracy of the surrogate model for structurally diverse networks and developing more robust online learning strategies to further improve the overall performance of the algorithm.

Author Contributions

G.L. was responsible for the algorithm design, implementation, experiments, and manuscript writing. L.L. and G.C. supervised the research process and contributed to the manuscript revision and guidance. All authors have read and agreed to the published version of the manuscript.

Funding

This work was supported in part by the National Natural Science Foundation of China (under grants 62366010 and 62366009) and by the Guangxi Natural Science Foundation (under grants 2022GXNSFBA035658 and 2024GXNSFAA010374).

Data Availability Statement

The datasets generated and analyzed during the current study are available from the first author, Guangpeng Li, upon reasonable request.

Acknowledgments

The authors would like to thank the anonymous reviewers for their valuable comments and suggestions.

Conflicts of Interest

The authors declare no conflicts of interest.

Abbreviations

The following abbreviations are used in this manuscript:
PSPareto set
PFPareto front
HVHypervolume
EAEvolutionary algorithm
GNNsGraph neural networks
GINGraph isomorphism network
MSEMean squared error
ERErdős–Rényi random graphs
BABarabási–Albert scale-free networks
SWWatts–Strogatz small-world networks
LCCLargest connected component
MOPsMultiobjective optimization problems
MOEAsMultiobjective evolutionary algorithms
SDEShift-based diversity estimation

References

  1. Lou, Y.; Wang, L.; Chen, G. Structural Robustness of Complex Networks: A Survey of A Posteriori Measures [Feature]. IEEE Circuits Syst. Mag. 2023, 23, 12–35. [Google Scholar] [CrossRef]
  2. Grassia, M.; De Domenico, M.; Mangioni, G. Machine learning dismantling and early-warning signals of disintegration in complex systems. Nat. Commun. 2021, 12, 5190. [Google Scholar] [CrossRef]
  3. Ma, L.; Xu, L.; Fan, X.; Li, L.; Lin, Q.; Li, J.; Gong, M. Multifactorial evolutionary deep reinforcement learning for multitask node combinatorial optimization in complex networks. Inf. Sci. 2025, 702, 121913. [Google Scholar] [CrossRef]
  4. Zhou, D.; Hu, F.; Wang, S.; Chen, J. Power network robustness analysis based on electrical engineering and complex network theory. Phys. A Stat. Mech. Its Appl. 2021, 564, 125540. [Google Scholar] [CrossRef]
  5. Jiang, X.; Yan, H.; Li, B.; Zheng, S.; Huang, T.; Shi, P. Optimal Tracking of Networked Control Systems over the Fading Channel with Packet Loss. IEEE Trans. Autom. Control 2023, 69, 2652–2659. [Google Scholar] [CrossRef]
  6. Newman, M.E.J.; Girvan, M. Community structure in social and biological networks. Proc. Natl. Acad. Sci. USA 2002, 99, 7821–7826. [Google Scholar]
  7. Li, M.; Liu, J. A link clustering based memetic algorithm for overlapping community detection. Phys. A Stat. Mech. Its Appl. 2018, 503, 410–423. [Google Scholar] [CrossRef]
  8. Ulrik, B. On variants of shortest-path betweenness centrality and their generic computation. Soc. Netw. 2008, 30, 136–145. [Google Scholar]
  9. Malliaros, F.D.; Megalooikonomou, V.; Faloutsos, C. Fast robustness estimation in large social graphs: Communities and anomaly detection. In Proceedings of the 12th SIAM International Conference on Data Mining, SDM 2012, Anaheim, CA, USA, 26–28 April 2012; pp. 942–953. [Google Scholar] [CrossRef]
  10. Chan, H.; Akoglu, L. Optimizing network robustness by edge rewiring: A general framework. Data Min. Knowl. Discov. 2016, 30, 1395–1425. [Google Scholar] [CrossRef]
  11. Chen, L.; Xi, Y.; Dong, L.; Zhao, M.; Li, C.; Liu, X.; Cui, X. Identifying influential nodes in complex networks via Transformer. Inf. Process. Manag. 2024, 61, 103775. [Google Scholar] [CrossRef]
  12. Zhang, K.; Pu, Z.; Jin, C.; Zhou, Y.; Wang, Z. A novel semi-local centrality to identify influential nodes in complex networks by integrating multidimensional factors. Eng. Appl. Artif. Intell. 2025, 145, 110177. [Google Scholar] [CrossRef]
  13. Munikoti, S.; Das, L.; Natarajan, B. Scalable graph neural network-based framework for identifying critical nodes and links in complex networks. Neurocomputing 2022, 468, 211–221. [Google Scholar] [CrossRef]
  14. Wang, S.; Liu, J.; Jin, Y. Surrogate-Assisted Robust Optimization of Large-Scale Networks Based on Graph Embedding. IEEE Trans. Evol. Comput. 2020, 24, 735–749. [Google Scholar] [CrossRef]
  15. Wang, S.; Liu, J.; Jin, Y. A Computationally Efficient Evolutionary Algorithm for Multiobjective Network Robustness Optimization. IEEE Trans. Evol. Comput. 2021, 25, 419–432. [Google Scholar] [CrossRef]
  16. Tian, Y.; Wang, R.; Zhang, Y.; Zhang, X. Adaptive population sizing for multi-population based constrained multi-objective optimization. Neurocomputing 2025, 621, 129296. [Google Scholar] [CrossRef]
  17. Ming, F.; Gong, W.; Wang, L.; Jin, Y. Constrained Multi-Objective Optimization with Deep Reinforcement Learning Assisted Operator Selection. IEEE/CAA J. Autom. Sin. 2024, 11, 919–931. [Google Scholar] [CrossRef]
  18. Zeng, A.; Liu, W. Enhancing network robustness against malicious attacks. Phys. Rev. E-Stat. Nonlinear, Soft Matter Phys. 2012, 85, 066130. [Google Scholar] [CrossRef]
  19. Schneider, C.M.; Moreira, A.A.; Andrade, J.S.; Havlin, S.; Herrmann, H.J. Mitigation of malicious attacks on networks. Proc. Natl. Acad. Sci. USA 2011, 108, 3838–3841. [Google Scholar] [CrossRef]
  20. Liang, J.; Ban, X.; Yu, K.; Qu, B.; Qiao, K.; Yue, C.; Chen, K.; Tan, K.C. A Survey on Evolutionary Constrained Multiobjective Optimization. IEEE Trans. Evol. Comput. 2023, 27, 201–221. [Google Scholar] [CrossRef]
  21. Zhou, M.; Liu, J. A memetic algorithm for enhancing the robustness of scale-free networks against malicious attacks. Phys. A Stat. Mech. Its Appl. 2014, 410, 131–143. [Google Scholar] [CrossRef]
  22. Tang, X.; Liu, J.; Zhou, M. Enhancing network robustness against targeted and random attacks using a memetic algorithm. Europhys. Lett. 2015, 111, 38005. [Google Scholar] [CrossRef]
  23. Tang, X.; Liu, J.; Hao, X. Mitigate Cascading Failures on Networks using a Memetic Algorithm. Sci. Rep. 2016, 6, 38713. [Google Scholar] [CrossRef] [PubMed]
  24. Zhang, W.; Liu, J.; Li, L.; Liu, Y.; Wang, H. A knowledge driven two-stage co-evolutionary algorithm for constrained multi-objective optimization. Expert Syst. Appl. 2025, 274, 126908. [Google Scholar] [CrossRef]
  25. Wang, Y.; Hu, C.; Wu, X.; Zhou, Z.; Yan, X.; Gong, W. Utilizing feasible non-dominated solution information for constrained multi-objective optimization. Inf. Sci. 2025, 699, 121812. [Google Scholar] [CrossRef]
  26. Bai, W.; Dang, Q.; Wu, J.; Gao, X.; Zhang, G. Growing neural gas network based environment selection strategy for constrained multi-objective optimization. Inf. Sci. 2025, 698, 121774. [Google Scholar] [CrossRef]
  27. Sun, Y.; Zhou, X.; Yang, C.; Huang, T. Constrained multi-objective state transition algorithm via adaptive bidirectional coevolution. Expert Syst. Appl. 2025, 266, 126073. [Google Scholar] [CrossRef]
  28. Zhao, S.; Hao, X.; Chen, L.; Yu, T.; Li, X.; Liu, W. Two-stage bidirectional coevolutionary algorithm for constrained multi-objective optimization. Swarm Evol. Comput. 2025, 92, 101784. [Google Scholar] [CrossRef]
  29. Zhou, M.; Liu, J. A Two-Phase Multiobjective Evolutionary Algorithm for Enhancing the Robustness of Scale-Free Networks Against Multiple Malicious Attacks. IEEE Trans. Cybern. 2017, 47, 539–552. [Google Scholar] [CrossRef]
  30. Wang, S.; Liu, J. Designing comprehensively robust networks against intentional attacks and cascading failures. Inf. Sci. 2019, 478, 125–140. [Google Scholar] [CrossRef]
  31. Wang, S.; Liu, J. A Multi-Objective Evolutionary Algorithm for Promoting the Emergence of Cooperation and Controllable Robustness on Directed Networks. IEEE Trans. Netw. Sci. Eng. 2018, 5, 92–100. [Google Scholar] [CrossRef]
  32. Wu, H.; Chen, Q.; Chen, J.; Jin, Y.; Ding, J.; Zhang, X.; Chai, T. A Multi-Stage Expensive Constrained Multi-Objective Optimization Algorithm Based on Ensemble Infill Criterion. IEEE Trans. Evol. Comput. 2024; early access. [Google Scholar] [CrossRef]
  33. Wu, H.; Chen, Q.; Jin, Y.; Ding, J.; Chai, T. A Surrogate-Assisted Expensive Constrained Multi-Objective Optimization Algorithm Based on Adaptive Switching of Acquisition Functions. IEEE Trans. Emerg. Top. Comput. Intell. 2024, 8, 2050–2064. [Google Scholar] [CrossRef]
  34. Zhang, Y.; Jiang, H.; Tian, Y.; Ma, H.; Zhang, X. Multigranularity Surrogate Modeling for Evolutionary Multiobjective Optimization with Expensive Constraints. IEEE Trans. Neural Netw. Learn. Syst. 2024, 35, 2956–2968. [Google Scholar] [CrossRef] [PubMed]
  35. de Winter, R.; Bronkhorst, P.; van Stein, B.; Bäck, T. Constrained Multi-Objective Optimization with a Limited Budget of Function Evaluations. Memetic Comput. 2022, 14, 151–164. [Google Scholar] [CrossRef]
  36. Li, J.; Dong, H.; Wang, P.; Shen, J.; Qin, D. Multi-objective constrained black-box optimization algorithm based on feasible region localization and performance-improvement exploration. Appl. Soft Comput. 2023, 148, 110874. [Google Scholar] [CrossRef]
  37. Wauters, J.; Keane, A.; Degroote, J. Development of an adaptive infill criterion for constrained multi-objective asynchronous surrogate-based optimization. J. Glob. Optim. 2020, 78, 137–160. [Google Scholar] [CrossRef]
  38. Martínez-Frutos, J.; Herrero-Pérez, D. Kriging-based infill sampling criterion for constraint handling in multi-objective optimization. J. Glob. Optim. 2016, 64, 97–115. [Google Scholar] [CrossRef]
  39. Sun, J.; Zheng, W.; Zhang, Q.; Xu, Z. Graph Neural Network Encoding for Community Detection in Attribute Networks. IEEE Trans. Cybern. 2022, 52, 7791–7804. [Google Scholar] [CrossRef]
  40. Lou, Y.; He, Y.; Wang, L.; Chen, G. Predicting Network Controllability Robustness: A Convolutional Neural Network Approach. IEEE Trans. Cybern. 2022, 52, 4052–4063. [Google Scholar] [CrossRef]
  41. Lou, Y.; He, Y.; Wang, L.; Tsang, K.F.; Chen, G. Knowledge-Based Prediction of Network Controllability Robustness. IEEE Trans. Neural Netw. Learn. Syst. 2022, 33, 5739–5750. [Google Scholar] [CrossRef]
  42. Zonghan, W.; Shirui, P.; Fengwen, C.; Guodong, L.; Chengqi, Z.; Philip S, Y. A Comprehensive Survey on Graph Neural Networks. IEEE Trans. Neural Netw. Learn. Syst. 2021, 32, 4–24. [Google Scholar]
  43. Zhang, Y.; Li, J.; Ding, J.; Li, X. A Graph Transformer-Driven Approach for Network Robustness Learning. IEEE Trans. Circuits Syst. I Regul. Pap. 2024, 71, 1992–2005. [Google Scholar] [CrossRef]
  44. Holme, P.; Kim, B.J.; Yoon, C.N.; Han, S.K. Attack vulnerability of complex networks. Phys. Rev. E-Stat. Physics, Plasmas, Fluids, Relat. Interdiscip. Top. 2002, 65, 14. [Google Scholar] [CrossRef] [PubMed]
  45. Albert, R.; Jeong, H.; Barabási, A.L. Error and attack tolerance of complex networks. Nature 2000, 406, 378–382. [Google Scholar] [CrossRef] [PubMed]
  46. Barabási, A.L.; Albert, R. Emergence of scaling in random networks. In The Structure and Dynamics of Networks; Princeton University Press: Princeton, NJ, USA, 2011; Volume 9781400841356, pp. 349–352. [Google Scholar] [CrossRef]
  47. Shi, C.; Peng, Y.; Zhuo, Y.; Tang, J.; Long, K. A new way to improve the robustness of complex communication networks by allocating redundancy links. Phys. Scr. 2012, 85, 035803. [Google Scholar] [CrossRef]
  48. Kůdela, J.; Dobrovský, L. Performance Comparison of Surrogate-Assisted Evolutionary Algorithms on Computational Fluid Dynamics Problems. In Lecture Notes in Computer Science (Including Subseries Lecture Notes in Artificial Intelligence and Lecture Notes in Bioinformatics); Springer Nature: Cham, Switzerland, 2024; Volume 15149, pp. 303–321. [Google Scholar] [CrossRef]
  49. Homberg, T.; Mostaghim, S.; Hiwa, S.; Hiroyasu, T. Optimized Drug Design using Multi-Objective Evolutionary Algorithms with SELFIES. In Proceedings of the 2024 IEEE Congress on Evolutionary Computation, CEC 2024, Yokohama, Japan, 30 June–5 July 2024. [Google Scholar] [CrossRef]
  50. Wu, C.; Lou, Y.; Li, J.; Wang, L.; Xie, S.; Chen, G. A Multitask Network Robustness Analysis System Based on the Graph Isomorphism Network. IEEE Trans. Cybern. 2024, 54, 6630–6642. [Google Scholar] [CrossRef]
  51. Cheng, G.H.; Gary Wang, G.; Hwang, Y.M. Multi-Objective Optimization for High-Dimensional Expensively Constrained Black-Box Problems. J. Mech. Des. 2021, 143, 111704. [Google Scholar] [CrossRef]
  52. Yang, Z.; Qiu, H.; Gao, L.; Chen, L.; Liu, J. Surrogate-assisted MOEA/D for expensive constrained multi-objective optimization. Inf. Sci. 2023, 639, 119016. [Google Scholar] [CrossRef]
  53. Xu, K.; Jegelka, S.; Hu, W.; Leskovec, J. How powerful are graph neural networks? In Proceedings of the 7th International Conference on Learning Representations, ICLR 2019, New Orleans, LA, USA, 6–9 May 2019.
  54. Hamilton, W.L.; Ying, R.; Leskovec, J. Inductive representation learning on large graphs. Adv. Neural Inf. Process. Syst. 2017, 2017, 1025–1035. [Google Scholar]
  55. Veličkovi’veličkovi’c, P.; Cucurull, G.; Casanova, A.; Romero, A.; Lì, P.; Bengio, Y.; Veličković, P.; Casanova, A.; Liò, P.; Cucurull, G.; et al. Graph attention networks. In Proceedings of the 6th International Conference on Learning Representations, ICLR 2018—Conference Track Proceedings, Vancouver, BC, Canada, 30 April–3 May 2018; pp. 1–12. [Google Scholar]
  56. Xu, K.; Li, C.; Tian, Y.; Sonobe, T.; Kawarabayashi, K.I.; Jegelka, S. Representation learning on graphs with jumping knowledge networks. In Proceedings of the 35th International Conference on Machine Learning, ICML 2018, Stockholm, Sweden, 10–15 July 2018; Volume 12, pp. 8676–8685. [Google Scholar]
  57. Zhang, M.; Cui, Z.; Neumann, M.; Chen, Y. An end-to-end deep learning architecture for graph classification. In Proceedings of the 32nd AAAI Conference on Artificial Intelligence, AAAI 2018, New Orleans, LA, USA, 2–7 February 2018; pp. 4438–4445. [Google Scholar] [CrossRef]
  58. Deb, K.; Pratap, A.; Agarwal, S.; Meyarivan, T. A fast and elitist multiobjective genetic algorithm: NSGA-II. IEEE Trans. Evol. Comput. 2002, 6, 182–197. [Google Scholar] [CrossRef]
  59. Li, L.; Li, G.; Chang, L. On self-adaptive stochastic ranking in decomposition many-objective evolutionary optimization. Neurocomputing 2022, 489, 547–557. [Google Scholar] [CrossRef]
  60. Erdos, P.; Renyi, A. On the strength of connectedness of a random graph. Acta Math. Hung. 1961, 12, 261–267. [Google Scholar] [CrossRef]
  61. Watts, D.J.; Strogatz, S.H. Collective dynamics of ᅵsmall-worldᅵ networks. Nature 1998, 393, 440–442. [Google Scholar] [CrossRef] [PubMed]
  62. Sun, J.; Yao, W.; Jiang, T.; Chen, X. A multi-objective memetic algorithm for automatic adversarial attack optimization design. Neurocomputing 2023, 547, 126318. [Google Scholar] [CrossRef]
  63. Tian, Y.; Pan, J.; Yang, S.; Zhang, X.; He, S.; Jin, Y. Imperceptible and Sparse Adversarial Attacks via a Dual-Population-Based Constrained Evolutionary Algorithm. IEEE Trans. Artif. Intell. 2023, 4, 268–281. [Google Scholar] [CrossRef]
  64. Reis, M.J.C.S. Symmetry-Guided Surrogate-Assisted NSGA-II for Multi-Objective Optimization of Renewable Energy Systems. Symmetry 2025, 17, 1367. [Google Scholar] [CrossRef]
  65. Haddad, A.; Tlili, T.; Dahmani, N.; Krichen, S. Integrating NSGA-II and Q-learning for Solving the Multi-objective Electric Vehicle Routing Problem with Battery Swapping Stations. Int. J. Intell. Transp. Syst. Res. 2025, 23, 840–856. [Google Scholar] [CrossRef]
  66. Zhang, P.; Qian, Y.; Qian, Q. Multi-objective optimization for materials design with improved NSGA-II. Mater. Today Commun. 2021, 28, 102709. [Google Scholar] [CrossRef]
  67. Qi, Y.; Hou, Z.; Li, H.; Huang, J.; Li, X. A decomposition based memetic algorithm for multi-objective vehicle routing problem with time windows. Comput. Oper. Res. 2015, 62, 61–77. [Google Scholar] [CrossRef]
  68. Huang, J.; Wu, R.; Li, J. Efficient adaptive robustness optimization algorithm for complex networks. J. Comput. Appl. 2024, 44, 3530–3539. [Google Scholar]
  69. Bader, J.; Zitzler, E. HypE: An Algorithm for Fast Hypervolume-Based Many-Objective Optimization. Evol. Comput. 2011, 19, 45–76. [Google Scholar] [CrossRef]
  70. Collette, Y.; Siarry, P. Three new metrics to measure the convergence of metaheuristics towards the Pareto frontier and the aesthetic of a set of solutions in biobjective optimization. Comput. Oper. Res. 2005, 32, 773–792. [Google Scholar] [CrossRef]
  71. Lu, X.; Liu, Z.; Fan, Y.; Zhou, J. A Graph Convolutional Network Approach for Predicting Network Controllability Robustness. In Proceedings of the 2023 35th Chinese Control and Decision Conference (CCDC), Yichang, China, 20–22 May 2023; pp. 3544–3547. [Google Scholar] [CrossRef]
  72. Lou, Y.; Wu, R.; Li, J.; Wang, L.; Li, X.; Chen, G. A Learning Convolutional Neural Network Approach for Network Robustness Prediction. IEEE Trans. Cybern. 2023, 53, 4531–4544. [Google Scholar] [CrossRef]
  73. Lou, Y.; Wu, R.; Li, J.; Wang, L.; Chen, G. A Convolutional Neural Network Approach to Predicting Network Connectedness Robustness. IEEE Trans. Netw. Sci. Eng. 2021, 8, 3209–3219. [Google Scholar] [CrossRef]
  74. Rossi, R.A.; Ahmed, N.K. The network data repository with interactive graph analytics and visualization. In Proceedings of the Twenty-Ninth AAAI Conference on Artificial Intelligence, AAAI’15, Austin, TX, USA, 25–30 January 2015; AAAI Press: Washington, DC, USA, 2015; pp. 4292–4293. [Google Scholar]
Figure 1. The overall workflow of the proposed MOEA-GIN.
Algorithms 18 00666 g001
Figure 2. The framework of the surrogate model GIN, where h i ( l ) is the representation of node i in the lth layer ( l = 0 , 1 , 2 , 3 , 4 ), and the initial representation is the degree [ k ] .
Algorithms 18 00666 g002
Figure 3. The non-dominated solutions searched by four algorithms in synthetic networks.
Algorithms 18 00666 g003aAlgorithms 18 00666 g003b
Figure 4. The non-dominated solutions searched by four algorithms in real-world networks.
Algorithms 18 00666 g004
Table 1. Parameter settings of the proposed MOEA-GIN.
ParameterDescriptionValue
nThe size of the dataset200
P O P The size of the population20
t m a x The maximum number of evolutionary generations100
p c The probability of performing a crossover 0.6
p m The probability of performing a mutation 0.4
p l s The probability of performing a local search 0.5
M a x R e The maximum number of rewiring executions in the local search20
KThe number of sampled solutions2
TThe interval for updating the surrogate model10
R u n N u m The number of runs for each algorithm10
Table 2. Prediction errors, inference times, and computational times of the surrogate models in various synthetic networks.
NetworkAlgorithmPrediction ErrorInference Time (s)True Evaluation Time (s)
BA200GE_SU0.0162 ± (0.0015)1.463.18
CNN0.0054 ± (0.0036)1.63
GCN0.0106 ± (0.0015)0.69
GIN0.0057 ± (0.0016)0.37
BA500GE_SU0.0190 ± (0.0017)2.9618.36
CNN0.0069 ± (0.0045)6.50
GCN0.0085 ± (0.0018)0.73
GIN0.0050 ± (0.0015)0.39
BA1000GE_SU0.0346 ± (0.0038)7.2073.20
CNN0.0163 ± (0.0017)15.75
GCN0.0074 ± (0.0028)0.79
GIN0.0043 ± (0.0012)0.44
BA2000GE_SU0.0344 ± (0.0031)16.37289.41
CNN0.0132 ± (0.0021)45.89
GCN0.0086 ± (0.0019)0.88
GIN0.0057 ± (0.0022)0.51
ER200GE_SU0.0097 ± (0.0020)1.373.06
CNN0.0099 ± (0.0015)1.55
GCN0.0075 ± (0.0012)0.70
GIN0.0056 ± (0.0013)0.39
ER500GE_SU0.0142 ± (0.0013)3.0218.90
CNN0.0090 ± (0.0020)6.59
GCN0.0075 ± (0.0008)0.74
GIN0.0048 ± (0.0015)0.41
ER1000GE_SU0.0391 ± (0.0035)7.2174.87
CNN0.0137 ± (0.0014)16.75
GCN0.0046 ± (0.0025)0.76
GIN0.0053 ± (0.0012)0.44
ER2000GE_SU0.0239 ± (0.0022)15.68292.83
CNN0.0160 ± (0.0034)46.83
GCN0.0121 ± (0.0025)0.85
GIN0.0050 ± (0.0010)0.53
SW200GE_SU0.0161 ± (0.0024)1.433.07
CNN0.0110 ± (0.0011)1.68
GCN0.0055 ± (0.0018)0.70
GIN0.0092 ± (0.0010)0.38
SW500GE_SU0.0124 ± (0.0012)2.8718.28
CNN0.0101 ± (0.0010)7.64
GCN0.0063 ± (0.0010)0.73
GIN0.0085 ± (0.0009)0.40
SW1000GE_SU0.0289 ± (0.0026)7.1273.62
CNN0.0124 ± (0.0012)16.75
GCN0.0064 ± (0.0027)0.79
GIN0.0051 ± (0.0019)0.43
SW2000GE_SU0.0261 ± (0.0089)16.25287.05
CNN0.0184 ± (0.0024)46.04
GCN0.0086 ± (0.0017)0.91
GIN0.0036 ± (0.0014)0.51
Table 3. Experimental results in synthetic networks.
NetworkAlgorithmHVΔRuntime (s)/ 10 3
BA500MOEA00.3970 ± 0.0120 (−)0.0256 ± 0.0031 (≈)1.73
MOEA-LS0.4404 ± 0.0296 (−)0.0323 ± 0.0042 (≈)6.24
MOEA-OL-LS0.4337 ± 0.0184 (−)0.0530 ± 0.0064 (−)2.31
MOEA-GIN0.4573 ± 0.01170.0243 ± 0.00272.39
ER500MOEA00.3453 ± 0.0133 (−)0.0376 ± 0.0048 (+)1.48
MOEA-LS0.3712 ± 0.0096 (≈)0.0255 ± 0.0033 (+)6.26
MOEA-OL-LS0.3569 ± 0.0124 (−)0.0352 ± 0.0041 (≈)1.98
MOEA-GIN0.3798 ± 0.00850.0518 ± 0.00561.79
SW500MOEA00.4240 ± 0.0133 (−)0.0667 ± 0.0075 (−)1.44
MOEA-LS0.4852 ± 0.0096 (+)0.0464 ± 0.0049 (−)5.74
MOEA-OL-LS0.4347 ± 0.0224 (−)0.0457 ± 0.0053 (−)2.64
MOEA-GIN0.4560 ± 0.01150.0359 ± 0.00421.81
BA1000MOEA00.3960 ± 0.0206 (−)0.0104 ± 0.0016 (≈)6.48
MOEA-LS0.4332 ± 0.0170 (≈)0.0323 ± 0.0039 (−)22.71
MOEA-OL-LS0.4129 ± 0.0154 (−)0.0966 ± 0.0105 (−)7.11
MOEA-GIN0.4363 ± 0.01920.0257 ± 0.00295.63
ER1000MOEA00.4228 ± 0.0225 (−)0.1704 ± 0.0213 (−)5.86
MOEA-LS0.4589 ± 0.0157 (≈)0.0838 ± 0.0091 (−)22.93
MOEA-OL-LS0.4353 ± 0.0194 (−)0.0807 ± 0.0094 (−)5.17
MOEA-GIN0.4606 ± 0.01060.0626 ± 0.00714.83
SW1000MOEA00.4038 ± 0.0168 (−)0.0917 ± 0.0098 (−)5.73
MOEA-LS0.4532 ± 0.0153 (≈)0.0248 ± 0.0028 (+)21.78
MOEA-OL-LS0.4475 ± 0.0173 (−)0.0394 ± 0.0046 (≈)5.17
MOEA-GIN0.4568 ± 0.01050.0440 ± 0.00515.03
BA2000MOEA00.3973 ± 0.0138 (−)0.0216 ± 0.0018 (≈)29.92
MOEA-LS0.4151 ± 0.0092 (−)0.0252 ± 0.0017 (≈)94.77
MOEA-OL-LS0.3844 ± 0.0184 (−)0.0376 ± 0.0042 (−)25.12
MOEA-GIN0.4262 ± 0.00940.0157 ± 0.001619.05
ER2000MOEA00.3285 ± 0.0125 (−)0.0411 ± 0.0052 (≈)23.76
MOEA-LS0.3663 ± 0.0085 (+)0.0419 ± 0.0046 (≈)90.83
MOEA-OL-LS0.3475 ± 0.0137 (−)0.0189 ± 0.0021 (+)18.36
MOEA-GIN0.3570 ± 0.01290.0493 ± 0.005415.06
SW2000MOEA00.4240 ± 0.0131 (−)0.0412 ± 0.0047 (−)22.68
MOEA-LS0.4545 ± 0.0108 (≈)0.0598 ± 0.0062 (−)87.46
MOEA-OL-LS0.4332 ± 0.0118 (−)0.0855 ± 0.0093 (−)16.56
MOEA-GIN0.4504 ± 0.00940.0361 ± 0.004014.52
Table 4. Structural characteristics of selected real-world networks.
Network | V | | E | d max d avg K avg
bio-celegans453202523780.12
bio-grid-plant1745619614270.12
ia-crime-moreno82914762530.01
ia-email-univ113354517190.22
power-bcspwr09172341171420.08
power-bcspwr10530013,5711330.09
Table 5. Experimental results in real-world networks.
NetworkAlgorithmHVΔRuntime (s)/ 10 3
bio-celegansMOEA00.3063 ± 0.0210 (−)0.0126 ± 0.0025 (+)1.44
MOEA-LS0.3347 ± 0.0086 (≈)0.0197 ± 0.0039 (≈)4.75
MOEA-OL-LS0.3163 ± 0.0104 (−)0.0364 ± 0.0072 (−)2.25
MOEA-GIN0.3295 ± 0.00970.0274 ± 0.00541.53
bio-grid-plantMOEA00.1574 ± 0.0170 (−)0.0414 ± 0.0082 (−)17.71
MOEA-LS0.1875 ± 0.0093 (≈)0.0261 ± 0.0052 (≈)66.88
MOEA-OL-LS0.1765 ± 0.0136 (≈)0.0303 ± 0.0061 (−)10.32
MOEA-GIN0.1798 ± 0.01520.0190 ± 0.00388.34
ia-crime-morenoMOEA00.2080 ± 0.0233 (−)0.1118 ± 0.0224 (−)4.06
MOEA-LS0.2352 ± 0.0101 (−)0.0403 ± 0.0061 (≈)16.67
MOEA-OL-LS0.2280 ± 0.0165 (−)0.0771 ± 0.0154 (−)3.92
MOEA-GIN0.2581 ± 0.01290.0448 ± 0.00903.60
ia-email-univMOEA00.3542 ± 0.0152 (−)0.0195 ± 0.0039 (+)8.79
MOEA-LS0.3979 ± 0.0061 (≈)0.0443 ± 0.0070 (−)32.00
MOEA-OL-LS0.3680 ± 0.0143 (−)0.0470 ± 0.0094 (−)9.58
MOEA-GIN0.3967 ± 0.01090.0296 ± 0.00598.33
power-bcspwr09MOEA00.2973 ± 0.0110 (−)0.0272 ± 0.0054 (≈)18.56
MOEA-LS0.3303 ± 0.0108 (≈)0.0150 ± 0.0031 (≈)60.80
MOEA-OL-LS0.3208 ± 0.0080 (−)0.0169 ± 0.0034 (≈)19.28
MOEA-GIN0.3385 ± 0.00920.0145 ± 0.002914.02
power-bcspwr10MOEA00.3504 ± 0.0090 (−)0.0194 ± 0.0039 (≈)151.81
MOEA-LS0.3951 ± 0.0062 (≈)0.0212± 0.0026 (−)539.52
MOEA-OL-LS0.3803 ± 0.0113 (−)0.0239 ± 0.0048 (−)83.10
MOEA-GIN0.3950 ± 0.01050.0154 ± 0.003171.40
Disclaimer/Publisher’s Note: The statements, opinions and data contained in all publications are solely those of the individual author(s) and contributor(s) and not of MDPI and/or the editor(s). MDPI and/or the editor(s) disclaim responsibility for any injury to people or property resulting from any ideas, methods, instructions or products referred to in the content.