Article

High-Fidelity Steganography: A Covert Parity Bit Model-Based Approach

1
College of Computing & Informatics, University of Sharjah, Sharjah P.O. Box 27272, United Arab Emirates
2
Research Institute of Sciences & Engineering (RISE), University of Sharjah, Sharjah P.O. Box 27272, United Arab Emirates
*
Author to whom correspondence should be addressed.
Algorithms 2024, 17(8), 328; https://doi.org/10.3390/a17080328
Submission received: 14 June 2024 / Revised: 17 July 2024 / Accepted: 22 July 2024 / Published: 27 July 2024

Abstract

:
The Discrete Cosine Transform (DCT) is fundamental to high-capacity data hiding schemes due to its ability to condense signals into a few significant coefficients while leaving many high-frequency coefficients relatively insignificant. These high-frequency coefficients are often replaced with secret data, allowing for the embedding of many secret bits while maintaining acceptable stego signal quality. However, because high-frequency components still affect the stego signal’s quality, preserving their structure is beneficial. This work introduces a method that maintains the structure of high-frequency DCT components during embedding through polynomial modeling. A scaled-down version of the secret signal is added to or subtracted from the polynomial-generated signal to minimize the error between the cover signal and the polynomial-generated signal. As a result, the stego image retains a structure similar to the original cover image. Experimental results demonstrate that this scheme improves the quality and security of the stego image compared to current methods. Notably, the technique’s robustness is confirmed by its resistance to detection by deep learning methods, as a Convolutional Neural Network (CNN) could not distinguish between the cover and stego images.

1. Introduction

Traditional communications such as the Public Switched Telephone Network (PSTN) and classical mail services are based on having dedicated exclusive connections between the sender and the receiver. These exclusive connections have powered traditional communication systems with an acceptable level of security while limiting the number of security threats. However, with large population growth around the world, communications that rely on dedicated connections are becoming impractical, and there are difficulties in managing the huge demand for communication services.
The invention of the internet has reshaped the communications field and introduced various technologies and services. Based on recent numbers provided by Statista, an online portal for statistics, in 2023 there were 5.3 billion internet users worldwide, which amounted to 65.7 percent of the global population (https://www.statista.com/statistics/617136/digital-population-worldwide/ (accessed on 21 July 2024)). This huge reliance on internet services has created security concerns, as the internet is a public shared global network messages are highly vulnerable to both passive and active security attacks.
To overcome security problems around messaging over public networks, security mechanisms such as encryption and data hiding techniques have become top research topics in recent years [1,2,3]. Encryption is a method of securing data by converting it into an unreadable format using an algorithm and a key [4]. The unrecognizable format of the transmitted messages makes it difficult for an attacker to identify the secret data. However, the unrecognizable format of the data also reveals the secrecy of the data, potentially triggering suspicion that the message may be a secret message, prompting an attacker to perform active attack methods such as delaying or tampering. As an alternative, data hiding techniques operate by hiding the secret message in an innocent cover medium to obtain a so-called “stego” medium. The generated stego medium should be very similar visually or statistically identical to the cover medium in order to prevent triggering suspicion that the sent message may contain secret communication.
The field of data hiding has seen increasing attention over the past few decades due to the growing transmission of confidential messages via public shared media such as wireless networks and the internet [5]. A popular research topic in the data hiding field is to propose data hiding schemes that improve and compensate for the contrasting attributes of stego quality (imperceptibility), robustness, and hiding capacity [6,7,8].
The security attribute is concerned with the ability of an attacker to detect the availability of a hidden message in a given signal. The stego quality refers to the level of resemblance between the stego and the cover signal. Robustness, on the other hand, is the ability to tolerate active attacks on stego signals by being able to retrieve the embedded data even after the active attack. The fourth attribute, the hiding capacity, is the ratio of the number of secret bits embedded to the total size of the original hosting signal.
Steganography and watermarking are two examples of data hiding techniques [9,10,11]. The difference between the techniques is in the final objective to be achieved. In steganography, the intent is to send confidential data between two entities; on the other hand, watermarking techniques are used to provide data integrity or to protect copyright. Therefore, steganography techniques concentrate on the capacity–imperceptibility trade-off, and aim to produce schemes that have the ability to embed a large number of bits while obtaining enhanced quality of the stego signal. Because watermarking techniques aim to provide data integrity or protect the copyright of data, such schemes instead tend to focus more on the robustness attribute.
A widely used method in digital steganography involves embedding confidential bits within some selected frequency components of the hosting signal [12,13,14]. This method converts the signal to the frequency domain by utilizing a frequency transform technique such as the Discrete Wavelet Transform (DWT), Discrete Cosine Transform (DCT), or Discrete Fourier Transform (DFT). Typically, data are hidden in the high-frequency coefficients, as the human perceptual system is more tolerant of noise in these regions. For instance, edges in a digital image are considered high-frequency components, and noise within these edges is less likely to be detected by the human visual system [5].
The DCT transform is widely recognized as a preferred frequency transform method for steganography due to its strong energy compaction properties, which allow it to efficiently concentrate a signal’s energy into a few significant coefficients. This characteristic enables the DCT to express the essential components of a signal with only a few coefficients, leaving a large number of less significant coefficients that can be exploited for embedding secret data with minimal impact on the overall signal quality. By transforming an image from the spatial domain into the frequency domain, the DCT highlights the critical low-frequency components while relegating the high-frequency components to smaller and less perceptible values. These high-frequency coefficients, which are less critical to the visual perception of the image, can be modified to incorporate hidden data without causing noticeable changes in the image’s appearance. This makes DCT-based steganography particularly effective, as it allows for high-capacity data hiding while enhancing the quality of the stego image. The ability to use insignificant coefficients for data hiding ensures that the visual quality of the stego image remains high, making DCT an ideal method for secure and undetectable data embedding that balances capacity and quality. Another field in which the DCT transform is adopted is image super-resolution construction. DCT-based methods in image super-resolution construction exploit this transform’s ability to separate an image into different frequency components, allowing for targeted enhancement of high-frequency details such as edges and textures. This approach benefits from the DCT’s sparse representation, where most of the significant information is concentrated in a few coefficients, leading to improved image clarity and sharpness [15].
Compensating between capacity and stego quality has been a frequently studied topic in the steganography field over the past few years [16,17]. Several papers have proposed new schemes that possess the ability to overcome the trade-off problem by exploiting the strong compaction property of the DCT and replacing the substantial amount of insignificant DCT coefficients with scaled-down secret pixels [5,16,18,19]. On the other hand, there is a positive relationship between the security attribute and the stego quality attribute, as enhancing the quality of the stego signal and increasing the level of similarity between the stego signal and the cover signal improves the security level of the scheme. Therefore, another trade-off problem is revealed between security and capacity attributes: the higher the capacity, the lower the stego quality. and the lower the security level of the resulting scheme [20].
Model-based schemes are a recent DCT-based hiding approach. These schemes share the idea of maintaining the structure of the high-frequency region of the DCT domain rather than relying on the simple method of direct secret replacement adopted by recent DCT schemes. This new DCT model-based approach tends to model the less-significant DCT components and generate a new hosting signal from the generated model. Next, a scaled-down version of the secret signal is superimposed onto the newly generated hosting signal to produce the final stego signal. The objective of the superimposing process is to achieve a stego signal that is close to or identical with the cover signal, as superimposing a low-scaled signal on a larger-scale signal generates a signal with structure analogous to the larger-scale signal.
This paper proposes a new DCT model-based image hiding scheme. The proposed scheme is based on the observation that a superposition process which adds the secret pixels to the polynomial signal to generate the stego signal is not the optimum solution to decrease the difference between the original cover signal and the stego signal. Instead, the proposed scheme adaptively chooses to add or subtract the secret pixels to or from the modeled pixels in order to match the original DCT coefficients of the cover signal. This procedure maximizes the similarity between the stego signal and the original cover signal, resulting in enhanced stego quality. This is evident from the failure of a deep learning classifier using a Convolutional Neural Network (CNN) model to differentiate between the cover images and stego images produced using the proposed technique. The CNN is not part of the proposed technique. The CNN is basically used just to test the performance of the proposed technique. The objective of the CNN is used to perform a steganalysis attack on stego images produced using the proposed technique; in other words, the objective of the CNN is to detect the presence of secret data in the stego image. This is usually accomplished by training a CNN to classify stego and cover images of a targeted steganography algorithm. In the end, if the CNN is not able to classify the images, then the steganography technique is considered safe, as the CNN is not able to differentiate between the cover and stego images. This implies that the stego image is at least semi-identical to the cover image and that the hiding process did not introduce very many artifacts into the image.
The contributions of the paper can be summarized as follows:
1.
A new data hiding strategy based on DCT modeling maximizes the similarity between the stego signal and the original cover signal, thereby improving the quality of the stego signal.
2.
A new DCT modeling strategy is proposed that is suitable for steganography techniques. The proposed modeling phase adopts a polynomial fitting strategy to generate a signal approximating the cover signal. Unlike other recent approaches such as [21,22] which superimpose the secret signal over the modeled signal to produce the stego signal, the proposed strategy adaptively adds or subtracts secret samples to or from the modeled pixels to match the original DCT coefficients of the cover signal based on the error sign between the modeled signal and the cover signal. This adaptive approach maximizes the similarity between the stego and original cover signals, which enhances the imperceptibility of the stego image.
3.
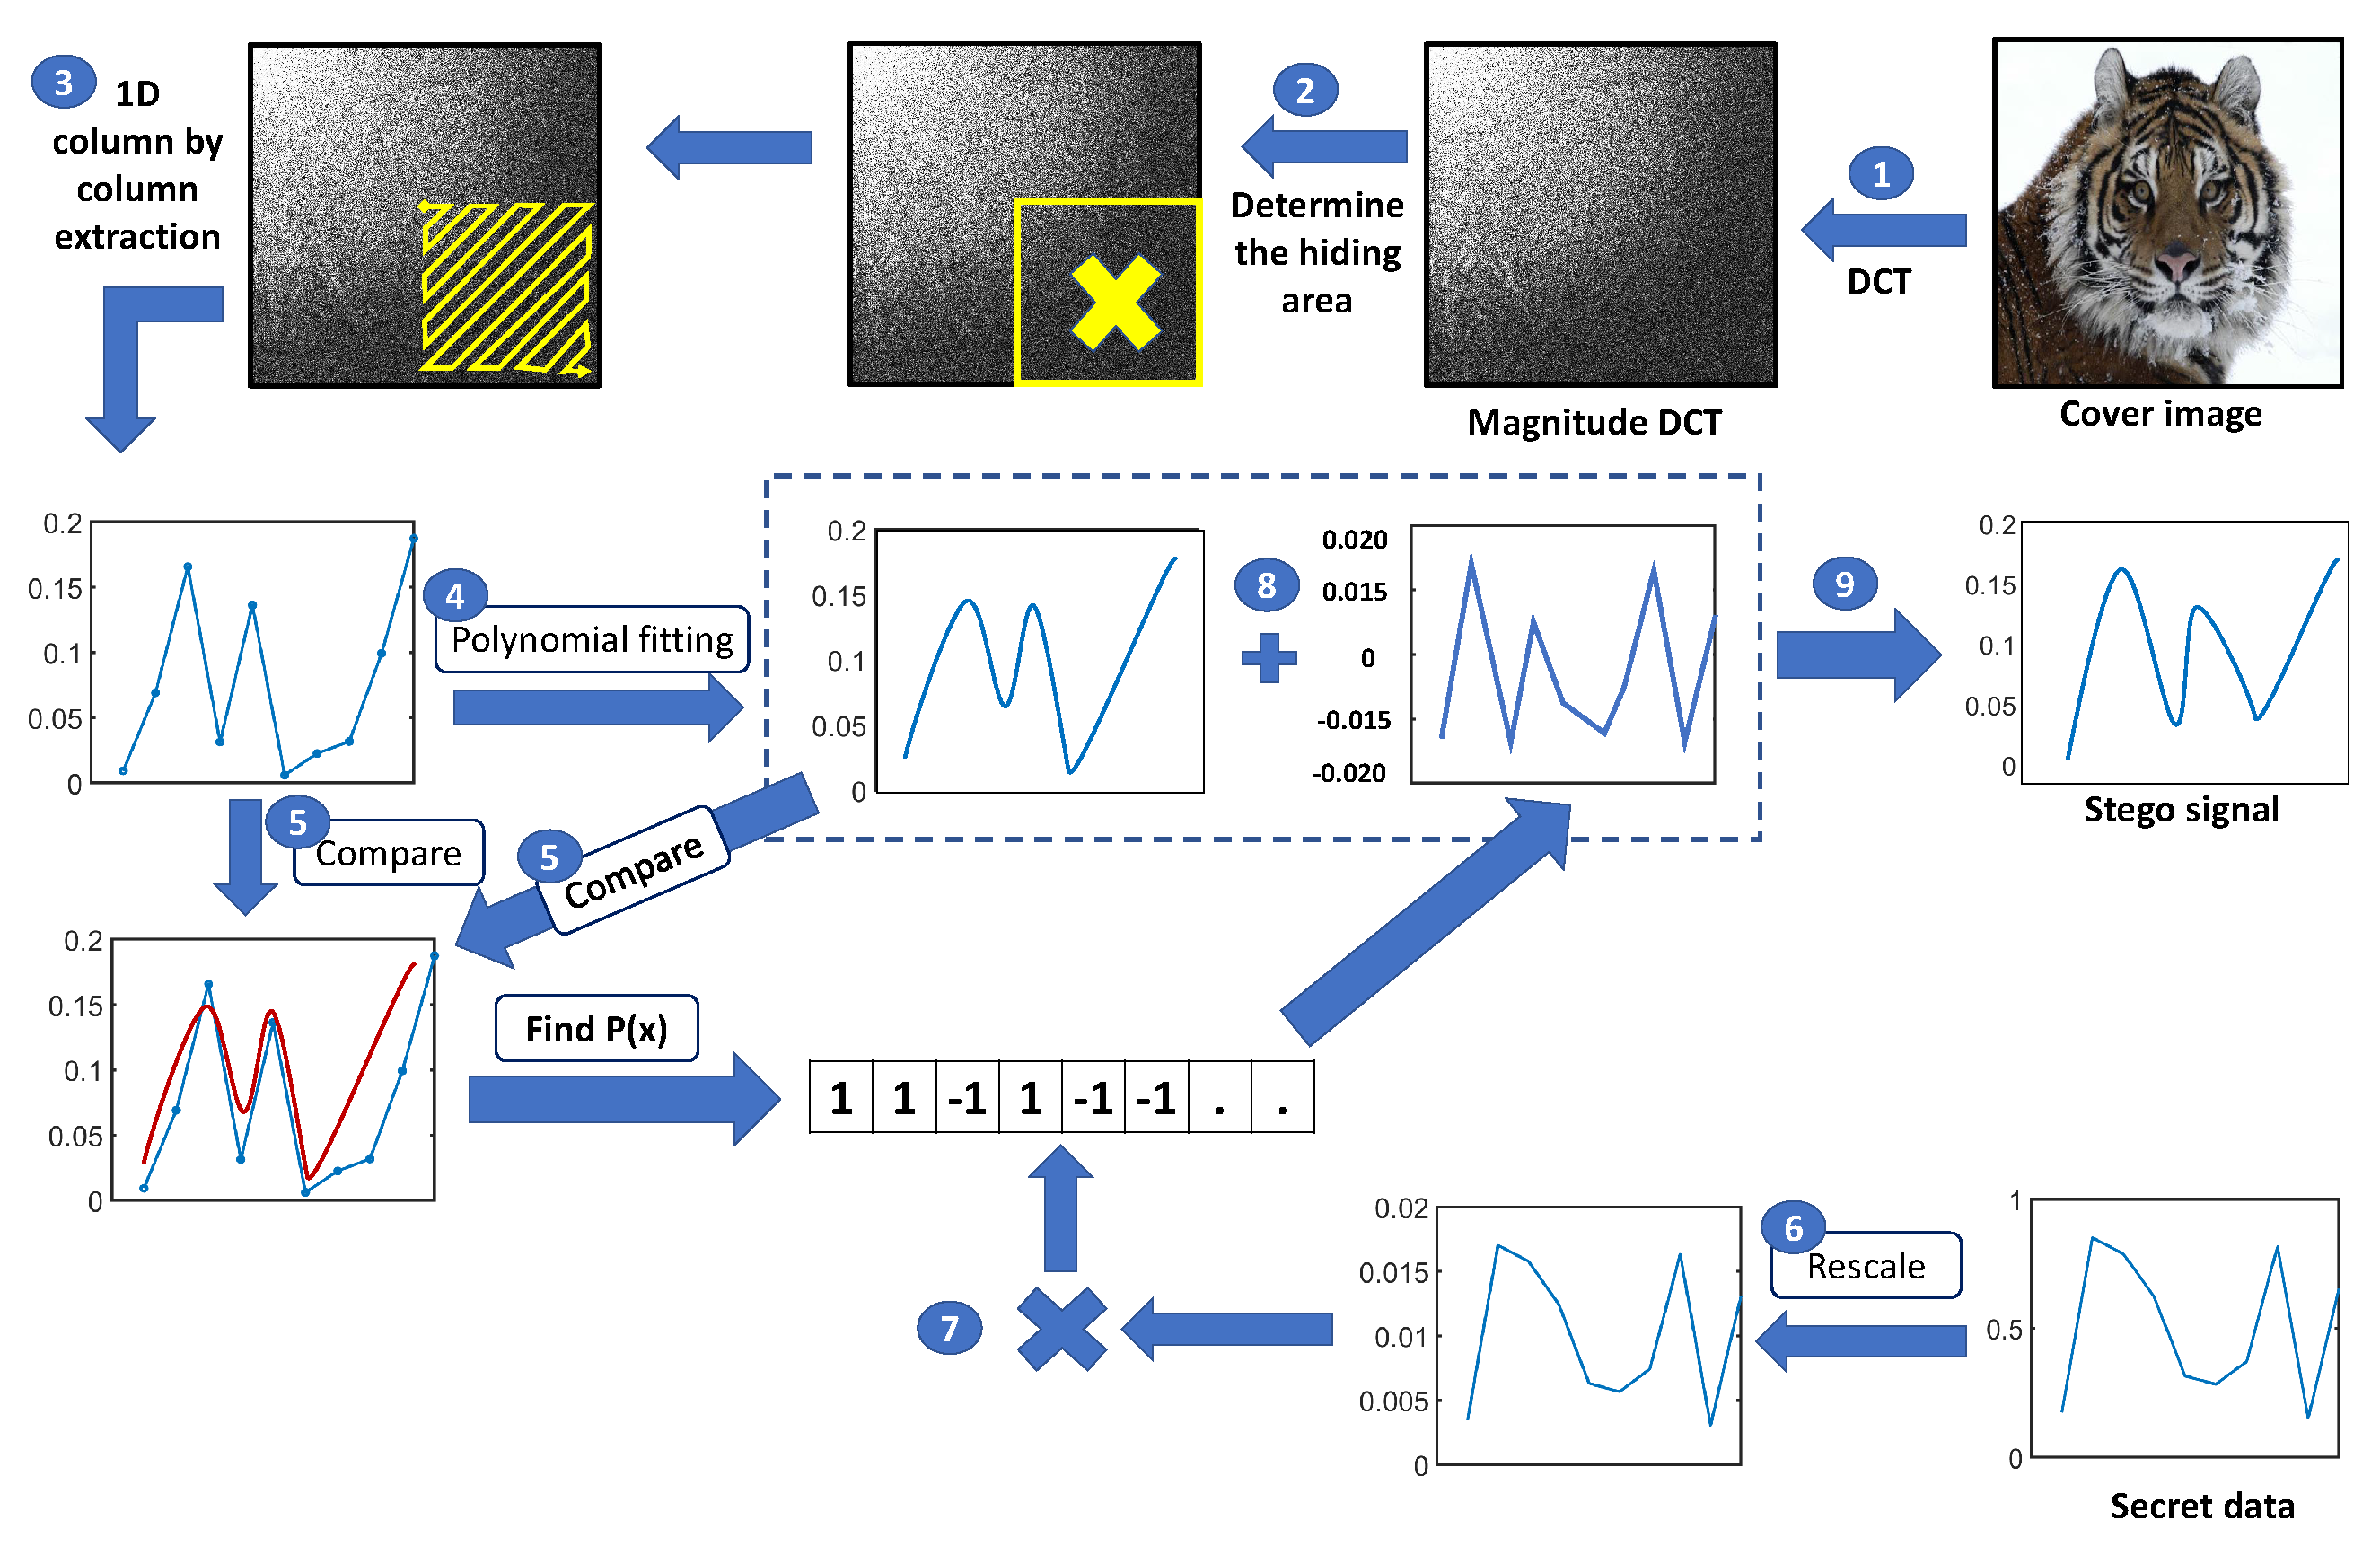
A new strategy reduces the communication cost between the encoder and decoder. The decoder requires the polynomial coefficients in order to extract the secret data. The default approach in other DCT modeling approaches is to model the DCT region in a column-by-column manner. This approach increases the communication cost. We propose extracting a single DCT signal in a zigzag manner instead of column-by-column.
The structure of the paper is as follows. Section 2 reviews related state-of-the-art literature/The DCT transform is introduced in Section 3. The embedding and extraction processes of the proposed scheme are explained in Section 4. Section 5 discusses the experimental results. Lastly, the conclusions are summarized in Section 6.

2. Related Works

A common classification strategy for steganography techniques is based on the embedding domain. According to this approach, steganography schemes are categorized as either spatial domain schemes or frequency domain schemes. In spatial domain schemes, embedding is carried out directly in the native spatial domain of the host cover image [23,24]. Examples of spatial domain schemes include Least-Significant-Bit (LSB) schemes [25,26], histogram-based techniques [27,28], and Pixel Value Difference (PVD) methods [29,30].
In contrast, transform-based schemes embed confidential bits in the transform domain of the hosting signal. This transformation is performed using one of the primary frequency domain methods [31,32,33] or variations of these techniques such as Dual-Tree Complex Wavelet Transforms (DTCWT), Complex Wavelet Transforms (CWT), and Integer Wavelet Transform (IWT) [34].
For instance, a DFT-based hiding scheme was proposed in [35]. In this scheme, the confidential data are first encoded using the Lempel–Ziv–Welch (LZW) compression technique. The LZW encoded data are then encrypted by performing an XOR operation with pseudo-random numbers. To further enhance security, the XOR result is encrypted using the Data Encryption Standard (DES) encryption technique. Meanwhile, the host image is transformed to the frequency domain using the DFT transform, where the Coefficients Selection and Frequency Hopping (CSFH) algorithm is employed to randomly select the DFT coefficients. The encrypted secret data are then embedded in these selected coefficients. Finally, the inverse DFT is performed to transform the image back to the spatial domain.
Another DWT-based hiding scheme was proposed in [36]. The proposed scheme successfully utilizes the three DWT bands, namely, horizontal, vertical, and diagonal, for hiding the confidential data. A secret key is generated to minimize the distortion in the cover image. Moreover, a blocking strategy is adopted to maintain the quality of the stego image by using a hiding strategy that elects matching blocks between the secret and cover image. Another DWT-based scheme that achieved acceptable imperceptibility and security levels was proposed in [37]. The proposed DWT scheme utilizes the Haar wavelet as the mother wavelet to minimize any data loss in the original hosting image.
The Discrete Cosine Transform (DCT) is widely used in steganography due to its strong energy compaction properties. The DCT can represent a signal using only a few significant coefficients. This characteristic benefits steganography schemes, as the DCT domain has many insignificant coefficients. Consequently, high-payload steganography schemes can be effectively implemented using the DCT transform.
Two parallel schemes were proposed in [38]. In the first scheme, the Rivest–Shamir–Adleman (RSA) encryption technique is utilized to encrypt a secret text message to generate the stego image. The second scheme is a parallelized chaotic 2D-DCT technique. The Duffing map is utilized to encode the confidential image into a uniform group of samples, which is later hidden in the frequency domain of the cover image.
Another DCT-based scheme was proposed in [39]. This proposed method applies the DCT transform to the cover image, then scans the DCT coefficients in a zigzag manner. After that, the hiding positions are elected based on a proposed chaotic function. This proposed scheme shows acceptable results in terms of the imperceptibility level; however, experimental results show poor robustness against compression and geometric attacks [40].
Several recent papers have explored the DCT energy compaction limits within steganography techniques [5,16,18,41]. These studies have confirmed that the DCT’s strong energy compaction property is directly related to the inter-pixel correlation level of the cover image. Based on the findings, higher pixel correlation within the cover image leads to stronger energy compaction in the DCT, thereby enabling higher payload capacity. These techniques typically use a coefficient replacement strategy in which insignificant DCT coefficients are replaced with scaled-down secret pixels.
One of the earliest attempts to develop a model-based steganography scheme was the Model-Based (MB1) scheme reported in [42]. This scheme is based on modeling the LSB plane with the assistance of the Generalized Cauchy Distribution (GCD). However, because there is no ideal model that can perfectly obtain a copy of the original image, there are noticeable differences between the original cover signal and the model-generated signal. Therefore, a basic first-order statistical analysis is able to overcome the security of the MB1 scheme [43]. Furthermore, the MB1 scheme suffers from ‘blockiness’ artifacts between the original cover image and the stego image generated by the MB1 scheme. Therefore, an enhanced version with de-blocking features, named MB2, was proposed in [42]. Despite this, MB2 can be broken using a Markov Process (MP), as shown in [44].
The first DCT model-based steganography scheme was proposed in [21]. The proposed scheme is based on a basic modeling approach in which every high-frequency DCT column is modeled by inspecting every local maximum and minimum point of the DCT column, then performing a linear interpolation process between every maximum and minimum point. The main drawback of the scheme proposed in [21] is its high communication cost, as the sender needs to transmit all maximum and minimum points to the receiver to reconstruct the secret image. To address this issue, an improved model-based version was presented in [22] that reduces communication costs by employing polynomial modeling. In this enhanced approach, high-frequency DCT coefficients are first modeled using polynomial fitting, then the down-scaled secret pixels are added to the polynomial-fitted signal.
This paper presents an improvement over the polynomial-based steganography scheme proposed in [22]. Instead of arithmetically adding the secret pixel using the polynomial-generated signal, the proposed technique tends to adaptively choose to either add or subtract the secret pixels to or from the modeled pixels in order to match the original DCT coefficients of the cover signal. This procedure maximizes the similarity between the stego signal and the original cover signal, resulting in enhanced stego quality.

3. The DCT Transform

The Discrete Cosine Transform (DCT) is a widely used mathematical transform in signal processing and image compression. It converts a sequence of data points into a sum of cosine functions that oscillate at different frequencies, allowing data to be represented in the frequency domain rather than the time or spatial domain. Among the various types of DCT, the most common are DCT-I, DCT-II, DCT-III, and DCT-IV, with DCT-II being the most widely utilized, particularly for image compression applications.
One of the primary applications of the DCT is in image compression standards such as JPEG. By transforming images into the frequency domain, the DCT helps to reduce the amount of data required to represent an image, concentrating visually significant information into just a few coefficients. In addition to image compression, the DCT is also employed in audio codecs such as MP3, where it aids in compressing audio signals by identifying and preserving essential frequencies. Video codecs such as H.264 utilize the DCT as part of their compression algorithms, enabling efficient storage and transmission of video data.
The DCT possesses several important properties that contribute to its effectiveness. One notable feature is its strong energy compaction, which means that a significant portion of the signal energy is concentrated within a small number of coefficients, helping to facilitate data compression. Additionally, the cosine functions used in the DCT are orthogonal, allowing for the efficient reconstruction of signals. The DCT also produces real-valued coefficients, which simplifies computation and reduces storage requirements.
Mathematically, the DCT of a one-dimensional signal x [ n ] is defined as follows:
X [ k ] = n = 0 N 1 x [ n ] cos π N n + 1 2 k , k = 0 , 1 , , N 1
where N is the number of samples, n is the index of the input signal, and k is the index of the DCT coefficient. The resulting DCT coefficients X [ k ] represent the frequency components of the original signal.
The DCT is particularly effective in image compression, as it tends to produce a significant number of zero or near-zero coefficients in the high-frequency region. This allows these insignificant coefficients to be replaced with other data, such as secret information in data hiding applications, while maintaining acceptable quality of the stego signal.
In practical applications, the two-dimensional DCT is often employed, particularly for image processing applications. The two-dimensional DCT is defined as follows:
X [ u , v ] = x = 0 M 1 y = 0 N 1 x [ x , y ] cos π M x + 1 2 u cos π N y + 1 2 v
where M and N are the dimensions of the input image and  ( u , v ) are the frequency indices.

4. Proposed Scheme

The DCT transform is a popular transform technique in the steganography field due to its strong energy compaction property. DCT-based schemes exploit this property by embedding in the large area that contains the high-frequency DCT components. Recent DCT-based schemes operate by substituting the high-frequency components with the confidential bits. This hiding procedure can produce stego signals with acceptable stego quality. This is true due to high-frequency DCT coefficients having less significance than low-frequency DCT coefficients, as shown in Figure 1. Based on Figure 1, the original signal can be restored with acceptable quality even after destroying the high-frequency component of the signal.
In DCT model-based hiding schemes, the quality level of the stego signal is maximized by adopting a strategy to keep the layout of the high-frequency component of the signal instead of completely destroying the high-frequency coefficients. This is accomplished by modeling the high-frequency coefficients using the polynomial fitting approach. The DCT signal to be modeled is a nonlinear signal. The polynomial fitting approach has the ability to model nonlinear relationships, capturing complex patterns that linear regression cannot. By adjusting the polynomial’s degree, the model can flexibly fit a wide range of data behaviors. Additionally, polynomial equations are relatively simple and interpretable, providing clear insights into the relationships between variables. Finally, the method is computationally efficient. There is a need to adopt a modeling technique that is simple but at the same time can capture complex nonlinear signals. Therefore, the proposed technique uses polynomial modeling. More information about polynomial fitting can be found in [22].
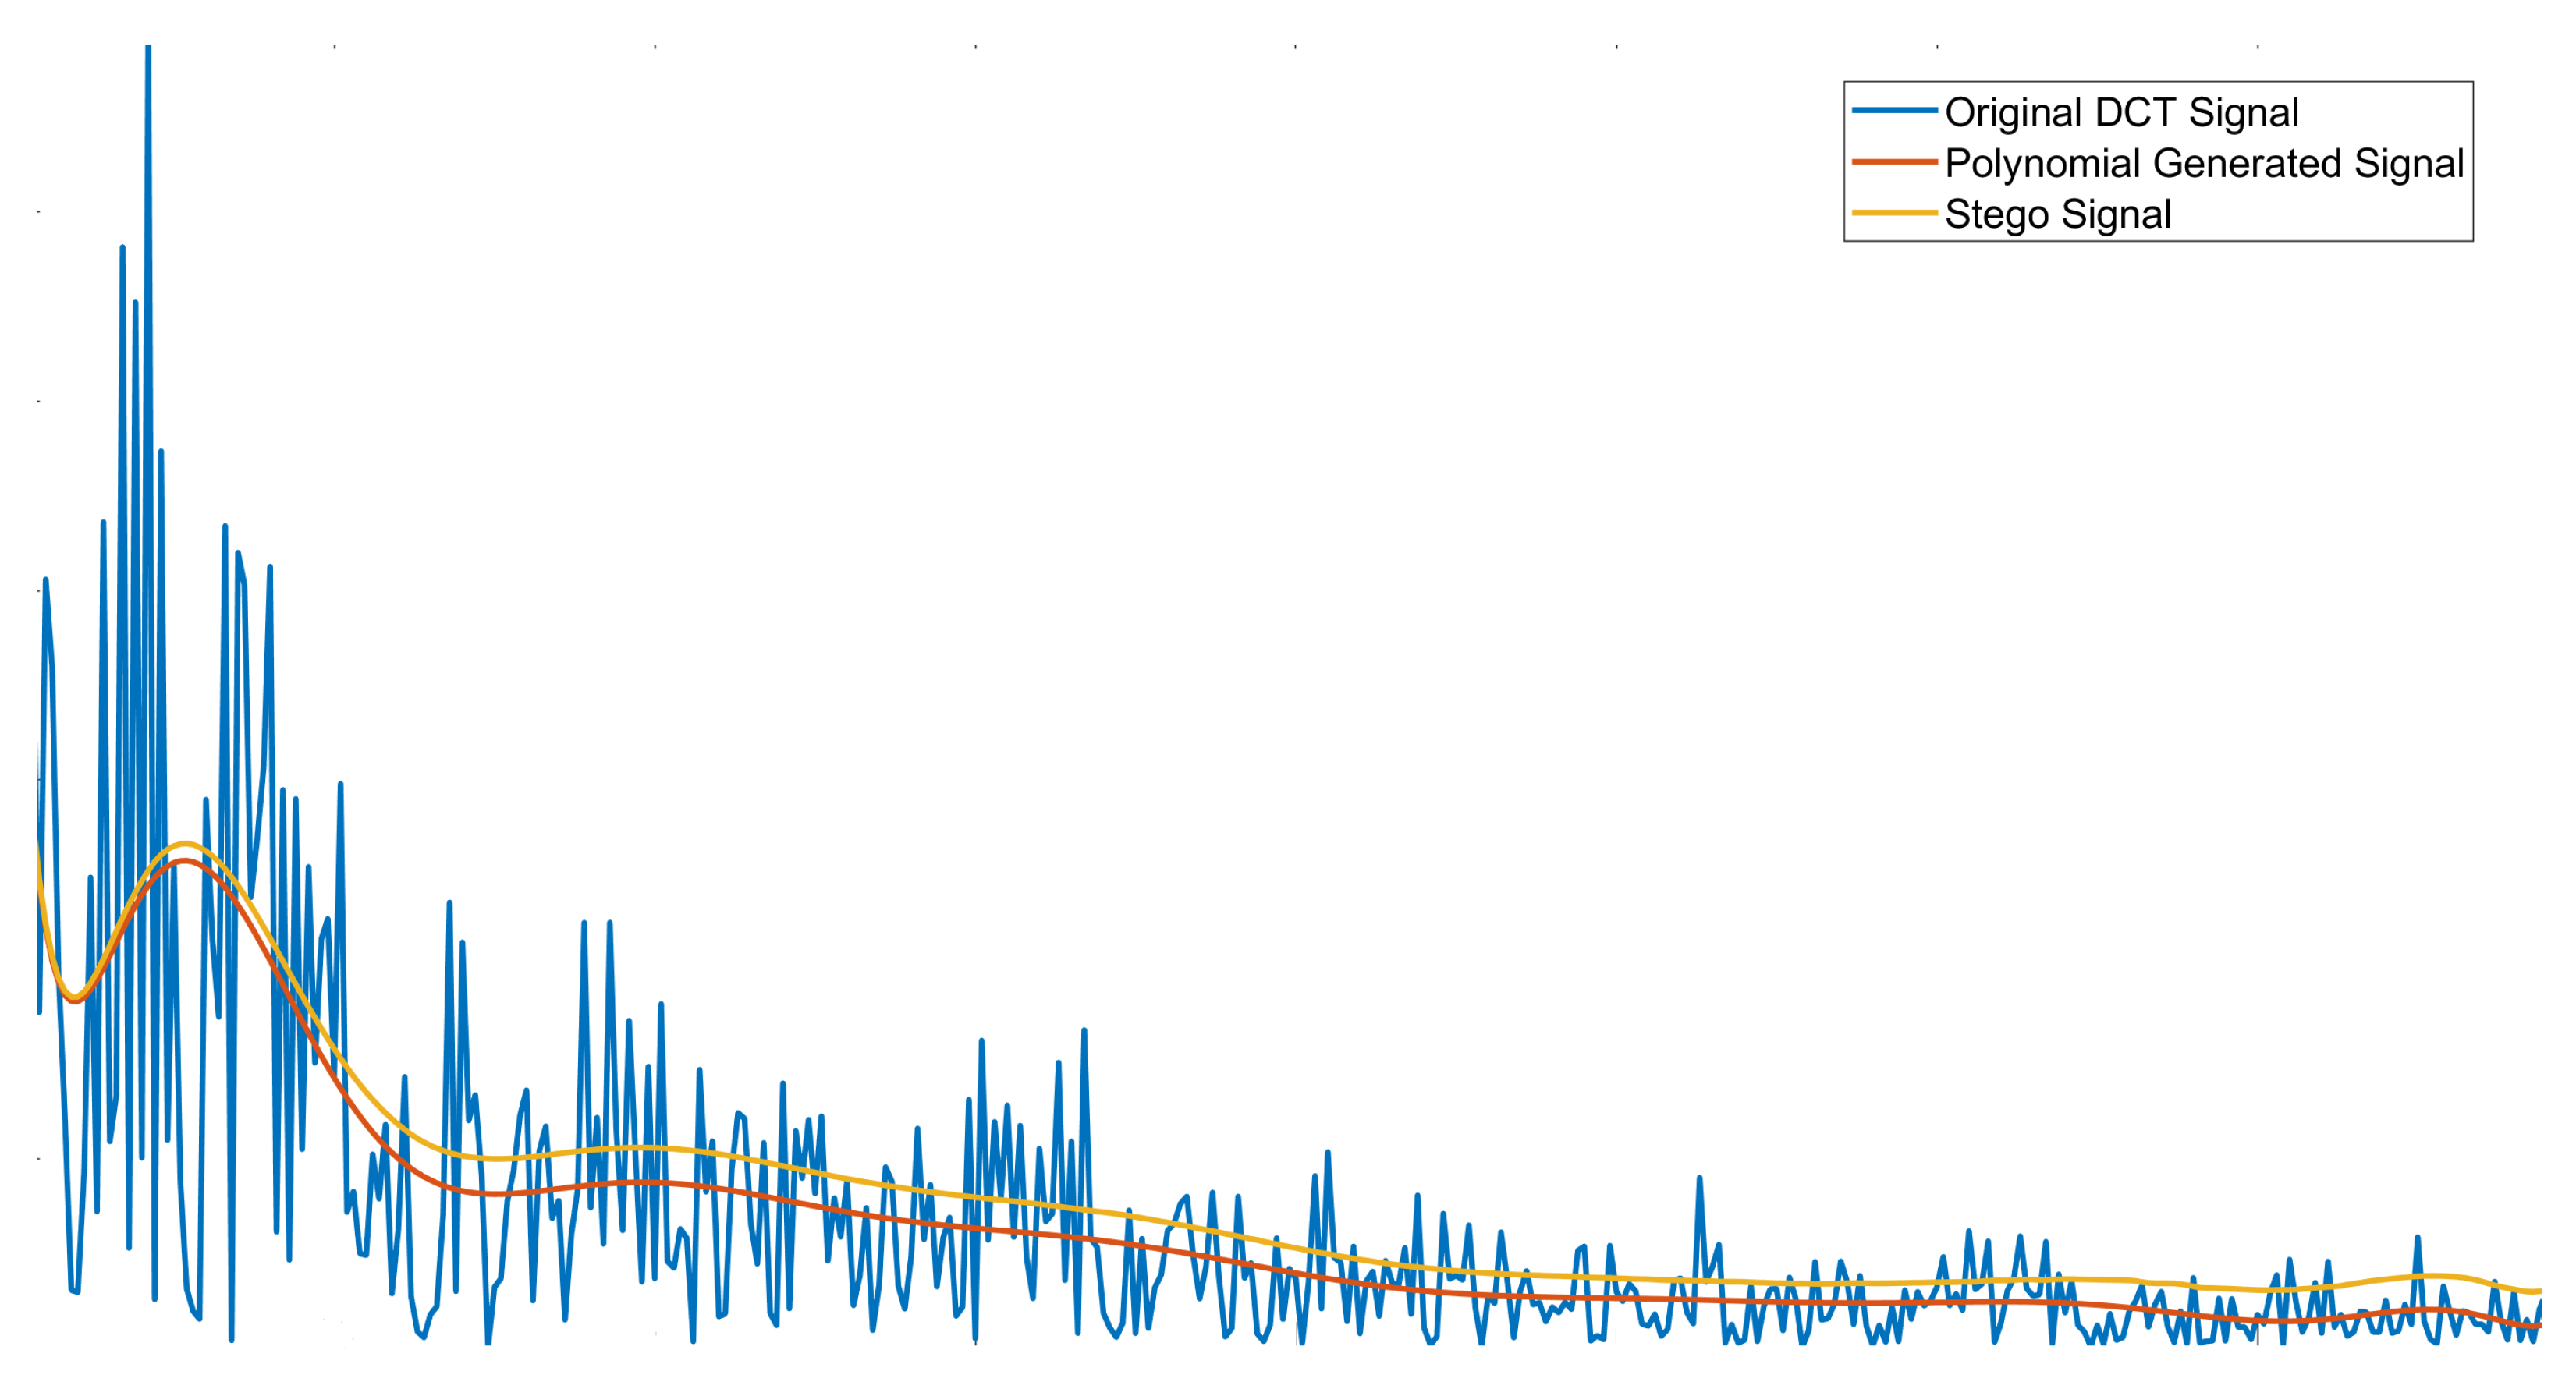
The DCT-based modeling technique proposed in [22] adopted the idea of superimposing a scaled-down version of the secret signal on the polynomial-generated signal to obtain the stego signal shown in Figure 2. The blue signal shown in Figure 2 represents the high-frequency portion of the cover image, which is completely destroyed in the DCT-based hiding schemes that adopt the concept of coefficients replacement. However, the scheme in [22] retains the overall shape of the high-frequency signal using polynomial modeling. Afterwards, the secret signal can be superimposed on the polynomial-generated signal after being down-scaled, with the resulting signal retaining the same structure as the polynomial-generated signal.
The proposed scheme is based on the observation that, as shown in Figure 2, the points of the polynomial-generated signal are always in the middle, rather than above nor below the points of the original high-frequency DCT signal. Therefore, it is not a good idea for all stego pixels to be generated using an arithmetic addition between the samples of the scaled-down secret signal and the polynomial-generated signal.
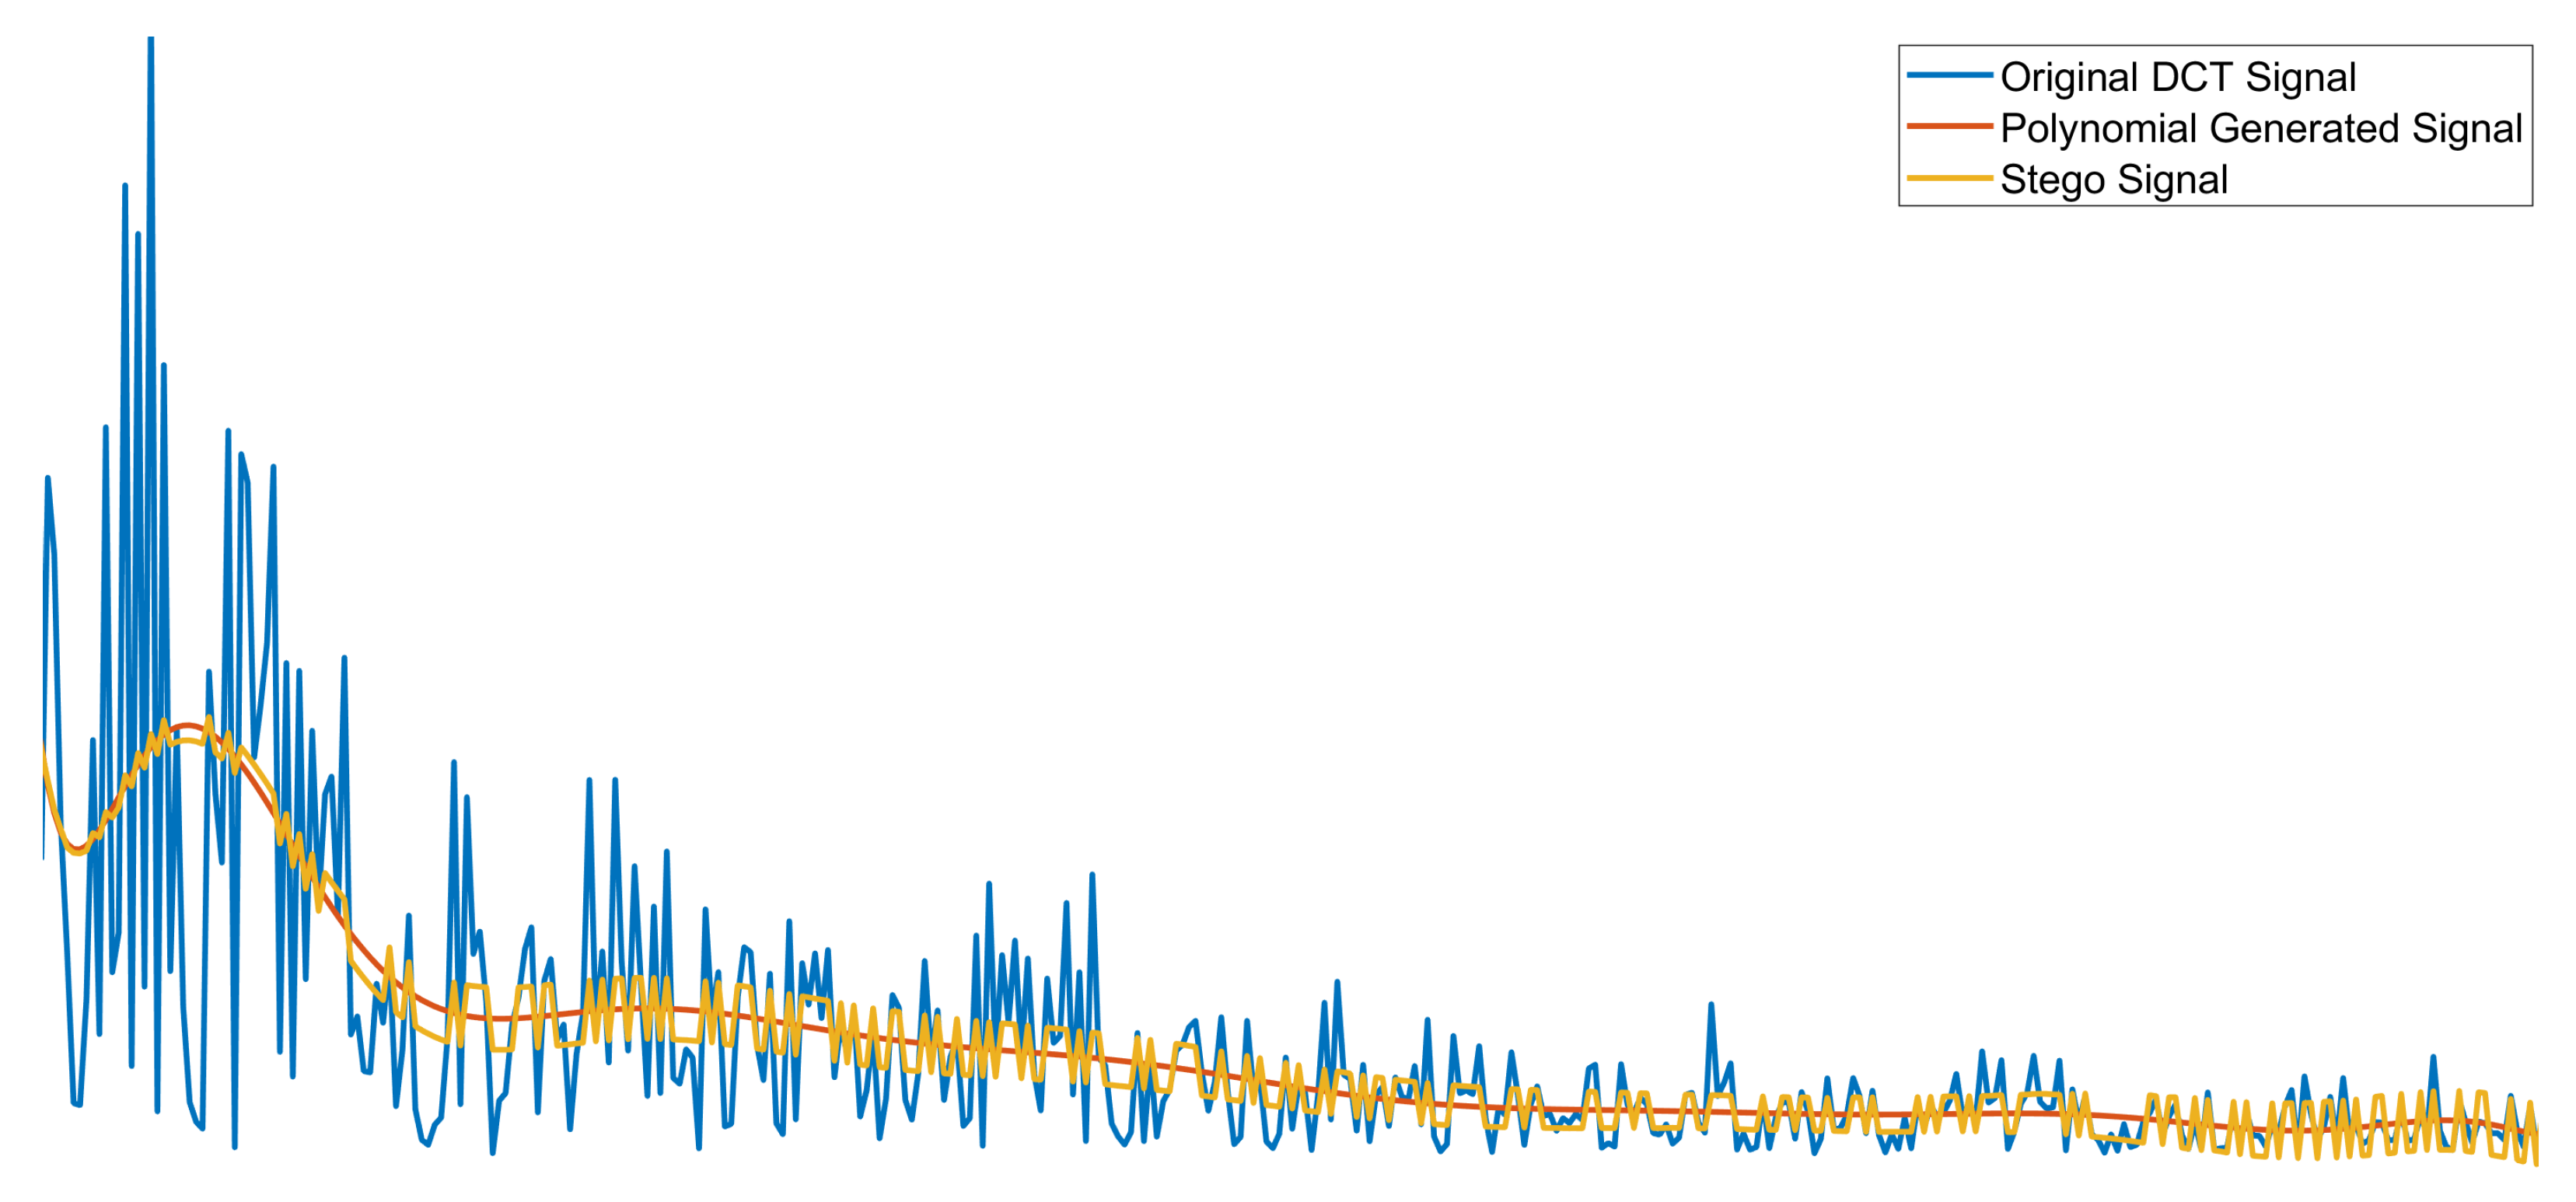
Instead, in this paper we aim to further maximize the similarity between the high-frequency DCT signal and the polynomial-generated signal. Instead of superimposing the scaled-down secret signal on the polynomial-generated signal, our scheme relies on the error between the high-frequency DCT signal and the polynomial-generated signal sample-by-sample. For a given sample, if the DCT sample is greater than the sample of the polynomial-generated signal, then the stego sample is obtained by adding the secret sample to the polynomial sample. Otherwise, if the polynomial sample is greater than the DCT sample, then the stego sample is obtained by subtracting the value of the secret sample from the value of the DCT sample.
To simplify, we add a parity bit calculation to the process. The parity bit is used to identify whether an addition or subtraction process is required within a specific sample. The parity-bit can obtain using
P ( x ) = 1 , D ( x ) > M ( x ) 1 , o t h e r w i s e ,
where x is the sample number, D ( x ) is the DCT sample at x, and  M ( x ) is the polynomial sample at x. Using Equation (3), the stego signal can be obtained using the following equation:
S T ( x ) = M ( x ) + P ( x ) k S ( x )
where x is the sample number, S T ( x ) is DCT stego sample at x, P ( x ) is the parity bit at sample x, k is the secret scaling factor, and  S ( x ) is the secret sample at x.
Following Equation (4), it is found that the scaled-down secret samples are either added to or subtracted from the polynomial-generated signal, as Equation (3) shows that P ( x ) can have a value of 1 or 1 . The idea is to attempt to reshape the polynomial signal to reach a shape that is closer to the original high-frequency DCT signal. The stego signal obtained using the proposed technique is shown in Figure 3. Compared to the results obtained in Figure 2, it is clear that the stego signal of the proposed scheme has a closer shape to the original high-frequency DCT signal than the stego signal obtained by the technique proposed in [22].

4.1. Data Embedding

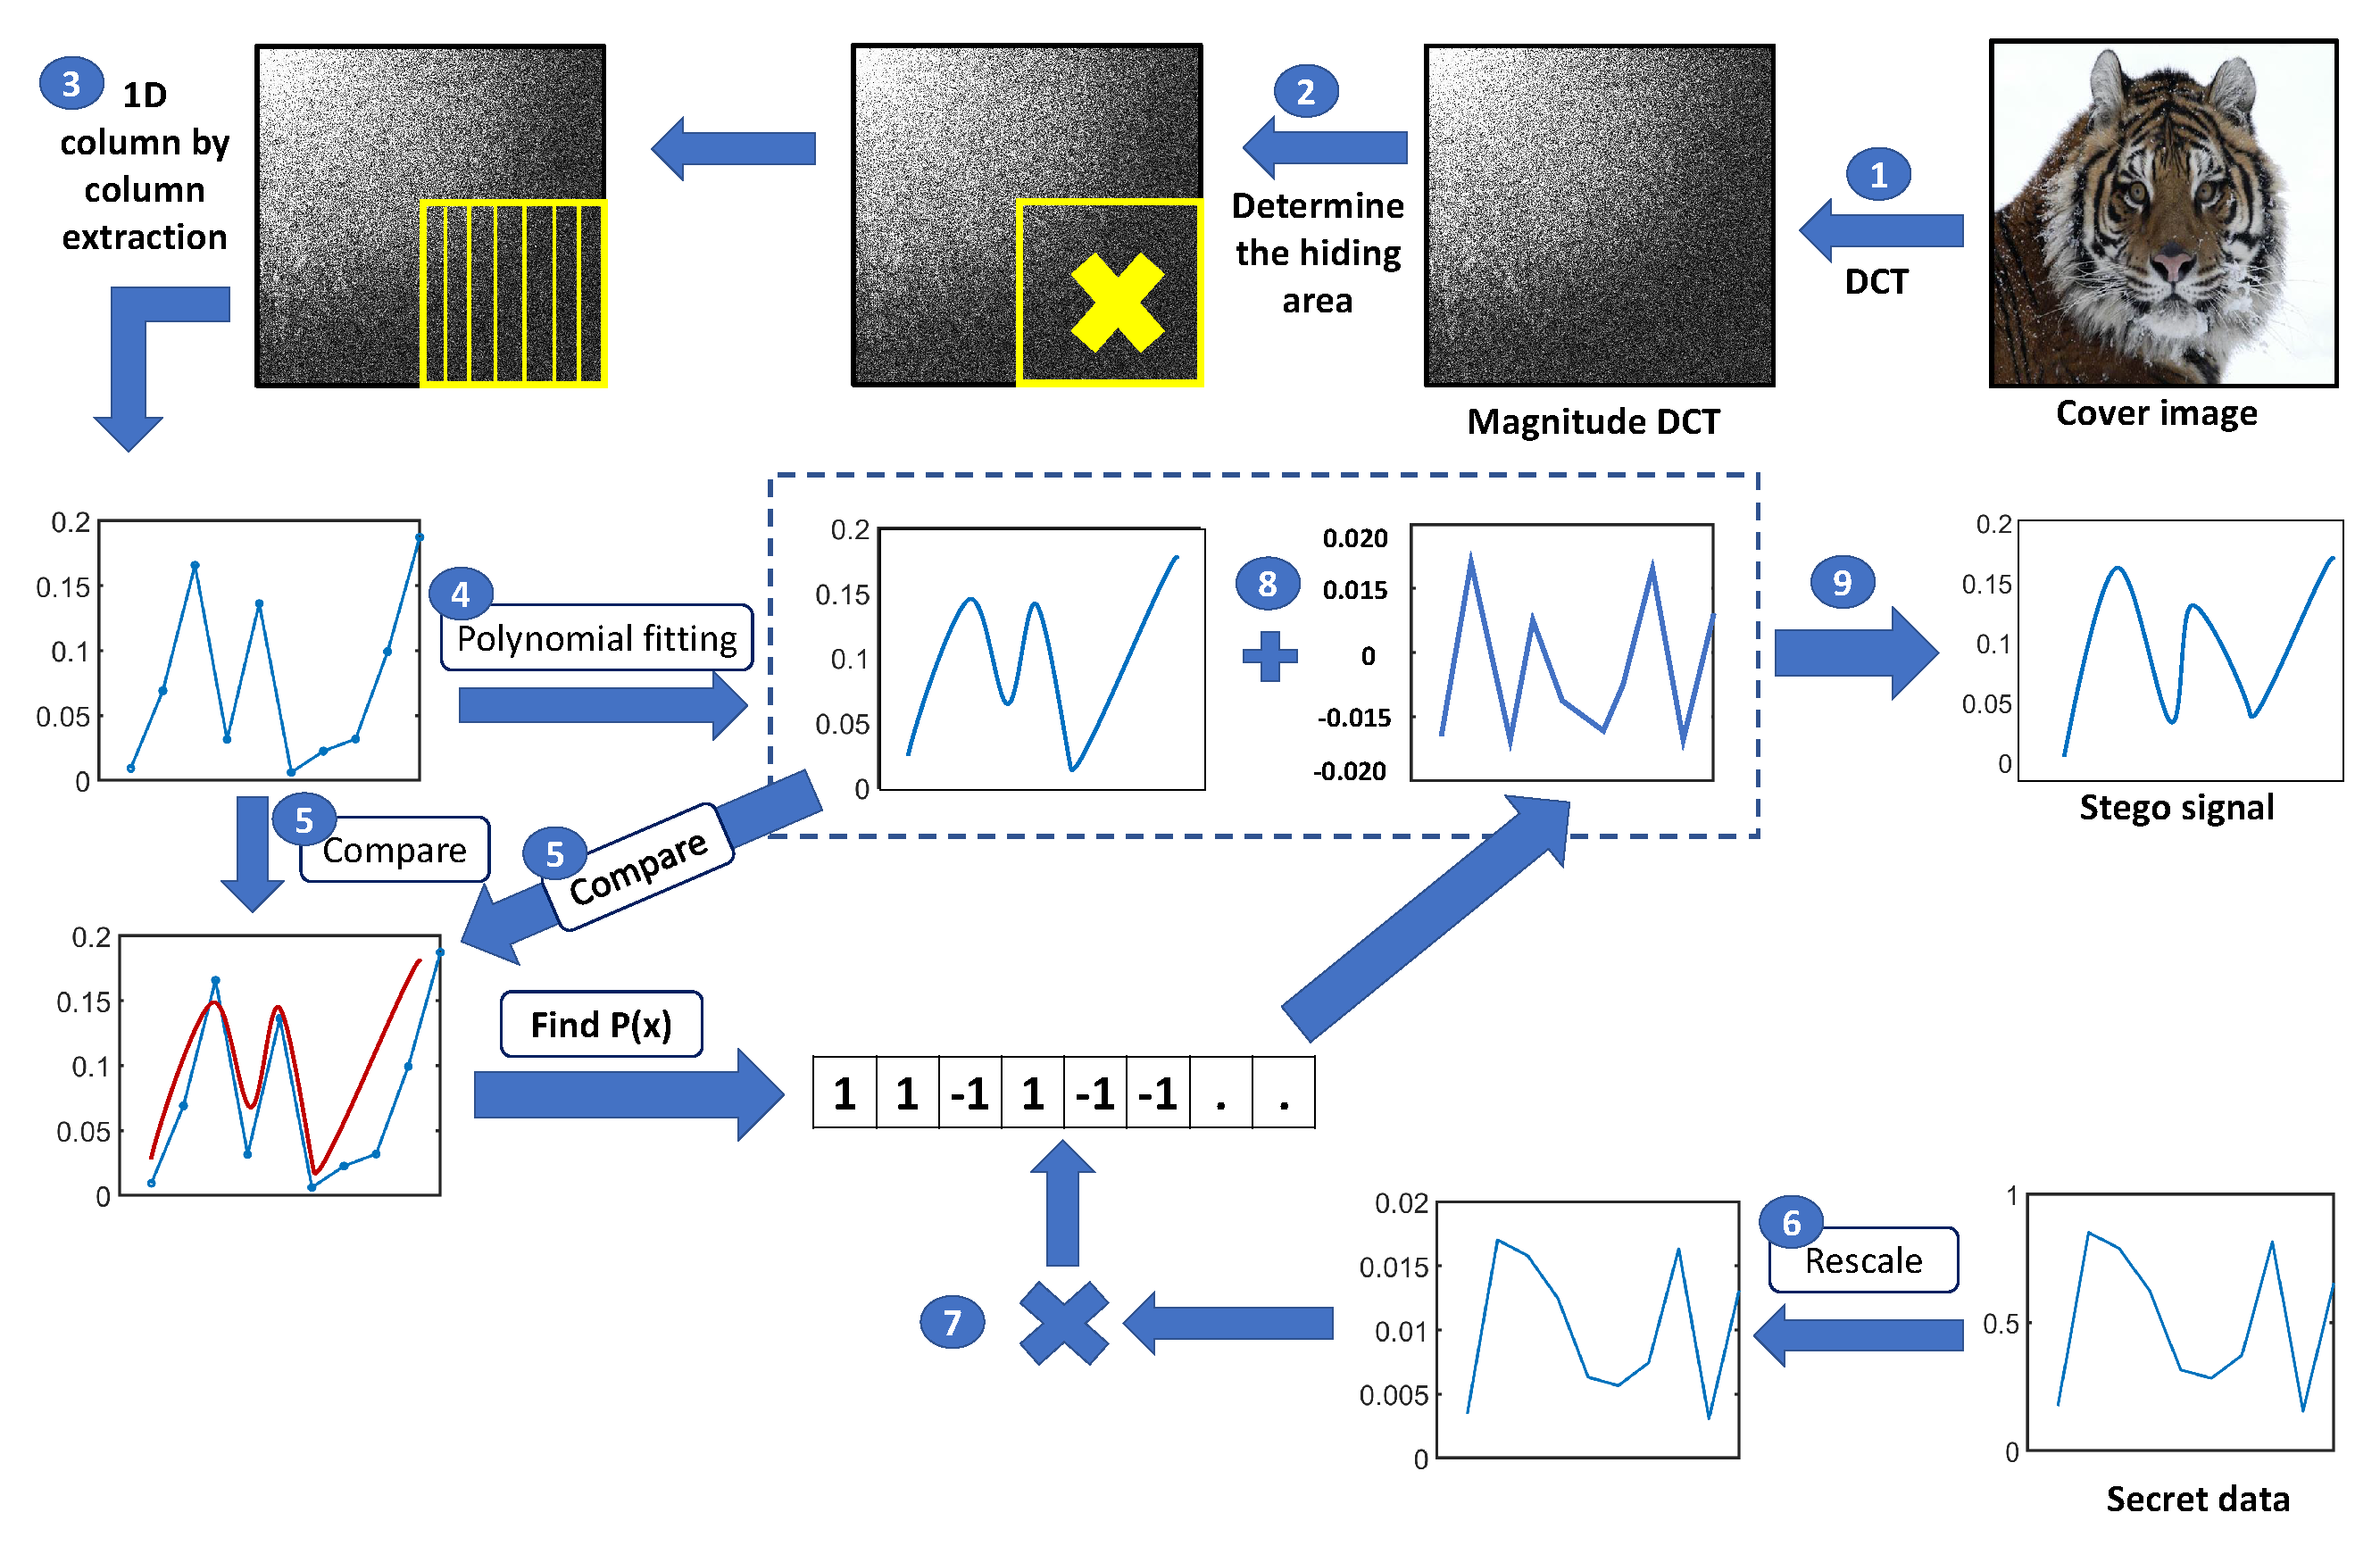
The embedding algorithm is illustrated in Figure 4. First, the 2D-DCT is applied to the cover image. Next, the magnitude of the DCT is extracted, as hiding is performed in the magnitude of the DCT while the DCT phase is kept intact. It has been proven that the DCT phase contains more significant information than the magnitude; thus, keeping the phase intact can contribute to producing a stego image with good quality [22].
After that, column-by-column extraction is performed using the magnitude of the DCT. Next, each column is modeled using the polynomial fitting approach using a degree of order n. Using the created polynomial model, a signal is generated that mimics the shape of the DCT signal. After that, the parity bit vector P ( x ) is generated by comparing the original DCT signal with the polynomial-generated signal.
In the meantime, the secret signal is prepared for the embedding process. First, the secret is downscaled using a rescaling factor k. Then, the secret signal is multiplied with the parity vector P ( x ) using Equation (3). After that, the resulting multiplication signal is added to the polynomial-generated signal to obtain the DCT of the stego signal. Finally, the Inverse DCT (IDCT) is applied to the stego DCT signal to obtain the stego signal in the spatial domain.
The rescaling factor k is a tuning parameter that controls the trade-off between stego quality and robustness. It is known that superimposing a small-scaled signal on a larger-scaled signal produces a signal that is similar to the larger signal. Therefore, decreasing the k value can improve the stego quality, as the secret column will be very small and the shape of the superimposed signal will not change much by superimposing this small signal. On the other hand, a very small secret signal can make the signal highly vulnerable to being destroyed by attacks such as data tampering. The proposed embedding algorithm is illustrated in the pseudocode shown in Algorithm 1.
Algorithm 1 The algorithm of the proposed embedding scheme
 1: Input:
 2:      cover: The cover image
 3:      secret: The secret image
 4:      n: The polynomial degree
 5:      k: The scaling factor
 6: Output:
 7:      stego: The stego image
 8: [coverdct] ← DCT2(cover)                    ▹ Apply 2D-DCT on the cover image
 9: [sec] ← secret*(1/k)               ▹ Downscale the secret image using the scaling factor k
10: [column] ← EXTRACT(coverdct)          ▹ Extract DCT column (Column-by-column or zigzag)
11: for 1:size(column) do  ▹ For every column, do the following: (for zigzag version, we have only 1 column)
12:     [column_model] ← polymodel(column,n)      ▹ Apply polynomial modeling using a degree of n
13:     [steg_column] ← column_model + b*sec             ▹ Superimpose sec over column_model
14: end for
15: steg_dct ← Group(steg_column)   ▹ Group the columns and place them back into their original locations
16: [stego] ← IDCT2(steg_dct)            ▹ Apply the inverse 2D-DCT to obtain the stego image

Zigzag Method

Another method to reduce the communication cost is the zigzag extraction method. Zigzag extraction of Discrete Cosine Transform (DCT) coefficients is preferred in image and video compression techniques such as the JPEG and MPEG standards due to several key advantages. The DCT transforms image data into frequency components, concentrating the most important visual information or lowest-frequency components in the top left-hand corner of the DCT block and high-frequency components, which are often less important and more noise-prone, positioned towards the bottom right-hand corner. Zigzag scanning starts from the top left and moves to the bottom right, effectively ordering the coefficients by their importance, which enhances the efficiency of compression algorithms. This method is particularly beneficial for run-length encoding (RLE), as it groups zero-valued high-frequency coefficients towards the end, producing longer runs of zeros and thereby improving compression rates. During quantization, high-frequency coefficients tend to become zero; thus, their clustering based on the zigzag order further enhances compression efficiency. Prioritizing low-frequency components helps to maintain image quality after compression by preserving essential image details. Moreover, zigzag scanning is a standardized method in JPEG and MPEG, ensuring compatibility across different platforms and devices. This standardized approach, coupled with the efficient ordering of coefficients, optimizes compression techniques and maintains good image quality, making zigzag extraction the preferred method for DCT coefficient handling in image and video compression. Moreover, instead of extracting column-by-column, in which case N number of columns need to be modeled, in zigzag extraction only one vector is modeled, meaning that only n + 1 polynomial coefficients need to be transmitted rather than ( n + 1 ) × N × N polynomial coefficients. The zigzag version is shown in Figure 5.

4.2. Data Extraction

The dimensions of the confidential image must be sent to the receiver along with the parity vector P ( x ) and the polynomial coefficients. To restore the confidential bits, the DCT is first performed on the stego signal. Because the area hosting the confidential bits is known, the magnitude of the DCT of the hosting area can be extracted. Next, using the sent polynomial coefficients, the polynomial signal M ( x ) is generated by the receiver. Using the parity vector received from the sender, extraction is achieved using
R E ( x ) = M ( x ) P ( x ) k S T ( x ) ,
where R E ( x ) is the extracted sample at x.
To reduce the communication cost between the sender and receiver, the parity vector P ( x ) can be compressed efficiently using the RLE compression technique, as it contains binary data; the pseudocode of the proposed extraction step is shown in Algorithm 2.
Algorithm 2 The algorithm of the proposed extraction scheme
 1: Input:
 2:      stego: The stego image
 3:      p: The polynomial coefficients vector
 4:      k: The scaling factor
 5: Output:
 6:     secret: The secret image
 7: [stegodct] ← DCT2(stego)                         ▹ Apply 2D-DCT on the stego image
 8: [column] ← EXTRACT(stegdct)              ▹ Extract DCT column (Column-by-column or zigzag)
 9: for 1:size(column) do      ▹ For every column, do the following: (for zigzag version, we have only 1 column)
10:     [column_model] ← construct(n)   ▹ Construct the polynomial signal from the polynomial coefficients vector p
11:     [secret_column] ← column – b* column_model               ▹ Get the secret column, b can be 0 or 1
12: end for
13: secret_scaled ← Group(secret_column)     ▹ Group the columns and place them back into their original locations
14: [sec] ← secret_scaled*(k)                  ▹ Upscale the secret image using the scaling factor k

5. Experimental Results

5.1. Analysis of Results

This section presents the experimental results obtained by the proposed embedding scheme and provides a comprehensive analysis of the performance of the proposed technique. Section 5.2 presents a comparison between the results gathered by the proposed steganography technique and other recent steganography techniques. Section 5.3 examines the robustness of the proposed steganography scheme. Finally, Section 5.4 tests the robustness of the proposed steganography technique against depp learning steganalysis test.
Figure 6 illustrates the original hosting image and the confidential image to be used. The hosting images, namely, “Airplane”, “Animal”, and “Vegetables”, were deliberately selected due to their belonging to different classes in terms of statistical properties. The level of correlation between the pixels was used as the measure to classify images as low-correlated, mid-correlated, or highly-correlated content in terms of the inter-pixel correlation level. The last image, “Rose”, was used as the secret image in the experiments.
This section follows the strategy of an ablation study to evaluate the performance of the proposed technique. An ablation study is a crucial experimental approach used to assess the contribution of individual components within a system or algorithm. By systematically removing or altering specific elements, researchers can evaluate the impact on overall performance and functionality. This method helps to identify which components are essential, which are redundant, and how the different parts interact with one another. In the context of the proposed steganography technique, an ablation study was conducted to isolate the effects of various algorithm modifications, such as changes in polynomial degree and scaling factor values. The results of this study not only highlight the strengths of the proposed approach but also provide valuable insights into areas for further optimization and refinement.

Capacity–Transparency Analysis

The bit-per-pixel (bpp) metric is utilized to calculate the capacity ratio. The bpp ratio is computed using
C a p a c i t y ( b p p ) = s c × r ,
where s is the total number of secret pixels, c is the total number of cover pixels, and r is the total number of bits per pixel. In the following experiments, r was equal to 24, as the cover images were colored images with the three color channels (red, green, and blue) and each pixel in each channel was coded using 8 bits.
Stego quality is determined using the Peak Signal-To-Noise Ratio (PSNR) and the Structural Similarity Index (SSIM) [5].
First, the performance of the proposed hiding strategy was examined against the coefficient replacement hiding strategy adopted by various DCT schemes, which is the simple replacement of the high-frequency DCT signal with the scaled-down secret pixels. Table 1 and Table 2 show a comparison when hiding with polynomial degrees n of 2 and 15, respectively. These results show that the proposed strategy outperforms the coefficient replacement embedding strategy in all cases. Moreover, the proposed strategy achieves promising results even when hiding a large amount of confidential bits. For example, the proposed steganography technique obtained PSNR values of 30.22 dB and 32.92 dB when embedding with 22.89 bpp when using polynomial degrees n of 2 and 15, respectively.
Another fact that can be extracted from Table 1 and Table 2 is that increasing the polynomial degree improves the quality of the stego image. That is because increasing the polynomial degree enhances the modeling process and produces a closer signal to the original high-frequency DCT signal. However, this improvement in stego quality increases the communication cost between the sender and receiver. The reason for this is that more polynomial coefficients need to be sent to the receiver in order to provide a recoverable secret image.
The reason for selecting a polynomial degree of n = 2 in the experiments was to show the results obtained with the lowest possible polynomial degree, as n = 1 will generate a linear function ( p 1 x + p 2 ) that cannot model DCT signals. Even when using the lowest polynomial modeling degree, the proposed scheme was able to outperform the coefficient replacement strategy and achieve outstanding results in terms of the hiding capacity, which reached up to 22.89 bpp while generating a stego image with a quality of 30.22 dB. However, in terms of the stego quality we found that a polynomial degree of n = 15 produced the best results, which is shown in Table 2.
The column named “Cost” in all the tables shows the ratio of the overhead data to the total amount of confidential pixels. Because every column must be modeled with a polynomial of n degree, the cost can be calculated using
c o s t = ( n + 1 ) × d d × d ,
where n is the polynomial degree used and d is the dimension of the signal to be modeled.
Table 3 shows the zigzag version described earlier in Section 4. The main advantage of the zigzag version is its reduced communication cost, as only one column needs to be modeled. Because there are only ( n + 1 ) coefficients to be sent to the receiver, the reduced communication cost does not significantly affect the performance of the proposed scheme. Based on Table 3, the zigzag version outperforms the coefficient replacement hiding strategy in all cases. Comparing the results between the column-by-column version and the zigzag version (Table 2 and Table 3), it can be seen that the reduced communication cost does not significantly affect the performance of the hiding scheme; indeed, in certain cases hiding with the zigzag version shows improved results over the column-by-column version. For example, hiding in the “Airplane” cover image achieves a PSNR value of 45.09 dB with the zigzag version compared to 44.87 dB with the column-by-column version for the same hiding capacity ratio of 14.65 bpp.

5.2. Comparison with Recent Schemes

Table 4 and Table 5 show the best results achieved by the different steganography schemes in terms of the hiding capacity and stego quality. Table 4 and Table 5 clearly prove the effectiveness of the proposed scheme, which outperforms recent steganography schemes in terms of both bpp and PSNR values. The only scheme to achieve a higher PSNR value was that of Yang and Tsai [45], which achieved a PSNR value of 48.84 dB. However, this result was obtained with a very low hiding capacity ratio of 9.6 bpp, much lower than the capacity ratio achieved by the proposed scheme, which was 18.54 bpp for a competitive PSNR value of 42.41 dB.

5.3. Robustness

This section provides a robustness evaluation of the proposed method by exploring the quality of the recovered confidential message after attacking the container signal with data loss tampering attacks and noise distribution attacks.
In these experiments, the stego image was exposed to two different types of attacks: a “Salt and Pepper” attack, and a Tampering (data loss) attack. The salt and pepper attack involved random dispersal of black and white pixels with density d , where 0 < d < 1 corresponds to the percentage of the affected pixels to the total numbers of pixels. The salt and pepper attack is shown in Figure 7, Figure 8, Figure 9, Figure 10, Figure 11 and Figure 12. On the other hand, in the data loss tampering attack we removed a squared area from the stego image, as shown in Figure 13 and Figure 14.
The proposed hiding scheme was tested with two different densities of 0.001 and 0.005 for the salt and pepper attack. It was determined after several experiments that the scale factor k represents a tuning parameter between stego quality and extraction quality. Figure 7, Figure 8, Figure 9 and Figure 10 clearly show the trade-off problem with the salt and pepper attack and tampering (data loss) attack under different densities. Based on these figures, it is clear that the stego quality is enhanced when increasing the scale factor k. In addition, the quality of the recovered secret is enhanced with the increase in the scale factor k. However, there is a saturation point around k = 5 after which the quality of the recovered secret image decreases.
A visual illustration of the attacked stego images and the recovered secret images is shown in Figure 11, Figure 12, Figure 13 and Figure 14. For illustration purposes, in these experiments the secret image hidden is not the “Rose” secret image but is instead a different secret image named “Handwriting”, as the “Handwriting” secret image contains written text. It is clear from Figure 14 that the text written in the “Handwriting" secret image remains readable after extraction, even when subjected to a tampering attack against a large 256 × 256 squared region.

5.4. Security

This subsection examines the security level of the proposed hiding scheme using a Convolutional Neural Network (CNN)-based steganalysis technique. Steganalysis is the science of detecting the existence of the secret data in stego signals and determining whether a given test image contains embedded secret data (i.e., stego signal) or contains no such embedded secret data (i.e., cover signal).
One of the earliest attempts to develop a model-based steganography scheme was the model-based MB1 scheme reported in [42]. This scheme is based on modeling the LSB plane with the assistance of the Generalized Cauchy Distribution (GCD). However, because there is no ideal model that can perfectly regenerate a copy version of the cover image, there are noticeable differences between the original cover signal and the model-generated signal; therefore, MB1 is easily broken using the first-order statistical analysis [43]. Moreover, the MB1 scheme suffers from ‘blockiness’ artifacts between the original cover image and the stego image generated by the MB1 scheme. Therefore, an enhanced version called MB2 with de-blocking features was proposed in [42]. Despite this, MB2 can be broken using a Markov Process (MP), as shown in [44].
As deep learning methods gain traction, techniques such as transformer networks, Generative Adversarial Networks (GANs), and Convolutional Neural Networks (CNNs) have proven to be highly effective for steganalysis. These methods can automatically extract features from training data, eliminating the need for manually designed features, which can sometimes be flawed or misleading.
The structure of the developed CNN is shown in Figure 15. The steganalysis test on the proposed scheme is depicted in Figure 16. As can be seen in Figure 16, the CNN was unable to correctly classify the input images or to detect the presence of hidden data, achieving an accuracy of only 50%. In contrast, the same CNN efficiently detected the existence of secret data when using the coefficient replacement hiding strategy, as shown in Figure 17, reaching a high accuracy level of around 90%.

6. Conclusions

This paper introduced a novel approach to DCT model-based steganography techniques. Instead of completely altering the high-frequency DCT coefficients, as in recent coefficient replacement strategies, the proposed method aims to preserve their structure. First, the high-frequency coefficients undergo polynomial modeling; then, the scaled-down secret samples are added to or subtracted from the polynomial-generated signal to reduce the error between the polynomial-generated signal and the original high-frequency DCT signal. Experimental results demonstrate the efficacy of this approach, showing improved imperceptibility. Furthermore, steganalysis testing using a CNN indicates an advanced security level, as the CNN failed to differentiate between cover and stego images even at high embedding capacities. Future work will focus on reducing the modeling error to further improve imperceptibility and security in model-based hiding schemes.

Author Contributions

Conceptualization, All authors; methodology, M.B.; software, M.B.; writing—original draft preparation, M.B.; writing—review and editing, M.B.; supervision, T.R. and I.K. All authors have read and agreed to the published version of the manuscript.

Funding

This research received no external funding.

Data Availability Statement

No data or dataset was generated.

Conflicts of Interest

The authors declare no conflict of interest.

References

  1. Kunhoth, J.; Subramanian, N.; Al-Maadeed, S.; Bouridane, A. Video steganography: Recent advances and challenges. Multimed. Tools Appl. 2023, 82, 41943–41985. [Google Scholar] [CrossRef]
  2. Mehic, M.; Michalek, L.; Dervisevic, E.; Burdiak, P.; Plakalovic, M.; Rozhon, J.; Mahovac, N.; Richter, F.; Kaljic, E.; Lauterbach, F.; et al. Quantum cryptography in 5g networks: A comprehensive overview. IEEE Commun. Surv. Tutorials 2023, 26, 302–346. [Google Scholar] [CrossRef]
  3. Varghese, F.; Sasikala, P. A detailed review based on secure data transmission using cryptography and steganography. Wirel. Pers. Commun. 2023, 129, 2291–2318. [Google Scholar] [CrossRef]
  4. Subramani, S.; Svn, S.K. Review of security methods based on classical cryptography and quantum cryptography. Cybern. Syst. 2023, 1–19. [Google Scholar] [CrossRef]
  5. Rabie, T.; Kamel, I.; Baziyad, M. Maximizing embedding capacity and stego quality: Curve-fitting in the transform domain. Multimed. Tools Appl. 2018, 77, 8295–8326. [Google Scholar] [CrossRef]
  6. Gutub, A. Regulating Kashida Arabic steganography to improve security and capacity performance. Multimed. Tools Appl. 2024, 1–34. [Google Scholar] [CrossRef]
  7. Chen, T.H.; Yan, J.Y. Enhanced steganography for high dynamic range images with improved security and capacity. Appl. Sci. 2023, 13, 8865. [Google Scholar] [CrossRef]
  8. Huo, L.; Chen, R.; Wei, J.; Huang, L. A High-Capacity and High-Security Image Steganography Network Based on Chaotic Mapping and Generative Adversarial Networks. Appl. Sci. 2024, 14, 1225. [Google Scholar] [CrossRef]
  9. Suhail, M.; Sadoun, B.; Obaidat, M.S. Digital Watermarking and Steganography; Wiley: Boston, MA, USA, 2006; Volume 2, pp. 664–678. [Google Scholar]
  10. Rafidison, M.A.; Rafanantenana, S.H.J.; Rakotomihamina, A.H.; Toky, R.F.M.; Ramafiarisona, H.M. Contribution of neural networks in image steganography, watermarking and encryption. IET Image Process. 2023, 17, 463–479. [Google Scholar] [CrossRef]
  11. Caballero, H.; Muñoz, V.; Ramos-Corchado, M.A. A comparative study of steganography using watermarking and modifications pixels versus least significant bit. Int. J. Electr. Comput. Eng. IJECE 2023, 13, 6335–6350. [Google Scholar] [CrossRef]
  12. Dong, L.; Fu, Z.; Chen, L.; Ding, H.; Zheng, C.; Cui, X.; Shen, Z. FDNet: Imperceptible backdoor attacks via frequency domain steganography and negative sampling. Neurocomputing 2024, 583, 127546. [Google Scholar] [CrossRef]
  13. Kaur, R.; Singh, B. A robust and imperceptible n-Ary based image steganography in DCT domain for secure communication. Multimed. Tools Appl. 2024, 83, 20357–20386. [Google Scholar] [CrossRef]
  14. Lan, Y.; Shang, F.; Yang, J.; Kang, X.; Li, E. Robust image steganography: Hiding messages in frequency coefficients. In Proceedings of the AAAI Conference on Artificial Intelligence, Washington, DC, USA, 7–14 February 2023; Volume 37, pp. 14955–14963. [Google Scholar]
  15. Zhou, W.; Wang, Z.; Chen, Z. Image super-resolution quality assessment: Structural fidelity versus statistical naturalness. In Proceedings of the 2021 13th International Conference on Quality of Multimedia Experience (QoMEX), Virtual Event, 14–17 June 2021; pp. 61–64. [Google Scholar]
  16. Rabie, T.; Kamel, I. Toward optimal embedding capacity for transform domain steganography: A quad-tree adaptive-region approach. Multimed. Tools Appl. 2017, 76, 8627–8650. [Google Scholar] [CrossRef]
  17. Brisbane, G.; Safavi-Naini, R.; Ogunbona, P. High-capacity steganography using a shared colour palette. IEE Proc. Vis. Image Signal Process. 2005, 152, 787–792. [Google Scholar] [CrossRef]
  18. Rabie, T.; Kamel, I. On the embedding limits of the discrete cosine transform. Multimed. Tools Appl. 2016, 75, 5939–5957. [Google Scholar] [CrossRef]
  19. Rabie, T.; Baziyad, M. Visual fidelity without sacrificing capacity: An adaptive Laplacian pyramid approach to information hiding. J. Electron. Imaging 2017, 26, 063001. [Google Scholar] [CrossRef]
  20. Lee, Y.; Chen, L. High capacity image steganographic model. IEE Proc. Vis. Image Signal Process. 2000, 147, 288–294. [Google Scholar] [CrossRef]
  21. Rabie, T.; Baziyad, M.; Kamel, I. High Payload Steganography: Surface-Fitting The Transform Domain. In Proceedings of the International Conference on Communications, Signal Processing, and their Applications (ICCSPA), Sharjah, United Arab Emirates, 16–18 March 2019; pp. 1–6. [Google Scholar]
  22. Rabie, T.; Baziyad, M.; Kamel, I. Secure high payload steganography: A model-based approach. J. Inf. Secur. Appl. 2021, 63, 103043. [Google Scholar] [CrossRef]
  23. Milosav, P.; Milosavljević, M.; Banjac, Z. Steganographic Method in Selected Areas of the Stego-Carrier in the Spatial Domain. Symmetry 2023, 15, 1015. [Google Scholar] [CrossRef]
  24. Hussain, M.; Wahab, A.W.A.; Idris, Y.I.B.; Ho, A.T.; Jung, K.H. Image steganography in spatial domain: A survey. Signal Process. Image Commun. 2018, 65, 46–66. [Google Scholar] [CrossRef]
  25. Rahman, S.; Uddin, J.; Hussain, H.; Ahmed, A.; Khan, A.A.; Zakarya, M.; Rahman, A.; Haleem, M. A Huffman code LSB based image steganography technique using multi-level encryption and achromatic component of an image. Sci. Rep. 2023, 13, 14183. [Google Scholar] [CrossRef] [PubMed]
  26. Al-Chaab, W.; Abduljabbar, Z.A.; Abood, E.W.; Nyangaresi, V.O.; Mohammed, H.M.; Ma, J. Secure and low-complexity medical image exchange based on compressive sensing and lsb audio steganography. Informatica 2023, 47. [Google Scholar] [CrossRef]
  27. Sondas, A.; Erturk, N.B. Dynamic data hiding capacity enhancement for the Hybrid Near Maximum Histogram image steganography based on Multi-Pixel-Pair approach. Multimed. Tools Appl. 2024, 1–17. [Google Scholar] [CrossRef]
  28. Fatman, A.N.; Ahmad, T.; Jean De La Croix, N.; Hossen, M.S. Enhancing Data Hiding Methods for Improved Cyber Security Through Histogram Shifting Direction Optimization. Math. Model. Eng. Probl. 2023, 10, 1508–1514. [Google Scholar] [CrossRef]
  29. Andono, P.N.; Setiadi, D.R.I.M. Quantization selection based on characteristic of cover image for PVD Steganography to optimize imperceptibility and capacity. Multimed. Tools Appl. 2023, 82, 3561–3580. [Google Scholar] [CrossRef]
  30. Broumandnia, A. Two-dimensional modified pixel value differencing (2 D-MPVD) image steganography with error control and security using stream encryption. Multimed. Tools Appl. 2024, 83, 21967–22003. [Google Scholar] [CrossRef]
  31. Ernawan, F. An improved hiding information by modifying selected DWT coefficients in video steganography. Multimed. Tools Appl. 2024, 83, 34629–34645. [Google Scholar] [CrossRef]
  32. Melman, A.; Evsutin, O. Comparative study of metaheuristic optimization algorithms for image steganography based on discrete Fourier transform domain. Appl. Soft Comput. 2023, 132, 109847. [Google Scholar] [CrossRef]
  33. Sabeti, V.; Aghabagheri, A. Developing an adaptive DCT-based steganography method using a genetic algorithm. Multimed. Tools Appl. 2023, 82, 19323–19346. [Google Scholar] [CrossRef]
  34. Saeidi, Z.; Yazdi, A.; Mashhadi, S.; Hadian, M.; Gutub, A. High performance image steganography integrating IWT and Hamming code within secret sharing. IET Image Process. 2024, 18, 129–139. [Google Scholar] [CrossRef]
  35. Lin, S.; Huang, X. Advanced Research on Computer Education, Simulation and Modeling. In Proceedings of the Conference Proceedings CESM, Wuhan, China, 18–19 June 2011; Springer: Berlin/Heidelberg, Germany, 2011; p. 43. [Google Scholar]
  36. Kumar, V.; Kumar, D. A modified DWT-based image steganography technique. Multimed. Tools Appl. 2018, 77, 13279–13308. [Google Scholar] [CrossRef]
  37. Kavitha, S.; Varuna, S.; Ramya, R. A comparative analysis on linear regression and support vector regression. In Proceedings of the 2016 Online International Conference on Green Engineering and Technologies (IC-GET), Coimbatore, India, 19 November 2016; pp. 1–5. [Google Scholar]
  38. Savithri, G.; Mane, S.; Banu, J.S.; Vinupriya. Parallel Implementation of RSA 2D-DCT Steganography and Chaotic 2D-DCT Steganography. In Proceedings of the International Conference on Computer Vision and Image Processing, Roorkee, India, 9–12 September 2017; Springer: Singapore, 2017; pp. 593–605. [Google Scholar]
  39. Saidi, M.; Hermassi, H.; Rhouma, R.; Belghith, S. A new adaptive image steganography scheme based on DCT and chaotic map. Multimed. Tools Appl. 2017, 76, 13493–13510. [Google Scholar] [CrossRef]
  40. Kadhim, I.J.; Premaratne, P.; Vial, P.J.; Halloran, B. Comprehensive survey of image steganography: Techniques, Evaluations, and trends in future research. Neurocomputing 2019, 335, 299–326. [Google Scholar] [CrossRef]
  41. Rabie, T.; Kamel, I. High-Capacity Steganography: A Global-Adaptive-Region Discrete Cosine Transform Approach. Multimed. Tools Appl. 2016, 75, 6473–6493. [Google Scholar] [CrossRef]
  42. Sallee, P. Model-based steganography. In Proceedings of the International Workshop on Digital Watermarking, Seoul, Republic of Korea, 20–22 October 2003; Springer: Berlin/Heidelberg, Germany, 2003; pp. 154–167. [Google Scholar]
  43. Böhme, R.; Westfeld, A. Breaking Cauchy model-based JPEG steganography with first order statistics. In Proceedings of the European Symposium on Research in Computer Security, Sophia Antipolis, France, 13–15 September 2004; Springer: Berlin/Heidelberg, Germany, 2004; pp. 125–140. [Google Scholar]
  44. Chen, C.; Shi, Y.Q. JPEG image steganalysis utilizing both intrablock and interblock correlations. In Proceedings of the 2008 IEEE International Symposium on Circuits and Systems, Seattle, WA, USA, 18–21 May 2008; pp. 3029–3032. [Google Scholar]
  45. Yang, C.H.; Tsai, M.H. Improving histogram-based reversible data hiding by interleaving predictions. IET Image Process. 2010, 4, 223–234. [Google Scholar] [CrossRef]
  46. Parah, S.A.; Sheikh, J.A.; Akhoon, J.A.; Loan, N.A.; Bhat, G.M. Information hiding in edges: A high capacity information hiding technique using hybrid edge detection. Multimed. Tools Appl. 2016, 77, 185–207. [Google Scholar] [CrossRef]
  47. Qin, C.; Chang, C.C.; Hsu, T.J. Reversible data hiding scheme based on exploiting modification direction with two steganographic images. Multimed. Tools Appl. 2015, 74, 5861–5872. [Google Scholar] [CrossRef]
  48. Bai, J.; Chang, C.C.; Nguyen, T.S.; Zhu, C.; Liu, Y. A High Payload Steganographic Algorithm Based on Edge Detection. Displays 2017, 46, 42–51. [Google Scholar] [CrossRef]
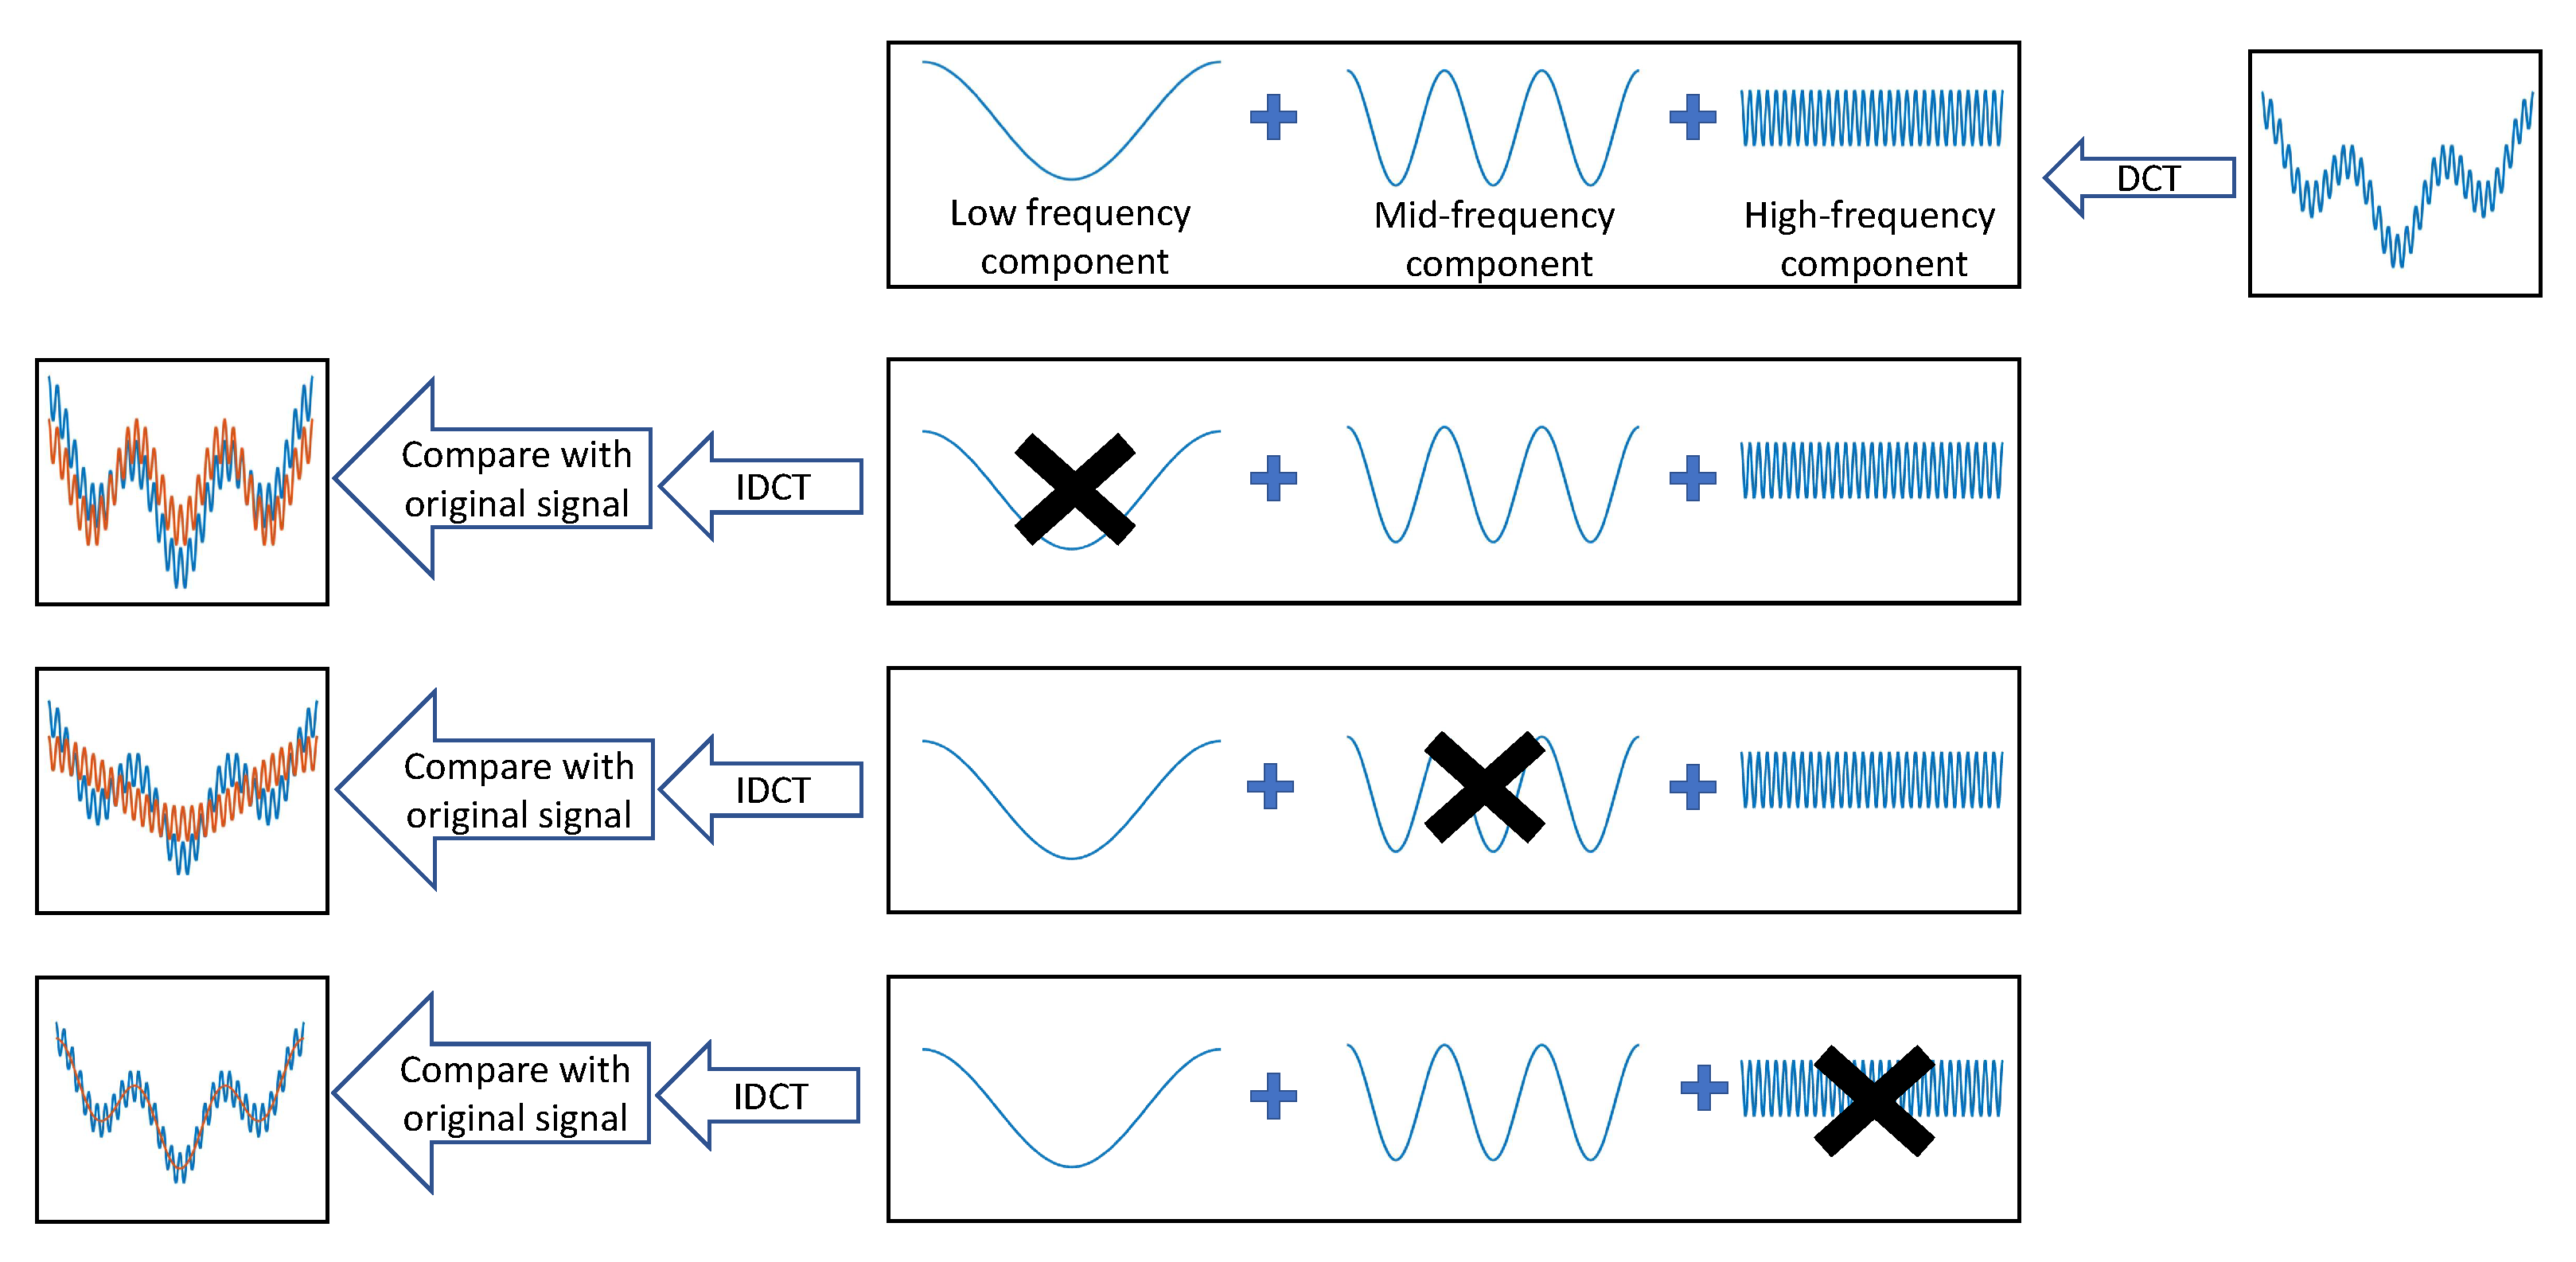
Figure 1. Image showing the significance of each DCT component.
Algorithms 17 00328 g001
Figure 2. Hiding methodology of the steganography scheme proposed in [22].
Algorithms 17 00328 g002
Figure 3. Hiding methodology of the proposed steganography scheme.
Algorithms 17 00328 g003
Figure 4. The embedding algorithm (column−by−column).
Algorithms 17 00328 g004
Figure 5. The embedding algorithm (zigzag version).
Algorithms 17 00328 g005
Figure 6. The first three images are used as cover images in our experiments: (a) Airplane, (b) Animal, (c) Vegetables while the final “Rose” image (d) is the secret image [22].
Algorithms 17 00328 g006
Figure 7. Attacking the stego image with salt and pepper attack with a density of 0.001 under different scale factor k values in the range [1–50]. (a) shows the PSNR values between the recovered and the original secret image. (b) shows the PSNR values between the cover and the stego image.
Algorithms 17 00328 g007
Figure 8. Attacking the stego image with salt and pepper attack with a density of 0.005 under different scale factor k values in the range [1–50]. (a) shows the PSNR values between the recovered and the original secret image. (b) shows the PSNR values between the cover and the stego image.
Algorithms 17 00328 g008
Figure 9. Tampering attack against 15% of the stego image (dimension percentage) under different scale values k in the range [1–50]. (a) shows the PSNR values between the recovered and the original secret image. (b) shows the PSNR values between the cover and the stego image.
Algorithms 17 00328 g009
Figure 10. Tampering attack against 50% of the stego image (dimension percentage) under different scale values k in the range [1–50]. (a) shows the PSNR values between the recovered and the original secret image. (b) shows the PSNR values between the cover and the stego image.
Algorithms 17 00328 g010
Figure 11. Results showing the extracted image after attacking the carrier image with salt and pepper attack using a density of 0.001. The experiment was conducted with different scaling factors k ranging from 1 to 20.
Algorithms 17 00328 g011
Figure 12. Results showing the extracted image after attacking the carrier image with salt and pepper attack using a density of 0.0001. The experiment was conducted with different scaling factors k ranging from 1 to 20.
Algorithms 17 00328 g012
Figure 13. Results showing the extracted image after tampering attack on the carrier image using an 80 × 80 block. The experiment was conducted with different scaling factors k ranging from 1 to 20.
Algorithms 17 00328 g013
Figure 14. Results showing the extracted image after tampering attack on the carrier image using a 256 × 256 block. The experiment was conducted with different scaling factors k ranging from 1 to 20.
Algorithms 17 00328 g014
Figure 15. Design of the CNN detector.
Algorithms 17 00328 g015
Figure 16. CNN steganalysis test on stego images generated using the proposed scheme.
Algorithms 17 00328 g016
Figure 17. CNN steganalysis test on stego images generated using the coefficient replacement hiding strategy.
Algorithms 17 00328 g017
Table 1. Comparison of the proposed hiding scheme with the coefficient replacement idea in terms of the capacity–transparency trade-off. The capacity is measured using bpp, while the transparency is evaluated using the PSNR values [22] when n = 2 .
  Coefficient
Replacement
Proposed
Block SizeCapacityCoverPSNRSSIMPSNRSSIMCost
Airplane41.800.985744.870.98580.75%
400 × 40014.67 bppAnimal25.400.994531.090.99730.75%
Vegetables31.450.994737.920.99640.75%
Airplane40.020.984543.460.97800.71%
425 × 42516.54 bppAnimal24.820.992629.180.99640.71%
Vegetables29.240.992636.500.99600.71%
Airplane38.910.967241.840.96860.67%
450 × 45018.54 bppAnimal23.850.989527.030.99530.67%
Vegetables27.220.987832.730.99420.67%
Airplane29.930.962838.420.96550.63%
475 × 47520.66 bppAnimal20.740.982023.940.99220.63%
Vegetables25.160.974430.910.99180.63%
Airplane23.360.791330.220.92300.60%
500 × 50022.89 bppAnimal17.330.953918.530.98010.60%
Vegetables18.910.956022.750.97390.60%
Table 2. Comparison of the proposed hiding scheme with the coefficient replacement idea in terms of the capacity–transparency trade-off. The capacity is measured using bpp, while the transparency is evaluated using the PSNR values [22] when n = 15 .
Coefficient
Replacement
Proposed
Block SizeCapacityCoverPSNRSSIMPSNRSSIMCost
Airplane41.800.985644.870.98584.00%
400 × 40014.65Animal25.400.994530.530.99744.00%
Vegetables31.450.994739.010.99644.00%
Airplane40.020.984543.720.98563.76%
425 × 42516.54Animal24.820.992629.050.99653.76%
Vegetables29.240.992636.600.99623.76%
Airplane38.910.967242.410.98393.56%
450 × 45018.54Animal23.850.989526.990.99553.56%
Vegetables27.220.987833.670.99443.56%
Airplane29.930.962838.640.97423.37%
475 × 47520.66Animal20.740.982023.450.99283.37%
Vegetables25.160.974431.100.99093.37%
Airplane23.360.791332.910.95323.20%
500 × 50022.89Animal17.320.953919.340.98413.20%
Vegetables18.910.956024.860.97893.20%
Table 3. Comparison of the proposed hiding scheme (zigzag version) with the coefficient replacement idea in terms of the capacity–transparency trade-off. The capacity is measured using bpp, while the transparency is evaluated using the PSNR values [22] when n = 15 .
Coefficient
Replacement
Proposed
Block SizeCapacityCoverPSNRSSIMPSNRSSIMCost
Airplane41.800.985745.090.98584.00%
400 × 40014.65Animal25.400.994531.200.99734.00%
Vegetables31.450.994737.670.99634.00%
Airplane40.020.984543.230.97763.76%
425 × 42516.54Animal24.810.992629.090.99643.76%
Vegetables29.240.992636.560.99593.76%
Airplane38.910.967241.610.96793.56%
450 × 45018.54Animal23.860.989526.880.99523.56%
Vegetables27.220.987832.890.99413.56%
Airplane29.930.962838.500.95623.37%
475 × 47520.66Animal20.740.982023.790.99223.37%
Vegetables25.160.974430.970.99063.37%
Airplane23.360.791329.100.91053.20%
500 × 50022.89Animal17.330.953919.120.98133.20%
Vegetables18.910.956024.070.97803.20%
Table 4. Comparison of the maximum bpp and PSNR values for different high stego quality methods. The highest bpp and PSNR values are highlighted in bold.
MethodbppPSNR (dB)
[46]4.8431.67
[47]3.4841.00
[45]9.6048.84
[20]12.1834.03
[16] (Max. dB)15.1735.00
[38]1.5025.00
[5]: CF-FB-GAR (Max. dB)19.5435.03
[5]: CF-QTAR (Max. dB)19.8835.02
[19]19.5032.00
[36]6.0045.34
Proposed Scheme n = 2 18.5441.84
Proposed Scheme n = 15 18.5442.41
Proposed Scheme n = 15 z i g z a g 18.5441.61
Table 5. Comparison of the maximum bpp and PSNR values for different high capacity methods. The highest bpp and PSNR values are highlighted in bold.
MethodbppPSNR (dB)
[48]14.3826.20
[18]20.2225.00
[41]20.8327.00
[16] (Max. bpp)21.0127.00
[5] CF-FB-GAR (Max. bpp)22.4328.49
[5] CF-QTAR (Max. bpp)22.7028.15
[19] (Max. bpp)19.3029.10
[19] (Max. bpp)19.5032.00
Proposed Scheme n = 2 22.8930.22
Proposed Scheme n = 15 22.8932.91
Proposed Scheme n = 15 z i g z a g 22.8929.10
Disclaimer/Publisher’s Note: The statements, opinions and data contained in all publications are solely those of the individual author(s) and contributor(s) and not of MDPI and/or the editor(s). MDPI and/or the editor(s) disclaim responsibility for any injury to people or property resulting from any ideas, methods, instructions or products referred to in the content.