Abstract
The main contribution of this paper is to present a simple algorithm that theoretically and numerically assesses the switching angles of an inverter operated with the SPWM technique. This technique is the most widely used for eliminating harmonics in DC-AC converters for powering motors, renewable energy applications, household appliances, etc. Unlike conventional implementations of the SPWM technique based on the analog or digital comparison of a sinusoidal signal with a triangular signal, this paper mathematically performs this comparison. It proposes a simple solution to solve the transcendental equations arising from the mathematical analysis numerically. The technique is validated by calculating the total harmonic distortion (THD) of the generated signal theoretically and numerically, and the results indicate that the calculated angles produce the same distribution of harmonics calculated analytically and numerically. The algorithm is limited to single-phase inverters with unipolar SPWM.
1. Introduction
Currently, there has been substantial growth in electricity generation through solar energy, which has led to the development of inverters that convert photovoltaic energy generated in direct current (DC) to alternating current (AC) that can be injected into the main power grid [1]. On the other hand, there has also been an increase in works on inverters that power the motors of electric vehicles [2]. In both cases, the management of the inverter is very relevant, but above all, its modulation techniques have been known since 1973 [3]. There are several algorithms to implement in the inverter modulation techniques such as space vector pulse width modulation (SVPWM), selective harmonic elimination pulse width modulation (SHEPWM), sinusoidal pulse width modulation (SPWM), and wavelet modulation [4,5,6,7,8,9,10,11]. However, one of the most widely used is SPWM due to the ease of implementation [8,10,11,12,13,14,15,16,17,18]. The SPWM technique can be implemented using analog or digital sampling. Analog implementation is called natural sampling, and digital techniques are called regular sampling [5,6,8,10,15]. The analog implementation is very easy, as it only requires comparing a sinusoidal signal with a triangular signal using an op-amplifier, and the resulting signal can be applied to the inverter switches. It is important to clarify that this work is limited to single-phase inverters, which are widely used as microinverters in single-phase systems. But the algorithm shown can be easily scaled to three-phase systems.
There are two cases for the comparison: unipolar and bipolar modulation [3,19]. Only the unipolar modulation will be analyzed, since this modulation presents lower THD. The unipolar modulation is shown in Figure 1.
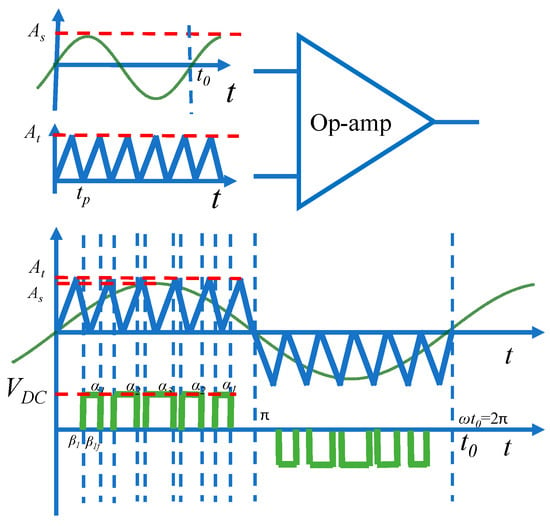
Figure 1.
Analog implementation of the unipolar SPWM with an op-amp. First signal: sinusoidal signal, second: triangular signal, third: output of the Op-amp, fourth: SPWM signal in the output of the inverter.
Figure 1 shows the unipolar SPWM technique. A comparison is made between a sinusoidal signal and a triangular signal; the amplitude of the sine signal is As with a frequency fc = 1/tp, where tp is its period, and the amplitude of the triangular signal is At. with a frequency f0 = 1/t0 where t0 is its period. For convenience, switching times are expressed in angles rather than in time; both are related by angular frequency . The period of the sinusoidal signal t0 represents an angle of 2π. When the sine signal is greater than the triangular signal (angle β1), the output of the inverter changes to a “high” state equal to the voltage that feeds the inverter (VDC), and when the sine signal becomes less than the triangular signal, the output signal of the inverter changes to a “low” state where the output voltage is 0 V (angle β1f). The duration of the pulse will be given by subtracting the rising and falling angles (α1 = β1f − β1). By symmetry, the angles corresponding to the negative half-cycle are obtained by adding 180 degrees (π radians) to the angles obtained in the positive half-cycle.
Among the drawbacks of natural sampling are the generation of sine and triangular signals, noise or interference problems, and the lack of versatility in reconfiguring parameters.
Digital implementation solves many of the problems of natural sampling. However, one of the main drawbacks is that evaluating switching angles involves solving transcendental equations that do not have an analytical solution [20].
The main contribution of this work is the proposal of a very simple numerical solution to the transcendental equations. The proposed solution is developed using an algorithm that assess the angles of the SPWM technique. The solution is proposed for unipolar SPWM and single-phase inverters. However, it can be easily extrapolated to three-phase and multi-level inverters. The proposed algorithm can be easily implemented on different platforms such as a microcontroller, a Raspberry Pi or an FPGA. The evaluation of the switching angles can be adjusted for any frequency of the triangular signal allowed by the device on which it will be implemented. The higher the switching frequency of the carrier signal, the greater the displacement of the generated harmonics and the lower the THD that can be achieved.
The algorithm was implemented in MATLAB and verified by evaluating the output signal’s total harmonic distortion (THD). The THD obtained in the results validated the proposed algorithm; the algorithm and the obtained angles can be digitally implemented in any simple processor like a microcontroller or a Raspberry Pi.
The rest of this article is organized as follows: Section 2 shows the assessment of the SPWM angles, and in Section 3, the results for two cases are presented, one simple case with a unitary output frequency of fo = 1 Hz and a carrier frequency of fc = 12 to obtain p = 5 pulses in a half cycle, and a second more practical case proposed to avoid the presence of harmonics until the harmonic 49 to show the possibility of complying with this standard. In the second case, a unitary frequency fo = 1 Hz and a carrier frequency of fc = 48 to obtain p = 23 pulses in a half cycle were proposed. Section 4 briefly discusses the results, and the conclusions are outlined in Section 5.
2. Assessment of the SPWM Angles
As shown in Figure 1, the unipolar sinusoidal pulse width modulation (SPWM) technique involves sampling a sinusoidal signal using one positive triangular signal for the positive semi-cycle and one negative triangular signal for the negative semi-cycle of the sinusoidal signal. The sinusoidal signal acts as a reference to obtain the desired sine wave signal, which in many cases is a 60 Hz network signal. The triangular signal, which operates at a considerably higher frequency than the original sine signal, compares and generates pulses that determine the necessary cuts (β and βf) in the inverter signal. This process is performed by comparing amplitudes between the sine and triangular signals: when the sine signal exceeds the triangular signal, a pulse representing an α angle is generated, indicating the cutoff points in the inverter signal. These cutoffs (β and βf), calculated by this comparison, allow the resulting square waveform to resemble a sine signal in key areas. In this way, the unipolar SPWM effectively modulates the signal using the high-frequency triangular signals’ reference.
2.1. Basic Definitions
The SPWM technique requires several important parameters for its correct application. First, we need a sinusoidal signal with an amplitude designated as As (see Figure 1) and a frequency of usually 60 Hz.
Another parameter is the amplitude of the triangular signal, represented by At, which is the maximum value reached by this signal. From these definitions, we can calculate the modulation index (M), which is the ratio between the amplitude of the sine signal and the amplitude of the triangular signal, which is expressed by the following equation:
One of the key parameters in the SPWM technique is the modulation index (). It is crucial to keep this value less than 1 to avoid overmodulation, which can negatively affect system performance. Overmodulation can lead to distortion in the output waveform, reducing the efficiency and accuracy of the modulation process.
The ratio between the frequency of the sine signal fo and the frequency of the triangular signal fc, also known as the carrier frequency, is the frequency modulation ratio (mf) shows in Equation (2). Proper tuning of these frequencies is essential for efficient and accurate modulation.
In addition, it is important to know the number of triangular pulses per half-cycle pt, which the following expression can calculate:
Hence, pt represents the number of triangular pulses per half-cycle. Since pt is based on frequency modulation, we can substitute / and express it as
To maintain ¼-wave symmetry, pt must be even
Having obtained the number of triangular pulses per half-cycle, it is relevant to calculate the total number of output pulses per half-cycle p, which is obtained by the following expression:
This expression indicates that the number of pulses equals the number of triangular pulses minus one. By considering pt to be half of the frequency modulation, we can rewrite the expression as
Also, to maintain ¼ wave symmetry, p must be odd.
These equations are fundamental to understanding and controlling the comparison process between the triangular signal and the sinusoidal signal in the SPWM technique.
Another condition is to have a unipolar signal for each half-cycle with quarter-wave symmetry with the largest pulse centered at . If these conditions are satisfied, it is possible to reduce the harmonics.
Meeting these conditions not only reduces unwanted components but also simplifies the process. With this specific quarter-wave symmetry, it is not necessary to calculate all the pulses but only the angles present in a quarter-wave, since these will be replicated throughout the period.
The number of angles required for a quarter-wave is calculated using the following expression:
is the number of angles for a quarter-wave, and pt is the number of triangular pulses.
2.2. Mathematical Definition of the Triangular Signal
In the unipolar SPWM technique, a triangular signal must be compared with a sinusoidal signal to obtain the required angles to form the output pulses. This comparison can be made analogically or digitally; devices are designed for both modes. However, digital evaluation presents the advantage of reconfiguring in real time the parameters of the SPWM, and it is not necessary to generate the triangular and sinusoidal signals, so it is easy to implement the algorithm in a microcontroller or microcomputer like a Raspberry Pi.
Before calculating the required pulses, the triangular signals must be defined mathematically. These signals are represented as two straight lines: one with a positive slope named “y” and one with a negative slope named “y’”, and both lines are shown in Figure 2.
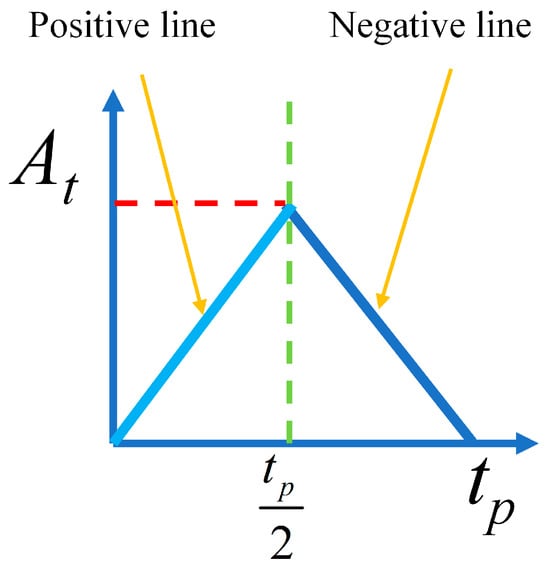
Figure 2.
Triangular signal lines; the positive line is named “y” and negative line is named “y’”.
As shown in Figure 2, an important aspect is that these lines form a symmetrical triangle, preferably isosceles, with an amplitude At, and the pulse width of the signal pt is symmetrical on both sides of the triangle. In addition, the positive and negative lines forming the triangular signal must have the same slope, thus ensuring perfect symmetry. In this context, the midpoint of the pulse width pt will be located at , which would be the midpoint of our signal.
Once the amplitude At and the pulse width tp of the triangular signal are defined, we can obtain the slope equation, since straight lines form these signals. The slope is calculated as the ratio of the opposite leg to the adjacent leg in the triangle formed. Since the opposite leg is , the slope equation is expressed as
where m represents the slope of the positive line; to express the positive line (y) as a function of time t, we can use the following equation:
Continuing with the negative line, the slope is negative and is expressed as
From the typical expression of one straight line, by clearing b to obtain the ordinate to the origin, we obtain the equation for the negative line (y’):
These mathematical expressions represent the positive and negative lines of the triangular signal. However, these equations are only valid for one triangular pulse. Additional equations that consider repeating patterns over time are necessary to deal with a number “nt” of pulses, as shown in Figure 3.
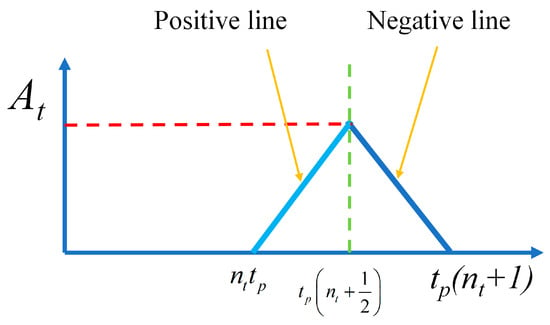
Figure 3.
The triangle for nt pulse.
The equations must be simplified to obtain the expressions for the nt triangle, starting from nt = 0. We start at a time multiple of the triangle pulse width called nttp where nt represents the nth pulse of a time tp. The end of this nt pulse is calculated by summing the pulse width tp, resulting in
It is important to remember the importance of obtaining the midpoint of the triangular pulse, which is expressed as
Once these points are obtained, we define the amplitude At, which remains constant, and the slope, which does not vary. Substituting these new equations into the positive slope in Equation (11), we obtain the expression for the nth positive line ynt:
Similarly, for the equation of the negative line ynt’,
The triangular signal is compared with the sinusoidal signal using these mathematical expressions for the positive and negative lines for each term “n”. This comparison with the sine signal and the respective positive and negative lines is shown in Figure 4.
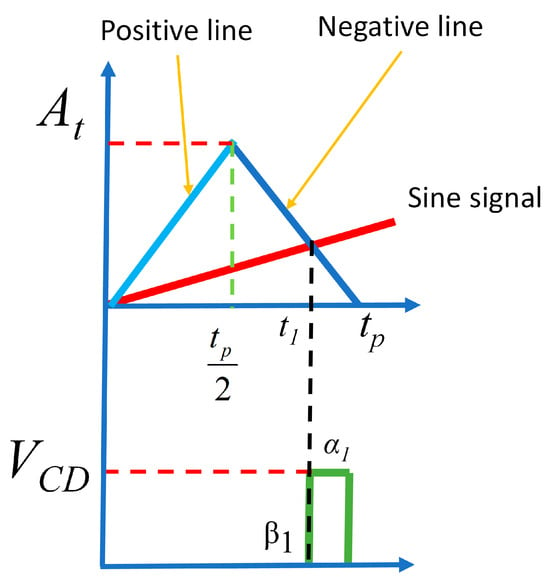
Figure 4.
Obtention of the first angle (β1) of the comparison between the triangle signal and sine signal.
In Figure 4, the sine signal is highlighted in red. It appears to be a straight line due to the considerable difference in frequency concerning the triangular signal. Although in more realistic models, the sine signal is not represented as a straight line, for practical purposes, it is simplified to facilitate the identification of the intersection point with the positive line. It is important to note that this intersection point coincides with the equation previously defined for the positive line.
By identifying the point of intersection between the triangular pulse signal and the sinusoidal signal, the start of the pulse is identified and expressed in angles for clarity and simplicity. This time expressed in angles is denoted as , corresponding to the beginning of the first pulse α1 of the inverter signal.
This first angle, where the signal intersects the negative line, is defined in time as . The mathematical expressions of the sine signal are equated with the equation of the corresponding line, in this case, the equation of the negative line, obtaining the following equation:
Here, for the sinusoidal signal, As represents the amplitude, is the carrier frequency (commonly 60 Hz), and t1 is when the first pulse becomes active, i.e., where the sine and straight line intersect (see Figure 4). However, solving t1 directly is complicated, because this equation is a transcendental function in which the variable cannot be explicitly cleared. Therefore, in this work, the use of numerical or graphical methods to obtain t1 is proposed.
To solve (16) numerically, this equation is equated to zero, and the following expression is obtained:
This can be simplified to
The point at which this equation becomes zero is the time t1, which corresponds to angle β1 for the first pulse (upstream pulse). A similar procedure is performed to obtain the downstream pulse, but the sine signal is compared to the positive straight line, as shown in Figure 5.
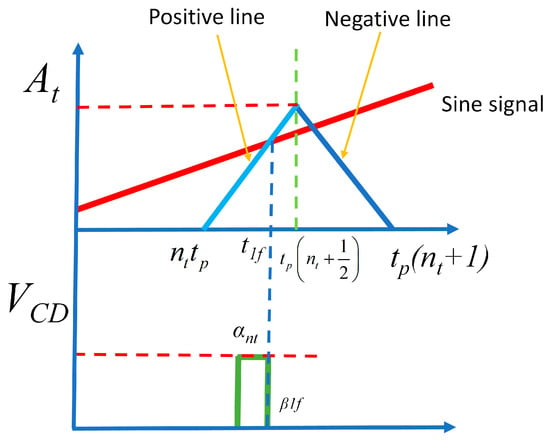
Figure 5.
Comparison for downstream angle (β1f).
Therefore, the following equation is obtained:
where t1f is the final time of the pulse, and is the final angle corresponding to the time t1f. Like the previous equation, it is equated to zero, obtaining the following equations:
2.3. Numerical Evaluation of the Angles
As can be seen in Figure 4 and Figure 5, the values of t1 and t1f are within the range . Therefore, it is possible to define a sampling range named dm.
The solution of Equations (18) and (21) will always be in this sampling range. To find the solution, the sampling range is divided into Ns samples, and Equations (18) and (21) are evaluated for each sample. The value closest to zero will be considered the equation’s solution. The greater the samples’ Ns, the more accurate the solution to the equation will be. The precision is sufficient for this application with Ns = 10, but it is possible to use greater values.
The sampling vector for the positive slope is
The sampling vector for the negative slope is
Once the times t1 and t1f are obtained for the first pulse, the angles can be calculated with the following expressions:
where is the angular frequency and is the width of the first pulse, which, as seen in the equation, is the subtraction of minus . However, this process must be repeated for each triangular pulse signal.
The complete algorithm for angle calculation is detailed in the flowchart of Figure 6.
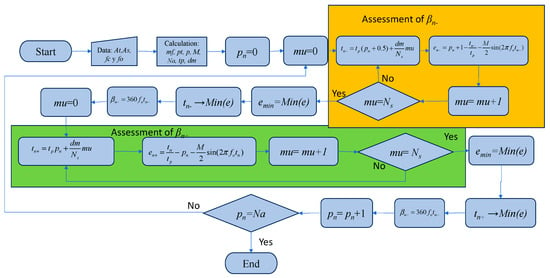
Figure 6.
Angle calculation algorithm.
In this flowchart, mu represents one of the vector’s M and M′ components. The process is as follows: first, the specifications are defined, and the main variables are calculated after the first angle of the negative slope line is evaluated (β1). For this, the times (tn−) for each component of vector M′ are obtained, and Equation (18) is an assessment for each one, generating the error vector (en−). Then, the minimum value of vector en− is obtained (emin) after the value of time (t1−) corresponding to this emin is obtained with the corresponding angle value β1. Subsequently, the same process is undertaken to assess the final angle of the first pulse (β1f), resolving Equation (21) using the solutions vector M. The process continues for each pulse until the pulse Na. The algorithm assesses the pulse for only one quarter of the wave, since the rest of the angles are evaluated for symmetry.
3. Results
The main objective of our work is to establish an initial proof of concept of the proposed algorithm. Using single-phase inverters, we simplified the model and concentrated on validating the algorithm’s fundamental principles without introducing the additional complexity involved in three-phase systems. This initial approach is essential to identifying and solving basic problems before scaling to more complex systems.
Furthermore, the principles and methodology of the proposed algorithm are directly applicable to three-phase systems, although they are not explicitly realized in this work. The transition from single-phase to three-phase systems typically involves phase shifting the modulation signals, which is a straightforward extension once the single-phase system proves effective.
3.1. Case I. Application with a Frequency Modulation mf = 12
Two examples were developed to assess the algorithm’s efficacy: A simple example was performed to observe the behavior and test the previously established equations. Table 1 was generated to determine the important initial parameters that do not require additional calculations.

Table 1.
Initial parameters.
Having these initial parameters, we use the equations previously seen to calculate the other relevant parameters shown in Table 2.

Table 2.
Important calculated parameters.
Table 2 shows that only three angles must be calculated for this example. The period of the triangular signal , which represents the duration of the signal, is the inverse of its frequency , resulting in 0.083 s. Thus, the following angles were obtained and are shown in Table 3.

Table 3.
Angles obtained by the algorithm.
Here, and , respectively. As can be seen in Table 3, these are angles for a quarter-cycle. To calculate the remaining angles at the half-cycle, subtract 180 minus the angle obtained. For of a cycle, 180 is added to the obtained angles. For the final angles, subtract 360 minus the obtained angles, resulting in Table A1 of Appendix A. These angles calculated in Table 3 and Table A1 can be used to construct the PWM signal. Each angle obtained represents the time the signal state should be changed, either up or down, as shown in Figure 7. The obtained signal is compared in this figure with the sinusoidal fundamental component in the Fourier series.
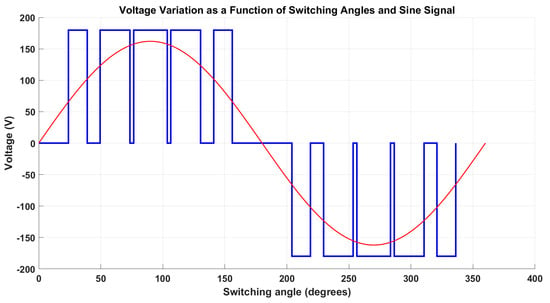
Figure 7.
Application of the calculated switching angles (blue) compared with the sinusoidal fundamental component (red).
3.2. Fourier Series Decomposition of Case I
An important aspect when obtaining this signal is to evaluate how close our generated square signal is to the sinusoidal signal. For this, it is necessary to calculate the Fourier series corresponding to the waveform obtained. Since our signal is quarter-wave symmetry, the coefficients and of the Fourier series are equal to zero, which leaves only the coefficient . The equation to calculate this coefficient would be
where is the dc voltage feeding the inverter, n represents the odd harmonics, represents the angles corresponding to the positive pulses, represents the angles corresponding to the negative pulses, and is the last angle calculated for a quarter-wave. In this case, being three pulses, the equation would be simplified as follows:
With Equation (30), we can calculate the total harmonic distortion (THD) up to the 49th harmonic to evaluate the quality of our signal concerning the sine wave, obtaining the following THD equation:
Thus, the following graph is obtained, as shown in Figure 8.
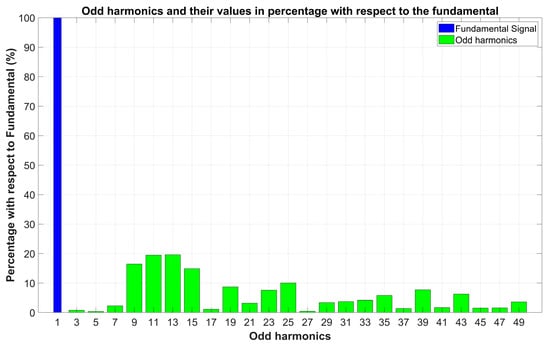
Figure 8.
Odd harmonics and their percentage concerning the fundamental component.
Figure 8 shows the harmonics up to harmonic 49, where the first harmonic is in blue, and the odd harmonics are in green. These harmonics are expressed in percentage and normalized concerning the first harmonic, which has a value of 100%. It is observed that the most significant and largest harmonics will appear on the opposite sides of the carrier frequency, which in this case is 12. The largest harmonics are in 11th and 13th place, gradually decreasing to the ninth and fifteenth. The 11th and 13th harmonics are about 20% of the fundamentals, while the ninth and fifteenth are about 17% and 18%. From these harmonics onwards, the other harmonics decrease in amplitude. The largest harmonics, always appearing on the sides of the carrier frequency, are the ones of interest to eliminate. This can be achieved by placing a filter at the output, which will significantly reduce their amplitude and improve the efficiency and cost of the system. An important parameter to calculate is the THD, which is the sum of the squares of all harmonics up to 49, according to IEEE 519. In this case, the THD obtained is 52.63%.
The obtained results are congruent with the characteristic behavior of the natural or digital SPWM [8]. Therefore, the behavior validates the assessment of the proposed algorithm.
3.3. Case II. Application with a Frequency Modulation mf = 48
Another example was developed with a higher carrier frequency fc to apply the algorithm to a more realistic scenario. In the SPWM technique, the harmonics will be displaced to the harmonic corresponding to the frequency modulation mf; with mf = 48, the harmonics will be displaced to harmonic 49. A small passive LC filter can eliminate the harmonics in this range. Therefore, the THD will reduce considerably complying with IEEE 519 standard. Therefore, a new scenario has been proposed that simulates a more rigorous situation aligned with current standards, where the proposed technique’s response to a higher number of harmonics is thoroughly evaluated.
This new case has been specifically designed to comply with the requirements established by the IEEE 519 standard, which establishes rigorous limits for harmonics present in electrical systems. According to the standard, the main objective of this additional analysis is to verify the technique’s ability to maintain the THD within acceptable limits even when considering harmonics up to number 50.
To achieve this goal, a detailed analysis of the switching angles and the resulting signal has been carried out, ensuring that the requirements established by the regulations are met. It is important to highlight that the main focus of this new case is to ensure that the THD remains within the acceptable limits set by the regulations, even considering a higher number of harmonics.
The specifications for this case are the follows:
Table 4 shows the main specifications illustrated in Fig. 1 and the proposed number of samples Ns. Table 5 shows the rest of the parameters to be calculated from the specifications of Table 4.

Table 4.
Initial parameters.

Table 5.
Important calculated parameters.
The results and detailed analysis for this new case are presented below. The technique’s effectiveness will be evaluated in a more demanding context and closer to real operating conditions. The algorithm was modified to calculate the angles corresponding to the new case, ensuring that the output would not present harmonics before harmonic 50, as previously mentioned. As a result of this adaptation, the specific angles for this case were obtained, which are detailed in Table A2 in Appendix A.
The data presented in Table A2 illustrate an increase in the required angles to generate harmonics on the sides of the 50th harmonic (23 angles were obtained). The corresponding signal generated by these angles is depicted in Figure 9, providing evidence of the algorithm’s efficiency in determining the angles necessary for this new case.
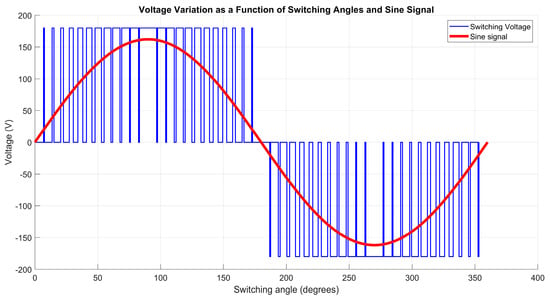
Figure 9.
Output signal with frequency modulation mf = 48 (blue signal), fundamental harmonic (red signal).
As mentioned, assessing the signal’s harmonic content is relevant because it introduces more angles and pulses, ultimately affecting the total harmonic distortion (THD) and harmonic values. The THD analysis acquired is presented in Figure 10, indicating that the most significant harmonics now appear on the opposite sides of the carrier frequency 50, specifically at harmonics 49 and 47, with 22% and 16%, respectively. Notably, the harmonics before these exhibit a practically null percentage, around 0%.
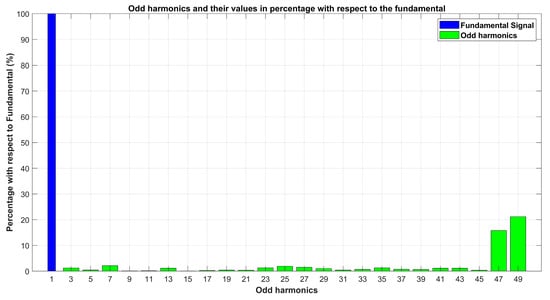
Figure 10.
Odd harmonics and their percentage concerning the fundamental harmonic.
One way to reduce harmonic distortion is to incorporate a filter at the output, which reduces the amplitude of these harmonics [21], ultimately enhancing system efficiency. The THD obtained for this case was 34.20%, significantly improving over the previous scenario with fewer angles. This indicates a successful algorithm adaptation to comply with IEEE 519 and provide favorable signal quality and system efficiency results.
4. Discussion
Traditionally, the digital sampling of the SPWM technique has consisted of the digital generation of the triangular and sinusoidal signals; the obtained lists occupy a considerable amount of memory and require relatively sophisticated devices such as FPGAs [8,9,10,13,17]. The proposed algorithm allows direct calculation of the switching angles without the need for digital comparison of the triangular and sinusoidal signals. This allows for reducing the use of memory, and the simplicity of the algorithm allows its implementation in low-cost processors such as generic microcontrollers or microcomputers like Raspberry Pi.
The evaluation of THD in the presented cases demonstrated the validity of the proposed algorithm to evaluate theoretically and numerically the switching angles originated by the SPWM technique.
The proposed algorithm is simple and can be easily reconfigurable by changing the initial conditions such as the frequency modulation index mf, which allows the elimination of harmonics up to a value determined by the switching speed of the processor used. For example, when mf = 100, the digitally SPWM will eliminate the harmonics until harmonic 100.
The accuracy in assessing the angles depends on the number of samples Ns; the greater the number of samples, the greater the accuracy. For the analyzed cases, 10 samples were sufficient.
Digitally, SPWM presents more robustness than the natural SPWM; its implementation is more economical and smaller. The reconfiguration capability gives it more flexibility.
5. Conclusions
This paper presented an algorithm to assess the switching angles in SPWM inverters with a simple algorithm that includes theoretical and numerical calculus. The algorithm starts from the theoretical evaluation of the zero crossings of the triangular signal and the reference sinusoidal signal. The resulting transcendental equation is solved numerically by obtaining the minimum value of a series of previously defined samples. The algorithm is validated by obtaining the THD of the generated signal. Two cases are considered, one with a frequency modulation of 12 to test the algorithm and the other more practical, with a frequency modulation of 48. The results show that the harmonics obtained coincide with those obtained with the natural SPWM, validating the theoretical calculations.
The initial specifications can be easily changed to shift the generated harmonics to frequencies as high as supported by the device in which the algorithm is implemented. This allows for reducing the same proportion that the L or LCL filter required to filter the high-frequency harmonics, decreasing the cost and volume of the inverter.
The proposed algorithm is limited to single-phase systems and unipolar SPWM, but it can easily be applied to three-phase systems.
Author Contributions
Conceptualization, M.P.-S., C.C.-G. and J.A.-A.; methodology, M.P.-S., Ó.S.-V., S.E.D.L.-A. and J.A.-A.; software, Ó.S.-V., C.C.-G., S.E.D.L.-A.; validation, M.P.-S., Ó.S.-V., C.C.-G. and J.A.-A.; formal analysis, M.P.-S., Ó.S.-V., C.C.-G. and J.A.-A.; investigation, M.P.-S., C.C.-G., J.A.-A. and S.E.D.L.-A.; resources, M.P.-S., J.A.-A. and S.E.D.L.-A.; data curation, Ó.S.-V., J.A.-A. and S.E.D.L.-A.; writing—original draft preparation, M.P.-S., Ó.S.-V.; writing—review and editing, M.P.-S., Ó.S.-V., C.C.-G. and S.E.D.L.-A.; visualization, J.A.-A. and S.E.D.L.-A.; supervision, M.P.-S., C.C.-G., and S.E.D.L.-A.; project administration, M.P.-S., J.A.-A. and S.E.D.L.-A.; funding acquisition, M.P.-S., J.A.-A. and S.E.D.L.-A. All authors have read and agreed to the published version of the manuscript.
Funding
This research received no external funding.
Data Availability Statement
No new data were created or analyzed in this study. Data sharing is not applicable to this article.
Conflicts of Interest
The authors declare no conflicts of interest.
Appendix A
Table A1 shows the calculation of the complementary angles, including the respective angles and the way they were taken.

Table A1.
Complementary angles.
Table A1.
Complementary angles.
| Half-Cycle Angles | -Cycle Angles | Full-Cycle Angles | |||
|---|---|---|---|---|---|
Table A2 shows the 23 angles obtained for a quarter-wave so that the signal has no harmonics up to the 50th harmonic.

Table A2.
Angles obtained for case 2.
Table A2.
Angles obtained for case 2.
| Angles | Value |
|---|---|
| 6.84° | |
| 7.56° | |
| 13.68° | |
| 15.12° | |
| 20.52° | |
| 22.68° | |
| 27.36° | |
| 30.6° | |
| 34.2° | |
| 38.16° | |
| 41.04° | |
| 45.36° | |
| 47.88° | |
| 52.92° | |
| 55.08° | |
| 60.48° | |
| 61.92° | |
| 67.68° | |
| 69.12° | |
| 75.24° | |
| 75.96° | |
| 82.44° | |
| 83.16° |
References
- Bughneda, A.; Salem, M.; Richelli, A.; Ishak, D.; Alatai, S. Review of Multilevel Inverters for PV Energy System Applications. Energies 2021, 14, 1585. [Google Scholar] [CrossRef]
- Poorfakhraei, A.; Narimani, M.; Emadi, A. A Review of Multilevel Inverter Topologies in Electric Vehicles: Current Status and Future Trends. IEEE Open J. Power Electron. 2021, 2, 155–170. [Google Scholar] [CrossRef]
- Patel, H.S.; Hoft, R.G. Generalized Techniques of Harmonic Elimination and Voltage Control in Thyristor Inverters: Part I--Harmonic Elimination. IEEE Trans. Ind. Appl. 1973, IA-9, 310–317. [Google Scholar] [CrossRef]
- Saleh, S.A.; Rahman, M.A. Development and Testing of a New Controlled Wavelet-Modulated Inverter for IPM Motor Drives. IEEE Trans. Ind. Appl. 2010, 46, 1630–1643. [Google Scholar] [CrossRef]
- Hamman, J.; Merwe, F.S.v.d. Voltage harmonics generated by voltage-fed inverters using PWM natural sampling. IEEE Trans. Power Electron. 1988, 3, 297–302. [Google Scholar] [CrossRef]
- Enjeti, P.N.; Ziogas, P.D.; Lindsay, J.F. Programmed PWM techniques to eliminate harmonics: A critical evaluation. IEEE Trans. Ind. Appl. 1990, 26, 302–316. [Google Scholar] [CrossRef]
- Hosseini, S.H.; Sadigh, A.K.; Barakati, S.M.; Kangarlu, M.F. Comparison of SPWM technique and selective harmonic elimination using genetic algorithm. In Proceedings of the 2009 International Conference on Electrical and Electronics Engineering-ELECO 2009, Bursa, Turkey, 5–8 November 2009; pp. I-278–I-282. [Google Scholar]
- Muñoz-Ramírez, M.; Valderrama-Blavi, H.; Rivera, M.; Restrepo, C. An Approach to Natural Sampling Using a Digital Sampling Technique for SPWM Multilevel Inverter Modulation. Energies 2019, 12, 2925. [Google Scholar] [CrossRef]
- Zhang, Z.; Wang, P. Research and Implementation of Natural Sampling SPWM Digital Method for Three-Level Inverter of Photovoltaic Power Generation System Based on FPGA. IEEE Access 2019, 7, 114449–114458. [Google Scholar] [CrossRef]
- Noorsal, E.; Rongi, A.; Ibrahim, I.R.; Darus, R.; Kho, D.; Setumin, S. Design of FPGA-Based SHE and SPWM Digital Switching Controllers for 21-Level Cascaded H-Bridge Multilevel Inverter Model. Micromachines 2022, 13, 179. [Google Scholar] [CrossRef]
- Suresh, K.; Parimalasundar, E. A Modified Multi Level Inverter with Inverted SPWM Control. IEEE Can. J. Electr. Comput. Eng. 2022, 45, 99–104. [Google Scholar] [CrossRef]
- Li, F.; Xiong, R.; Zhang, R. A novel sampling method of SPWM with nonsymmetrical rules. In Proceedings of the 2008 3rd IEEE Conference on Industrial Electronics and Applications, Singapore, 3–5 June 2008; pp. 1503–1506. [Google Scholar]
- Renge, M.; Suryawanshi, H.; Chaudhari, M. Digitally Implemented Novel Technique to Approach Natural Sampling SPWM. EPE J. 2010, 20, 13–20. [Google Scholar] [CrossRef]
- Ismail, M.A.; Fadzail, N.F. Mathematical Formulation of Multilevel Voltage Source Inverter Switching Instants. Appl. Mech. Mater. 2015, 793, 216–221. [Google Scholar] [CrossRef]
- Kumar, M.; Gupta, R. Sampling Effect Characterization of Digital SPWM of VSI in Time Domain. IEEE Trans. Ind. Electron. 2016, 63, 4150–4159. [Google Scholar] [CrossRef]
- Jiao, N.; Wang, S.; Liu, T.; Wang, Y.; Chen, Z. Harmonic Quantitative Analysis for Dead-Time Effects in SPWM Inverters. IEEE Access 2019, 7, 43143–43152. [Google Scholar] [CrossRef]
- Sarker, R.; Datta, A.; Debnath, S. FPGA-Based High-Definition SPWM Generation with Harmonic Mitigation Property for Voltage Source Inverter Applications. IEEE Trans. Ind. Inform. 2021, 17, 1352–1362. [Google Scholar] [CrossRef]
- Ye, J.; Huang, S.; Liu, L.; Li, L.; Xu, J.; Shen, A. Accurate Harmonic Calculation for Digital SPWM of VSI with Dead-Time Effect. IEEE Trans. Power Electron. 2021, 36, 7892–7902. [Google Scholar] [CrossRef]
- Rashid, M.H. Power Electronics Handbook; Butterworth-Heinemann: Oxford, UK, 2017. [Google Scholar]
- Zheng, C.; Zhang, B.; Qiu, D. Digital Natural Sampling SPWM based on Inverse Operator Method. In Proceedings of the 2007 IEEE Power Electronics Specialists Conference, Orlando, FL, USA, 17–21 June 2007; pp. 792–797. [Google Scholar]
- Adamas-Pérez, H.; Ponce-Silva, M.; Mina-Antonio, J.D.; Claudio-Sánchez, A.; Rodríguez-Benítez, O. Assessment of Energy Conversion in Passive Components of Single-Phase Photovoltaic Systems Interconnected to the Grid. Electronics 2023, 12, 3341. [Google Scholar] [CrossRef]
Disclaimer/Publisher’s Note: The statements, opinions and data contained in all publications are solely those of the individual author(s) and contributor(s) and not of MDPI and/or the editor(s). MDPI and/or the editor(s) disclaim responsibility for any injury to people or property resulting from any ideas, methods, instructions or products referred to in the content. |
© 2024 by the authors. Licensee MDPI, Basel, Switzerland. This article is an open access article distributed under the terms and conditions of the Creative Commons Attribution (CC BY) license (https://creativecommons.org/licenses/by/4.0/).