Abstract
Cervical cancer ranks among the leading causes of mortality in women worldwide, underscoring the critical need for early detection to ensure patient survival. While the Pap smear test is widely used, its effectiveness is hampered by the inherent subjectivity of cytological analysis, impacting its sensitivity and specificity. This study introduces an innovative methodology for detecting and tracking precursor cervical cancer cells using SIFT descriptors in video sequences captured with mobile devices. More than one hundred digital images were analyzed from Papanicolaou smears provided by the State Public Health Laboratory of Michoacán, Mexico, along with over 1800 unique examples of cervical cancer precursor cells. SIFT descriptors enabled real-time correspondence of precursor cells, yielding results demonstrating 98.34% accuracy, 98.3% precision, 98.2% recovery rate, and an F-measure of 98.05%. These methods were meticulously optimized for real-time analysis, showcasing significant potential to enhance the accuracy and efficiency of the Pap smear test in early cervical cancer detection.
1. Introduction
Cervical cancer is the fourth most common type of cancer among women worldwide, with an approximate incidence of 660,000 new cases and 350,000 deaths in 2022 [1]. The highest incidence and mortality rates for cervical cancer are recorded in low- and middle-income countries. This situation reflects significant inequalities stemming from the lack of access to national HPV (human papillomavirus) vaccination services, as well as cervical cancer screening and treatment, and is influenced by social and economic determinants [1].
Rates have decreased in most regions of the world over the past decades due to rising socioeconomic levels, reduced risk of persistent HPV infection, and ongoing early detection activities. In Mexico, as of 2020, cervical cancer is the second most diagnosed and the second leading cause of death among women, with an estimated 9439 new cases and 4335 deaths. The incidence rate is 12.6 and the mortality rate is 5.7 per 100,000, although a significant decrease in incidence has been observed compared with that 2012 [2]. In 2021, the Mexican Institute of Social Security (IMSS) detected 1155 new cases and 1059 deaths, with an incidence rate of 2.26 per 100,000 and a mortality rate of 5.23 per 100,000 [2].
Therefore, this study focuses on the detection of cervical cancer through cytological screening methods, specifically Conventional Cytology (Pap smear). This method has inherent limitations in its process, making effective implementation and maintenance challenging. It is essential to have systems in place that ensure timely feedback and efficient communication of test results, as well as appropriate follow-up for women with positive screening results.
Additionally, the transportation of samples to the laboratory and the subsequent delivery of results to the clinic add a layer of logistical complexity. Cytology programs require rigorous quality control, both clinically and in the laboratory, to ensure the reliability of results. The interpretation of samples is subjective, which can affect diagnostic accuracy, as vaginal smear slides are examined microscopically at various magnifications. Cytologists must examine thousands of fields of view (FOVs) per slide, limiting the number of samples they can review per day.
Despite the apparent simplicity in detecting abnormal cervical cells, experienced physicians are required for accurate diagnosis, and many developing countries lack these healthcare resources. Furthermore, even with experienced pathologists, examining Pap smear slides through a microscope is a tedious task. The detection of cervical cancer cells can be missed due to the small size of cervical intraepithelial neoplasia, overlapping cell clusters, or masking by mucus, blood, and artifacts.
Considering the limitations of the current method, various technologies have been proposed to improve the efficiency and accuracy in detecting cervical cancer while reducing the subjectivity of the process [3,4,5,6,7].
Generally, the algorithms used in cervical cancer detection are divided into two steps: segmentation of the cytoplasm and nucleus, and their detection and classification. For instance, Zhao, Y et al. focus on the segmentation of adherent cervical cells, addressing the low segmentation accuracy of existing methods [8]. This article proposes a new convolutional neural network based on star convex polygons with an encoder–decoder structure, called SPCNet. Similarly, Win, K.P. et al. use an iterative shape-based method to detect cell nuclei and employ a marker-controlled watershed approach to separate overlapping cytoplasm, combining image segmentation, feature extraction, and selection techniques [9].
Additionally, Abd Halim et al. apply and compare different detection methods on Pap smear images, focusing on image segmentation and nucleus detection, and perform an image quality evaluation to determine the best method [10].
Mustafa et al. use a structured analysis or morphological approach to segment nuclei in Pap smear cell images, applying dilation and erosion operations based on shape, size, and structure [11]. Furthermore, Ijaz, M.F et al. propose a cervical cancer prediction model using anomaly detection techniques and oversampling, combined with classification algorithms such as random forest [12].
Pan Q. et al. introduce a novel method to improve model generalization in cervical fluid-based cell detection by extracting causal features [13]. Furthermore, Chain Z. et al. present a semi-supervised metric learning method with dual alignment for cervical cancer cell detection, enhancing accuracy and generalization with limited data [14].
Li X. et al. propose a framework based on the Faster RCNN-FPN architecture for detecting abnormal cervical cells, enhancing the precision with deformable convolution layers and global context modules [15]. Similarly, Jia D et al. implement an improved YOLO algorithm to detect abnormal cervical cells, enhancing speed and accuracy in complex backgrounds. Techniques like S3Pool and Focal Loss are added to optimize detection in challenging situations. The results show a precision (MAP) of 78.87%, surpassing other methods and improving overall sensitivity and accuracy [16].
Glucina M. et al. propose machine learning techniques such as logistic regression, SVM, and KNN combined with class balancing techniques to improve cervical cancer detection. High classification accuracy was achieved using random oversampling and SMOTETOMEK [17].
Additionally, Mudawi and Alazeb present a predictive model for cervical cancer using machine learning algorithms such as decision trees, logistic regression, and random forests. The model achieved 100% accuracy with random forests and decision trees [18]. In a work by Mehmood et al., the authors describe the CervDetect approach, which uses machine learning algorithms to assess cervical cancer risk factors, achieving 93.6% accuracy using feature selection with random forests and shallow neural networks [19].
In a study by Umirzakova et al., a residual-within-residual design is employed to achieve faster inference and lower memory demands, thereby improving image clarity and optimizing the peak signal-to-noise ratio (PSNR). DRFDCAN outperforms frameworks like RFDN by balancing computational efficiency with high-fidelity image reconstruction, which is crucial for accurate medical diagnoses [20].
Given the subjective limitations of analysis and related works, this study proposes the implementation of computer vision algorithms, specifically SIFT (Scale-Invariant Feature Transform) descriptors, for the morphological detection of precursor or cancerous cells from a single example.
A detailed analysis is conducted on the generation of features and specific descriptors for cervical cytology images, generated from slides provided by the State Public Health Laboratory of Michoacán, Mexico. Although well-established datasets exist in the literature, the analysis process of the Pap smear method and the generation of cytological samples has shown that, in numerous cases, the samples are inadequate but still require analysis. Therefore, the images used in this study come from a diverse set of slides, including positive, negative, and a variety of stains and qualities. Similarly, the cell detection process can be applied to both images and videos. This approach aims to improve the accuracy and efficiency in detecting cancerous cells, providing specialists with a tool for the diagnosis and monitoring of cervical cancer.
2. Materials and Methods
Detecting cells within a general microscopic field is challenging because Pap smear tests do not always present adequate samples with correct staining or a broad cellular sample where multiple cells can be distinguished. As mentioned earlier, cervical cytology is primarily a screening test for squamous cell carcinoma of the cervix and its precursors. Due to the wide spectrum of reactive cytomorphological changes, criteria need to be better defined, and reproducibility may be lacking [21,22,23,24,25].
It is essential for those analyzing cervical samples to understand both nuclear morphology and the sizes of cellular components. Early pioneers in cervical cytology gained fundamental knowledge of benign and neoplastic processes through careful measurements of conventional cytology [26]. Although there is no contemporary literature on such measurements in liquid-based preparations, size relationships remain crucial for defining diagnostic entities and functional states.
Although well-established datasets exist in the scientific literature, the variability and parameters of these samples are preprocessed, considerably differing from those found in real cervical cytology samples. This highlights the need to adapt and validate diagnostic methods in real clinical contexts. Consequently, within the framework of cervical cytology analysis using the Pap smear test, this work aims to increase adaptability to non-ideal smears and image-capture devices with varied resolutions.
The detection process must effectively adjust to variations in staining and sample quality in cytological screening, such as the ones presented in Figure 1.
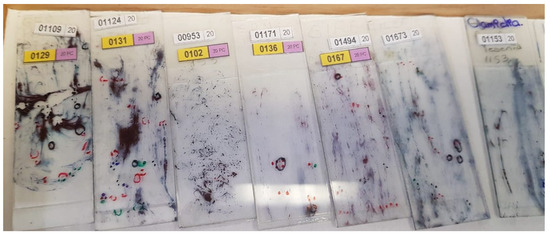
Figure 1.
The State Public Health Laboratory of Michoacán (SPHLM) provided smear samples with varied staining levels and diverse diagnoses.
This adaptability is essential because, even in poorly obtained cytological samples, it is possible to detect cells that indicate the presence of cancer or precancerous conditions. Therefore, the proposed methodology considers some important steps, presented in Figure 2, to perform a robust and flexible detection of cancerous cells.
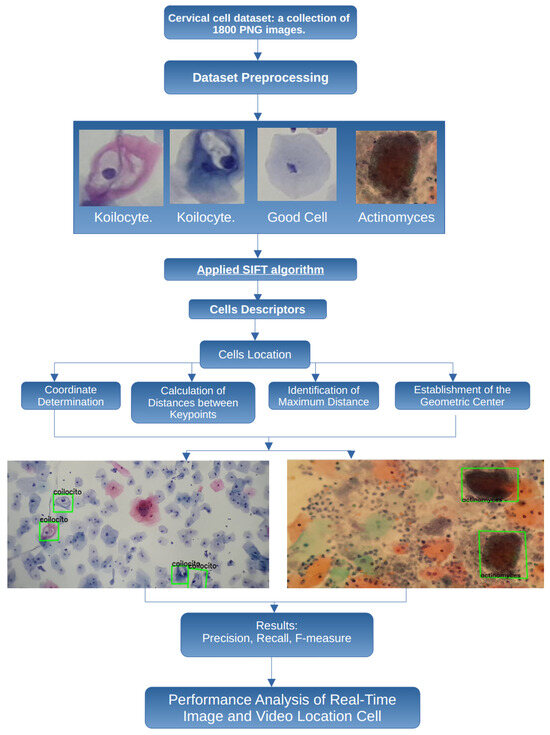
Figure 2.
Proposed methodology to process and classify cervical cell images.
In this work, the images are obtained from smear samples provided by the State Public Health Laboratory of Michoacán (SPHLM). In the first step, the images are preprocessed. For the classification step, some specific types of cervical cells are considered: koilocytes, normal cells, and actinomyces. The SIFT algorithm is applied to obtain the cell descriptors, and the location of the cells is also obtained. To validate the results, the precision, recall, and F-measure values are used. Additionally, the speed at which specialists examine samples under the microscope to detect cancer-related cells has been considered, leading to the implementation of the proposed methodology using real-time video to improve the efficiency of the evaluation process.
To facilitate detailed data analysis, a microscope adapter, produced using three-dimensional (3D) printing techniques, was implemented to acquire microscopic sample images. This adapter significantly enhanced the functionality of cameras in mobile devices, optimizing image and video collection during the investigation, as illustrated in Figure 3.
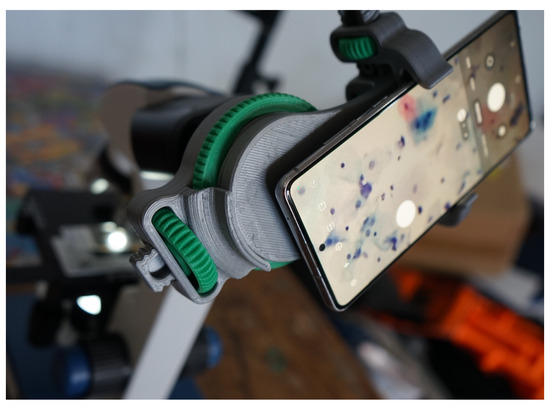
Figure 3.
Images and videos captured using the microscope adapter, slides provided by SPHLM.
Using this tool, more than 15,000 photos and 20 h of videos of cytological specimens were acquired, thoroughly documenting the microscopic fields.
It is crucial to recognize that the focal distance and magnification level of the microscopic field are not constant across all observations. Consequently, the quality of cervical cytology images is affected by multiple factors, including the type of mobile device, focal distance, lens, objective, lighting, and filter used in the microscope. However, the applied methodology adequately detects individual cells as long as they are distinguishable within the microscopic field. Figure 4 shows cervical cytology images captured at different focal distances and levels of zoom.
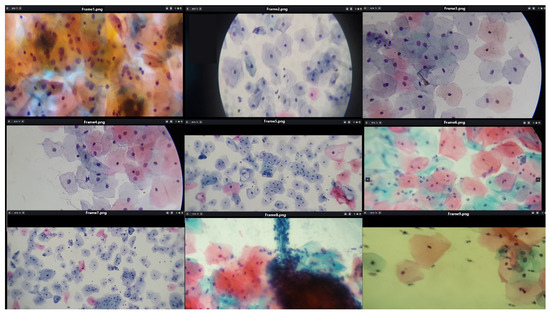
Figure 4.
The image shows fields of cervical cytology captured at various focal distances and different levels of zoom, using slides provided by SPHLM.
In the Pap smear, the superficial squamous epithelial cells, nucleoli, cilia and red blood cells are stained pink or lilac. The cytoplasm of cells other than superficial squamous cells is colored green. The superficial cells are orange to pink, and the intermediate cells are turquoise green to blue.
Similarly, we obtained cutouts of precursor cells and cells with cytoplasmic damage, koilocytes, to match them by generating SIFT descriptors from a given example. Koilocytes cellular changes are nuclear enlargement, a darker normal staining pattern in the nucleus (hyperchromasia) and a clear area around the nucleus (perinuclear halo or perinuclear cytoplasmic). Some of the cutouts obtained are shown in Figure 5.
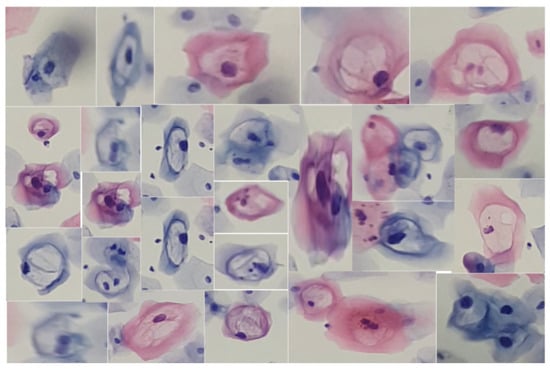
Figure 5.
Cells from a low-grade lesion cytology captured at various focal distances and different levels of zoom, using slides provided by SPHLM.
The choice of the SIFT algorithm is due to the urgent need to derive a detailed set of descriptors for each cell, which requires the preliminary identification of significant characteristic points. This algorithm is notable for its ability to be invariant to various geometric transformations and changes in lighting conditions.
Additionally, SIFT is particularly effective in detecting and describing local features, providing robust descriptor vectors that synthesize the information contained in the adjacent pixels. Although originally developed for grayscale images, the 128-element feature vector offers a comprehensive representation of the intensity level configurations in the immediate surroundings of the points of interest, thus facilitating detailed and precise analysis in specific biomedical contexts.
2.1. SIFT
The SIFT algorithm excels in its ability to generate, for each identified keypoint, a descriptor vector that synthesizes the information contained in the adjacent pixels [27]. Although SIFT was initially developed for grayscale images, it has been demonstrated that the feature vector, composed of 128 elements, provides a comprehensive overview of the intensity level configurations in the immediate surroundings of the keypoints. This approach ensures a rich and detailed representation of cellular texture and shape, facilitating subsequent analysis and interpretation in specific biomedical contexts, as discussed in [28]. This methodology not only enhances the accuracy of the cell identification and classification process but also significantly contributes to the robustness and reliability of advanced cytological studies.
The SIFT (Scale-Invariant Feature Transform) algorithm is used to robustly and efficiently detect and describe local features in images. Below are the key mathematical formulas that underpin each step of the algorithm.
To achieve scale invariance, SIFT generates a set of smoothed images by applying Gaussian convolutions to the original image. The smoothed image is defined as follows:
where is a Gaussian kernel and is the input image. The Gaussian kernel is given by
The Difference of Gaussians (DoG), used to detect keypoints, is calculated by subtracting two smoothed images with different standard deviations as follows:
Keypoints are identified as local maxima and minima in the DoG scale space. Each candidate keypoint is verified by interpolating the location using a Taylor series expansion of the DoG scale space around the keypoint as follows:
where . The keypoint displacement is found by solving
For each keypoint, the gradient and orientation are calculated in a region around the keypoint as follows:
The gradient orientations are accumulated into a histogram weighted by the gradient magnitude and a Gaussian window centered at the keypoint.
A keypoint descriptor is constructed by dividing the region around the keypoint into a grid and computing an 8-bin orientation histogram for each grid cell. The resulting descriptor is the following 128-dimensional vector (4 × 4 × 8):
where each represents the accumulation of gradient magnitudes in a specific direction within a grid cell. To ensure invariance to illumination changes, the descriptor for each keypoint is normalized by dividing by its norm as follows:
This process enhances the robustness of the descriptor against variations in image intensity.
2.2. Cell Recognition through Keypoints
Each stage described above offers a detailed insight into the process by which the SIFT algorithm identifies keypoints and generates precise descriptors of the data. In the present work, the analysis initially focuses on koilocytes, which are typically observed in low-grade lesions. This analysis is illustrated in Figure 6, which exemplifies the cell type in question.
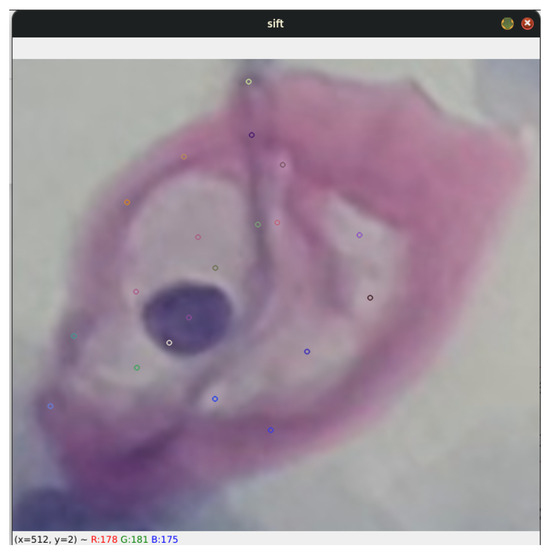
Figure 6.
The image shows a specific segment of a koilocyte, cropped by detecting blobs. This segment was processed using the SIFT algorithm to generate keypoints.
This approach not only provides a better understanding of the capabilities of keypoint generation in the context of diagnostic cytology but also explores its applicability in identifying and characterizing cells associated with specific pathological conditions. By using SIFT, a robust and detailed representation of cellular morphological features is achieved, which is crucial for improving the accuracy in the diagnosis and monitoring of diseases.
Additionally, the algorithm’s invariance to geometric transformations and changes in illumination ensures that the generated descriptors are consistent and reliable, significantly contributing to the robustness and reliability of advanced cytological studies.
Once the SIFT algorithm was applied to the image under study, a set of keypoints was identified, reaching a total of 20 in this specific case. Consequently, a set of descriptors was generated, each corresponding to one of the identified keypoints.
For this particular example, a set consisting of 20 descriptors was obtained, each characterized by a 128-element vector, as illustrated in Figure 7. This process ensures a detailed and robust representation of the morphological characteristics of the cells, facilitating their analysis and classification in advanced diagnostic contexts.

Figure 7.
The image illustrates the 128-element descriptor corresponding to the 23 keypoints generated from Figure 6.
By analyzing the koilocyte, its keypoints are identified, and the corresponding descriptor is generated. This process is fundamental for establishing correspondences later within cervical cytology. Despite variations in image size, the methodology employed ensures the precise detection of the example koilocyte through meticulous keypoint matching. This technique proves effective in identifying the koilocyte at different scales and proportions, demonstrating the method’s remarkable robustness in detecting and matching specific features. This approach not only enhances the precision of cytological analysis but also strengthens the applicability of the descriptor for identifying and classifying cells under various pathological conditions, as seen in Figure 8.
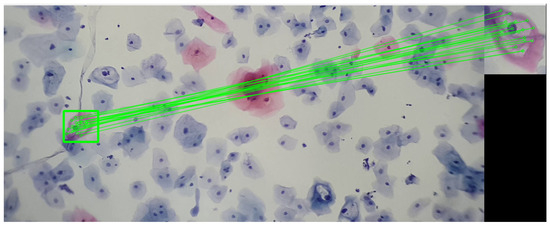
Figure 8.
The image shows the correspondence of keypoints between a segment of a koilocyte, which was scaled and rotated relative to the original, and a complete visualization of cervical cytology. This last image was taken with a 3× magnification on a mobile device combined with a 10× microscope objective. The sample was provided by SPHLM.
In the framework of this work, the following methodological process is proposed: Starting from a comprehensive set of cells exhibiting traits associated with precursor lesions or potentially cancerous cells, a unique feature descriptor is generated for the set. This step involves a detailed description and analysis of the characteristics present in the entire set of cells to establish a representative descriptor.
Subsequently, a search procedure aims to identify a specific descriptor, denoted as , within a set of descriptors, referred to as . To facilitate this identification and comparison process, the Euclidean distance is used as a metric to evaluate the distance between descriptors. Thus, considering as the reference descriptor belonging to the set , and as the target descriptor set, significant matches are sought.
Here, n represents the dimension of the feature space. The goal is to calculate the Euclidean distance between and each of the descriptors in .
The algorithm focuses on identifying the k-nearest neighbors, selecting the k descriptors within that have the smallest Euclidean distance from . Mathematically, for each descriptor in , the Euclidean distance is calculated as follows:
Subsequently, the k descriptors in with the smallest Euclidean distances to are selected. To express this procedure more formally and precisely, the set of the k-nearest neighbors of in = is minimal for the k-nearest neighbors ∣}.
Thus, matches are determined by implementing nearest neighbor searches. To delimit the region of interest without applying a homographic transformation to the entire set of extracted segments, a structured methodological approach is adopted in the following steps:
- Determination: The coordinates corresponding to points that form a homogeneous set are identified and recorded, ensuring that all selected points share similar defining characteristics.
- Calculation of Distances between Keypoints: A quantitative analysis is performed to determine the distances between points within a homogeneous group, involving a comprehensive evaluation of the spatial proximity between elements belonging to the same category.
- Identification of Maximum Distance: Among the calculated distances, the value corresponding to the greatest distance between points in the same group is extracted, allowing the identification of the maximum spatial limits within the analyzed set.
- Establishment of the Geometric Center: From the obtained coordinates of each point, the geometric center of the set is calculated. This calculation provides a spatial reference point that synthesizes the average location of all elements in the group.
As described in the previous steps, after identifying the set of points with matching descriptors, exhaustive collection of the coordinates of that group is advanced. These points are specifically correlated with the descriptions of the various fragments extracted from the analyzed sample.
Therefore, the following procedure is structured: Considering a set of coordinates and a distance threshold denoted by , the Euclidean distance between any pair of points and is defined as . Initially, a set called cercanas is established as empty, and a list called conjuntos also starts empty. Each point , with i varying from 1 to n, is evidenced in (10).
Once the process is completed, the set cercanas includes all the coordinates that are close to each other. On the other hand, conjuntos encompasses the groups of close coordinates, each identified by specific labels. Furthermore, the center, according to Equation (11), and the maximum distance, according to Equation (12), are determined. These parameters are essential for generating the homographic matrix corresponding to each set.
By implementing the keypoint detection process in a set of cutouts with specific features for a low-grade lesion, as illustrated in Figure 9, robust detection is sought. This robustness is manifested in the ability of keypoints to maintain their reliability against variations in lighting and geometric transformations. The choice of SIFT as a method is justified by its known resistance to morphological changes, thus providing reliable detection in uncontrolled environments.
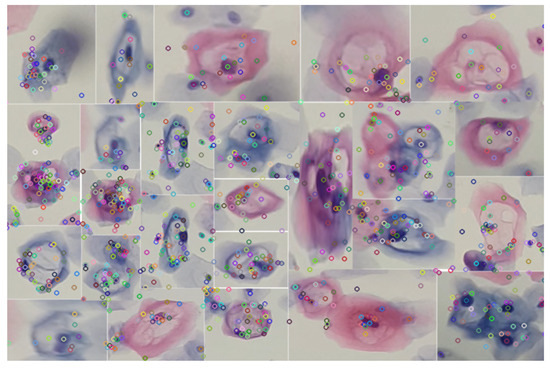
Figure 9.
Identification of keypoints using the SIFT algorithm in various specimens of precursor cells of cervical cancer. The analyzed segments were obtained by applying the blob detection technique using the difference of Gaussians.
In this way, the detection of the set of cells present in the knowledge base, exemplified in Figure 9, is facilitated. This process, which involves the segmentation of cells with variations in their color, is carried out through blob detection and the HSV color model. By using this set of descriptors as a knowledge base, it is possible to make correspondences in images or videos, as illustrated in Figure 10.
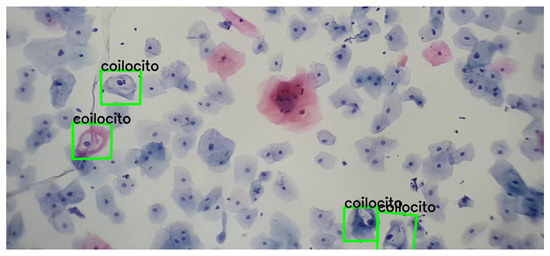
Figure 10.
Detection and correspondence of cells through the keypoints present in Figure 9, within a field of cervical cytology. This image was captured using a 3.5× magnification on a mobile device combined with a 10× microscope objective.
Additionally, various video and image sequences were subjected to a wide range of modifications; i.e., geometric transformations were applied to verify the suitability of the detection. This analysis revealed that it is feasible to detect and match precursor cells with a single example, without the need for extensive training. This approach emulates the recognition capability that any person might have with a single example, highlighting the relevance of distinctive features for detection. A concrete example of this process is presented in Figure 11.
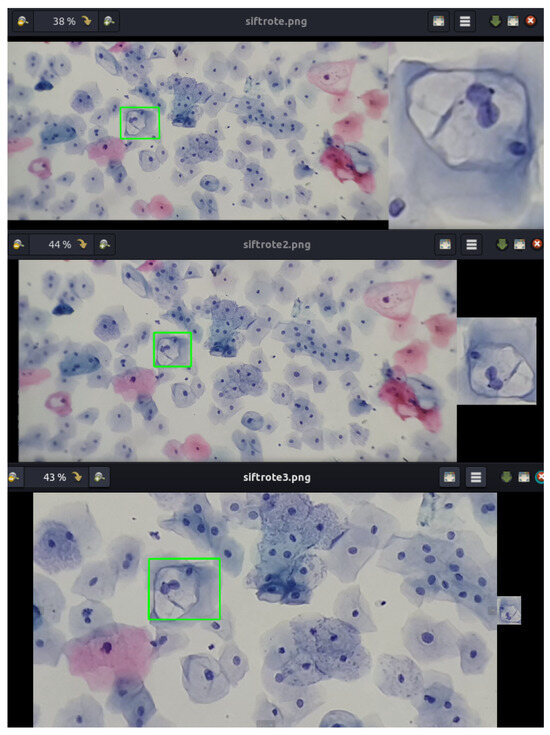
Figure 11.
Detection and correspondence of cells within a field of cervical cytology. The green frame indicates the detection and correspondence of the example cell within a cervical cytology. Note that the example of the koilocyte has different scales and rotations.
3. Results
The SIFT algorithm was evaluated using a dataset of 100 cervical cytology images with 1800 unique examples, and the results demonstrated a high level of accuracy and reliability in detecting cancerous cells.
The algorithm achieved an accuracy of 98.34%, highlighting the overall capability of the algorithm to correctly classify both cancerous and non-cancerous cells. The precision was 98.3%, indicating that most of the cells identified as cancerous were indeed positive, reflecting the algorithm’s ability to minimize false positives. The recall rate was 98.2%, meaning that the algorithm correctly identified the majority of cancerous cells present in the images, demonstrating its effectiveness in detecting true positives. The F-measure reached a value of 97.3%, a combined metric considering precision and recall. This high value indicates an optimal balance between precision and recall, underscoring the algorithm’s robustness under diverse clinical conditions. Table 1 shows the aforementioned results.

Table 1.
Detection of cells using SIFT in 100 cervical cytology images, utilizing 1800 unique examples of cells, from low-grade lesions.
Additionally, the graph presented in Figure 12 illustrates the detection rate achieved by the SIFT algorithm from a knowledge base composed of 1800 unique examples of descriptors. This analysis was performed on 100 different frames, with a detection rate ranging from 94% to 99%. The consistency and robustness of the algorithm are reflected in the high detection rate maintained across all analyzed frames.
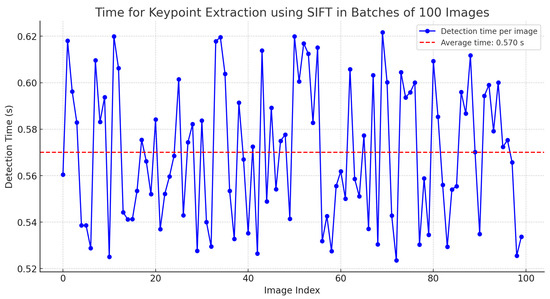
Figure 12.
Time for keypoint extraction using SIFT in batches of 100 images.
Furthermore, considering that the SIFT algorithm can be highly computationally expensive, an analysis was conducted on the time required to generate keypoints in batches of 100 images with dimensions of 2400 × 1080 pixels. The results indicate an average time of 0.57 s, as detailed in Table 2.

Table 2.
Time for keypoint extraction using SIFT in batches of 100 images.
It was found that, in general, it is possible to extract features from a large image in a reasonable time. However, the same analysis was applied once the keypoint descriptors were generated and their search within a field of a cervical cytology was performed. The results indicate that the calculation time, depending on the image size, averages approximately 3 s, as shown in Figure 13.
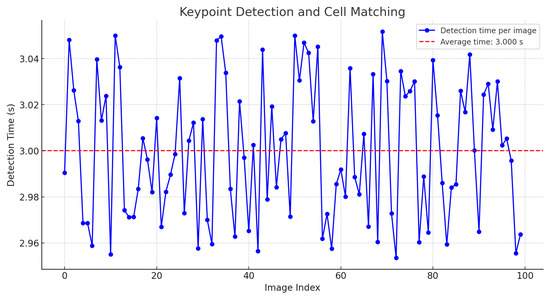
Figure 13.
Time for keypoint detection and cell matching.
Nevertheless, if the descriptors are stored and reused without recalculating these values, the time is reduced to 0.0107 s. Additionally, if the image size is reduced by 20%, the execution time for point matching and cell detection significantly decreases to an average of 0.0099 s, as shown in Figure 14.
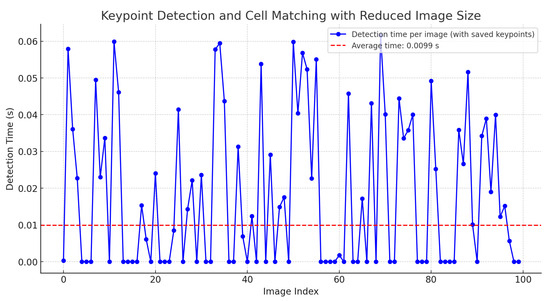
Figure 14.
Time for keypoint detection and cell matching with saved keypoints and 20% image reduction.
This reduction in time is also attributed to the proposed implementation in Equation (12), which accelerates the localization of clusters among the descriptors in cervical cytology.
This enhancement allows for real-time matching of keypoints in videos. The zero values indicate that no cell matching the stored keypoints was found.
This result underscores the algorithm’s effectiveness in identifying cervical cancer cells under various lighting conditions and image qualities. The algorithm’s ability to maintain a high detection rate across different frames demonstrates its adaptability and precision, which is crucial for diagnostic applications in clinical settings.
Furthermore, using a comprehensive knowledge base of descriptors allows the algorithm to reliably recognize patterns and distinctive features, ensuring accurate identification of target cells, as shown in Figure 15.
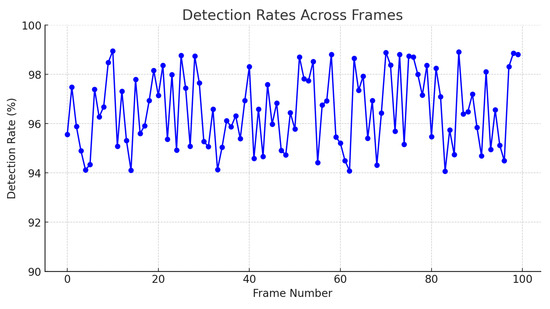
Figure 15.
Detection rates across frames.
Moreover, the following images show varied examples of cells and their corresponding descriptors. A modification was applied to the images to validate detection under color variations, as shown in Figure 16.
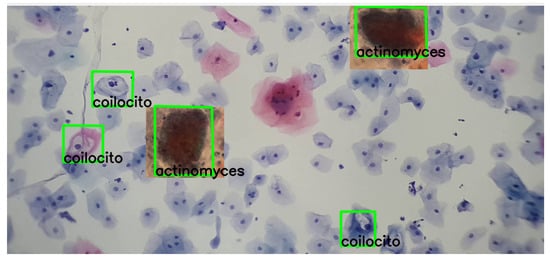
Figure 16.
The detection process of actinomyces and koilocytes, performed using the previously generated knowledge base. The sample for this procedure was provided by SPHLM.
As can be observed in the images, the detection process remains viable even with these variations, demonstrating the robustness and adaptability of the SIFT algorithm in identifying cervical cancer cells under different coloring conditions.
Similarly, it was found that, although the use of the SIFT algorithm is particularized from the single provided example, this particular example has the ability to generalize due to the high similarity between the initial two given examples, as shown in Figure 17.
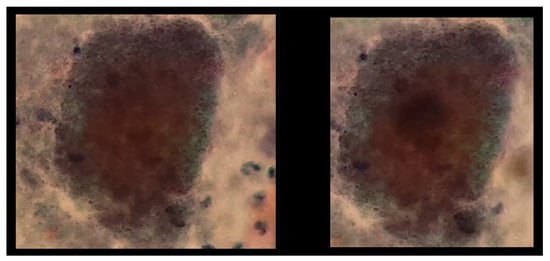
Figure 17.
The image exhibits the detection process of actinomyces and koilocytes, performed using the previously generated knowledge base. The sample for this procedure was provided by SPHLM.
In this way, Figure 18 shows a double box indicating the detection of a double match, highlighting the generalization capability of the keypoints. However, it is important to note that this observation is not conclusive for generalizing to any similar set of keypoints.
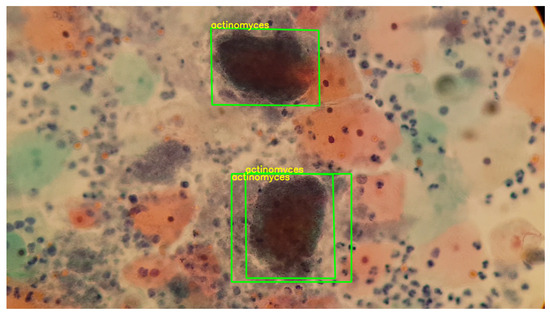
Figure 18.
The image exhibits the detection process of actinomyces, performed using the previously generated knowledge base. The sample for this procedure was provided by SPHLM.
Furthermore, Figure 19 presents a video sequence in which koilocytes are detected. The uniqueness of this image lies not only in the frames showing the detection but also in the fact that these frames were captured with a 5-megapixel microscope camera, using a different microscope and a different slide arrangement.
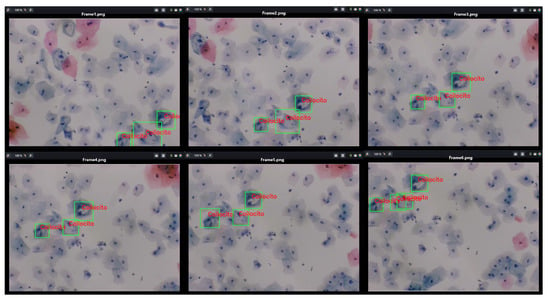
Figure 19.
The image shows the process of detecting koilocytes in video sequences, captured with a 5-megapixel microscope camera, using the previously generated knowledge base. The sample for this procedure was provided by SPHLM.
This aspect is particularly significant as the descriptors for the 1800 segmented cells from low-grade lesions were generated using a Samsung Note 10 Lite mobile device with a 12-megapixel camera. Initially, examples of precursor cells were cropped with a specific resolution and size, calculating the characteristic points and their respective descriptors from these values. It is noteworthy that the video was captured directly from the camera following the proposed methodology. Despite differences in image parameters, capture devices, and microscopes, it is still possible to detect precursor cells of cervical cancer.
4. Discussion
While the detection of feature points using SIFT has been previously addressed in the literature, the central premise of this study is not solely limited to generating correspondences between examples of precursor cells. Instead, it focuses on developing a primitive learning approach based on feature points generated in real time during the processing of videos or images with distinctive values. Additionally, it aims to locate cells within a field of cervical cytology in both photos and videos in real time, specifying the type of visible cell that possesses the previously generated characteristics.
In this work, deep learning models are not used, as the ultimate goal of this research, as well as future work, is to achieve effective learning with few examples, without the need for a large pre-existing set of example images. Although this approach presents some complexity, it is based on the following observation from the literature on cervical cancer: “The process of detecting cells within a general microscopy field is complex because the Pap smear process does not, most of the time, exhibit adequate samples with proper staining, with a wide cellular sample where more than one cell can be distinguished in cervical cytology. Furthermore, as previously mentioned, cervical cytology is primarily a screening test for squamous cell carcinoma of the cervix and its precursors. Due to the wide spectrum of reactive cytomorphological changes, the criteria are not well defined and may lack reproducibility”.
Nevertheless, Table 3 shows comparative values evaluating the proposed method against other strategies that predominantly employ deep learning techniques for the classification and detection of cervical cytology.

Table 3.
Comparison of methods with the state of the art.
Mathivanan [29] presents an innovative methodology that employs pre-trained deep neural network models for feature extraction and machine learning algorithms for cervical cancer classification, achieving an accuracy of 98.08% with ResNet-152, among other methodologies.
Similarly, Sher Lyn Tan et al. [30] utilized transfer learning with pre-trained models on Pap smear images, evaluating 13 pre-trained CNN models on the Herlev dataset. DenseNet-201 demonstrated the best performance in terms of accuracy and efficiency, with excellent experimental results and minimal computing time.
Likewise, Cecilia Di Ruberto [31] implemented a novel method for recognizing and classifying white blood cells in microscopic blood images, identifying them as healthy or affected by leukemia, as shown in Figure 20.
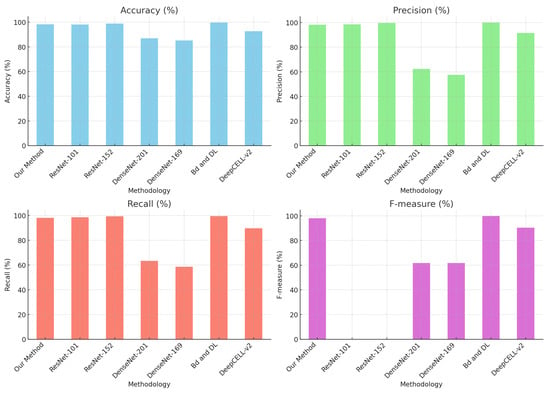
Figure 20.
Comparison of methods with the state of the art.
While the results are highly promising, it is noted that the quality of the datasets is crucial for the accurate identification of elements in cytology. Additionally, training deep learning models requires considerable time. Therefore, the idea of using deep learning models was dismissed in this investigation, whose central aim is to learn with few examples and enhance knowledge as key point correspondences are made.
Although SIFT can be computationally demanding, the intention is to compute the descriptors once and make the correspondence much more efficient. This work serves as a foundation for future research to implement real-time learning techniques based on SIFT descriptors, given their robustness against various geometric transformations and changes in lighting.
An important aspect to highlight is detecting precursor cells within a cytology sample. This process enables the identification of specific cells in a cytological field by using clusters of descriptor coordinates rather than employing a conventional sweep commonly used for object detection in a scene.
5. Conclusions
This study demonstrates the potential of using SIFT descriptors for the detection and monitoring of precancerous cervical cells in video sequences captured by mobile devices. By analyzing 100 digital images of Papanicolaou tests provided by the State Public Health Laboratory of Michoacán, Mexico, and more than 1800 unique examples of precancerous cells, the methodology achieved an accuracy of 98.34%, a precision of 98.3%, a recall rate of 98.2%, and an F-measure of 98.05%.
These results underscore the efficacy of SIFT descriptors in providing real-time matching of precancerous cells, thereby improving the accuracy and efficiency of the Papanicolaou test. The meticulous optimization of these methods for real-time analysis indicates a promising advancement in the early detection of cervical cancer, offering a robust tool to enhance patient survival rates through early and accurate diagnosis.
The implementation of the SIFT algorithm, along with the search for a new homography based on characteristic points and descriptors, constitutes an innovative strategy for knowledge acquisition.
Each set of descriptors generated by SIFT can be considered a “primitive memory” of the cell, as it is capable of performing recognitions based on a single example. This approach is particularly relevant as it allows for effective specialization without relying on deep learning techniques, which typically require intensive processes and a considerable volume of data to achieve adequate learning. The application of SIFT seeks to emulate the human capacity for learning from a single example by extracting unique and distinctive features from it. Similarly, future work envisions the generalization of this primitive memory through the tracking of the cell in video sequences.
Nonetheless, it is imperative to recognize that additional developments, tests, and applications in this field are still required. Samples can exhibit significant variations between individuals, and the specific conditions of each patient can introduce a considerable diversity of modifications in the cells. Moreover, medical treatments can alter cellular characteristics, necessitating constant system adaptation to maintain its accuracy and efficacy. Therefore, while the SIFT-based approach and descriptor generation show notable potential, it is essential to continue with exhaustive research to validate and improve this methodology. The inherent variability of human samples and the diverse clinical conditions imply the need for additional studies to ensure the robustness and reliability of the system across a wide range of scenarios. This field of research remains promising, and with proper development and implementation, it could significantly transform diagnostic practices in cytology and other biomedical contexts.
Author Contributions
Conceptualization, J.E.A.-C. and A.d.C.T.-A.; software, J.E.A.-C.; validation, J.C.O.-R. and R.M.-P.; writing—original draft preparation, J.E.A.-C.; writing—review and editing, A.d.C.T.-A.; supervision, A.d.C.T.-A. All authors have read and agreed to the published version of the manuscript.
Funding
This research was funded by Tecnológico Nacional de México.
Institutional Review Board Statement
This study was conducted in accordance with the Declaration of Helsinki, and approved by the Institutional Ethics Committee of TecNM/Instituto Tecnológico de Morelia.
Informed Consent Statement
Informed consent was obtained from all subjects involved in the study.
Data Availability Statement
Data available by request.
Acknowledgments
The authors would like to express their gratitude to the State Public Health Laboratory of Michoacán, particularly the oncology department, for providing us with cervical cytology samples and their ongoing guidance in identifying precursor cervical cancer cells. Furthermore, we dedicate this work to every woman who faces this condition.
Conflicts of Interest
The authors declare no conflicts of interest.
References
- World Health Organization. Cervical Cancer. 2023. Available online: https://www.who.int/news-room/fact-sheets/detail/cervical-cancer (accessed on 11 June 2024).
- Asociación Española Contra el Cáncer Epidemiología del cáNcer Cervicouterino. 2022. Available online: https://www.contraelcancer.es/es/todo-sobre-cancer/tipos-cancer/cancer-cuello-uterino-cervix/epidemiologia-evolucion (accessed on 11 June 2024).
- Thrall, M.J. Automated screening of Papanicolaou tests: A review of the literature. Diagn. Cytopathol. 2019, 47, 20–27. [Google Scholar] [CrossRef]
- Özbay, E.; Özbay, F.A. Interpretable pap-smear image retrieval for cervical cancer detection with rotation invariance mask generation deep hashing. Comput. Biol. Med. 2023, 154, 106574. [Google Scholar] [CrossRef]
- Birdsong, G.G. Automated screening of cervical cytology specimens. Hum. Pathol. 1996, 27, 468–481. [Google Scholar] [CrossRef]
- Bengtsson, E.; Malm, P. Screening for Cervical Cancer Using Automated Analysis of PAP-Smears. Comput. Math. Methods Med. 2014, 2014, 842037. [Google Scholar] [CrossRef]
- Jiang, P.; Li, X.; Shen, H.; Chen, Y.; Wang, L.; Chen, H.; Feng, J.; Liu, J. A systematic review of deep learning-based cervical cytology screening: From cell identification to whole slide image analysis. Artif. Intell. Rev. 2023, 56, 2687–2758. [Google Scholar] [CrossRef]
- Zhao, Y.; Fu, C.; Zhang, W.; Ye, C.; Wang, Z.; Ma, H.f. Automatic Segmentation of Cervical Cells Based on Star-Convex Polygons in Pap Smear Images. Bioengineering 2023, 10, 47. [Google Scholar] [CrossRef]
- Win, K.P.; Kitjaidure, Y.; Hamamoto, K.; Myo Aung, T. Computer-Assisted Screening for Cervical Cancer Using Digital Image Processing of Pap Smear Images. Appl. Sci. 2020, 10, 1800. [Google Scholar] [CrossRef]
- Abd Halim, A.; Mustafa, W.; Khairunizam, W.; A Rahim, H.; Sakeran, H. Nucleus Detection on Pap Smear Images for Cervical Cancer Diagnosis: A Review Analysis. Oncologie 2021, 23, 73–88. [Google Scholar] [CrossRef]
- Mustafa, W.; Wei, L.; Rahman, K. Automated Cell Nuclei Segmentation on Cervical Smear Images Using Structure Analysis. J. Biomimetics Biomater. Biomed. Eng. 2021, 51, 105–115. [Google Scholar] [CrossRef]
- Ijaz, M.F.; Attique, M.; Son, Y. Data-Driven Cervical Cancer Prediction Model with Outlier Detection and Over-Sampling Methods. Sensors 2020, 20, 2809. [Google Scholar] [CrossRef]
- Pan, Q.; Yang, B.; Chen, D.; Wang, M. Enhancing Model Generalization of Cervical Fluid-Based Cell Detection through Causal Feature Extraction: A Novel Method. In Proceedings of the 15th Asian Conference on Machine Learning, İstanbul, Turkey, 11–14 November 2023; Volume 222, pp. 1055–1070. [Google Scholar]
- Chai, Z.; Luo, L.; Lin, H.; Chen, H.; Han, A.; Heng, P.A. Deep Semi-supervised Metric Learning with Dual Alignment for Cervical Cancer Cell Detection. arXiv 2022, arXiv:2104.03265. [Google Scholar] [CrossRef]
- Li, X.; Xu, Z.; Shen, X.; Zhou, Y.; Xiao, B.; Li, T. Detection of Cervical Cancer Cells in Whole Slide Images Using Deformable and Global Context Aware Faster RCNN-FPN. Curr. Oncol. 2021, 28, 3585–3601. [Google Scholar] [CrossRef]
- Jia, D.; He, Z.; Zhang, C.; Yin, W.; Wu, N.; Li, Z. Detection of cervical cancer cells in complex situation based on improved YOLOv3 network. Multimed. Tools Appl. 2022, 81, 8939–8961. [Google Scholar] [CrossRef]
- Glučina, M.; Lorencin, A.; Anđelić, N.; Lorencin, I. Cervical Cancer Diagnostics Using Machine Learning Algorithms and Class Balancing Techniques. Appl. Sci. 2023, 13, 1061. [Google Scholar] [CrossRef]
- Mudawi, N.A.; Alazeb, A. A Model for Predicting Cervical Cancer Using Machine Learning Algorithms. Sensors 2022, 22, 4132. [Google Scholar] [CrossRef]
- Mehmood, M.; Rizwan, M.; Gregus ml, M.; Abbas, S. Machine Learning Assisted Cervical Cancer Detection. Front. Public Health 2021, 9, 788376. [Google Scholar] [CrossRef]
- Umirzakova, S.; Mardieva, S.; Muksimova, S.; Ahmad, S.; Whangbo, T. Enhancing the Super-Resolution of Medical Images: Introducing the Deep Residual Feature Distillation Channel Attention Network for Optimized Performance and Efficiency. Bioengineering 2023, 10, 1332. [Google Scholar] [CrossRef]
- Colgan, T.J.; Woodhouse, S.L.; Styer, P.E.; Kennedy, M.; Davey, D.D. Reparative changes and the false-positive/false-negative Papanicolaou test. Arch. Pathol. Lab. Med. 2001, 125, 134–140. [Google Scholar] [CrossRef]
- Young, N.A.; Naryshkin, S.; Atkinson, B.F.; Ehya, H.; Gupta, P.K.; Kline, T.S.; Luff, R.D. Interobserver variability of cervical smears with squamous-cell abnormalities: A Philadelphia study. Diagn. Cytopathol. 1994, 11, 352–357. [Google Scholar] [CrossRef]
- Young, N.A.; Kline, T.S. Benign cellular changes: Allied ambiguity in CLIA’88 and the Bethesda System. Diagn. Cytopathol. 1994, 10, 307–308. [Google Scholar] [CrossRef]
- Davey, D.D.; Nielsen, M.L.; Frable, W.J.; Rosenstock, W.; Lowell, D.M.; Kraemer, B.B. Improving accuracy in gynecologic cytology. Results of the College of American Pathologists Interlaboratory Comparison Program in Cervicovaginal Cytology. Arch. Pathol. Lab. Med. 1993, 117, 1193–1198. [Google Scholar]
- Young, N.A. Back to the negative Pap test: Behind the scenes at Bethesda 2001. Diagn. Cytopathol. 2002, 26, 207–208. [Google Scholar] [CrossRef]
- Patten, S.F., Jr. Diagnostic Cytopathology of Uterine Cervix. Monographs in Clinical Cytology, 2nd ed.; S. Karger: New York, NY, USA, 1978. [Google Scholar]
- Lowe, D. Distinctive Image Features from Scale-Invariant Keypoints. Int. J. Comput. Vis. 2004, 60, 91–110. [Google Scholar] [CrossRef]
- Alegre, E.; Pajares, M.; de la Escalera Hueso, A. Conceptos y Métodos en Visión por Computador; Comité Español de Automática: Barcelona, Spain, 2016. [Google Scholar]
- Mathivanan, S.K.; Francis, D.; Srinivasan, S.; Khatavkar, V.P.K.; Shah, M.A. Enhancing cervical cancer detection and robust classification through a fusion of deep learning models. Sci. Rep. 2024, 14, 10812. [Google Scholar] [CrossRef]
- Tan, S.L.; Selvachandran, G.; Ding, W.; Paramesran, R.; Kotecha, K. Cervical Cancer Classification From Pap Smear Images Using Deep Convolutional Neural Network Models. Interdiscip. Sci. 2024, 16, 16–38. [Google Scholar] [CrossRef]
- Di Ruberto, C.; Loddo, A.; Puglisi, G. Blob Detection and Deep Learning for Leukemic Blood Image Analysis. Appl. Sci. 2020, 10, 1176. [Google Scholar] [CrossRef]
- Fang, M.; Lei, X.; Liao, B.; Wu, F.X. A Deep Neural Network for Cervical Cell Classification Based on Cytology Images. IEEE Access 2022, 10, 130968–130980. [Google Scholar] [CrossRef]
Disclaimer/Publisher’s Note: The statements, opinions and data contained in all publications are solely those of the individual author(s) and contributor(s) and not of MDPI and/or the editor(s). MDPI and/or the editor(s) disclaim responsibility for any injury to people or property resulting from any ideas, methods, instructions or products referred to in the content. |
© 2024 by the authors. Licensee MDPI, Basel, Switzerland. This article is an open access article distributed under the terms and conditions of the Creative Commons Attribution (CC BY) license (https://creativecommons.org/licenses/by/4.0/).