Article

The Novel EfficientNet Architecture-Based System and Algorithm to Predict Complex Human Emotions

1
Department of Computer Engineering, Keimyung University, Daegu 42601, Republic of Korea
2
Department of Biomedical Engineering, Keimyung University, Daegu 42601, Republic of Korea
*
Author to whom correspondence should be addressed.
Algorithms 2024, 17(7), 285; https://doi.org/10.3390/a17070285
Submission received: 29 May 2024 / Revised: 25 June 2024 / Accepted: 28 June 2024 / Published: 1 July 2024

Abstract

:
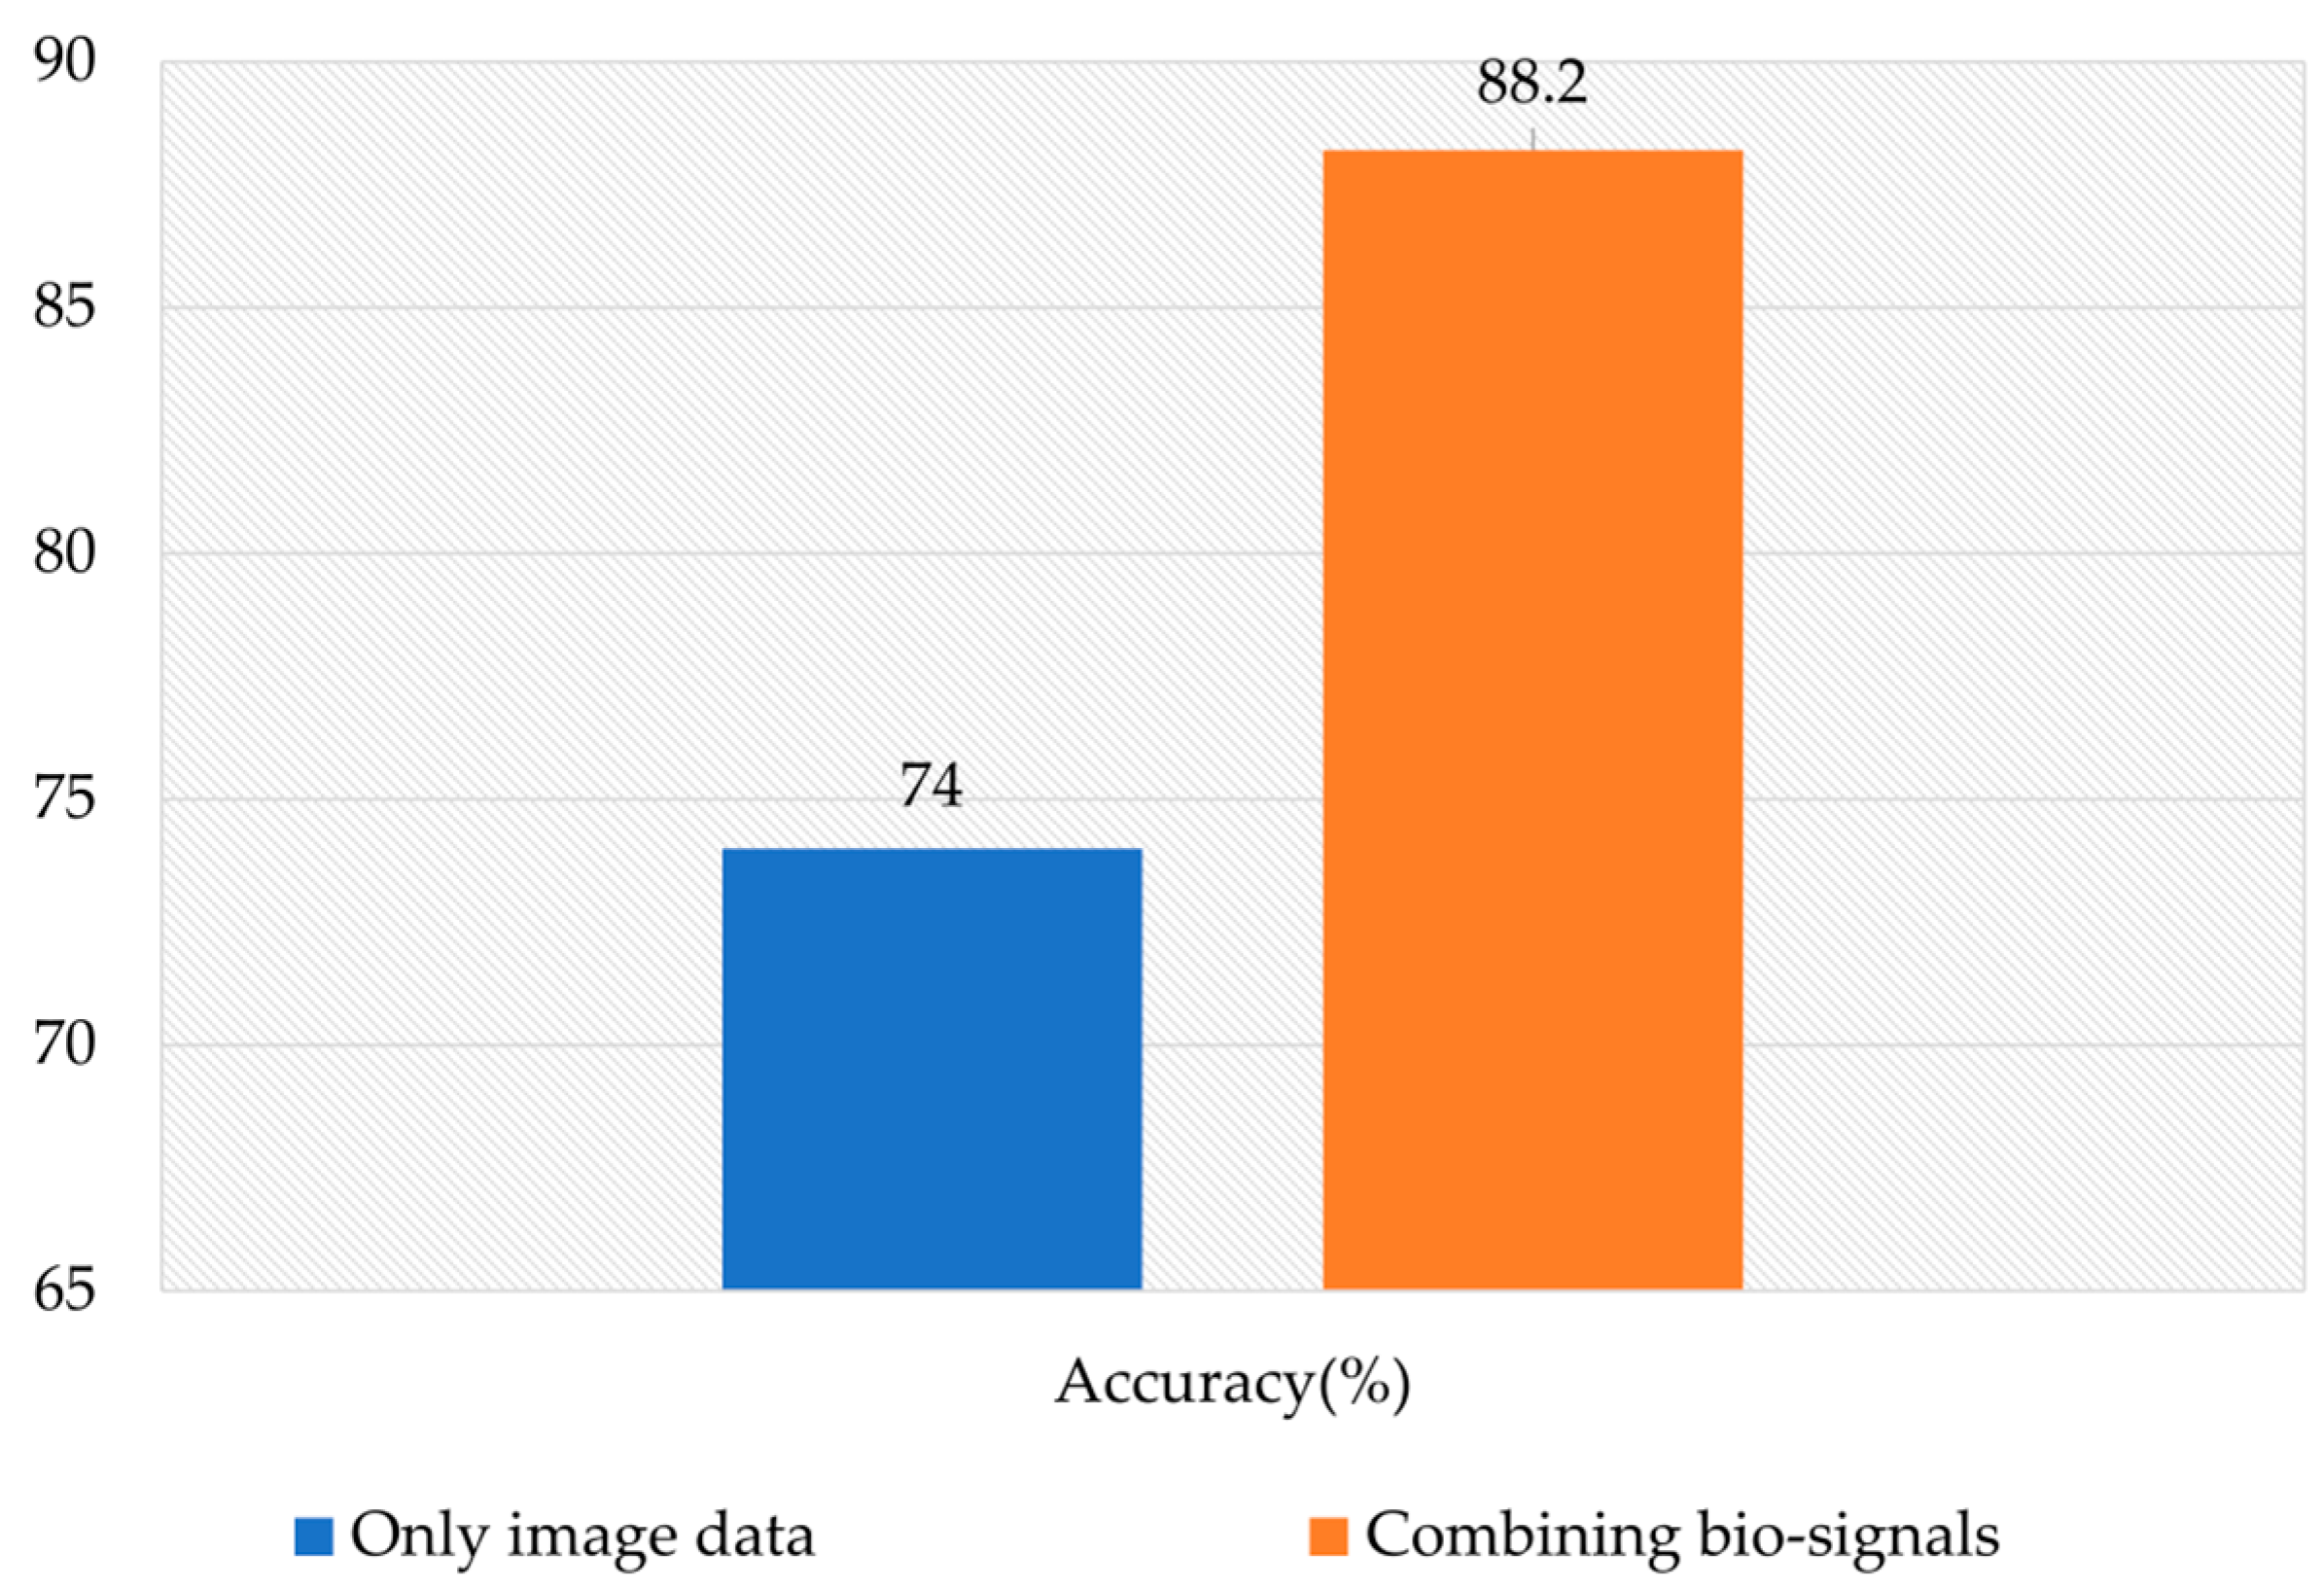
Facial expressions are often considered the primary indicators of emotions. However, it is challenging to detect genuine emotions because they can be controlled. Many studies on emotion recognition have been conducted actively in recent years. In this study, we designed a convolutional neural network (CNN) model and proposed an algorithm that combines the analysis of bio-signals with facial expression templates to effectively predict emotional states. We utilized the EfficientNet-B0 architecture for network design and validation, known for achieving maximum performance with minimal parameters. The accuracy for emotion recognition using facial expression images alone was 74%, while the accuracy for emotion recognition combining biological signals reached 88.2%. These results demonstrate that integrating these two types of data leads to significantly improved accuracy. By combining the image and bio-signals captured in facial expressions, our model offers a more comprehensive and accurate understanding of emotional states.

1. Introduction

Emotion refers to a feeling or mood that arises when a certain phenomenon or event is encountered. Visible expressions serve as a window into the complex world of human emotions, enabling others to better understand and empathize with the person’s inner state of mind. Emotions are fundamental to humans and affect cognitive and daily activities, such as learning, communication, and decision-making. Emotions can be expressed through words, gestures, facial expressions, and other non-verbal cues, and many physiological signals also deliver information about the emotional state of a person [1,2]. In previous studies, emotional states were exclusively identified through facial expression images, and these studies reported high misrecognition rates for frightened faces and difficulties in distinguishing between sad and angry expressions. Since facial expressions can be controlled and may not always reflect genuine emotions, recognizing the true emotional state of an individual becomes challenging. Consequently, relying solely on facial expression images for emotion identification may lead to inaccurate results because emotions may be hidden or misrecognized [3,4]. Considering that there are connections between various psychophysiological and emotional states, researchers have analyzed these variables to identify patterns. This type of analysis has made it possible to study the relationships between various emotions, clarify the relationship between biological and psychological variables, and formulate a classification of emotions that allows the distinction between one emotion and another. Among the existing methods for classifying emotions, the most common is Russell’s circumplex model [5]. Emotion recognition research is useful in a variety of fields, including smart homes, autonomous driving systems, and medical fields. For autonomous driving systems, the integration of emotion recognition can contribute to safer driving experiences. By understanding the driver’s emotional state, the system can provide calming suggestions or alerts if it detects stress or anger, potentially reducing road incidents and improving overall road safety. In the medical field, the implications of emotion recognition research are particularly important. The ability to effectively identify and analyze emotional states through technologies such as electrocardiogram (ECG) signals, and facial expression analysis, offers early diagnosis of various mental health conditions. For example, consistent detection of certain emotional patterns could indicate the onset of depression, anxiety disorders, or chronic pain, allowing for timely intervention before these conditions worsen. Moreover, emotion recognition technology could help the treatment and monitoring of chronic conditions, such as heart disease, in which emotional stress significantly impacts patient health, and emotion recognition systems can be used to make an early diagnosis of various mental diseases. Doctors face difficulties in determining and controlling pain levels in their patients, especially infants who cannot verbalize pain [6,7]. In recent years, there has been active research in emotion studies, focusing on recognizing emotions through bio-signals produced by the autonomous nervous system. These signals can be obtained relatively easily and continuously monitored. Numerous previous studies have demonstrated strong correlations between individuals’ emotional states and their bio-signals. Furthermore, emotion recognition using biometric signals offers the advantage of being less sensitive to the surrounding environment. Bio-signal processing technology holds great potential for compatibility and usability in various fields in the future, including medical examinations and rehabilitation. Various bio-signals, including heart rate, skin conductance, respiration, electromyogram (EMG), and electroencephalogram (EEG) signals, as well as speech data, have been used for emotion recognition [8,9,10].
Heart rate, skin conductance, and respiration are effective in determining a person’s resting and active emotional states. These signals are also useful for assessing stress levels and for accurate emotion recognition. The autonomic nervous system plays an important role in regulating heart rates and cardiac outputs according to physiological and psychological stresses, which means that it is possible to acquire natural emotional states. Heart rate variability (HRV) is used to monitor the risk of emotional changes in real time in astronauts [11,12]. Nowadays, ECG signals can be obtained from inexpensive, wearable, and mobile devices, making it possible to monitor without requiring any medical expertise. It is non-invasive and there is no need to visit a hospital or cardiologist [13]. For this reason, it was determined that HRV is the most suitable bio-signal for emotion recognition [14,15,16]. However, relying solely on one signal, such as HRV, may not capture the full complexity of human emotions, since emotional expressions can be influenced by many factors. Recognizing the limitations of single-signal approaches, this paper aims to address these challenges by proposing a sophisticated model through the integration of facial expression images and HRV data. By combining these two sources of information, our model aims to leverage the strengths of each approach. Facial expressions provide a direct and observable indicator of emotional states, capturing the nuances of human expressions. In contrast, HRV offers an internal physiological measure, reflecting the autonomic nervous system’s activity in response to emotions. The contributions of this paper are summarized as follows:
I. We have successfully trained CNN models for facial expression recognition using EfficientNet-B0, which optimizes the depth, width, and resolution of the network. II. Multi-Modal Data Integration: This study integrates both visual (facial expression images) and physiological (HRV) data to create a robust model. This comprehensive approach allows for a more detailed understanding of human emotions compared to traditional methods that rely on single data sources. III. We report state-of-the-art results on benchmark datasets.
The rest of the paper is organized as follows. We present recent related work in Section 2. We describe the algorithms and data sources used in our study, including the data collection process, preprocessing techniques, and specific algorithms employed for emotion prediction, in Section 3. We present the experimental results analysis of our findings in Section 4. Finally, our conclusions in Section 5 summarize the main findings, with suggestions for future work.

2. Related Work

Many researchers have used the FER2013 (Facial Expression Recognition) dataset to analyze or classify human emotions [17]. Liu et al. [18] used the CNN model and trained several different structured subnets. Their highest single-network accuracy was 62.44%, and the model as a whole achieved 65.03% accuracy. Fard et al. [19] proposed an Adaptive Correlation Loss to guide the network. They used the Xception [20] and Resnet50 CNN [21] architectures as backbone models. The proposed model achieved 72.03% accuracy. Vulpe-Grigoraşi et al. [22] presented a method to enhance CNN model accuracy through the optimization of hyperparameters and architecture using the Random Search algorithm. Their experimental results demonstrated that by using this method, the CNN model can achieve 72.16% accuracy. Vignesh et al. [23] proposed a method in which the CNN structure integrates U-Net segmentation layers with Visual Geometry Group layers. This design enables the extraction of more key features. The model achieved a classification accuracy of 75.97% on the FER2013 dataset. Pham et al. [24] combined the ubiquitous Deep Residual Network and U-Net-like architecture to produce a ResMaskingNet. The proposed model reached 76.82% accuracy and holds state-of-the-art accuracy on the FER2013 dataset.
In recent years, there has been a significant amount of research focused on identifying emoticons in HRV, to understand how various emotional states can be reflected in HRV. Among various bio-signals, previous studies have highlighted the usefulness of HRV as an objective measure of emotional response. Researchers use advanced signal processing and machine learning techniques to analyze ECG signals, seeking patterns that correlate with specific emotions. Guo et al. [25] conducted a study to classify five types of emotional states. They extracted HRV from the ECG signal and used a Support Vector Machine (SVM) [26] for classification. The method achieved a 56.9% accuracy rate in distinguishing between the five distinct emotional states. Notably, the accuracy increased to 71.4% when the classification was simplified to categorize emotions as either positive or negative. Ferdinando et al. [27] showed that Neighborhood Components Analysis (NCA) [28] enhances the accuracy of extracting standard HRV features from ECG data by 74%. In their study, they employed a k-Nearest Neighbors (kNN) classifier to identify class 3 problematic emotions and arousal. Lee et al. [29] present a novel approach to emotion recognition using photoplethysmogram (PPG) signals. Their method combines deep features from two CNNs with statistical features identified via Pearson’s correlation. Utilizing HRV and normalized PPG signals, they extract both time and frequency domain features. These features are then used to classify valence and arousal, the basic parameters of emotion. Using the DEAP dataset, their method achieved impressive accuracies of 82.1% for valence and 80.9% for arousal, demonstrating its effectiveness.
Ngai et al. [30] explored the limitations of relying solely on facial expressions for emotion recognition in human–computer interaction. To address this, they proposed a multimodal approach incorporating two-channel EEG signals and eye modality alongside facial modalities to improve recognition performance. Employing the arousal-valence model and convolutional neural networks, their method effectively captures spatiotemporal information for emotion recognition. Extensive experiments demonstrated the system’s effectiveness, achieving 67.8% accuracy in valence recognition and 77.0% in arousal recognition. Aya et al. conducted a study on real-time emotion recognition targeting physically disabled individuals and children with autism, utilizing facial landmarks and EEG signals, and employing CNN and LSTM classifiers they achieved promising results [31].
However, while EEG signals have been used as bio-signals, they have shown minimal fluctuation. Additionally, there is a lack of research regarding brainwave frequencies associated with emotions. Research results indicate that EEG signals may not be suitable for emotion recognition due to their susceptibility to noise and background changes [32,33].
Singson et al. [34] used CNN based on the ResNet architecture to detect emotions through facial expressions and physiological signals, focusing on HRV and ECG. Images of the subjects were captured using a smartphone camera, and their physiological signals were recorded using a custom-made ECG device. The subjects’ emotions were categorized as happy, sad, neutral, fearful, or angry based on analyses of the ECG signals and facial expressions. The method’s accuracy, as determined from ECG data, was 68.42%. Du et al. [35] detected emotions by analyzing both heartbeat signals and facial expressions. They proposed a method to detect four different emotions in players when playing games, based on their heartbeat signals and facial expressions. This method used a bidirectional long- and short-term memory network and a CNN for analysis.
As mentioned earlier, there are limited studies that have examined both bio-signals and facial expression image data for classifying emotions. Traditional methods relying solely on facial expression analysis often lead to inaccurate results due to the controllable nature of facial expressions and the difficulty in distinguishing certain emotions based on appearance alone. To address these challenges, we propose a method that integrates both facial expression data and HRV signals. HRV is a reliable physiological indicator that provides information about the balance between sympathetic and parasympathetic nervous system activities. This balance reflects the body’s emotional state and response, offering a deeper understanding of emotional regulation that is not accessible through facial expressions alone. By combining these two sources of information, our study aims to enhance the accuracy and reliability of emotion recognition systems. In this study, we used the CNN-based EfficientNet algorithm, specifically the lightest model, B0, for image data recognition [36]. It is trained as an efficient CNN-based model for data classification and prediction, accurately identifying emotions using both facial expression images and bio-signal data. Compared to other algorithms, CNN-based classification requires relatively minimal pre-processing [37,38].

3. Materials and Methods

3.1. Data Acquisition

The facial image open data used in the study were grayscale FER2013 of resolution size of 48 × 48 pixels. In the experiments, we changed the labels using four classes: angry, happy, neutral, and sad. Figure 1 shows the most distinctive changes in facial expressions among the four classes.
For the experiment, we produced bio-signal data for each class by referencing a study [39], which identified six HRV index values that vary with different emotions. In the research, the ECG signals were obtained from 60 subjects aged 20 to 26 with 50% male and 50% female students. Signals from participants were recorded using the RM6240B system. All signals were recorded on the desktop computer. The experiment was conducted in isolation from the operator to allow participants to freely experience their emotions. The purpose of the experiment was to record the ECG signal of subjects in Neutral, Fear, Sadness, Happiness, Anger, and Disgust states. For this, the subjects were shown a video corresponding to these emotions. Each video was 7 min long. All participants were healthy and had no complaints of heart disease. The experiment was recorded in a quiet room, and a 5 min break was taken after each video to increase the emotional accuracy of the ECG signal. To obtain the signal associated with the intended emotion, only the data from the last 5 min of each 7 min video were extracted and used in the analysis. These six HRV index values are calculated from the R–R interval data as shown in Figure 2, which are obtained by measuring and pre-processing the ECG. First, it is necessary to find the R peak, because the R peak is the most important feature for ECG data analysis. Accurate detection of R peaks and R–R intervals is critical in diagnosing cardiac conditions.
In the time domain, we computed two key metrics: SDNN, which is the standard deviation of normal-to-normal R–R intervals, and RMSSD, the square root of the mean of the squared differences between successive R–R intervals. In the frequency domain analysis, we utilized the normalized low-frequency power (LF), high-frequency power (HF), and their ratio (LF/HF). Additionally, we employed sample entropy (SampEn), a non-linear index, to analyze the complexity of HRV and the time series. In Figure 3, the ECG signals for each emotion, including angry, happy, sad, and neutral, are illustrated.
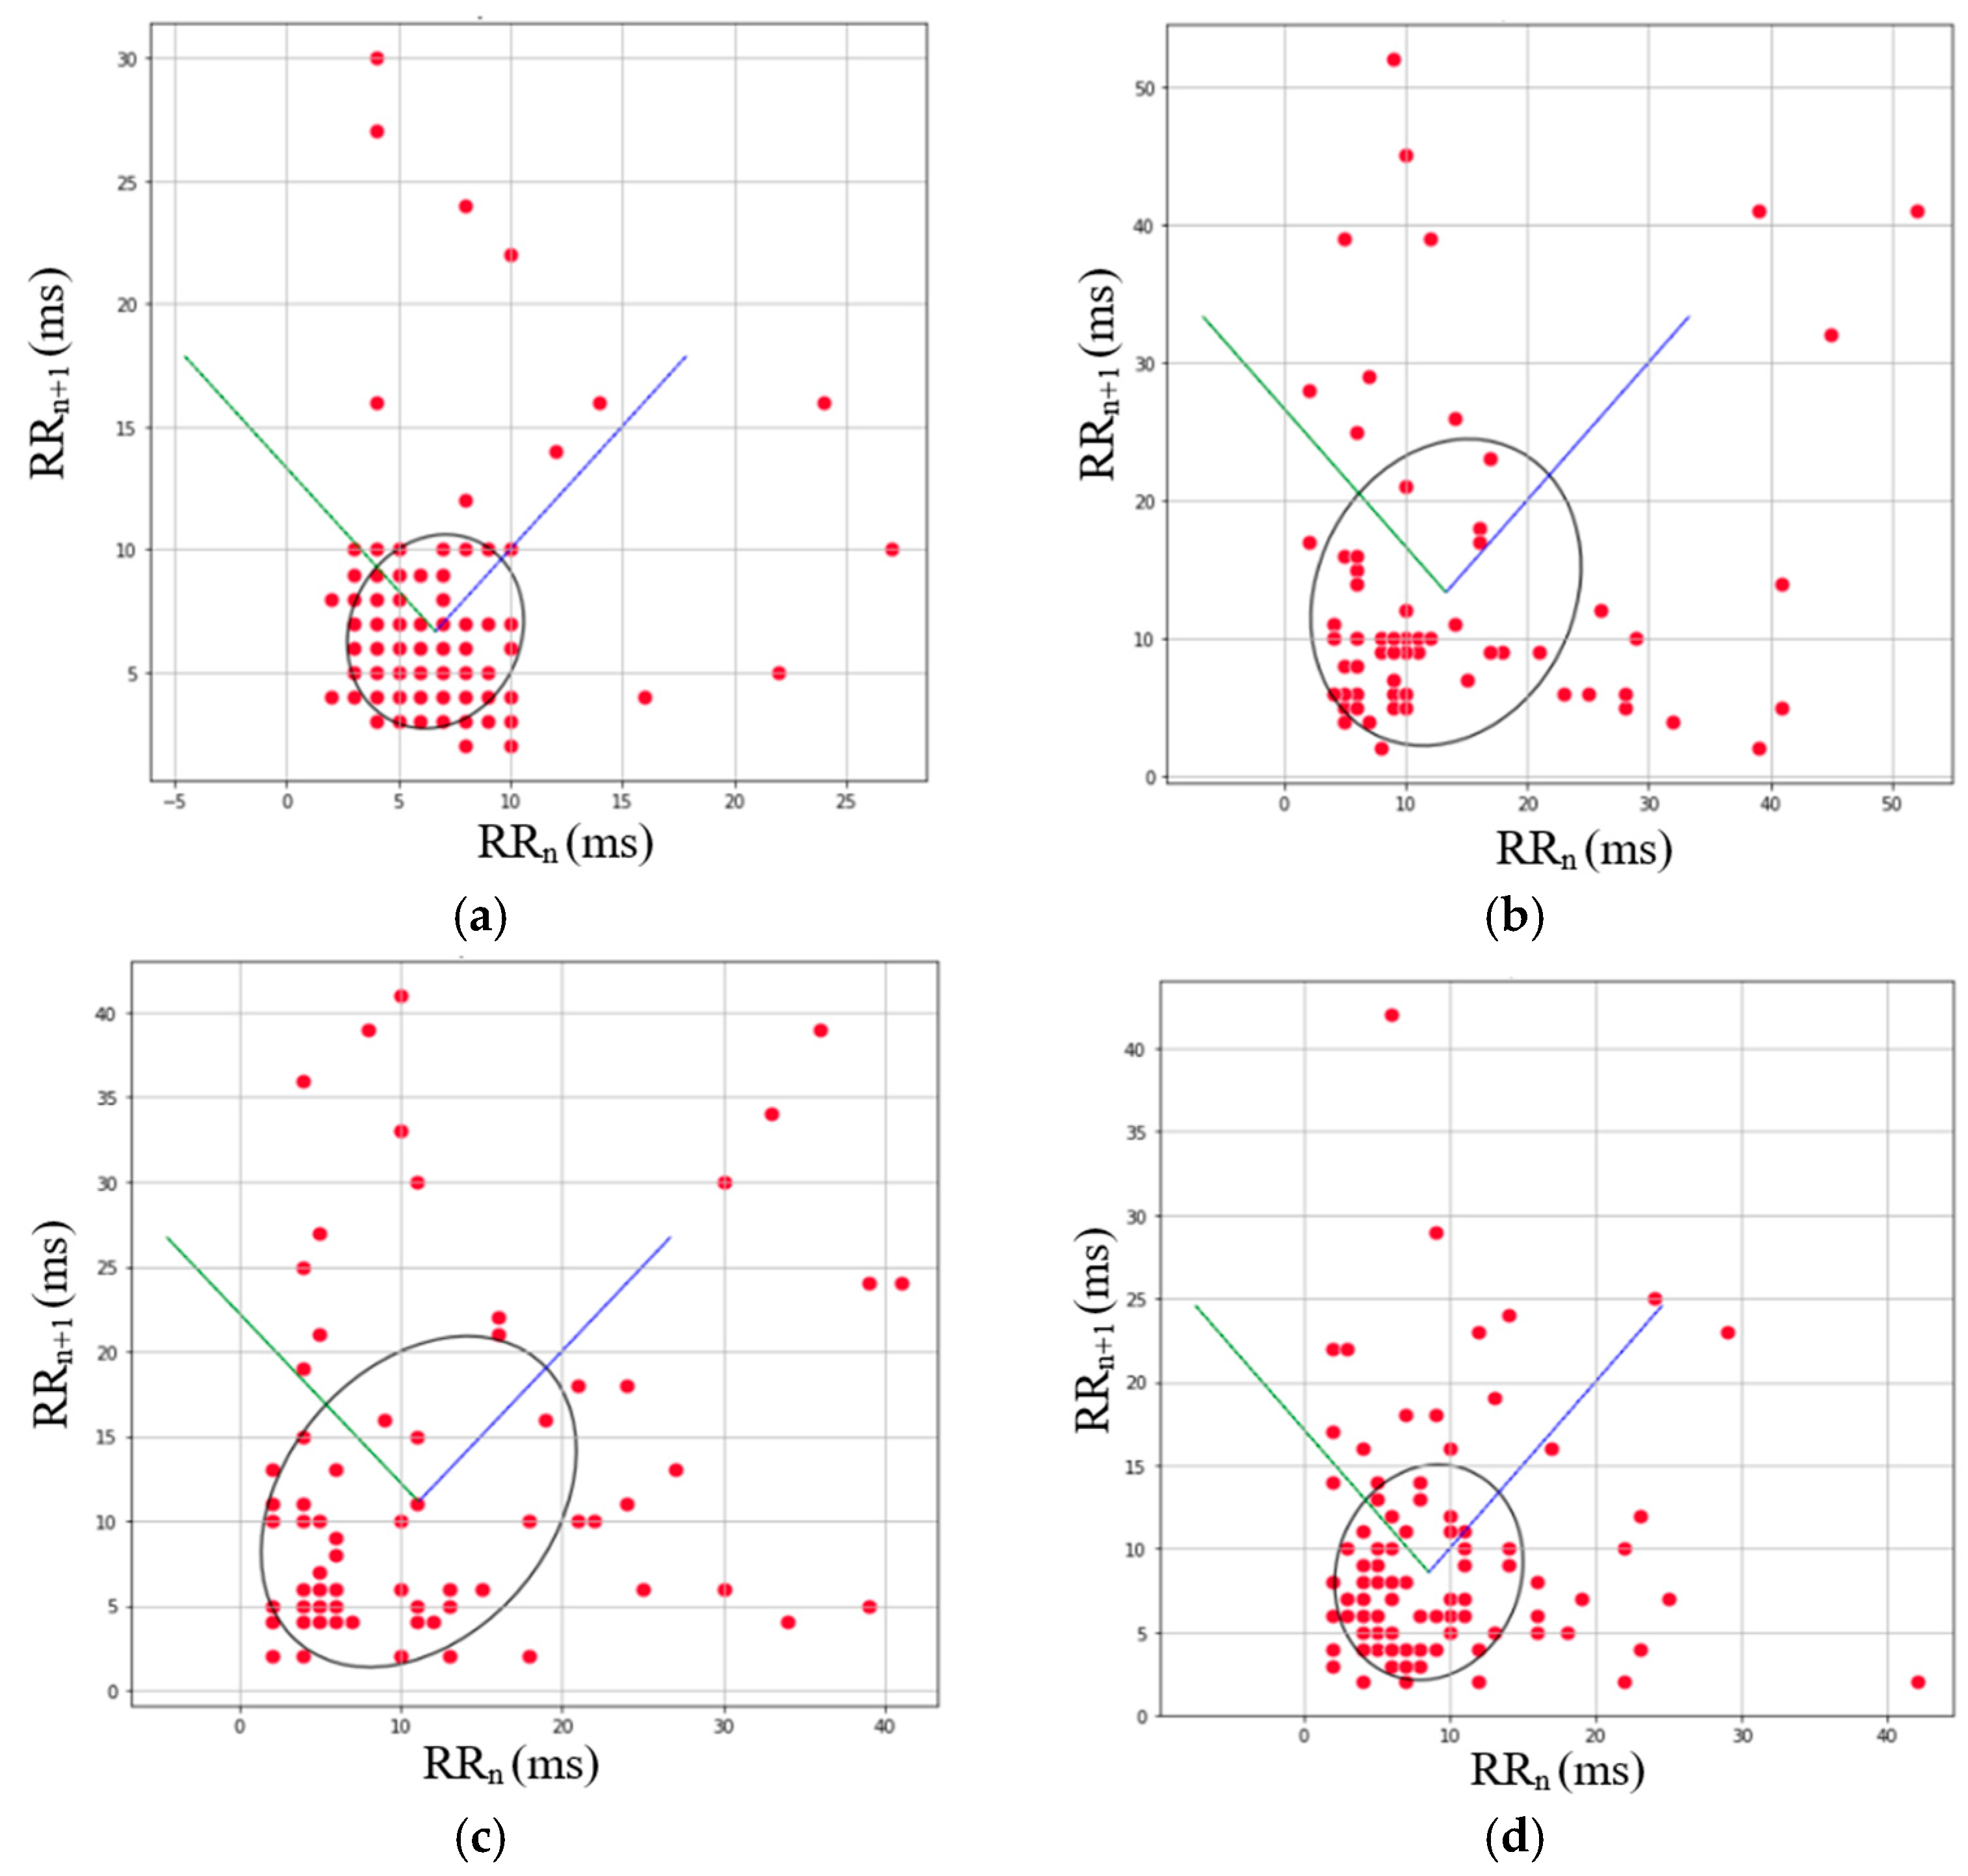
The most commonly used non-linear method for analyzing HRV is the Poincaré plot. Figure 4 illustrates the differences in emotions and the variations in successive R–R intervals. The Poincaré graph is also a very useful tool for identifying ectopic beats.
Table 1 presents the values of the bio-signal data we used. Since we accessed the data from an existing paper, which had categorized them according to emotion class, we assumed that the facial expression images in the FER2013 image data were included in the range of the emotion class data.
In the case of facial expression image data, we used the FER2013 open dataset. There were 20,000 facial expression images in total, which we divided into 15,000 for training, 2500 for validation, and 2500 for testing. We randomized the data by setting the ‘Shuffle’ value to True. For classification, we assigned labels as follows: angry (0), happy (1), sad (2), and neutral (3). Regarding bio-signal data, we based our approach on the assumption that six HRV indices correspond to emotions and follow a normal distribution, as suggested in previous research. For each facial expression image, we generated 1000 samples for each HRV index, selecting values randomly. For example, in the ‘happy’ category, the SDNN index had a mean of 55 and a standard deviation of 19, creating a normal distribution ranging from 36 to 74. From the 1000 generated sample values, one was randomly selected and matched with a facial expression image corresponding to that category. This process was replicated to obtain samples for all six indices for each image.

3.2. Designing the Model

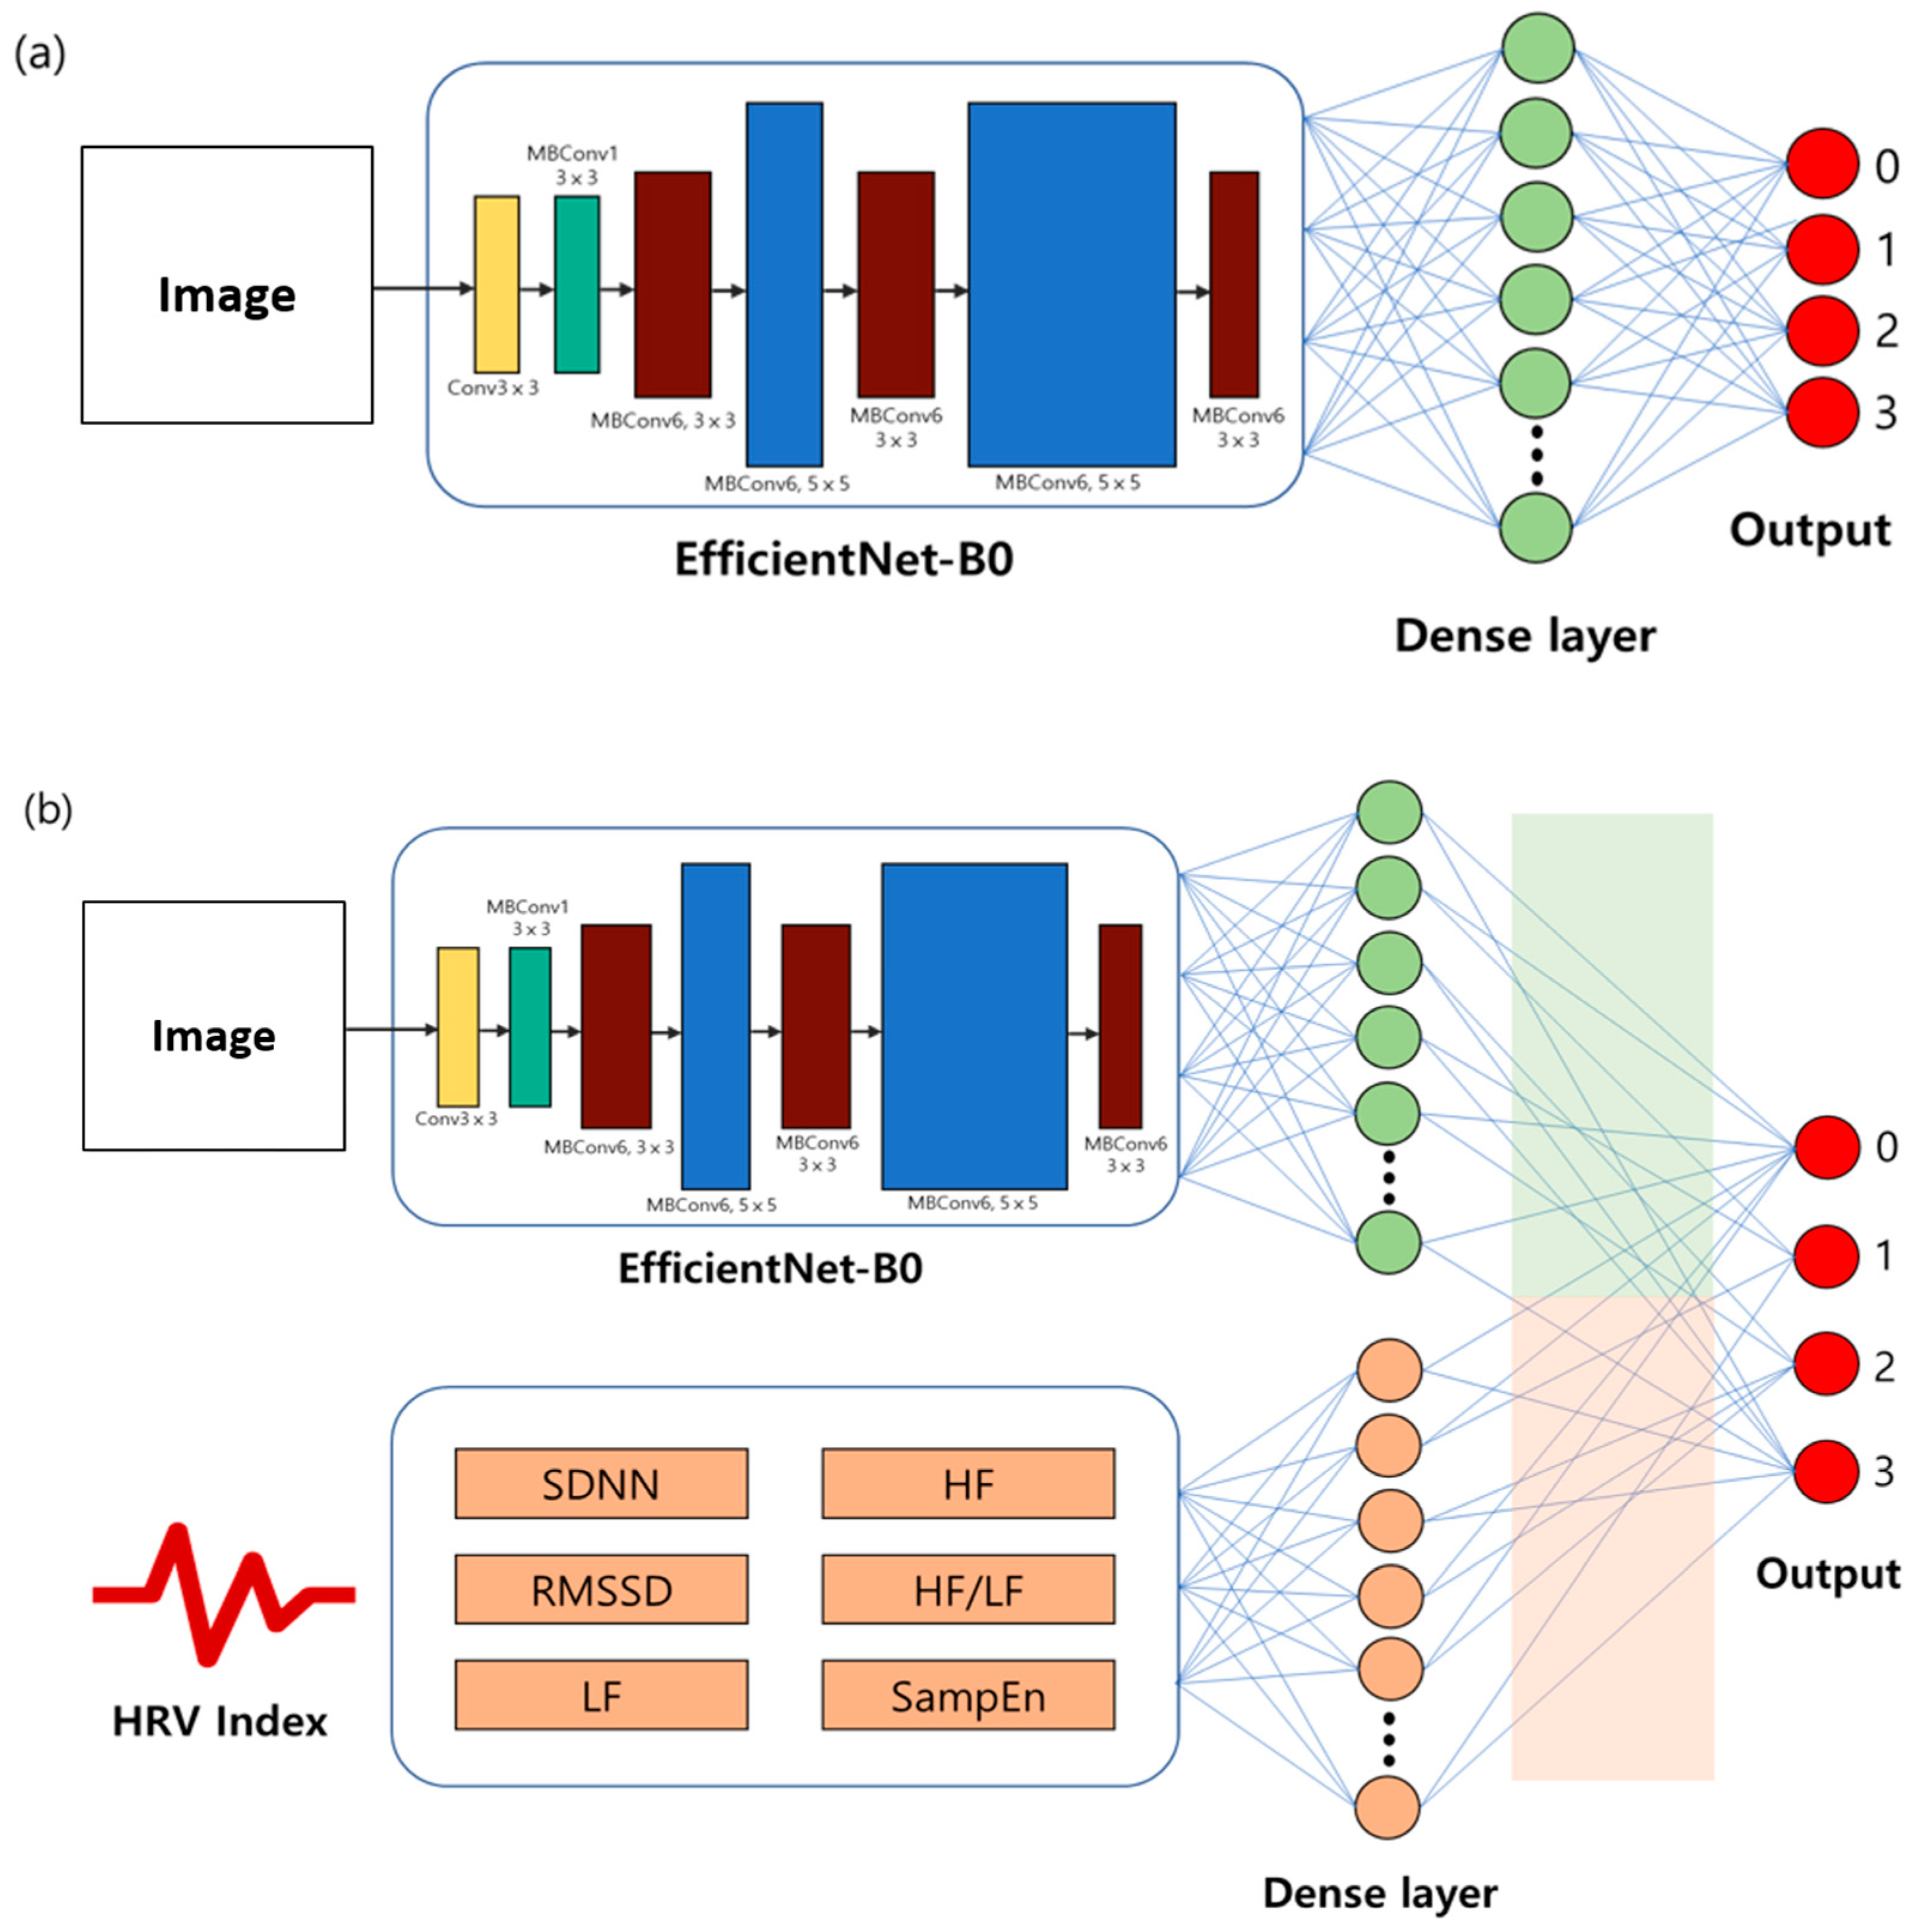
CNNs are designed to recognize the interrelationships between pixels in an entire image simultaneously, rather than processing each image individually. This architecture includes alternating layers of pooling and convolution. Pooling layers help to reduce the size of the data processed by convolutional layers, which are responsible for extracting features from the input data. This structure enhances training performance by efficiently managing the convolutional layers and minimizing overfitting. The principle of operation is as follows. First, a feature map is created through convolution from the input image. Then, the size of the feature map is reduced through sub-sampling, and the feature size is reduced through multiple stages of convolution and sub-sampling. Based on the reduced feature size, only powerful features that represent the whole remain, which facilitates the classification [40,41]. For image classification with high accuracy in models, performance has been continually improved by scaling up conventional CNNs. There are three methods of scaling up. First, the depth of the model’s neural network is increased. A deeper network can be easily generalized for other tasks, and complex features can be extracted. Second, the channel width is increased. A wider channel facilitates the extraction of more detailed features, and it is effective to train. Third, the input image’s resolution is increased. If high-resolution images are used as inputs, the model can learn more detailed patterns. However, conventional scaling-up methods applied only one of the three methods, either increasing the neural network’s depth, increasing the channel width, or increasing the input image’s resolution. EfficientNet finds the optimal combination of the three conventional methods using a compound coefficient. The three scaling methods have a certain relationship, which translates into a simple constant ratio equation. In other words, it proved that high accuracy and efficiency are achieved if scaling is performed by adjusting the three elements together with a fixed ratio. We constructed a model using EfficientNet-B0 that more accurately classifies emotional states. Figure 5 presents a flow chart of the system proposed in this paper, which recognizes a person’s emotion by analyzing facial expression images and HRV.
The models are designed for two types of datasets. In the first experiment, we trained and tested the EfficientNet-B0 model using only image data. EfficientNet-B0 outputs 1280 × 7 × 7 features, so it uses a dense layer to encode 256 features. Finally, we output one sentiment prediction value. In another experiment, 64 features are encoded through separate dense layers for the generated HRV index. The encoded features from both the image data and the HRV data are concatenated and further processed through subsequent dense layers. This integration allows the model to leverage both visual and physiological information for emotion recognition. The integrated features are fed into the final layer that produces the output predictions. The output layer typically has as many neurons as there are emotion categories. In this case, there are four output neurons, each representing a different emotional state. In the training process, we used a total of 15,000 facial expression image data and HRV data. Then, we used 2500 images as validation data and 2500 images as test data. In the learning process, we used the validation data at every epoch to evaluate the model’s performance, and whenever the highest accuracy was achieved, the model’s hyperparameter values were saved. Images originally 48 × 48 were resized to 224 × 224 to use as model input. As for the training parameters, the epoch was set to 40, batch size to 16, and learning rate to 0.0001, as shown in Table 2.
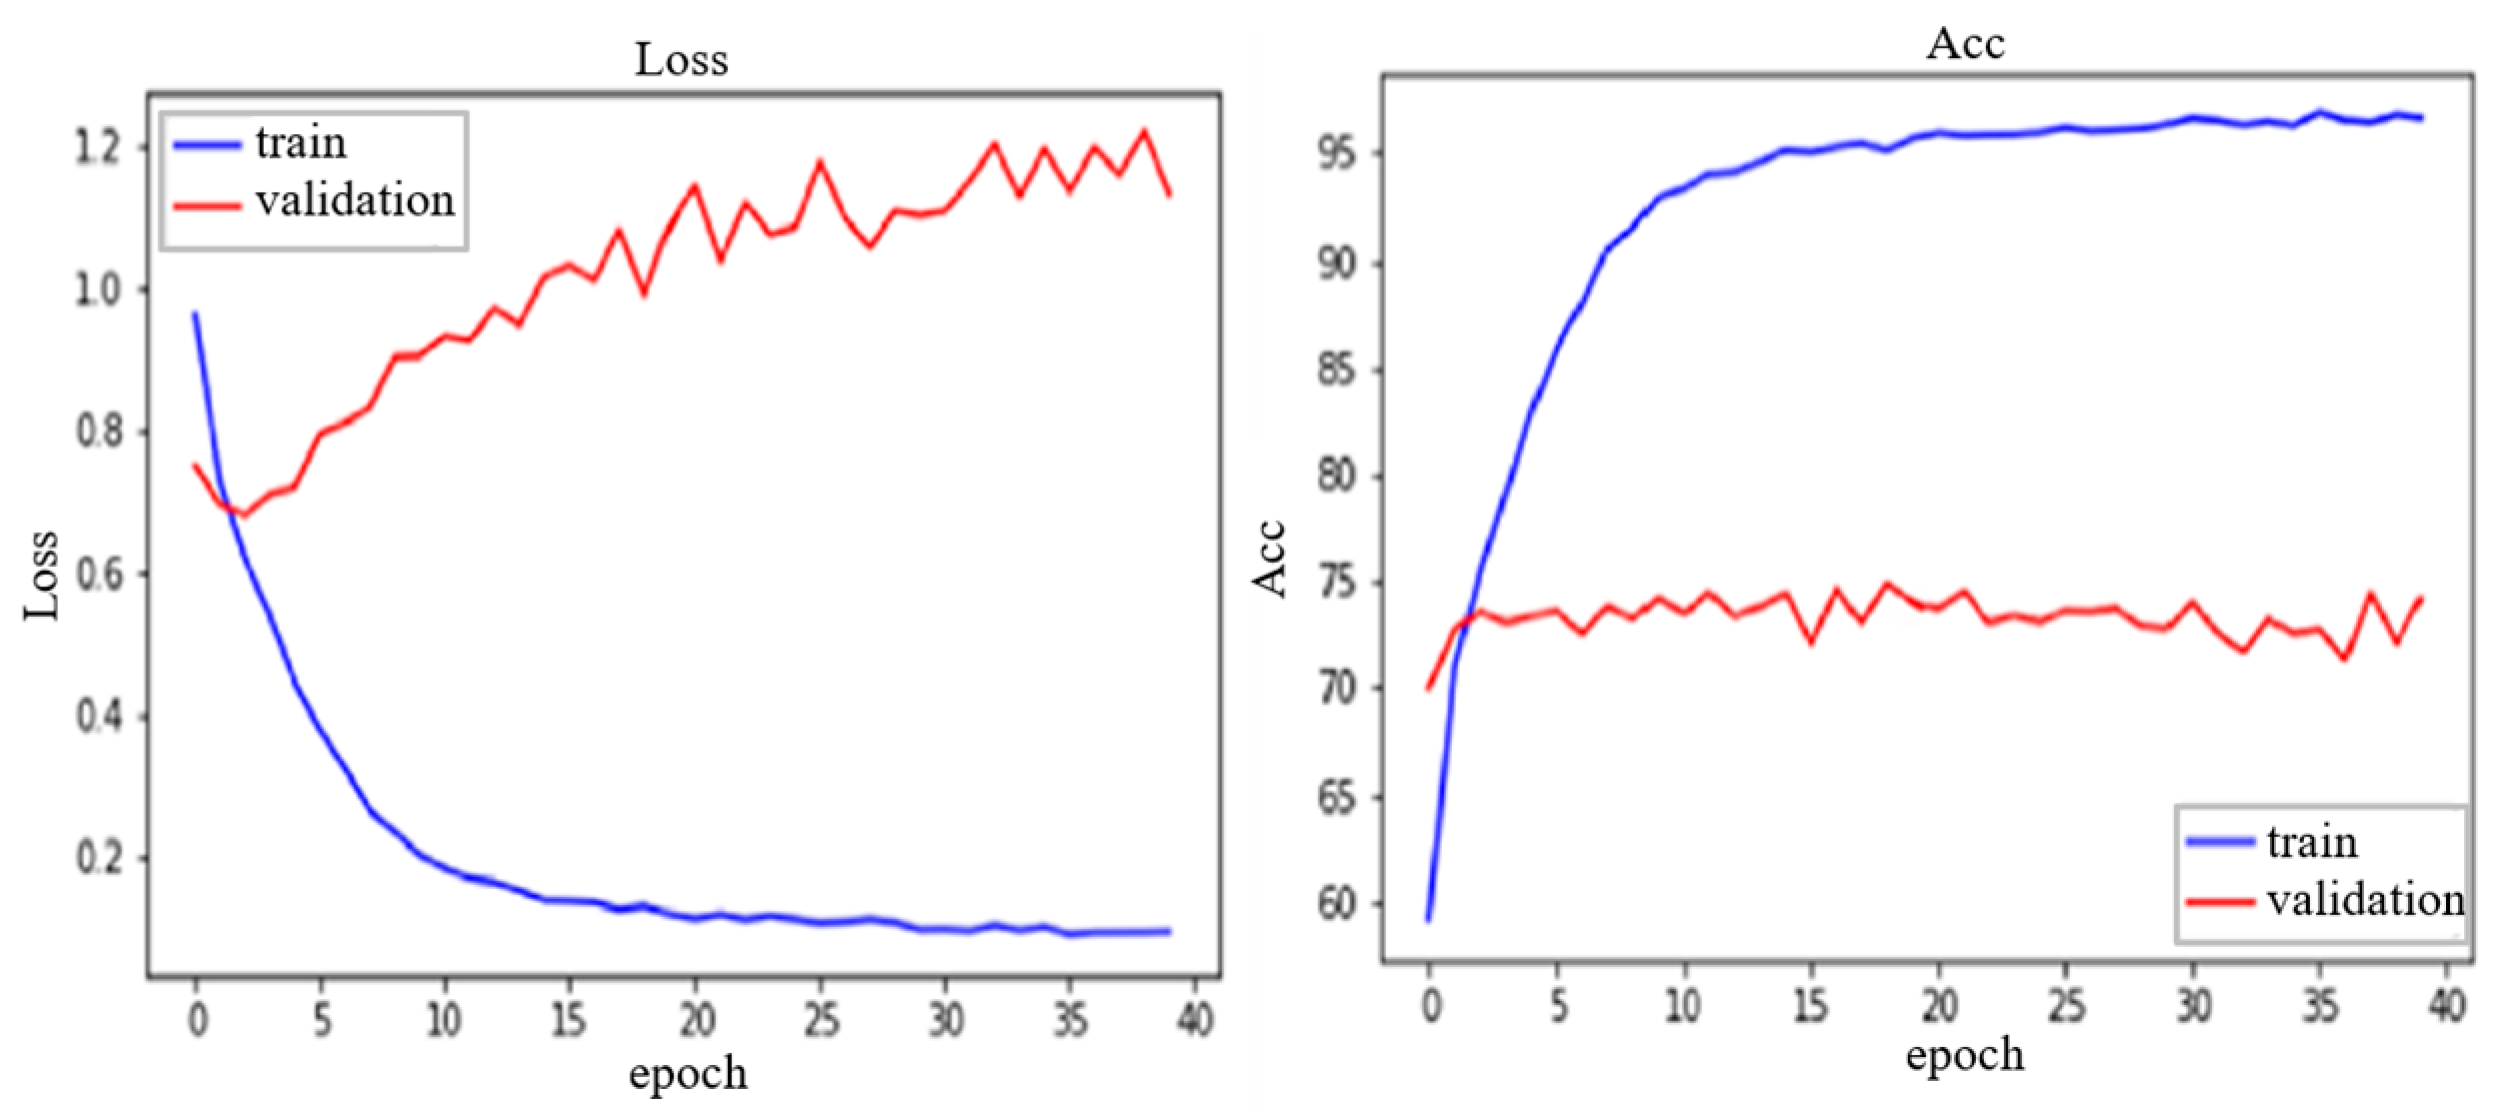
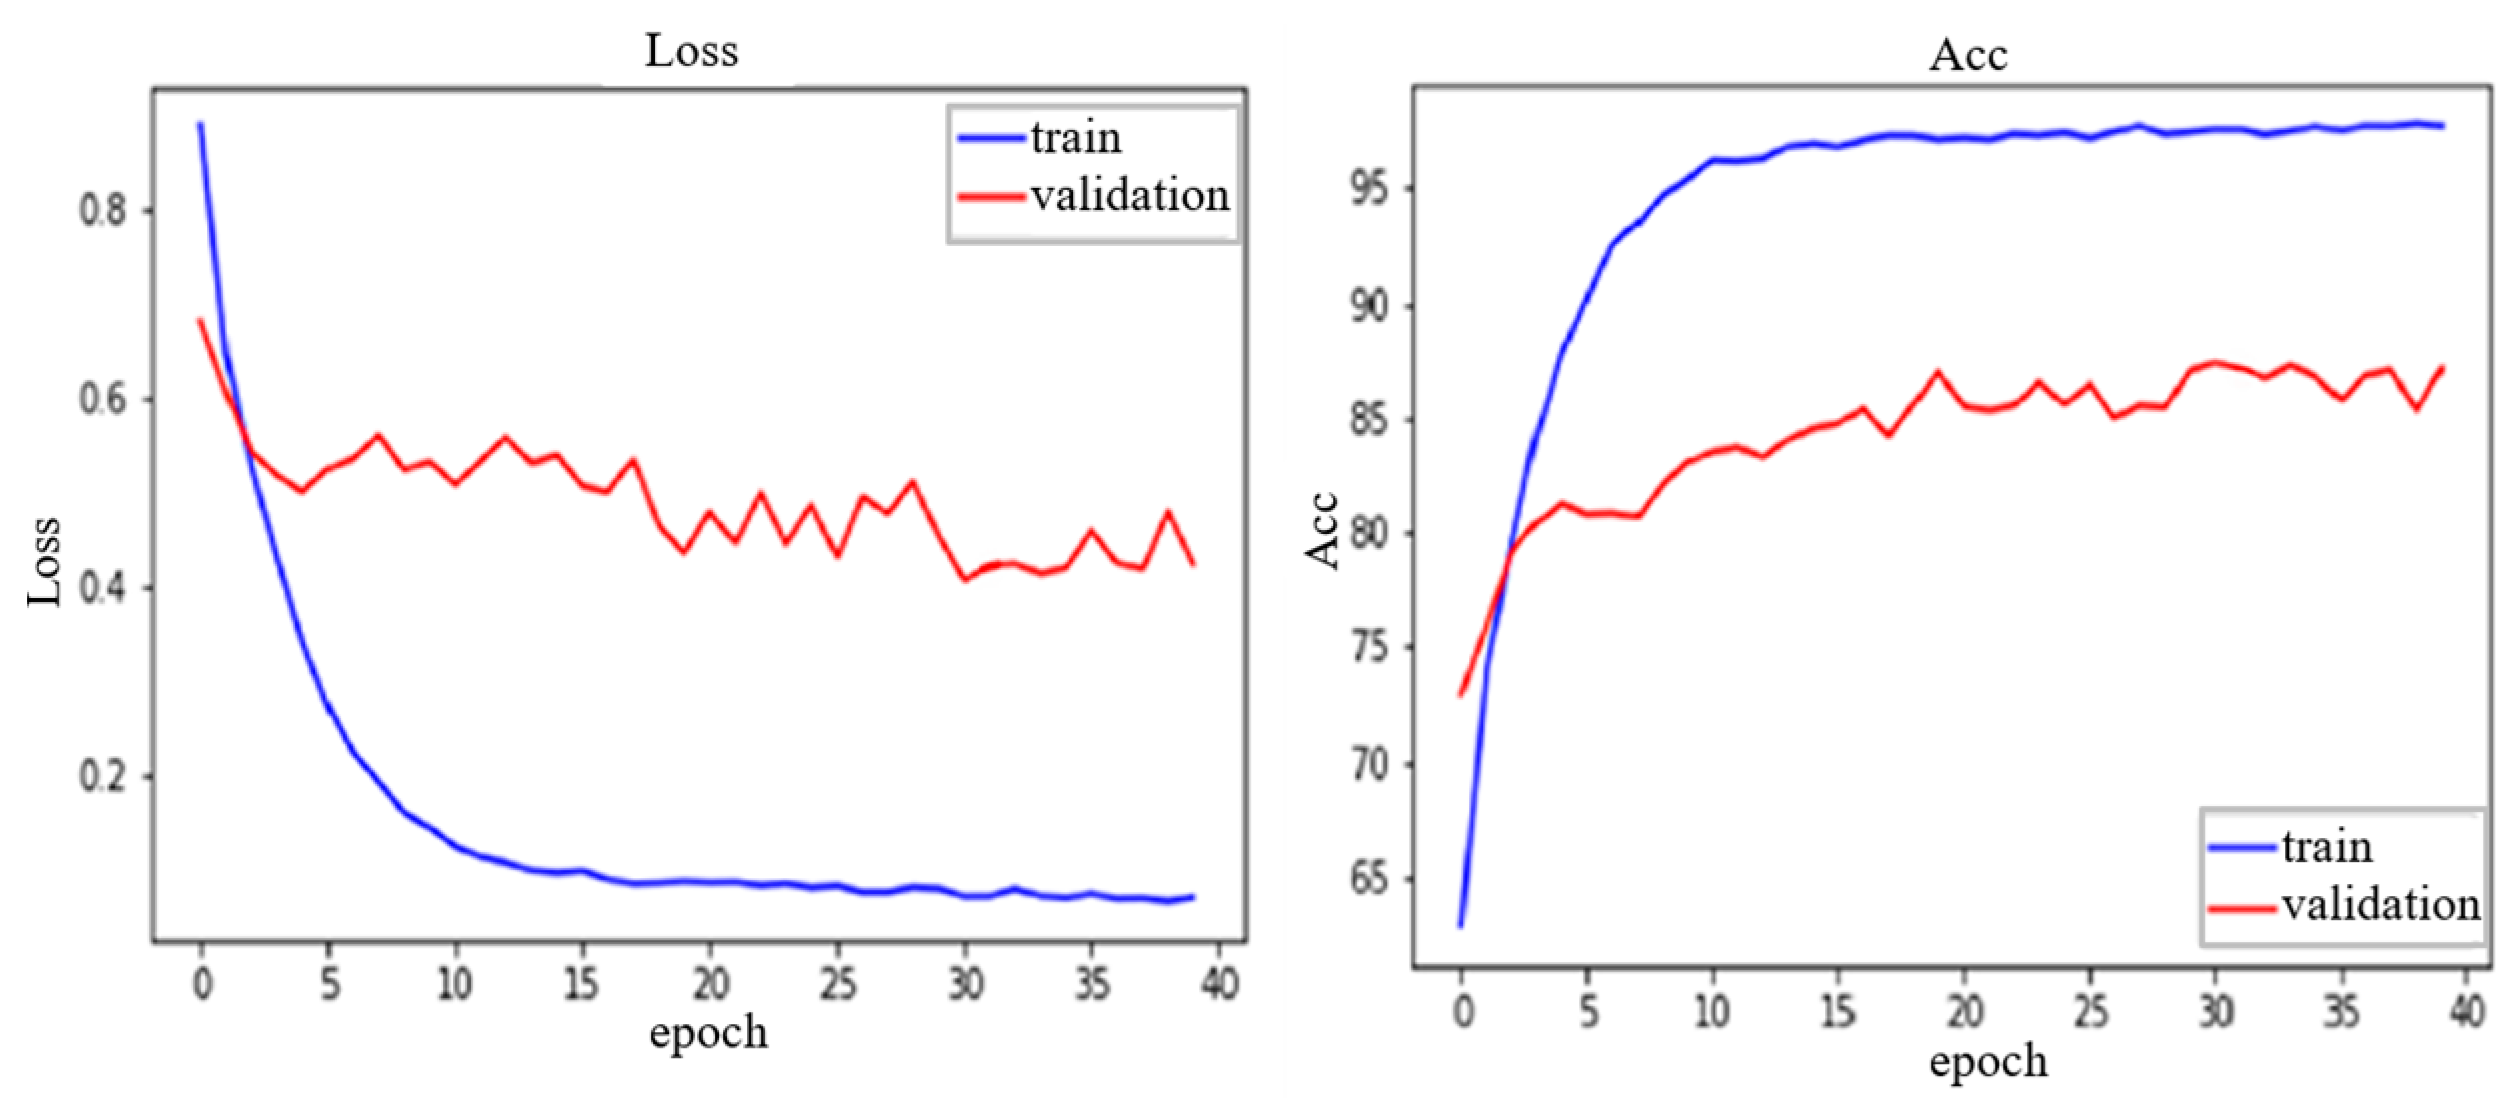
Figure 6 and Figure 7 below show the training curves used to check the training performance of the training and validation data in each setup, respectively. The reason for checking the training curves is to determine whether the model is currently under-fitted or over-fitted. If under-fitted, adding more data or increasing the model’s size can improve the model’s performance. In the figures, the loss graphs on the left refer to the difference between the ground truth and the model’s predicted value; if the loss is large, the data inference error will be large; if the loss is small, training is progressing properly. In the figures, accuracy is literally a value showing how accurate the model’s predicted value is compared to the ground truth. Furthermore, if loss decreases while accuracy increases, training is progressing properly. The training curves show the loss and accuracy values according to the epoch. As for the training curve of the loss graph of the model made only with image data, the loss value increases during validation as training progresses. Also, in the accuracy graph, the accuracy decreases and remains constant. This means that overfitting occurs as training progresses and that accuracy is low when emotions are predicted using facial expression images alone. Similarly, we were able to determine the loss and accuracy values according to epochs in the training and validation-based graphs of the set, including the HRV data. When bio-signal data are added to the existing image data, the loss value gradually decreases during verification in the loss graph. In addition, the model with added bio-signals has progressively increased accuracy and is overall higher in accuracy than the model generated with image data alone.

4. Result and Discussion

As shown in Figure 8, when we trained the model with only image data, we achieved 74% accuracy, and when combining bio-signals, we confirmed 88.2% accuracy. This suggests that accuracy increases when facial expression images and bio-signal data are analyzed together.
Accordingly, we developed an algorithm that predicts emotional states using a CNN for deep learning to analyze bio-signals and facial expression images together. We used EfficientNet-B0, a lightweight and high-performance model with a small number of parameters, to implement an emotion prediction model. In the FER-2013 dataset, our image-based model achieved a classification accuracy of 74%, showing better results than several existing models. Specifically, Liu et al. [18] reported an accuracy of 65.3%; Vulpe-Grigoraşi et al. [22] achieved 72.16%; Fard et al. [19] reached 72.3%; and Khaireddin et al. [42] recorded 73.28%. Additionally, by integrating physiological signals with facial expressions, our approach reached an accuracy of 88% on the same dataset, outperforming other models. The comparison is based on previous experiments on the FER-2013 dataset shown in Table 3.
HRV is traditionally measured in clinical settings, using ECG in which special electrodes are affixed to the patient’s body. This method, while accurate, requires access to medical facilities and equipment. However, advancements in technology have introduced more accessible ways to obtain HRV measurements. For example, signals can be received using chest straps. These devices allow for the continuous monitoring of HRV without the need for a hospital visit. Users can simply wear the chest strap, which collects ECG signals through sensors. This method offers convenient monitoring of emotional states or stress levels in real time, outside of a clinical setting. Moreover, the field of remote photoplethysmography (rPPG) is gaining traction among researchers for its non-invasive approach to health monitoring. rPPG technology enables the detection of various physiological parameters—including heart rate, blood pressure, oxygen saturation, and HRV—by observing the color changes in the face that correspond with the blood pulse. rPPG opens up a new path for remote health monitoring, offering a convenient way to assess physical conditions.
The combination of HRV data obtained through rPPG with emotions obtained from facial expression methods can enhance the accuracy of emotion detection systems. While facial expressions can provide valuable information about an individual’s emotional state, they can sometimes be misleading or difficult to interpret due to various factors such as cultural differences or individual differences in emotional expression. By incorporating physiological signals like HRV, which reflect the autonomic nervous system’s response to emotional stimuli, researchers can develop a deeper understanding of human emotions. This approach, combining visual signs with physiological data, holds promise for improving the reliability of emotion detection technologies, potentially benefiting a wide range of applications including mental health monitoring and psychological research. Furthermore, the integration of emotion recognition technology into autonomous vehicles helps to promptly detect driver stress and fatigue, which can prevent accidents on the road. By monitoring the driver’s emotional and physiological state, the vehicle can identify early signs of tiredness or stress and suggest appropriate measures, such as activating autonomous driving mode to allow the driver to rest or providing directions to the nearest rest area. However, it is essential to consider the limitations of this approach. Although our current dataset is limited to images from the FER2013 dataset alone, we plan to expand it by acquiring additional data. This will further improve our deep learning algorithm’s performance and the accuracy of emotion prediction. Currently, our system predicts four emotional states: angry, happy, sad, and neutral. However, we aim to expand our research to encompass additional emotions, such as fear and surprise, thereby increasing the system’s scalability. Another limitation is that the accuracy of the predictions heavily depends on the quality of the data. In facial emotion detection, factors such as lighting conditions, camera quality, and image resolution can significantly affect the performance of the model. Similarly, in HRV signal analysis, factors like sensor accuracy, user movement, signal noise, and individual physiological differences can impact the reliability of emotion predictions.

5. Conclusions

This study’s findings demonstrate that integrating facial expression analysis with HRV data enhances emotion recognition accuracy. This integrative approach addresses the limitations of relying solely on facial expressions for emotion detection, which can be misleading or insufficient due to controlled facial expressions. The inclusion of HRV data addresses this limitation by providing an additional, more objective measure of emotional state. The EfficientNet-B0 model demonstrated promising results, with an improvement in accuracy from 74% to 88.2% when integrating HRV data with facial expression images.
Future research will focus on increasing data diversity, exploring additional bio-signals, and testing the model in real-world conditions to address these limitations. By incorporating a wider variety of datasets and expanding the range of detectable emotions, we aim to enhance the robustness and applicability of our emotion prediction system.

Author Contributions

Conceptualization, J.-H.L., M.K.; methodology, J.-H.L.; software, M.K.; validation, J.-H.L., M.K.; formal analysis, M.K.; investigation, J.-H.L.; resources, J.-H.L., M.K.; data curation, J.-H.L., M.K.; writing—original draft preparation, J.-H.L., M.K.; writing—review and editing, J.-H.L., M.K.; visualization, J.-H.L., M.K.; supervision, J.-H.L., M.K. All authors have read and agreed to the published version of the manuscript.

Funding

This research was financially supported by “The digital pathology-based AI analysis solution development project” through the Ministry of Health and Welfare, Republic of Korea (HI21C0977), Digital Innovation Hub project supervised by the Daegu Digital Innovation Promotion Agency (DIP) grant funded by the Korea government (MSIT and Daegu Metropolitan City) in 2023 (DBSD1-06), Basic Research Program through the National Research Foundation of Korea (NRF-2022R1I1A307278) and “Development of camera-based non-contact medical device with universal design” through the project (RS-2022-00166898). The Korea Health Technology R&D Project through the Korea Health Industry Development Institute (KHIDI), funded by the Ministry of Health & Welfare, Republic of Korea (grant number: HI20C1234).

Data Availability Statement

Data are contained within the article.

Conflicts of Interest

The authors declare no conflicts of interest.

References

  1. Cha, W.-Y.; Shin, D.-K.; Shin, D.-I. Analysis and Comparison of The Emotion Recognition by Multiple Bio-Signal. In Proceedings of the Korean Information Science Society Conference, Seoul, Republic of Korea, 10–13 December 2017; pp. 104–105. [Google Scholar]
  2. Kortelainen, J.; Tiinanen, S.; Huang, X.; Li, X.; Laukka, S.; Pietikäinen, M.; Seppänen, T. Multimodal emotion recognition by combining physiological signals and facial expressions: A preliminary study. In Proceedings of the 2012 Annual International Conference of the IEEE Engineering in Medicine and Biology Society, San Diego, CA, USA, 28 August–1 September 2012; pp. 5238–5241. [Google Scholar] [CrossRef]
  3. Ioannou, S.V.; Raouzaiou, A.T.; Tzouvaras, V.A.; Mailis, T.P.; Karpouzis, K.C.; Kollias, S.D. Emotion recognition through facial expression analysis based on a neurofuzzy network. Neural Netw. 2005, 18, 423–435. [Google Scholar] [CrossRef]
  4. Zhang, Y.-D.; Yang, Z.-J.; Lu, H.-M.; Zhou, X.-X.; Phillips, P.; Liu, Q.-M.; Wang, S.-H. Facial Emotion Recognition Based on Biorthogonal Wavelet Entropy, Fuzzy Support Vector Machine, and Stratified Cross Validation. IEEE Access 2016, 4, 8375–8385. [Google Scholar] [CrossRef]
  5. Barrett, L.F.; Russell, J.A. Independence and bipolarity in the structure of current affect. J. Pers. Soc. Psychol. 1998, 74, 967–984. [Google Scholar] [CrossRef]
  6. Tacconi, D.; Mayora, O.; Lukowicz, P.; Arnrich, B.; Setz, C.; Troster, G.; Haring, C. Activity and emotion recognition to support early diagnosis of psychiatric diseases. In Proceedings of the Second International Conference on Pervasive Computing Technologies for Healthcare, Tampere, Finland, 30 January–1 February 2008; pp. 100–102. [Google Scholar] [CrossRef]
  7. Pujol, F.A.; Mora, H.; Martínez, A. Emotion Recognition to Improve e-Healthcare Systems in Smart Cities. In Research & Innovation Forum 2019: Technology, Innovation, Education, and their Social Impact 1; Visvizi, A., Lytras, M., Eds.; Springer Proceedings in Complexity; Springer: Cham, Switzerland, 2019. [Google Scholar] [CrossRef]
  8. Wioleta, S. Using physiological signals for emotion recognition. In Proceedings of the 6th International Conference on Human System Interactions (HSI), Gdansk, Poland, 6–8 June 2013; pp. 556–561. [Google Scholar]
  9. Shin, J.; Maeng, J.; Kim, D.-H. Inner Emotion Recognition Using Multi Bio-Signals. In Proceedings of the 2018 IEEE International Conference on Consumer Electronics—Asia (ICCE-Asia), Jeju, Republic of Korea, 24–26 June 2018; pp. 206–212. [Google Scholar] [CrossRef]
  10. Mansouri-Benssassi, E.; Ye, J. Generalisation and robustness investigation for facial and speech emotion recognition using bio-inspired spiking neural networks. Soft Comput. 2021, 25, 1717–1730. [Google Scholar] [CrossRef]
  11. Quintana, D.S.; Guastella, A.J.; Outhred, T.; Hickie, I.B.; Kemp, A.H. Heart rate variability is associated with emotion recognition: Direct evidence for a relationship between the autonomic nervous system and social cognition. Int. J. Psychophysiol. 2012, 86, 168–172. [Google Scholar] [CrossRef] [PubMed]
  12. Roveda, J.M.; Fink, W.; Chen, K.; Wu, W.-T. Psychological health monitoring for pilots and astronauts by tracking sleep-stress-emotion changes. In Proceedings of the IEEE Aerospace Conference, Big Sky, MT, USA, 5–12 March 2016; pp. 1–9. [Google Scholar] [CrossRef]
  13. Randazzo, V.; Ferretti, J.; Pasero, E. Anytime ECG Monitoring through the Use of a Low-Cost, User-Friendly, Wearable Device. Sensors 2021, 21, 6036. [Google Scholar] [CrossRef] [PubMed] [PubMed Central]
  14. Jing, C.; Liu, G.; Hao, M. The Research on Emotion Recognition from ECG Signal. In Proceedings of the International Conference on Information Technology and Computer Science, Kiev, Ukraine, 25–26 July 2009; pp. 497–500. [Google Scholar]
  15. Ravindran, A.S.; Nakagome, S.; Wickramasuriya, D.S.; Contreras-Vidal, J.L.; Faghih, R.T. Emotion Recognition by Point Process Characterization of Heartbeat Dynamics. In Proceedings of the IEEE Healthcare Innovations and Point of Care Technologies, Bethesda, MD, USA, 20–22 November 2019; pp. 13–16. [Google Scholar]
  16. Khomidov, M.; Lee, D.; Kim, C.-H.; Lee, J.-H. The Real-Time Image Sequences-Based Stress Assessment Vision System for Mental Health. Electronics 2024, 13, 2180. [Google Scholar] [CrossRef]
  17. Goodfellow, I.J.; Erhan, D.; Carrier, P.L.; Courville, A.; Mirza, M.; Hamner, B.; Cukierski, W.; Tang, Y.; Thaler, D.; Lee, D.-H.; et al. Challenges in representation learning: A report on three machine learning contests. In Proceedings of the International Conference on Neural Information Processing, Daegu, Republic of Korea, 3–7 November 2013; Springer: Berlin/Heidelberg, Germany, 2013; pp. 117–124. [Google Scholar] [CrossRef]
  18. Liu, K.; Zhang, M.; Pan, Z. Facial Expression Recognition with CNN Ensemble. In Proceedings of the 2016 International Conference on Cyberworlds (CW), Chongqing, China, 28–30 September 2016; pp. 163–166. [Google Scholar] [CrossRef]
  19. Fard, A.P.; Mahoor, M.H. Ad-Corre: Adaptive Correlation-Based Loss for Facial Expression Recognition in the Wild. IEEE Access 2022, 10, 26756–26768. [Google Scholar] [CrossRef]
  20. Chollet, F. Xception: Deep Learning with Depthwise Separable Convolutions. In Proceedings of the 2017 IEEE Conference on Computer Vision and Pattern Recognition (CVPR), Honolulu, HI, USA, 21–26 July 2017; pp. 1800–1807. [Google Scholar] [CrossRef]
  21. He, K.; Zhang, X.; Ren, S.; Sun, J. Deep Residual Learning for Image Recognition. In Proceedings of the 2016 IEEE Conference on Computer Vision and Pattern Recognition (CVPR), Las Vegas, NV, USA, 27–30 June 2016; pp. 770–778. [Google Scholar] [CrossRef]
  22. Vulpe-Grigoraşi, A.; Grigore, O. Convolutional Neural Network Hyperparameters optimization for Facial Emotion Recognition. In Proceedings of the 2021 12th International Symposium on Advanced Topics in Electrical Engineering (ATEE), Bucharest, Romania, 25–27 March 2021; pp. 1–5. [Google Scholar] [CrossRef]
  23. Vignesh, S.; Savithadevi, M.; Sridevi, M.; Sridhar, R. A novel facial emotion recognition model using segmentation VGG-19 architecture. Int. J. Inf. Technol. 2023, 15, 1777–1787. [Google Scholar] [CrossRef]
  24. Pham, L.; Vu, T.H.; Tran, T.A. Facial Expression Recognition Using Residual Masking Network. In Proceedings of the 2020 25th International Conference on Pattern Recognition (ICPR), Milan, Italy, 10–15 January 2021; pp. 4513–4519. [Google Scholar] [CrossRef]
  25. Guo, H.-W.; Huang, Y.-S.; Lin, C.-H.; Chien, J.-C.; Haraikawa, K.; Shieh, J.-S. Heart Rate Variability Signal Features for Emotion Recognition by Using Principal Component Analysis and Support Vectors Machine. In Proceedings of the 2016 IEEE 16th International Conference on Bioinformatics and Bioengineering (BIBE), Taichung, Taiwan, 31 October–2 November 2016; pp. 274–277. [Google Scholar] [CrossRef]
  26. Vapnik, V. Statistical Learning Theory; Wiley: New York, NY, USA, 1998. [Google Scholar]
  27. Ferdinando, H.; Seppänen, T.; Alasaarela, E. Emotion Recognition Using Neighborhood Components Analysis and ECG/HRV-Based Features. In Pattern Recognition Applications and Methods: 6th International Conference, ICPRAM 2017, Porto, Portugal, 24–26 February 2017; De Marsico, M., di Baja, G., Fred, A., Eds.; Lecture Notes in Computer Science; Springer: Cham, Switzerland, 2018; Volume 10857. [Google Scholar] [CrossRef]
  28. Goldberger, J.; Roweis, S.; Hinton, G.; Salakhutdinov, R. Neighbourhood Components Analysis. Adv. Neural Inf. Process. Syst. 2004, 17, 1–8. [Google Scholar]
  29. Lee, M.; Lee, Y.K.; Lim, M.-T.; Kang, T.-K. Emotion Recognition Using Convolutional Neural Network with Selected Statistical Photoplethysmogram Features. Appl. Sci. 2020, 10, 3501. [Google Scholar] [CrossRef]
  30. Ngai, W.K.; Xie, H.; Zou, D.; Chou, K.-L. Emotion recognition based on convolutional neural networks and heterogeneous bio-signal data sources. Inf. Fusion 2022, 77, 107–117. [Google Scholar] [CrossRef]
  31. Hassouneh, A.; Mutawa, A.M.; Murugappan, M. Development of a Real-Time Emotion Recognition System Using Facial Expressions and EEG based on machine learning and deep neural network methods. Inform. Med. Unlocked 2020, 20, 100372. [Google Scholar] [CrossRef]
  32. Godin, C.; Prost-Boucle, F.; Campagne, A.; Charbonnier, S.; Bonnet, S.; Vidal, A. Selection of the Most Relevant Physiological Features for Classifying Emotion. In Proceedings of the 2nd International Conference on Physiological Computing Systems, Loire Valley, France, 11–13 February 2015; pp. 17–25. [Google Scholar]
  33. Dzedzickis, A.; Kaklauskas, A.; Bucinskas, V. Human Emotion Recognition: Review of Sensors and Methods. Sensors 2020, 20, 592. [Google Scholar] [CrossRef] [PubMed]
  34. Singson, L.N.B.; Sanchez, M.T.U.R.; Villaverde, J.F. Emotion Recognition Using Short-Term Analysis of Heart Rate Variability and ResNet Architecture. In Proceedings of the 13th International Conference on Computer and Automation Engineering (ICCAE), Melbourne, Australia, 20–22 March 2021; pp. 15–18. [Google Scholar] [CrossRef]
  35. Du, G.; Long, S.; Yuan, H. Non-Contact Emotion Recognition Combining Heart Rate and Facial Expression for Interactive Gaming Environments. IEEE Access 2020, 8, 11896–11906. [Google Scholar] [CrossRef]
  36. Tan, M.; Le, Q.V. EfficientNet: Rethinking Model Scaling for Convolutional Neural Networks. In Proceedings of the International Conference on Machine Learning, Long Beach, CA, USA, 9–15 June 2019; pp. 6105–6114. [Google Scholar]
  37. Pal, K.K.; Sudeep, K.S. Preprocessing for image classification by convolutional neural networks. In Proceedings of the IEEE International Conference on Recent Trends in Electronics, Information & Communication Technology (RTEICT), Bangalore, India, 20–21 May 2016; pp. 1778–1781. [Google Scholar] [CrossRef]
  38. Zhang, H.; Jolfaei, A.; Alazab, M. A Face Emotion Recognition Method Using Convolutional Neural Network and Image Edge Computing. IEEE Access 2019, 7, 159081–159089. [Google Scholar] [CrossRef]
  39. Zhao, L.; Yang, L.; Shi, H.; Xia, Y.; Li, F.; Liu, C. Evaluation of consistency of HRV indices change among different emotions. In Proceedings of the Chinese Automation Congress (CAC), Jinan, China, 20–22 October 2017; pp. 4783–4786. [Google Scholar] [CrossRef]
  40. Pitaloka, D.A.; Wulandari, A.; Basaruddin, T.; Liliana, D.Y. Enhancing CNN with Preprocessing Stage in Automatic Emotion Recognition. Procedia Comput. Sci. 2017, 116, 523–529. [Google Scholar] [CrossRef]
  41. Li, X.; Song, D.; Zhang, P.; Yu, G.; Hou, Y.; Hu, B. Emotion recognition from multi-channel EEG data through Convolutional Recurrent Neural Network. In Proceedings of the IEEE International Conference on Bioinformatics and Biomedicine (BIBM), Shenzhen, China, 15–18 December 2016; pp. 352–359. [Google Scholar] [CrossRef]
  42. Khaireddin, Y.; Chen, Z. Facial Emotion Recognition: State of the Art Performance on FER2013. arXiv 2021, arXiv:2105.03588. [Google Scholar]
Figure 1. FER2013 dataset picture examples.
Algorithms 17 00285 g001
Figure 2. ECG R peak.
Algorithms 17 00285 g002
Figure 3. ECG signal visualization.
Algorithms 17 00285 g003
Figure 4. ECG Poincaré plot of (a) angry, (b) happy, (c) neutral, and (d) sad emotions. The standard deviations are referred to as SD1 (green line) and SD2 (blue line).
Algorithms 17 00285 g004
Figure 5. Comparison of models for analyzing emotions using a facial expression image and bio-signal. (a) A model using only FER2013 image data, (b) a model in which 64 features are encoded and 256 features of FER2013 image data are linked through individual dense layers for the HRV index.
Algorithms 17 00285 g005
Figure 6. The learning curve for the model using only FER2013 image data.
Algorithms 17 00285 g006
Figure 7. The learning curve for the model using HRV index and FER2013 images.
Algorithms 17 00285 g007
Figure 8. Graph of comparison of model accuracy according to experiment.
Algorithms 17 00285 g008
Table 1. Example of bio-signal data used in training.
Emotions
Index NeutralSadHappyAngry
SDNNMean ± SD50 ± 1847 ± 1655 ± 1951 ± 18
RMSSDMean ± SD41 ± 1940 ± 1843 ± 1844 ± 21
LFMean ± SD0.54 ± 0.170.54 ± 0.160.66 ± 0.150.53 ± 0.18
HFMean ± SD0.46 ± 0.170.46 ± 0.160.34 ± 0.150.47 ± 0.18
LF/HFMean ± SD1.6 ± 1.21.5 ± 1.02.9 ± 3.61.5 ± 1.1
SampEnMean ± SD1.78 ± 0.251.90 ± 0.2621.90 ± 0.281.97 ± 0.24
Table 2. Hyperparameter values of the model.
Model ParametersValue
Input Size224 × 224
Learning Rate0.0001
Epoch40
Batch Size16
Table 3. Comparison based on previous experiments on FER-2013 dataset.
AuthorsMethodAccuracy
Liu et al. [18]CNN Ensemble65.3%
Vulpe-Grigoraşi et al. [22]CNN-Hyperparameter optimization72.16%
Fard et al. [19]Ad-Corre Loss72.3%
Khaireddin et al. [42]VGG with hyper-parameters fine-tuning73.28%
Pham et al. [24]ResMaskingNet (ResNet with spatial attention)74.14%
Vignesh et al. [23]U-Net segmentation layers in between (VGG)75.97%
Pham et al. [24]ensemble of 6 convolutional neural networks76.82%
Ours without HRVEfficientNet74%
Ours with HRVEfficientNet88.2%
Disclaimer/Publisher’s Note: The statements, opinions and data contained in all publications are solely those of the individual author(s) and contributor(s) and not of MDPI and/or the editor(s). MDPI and/or the editor(s) disclaim responsibility for any injury to people or property resulting from any ideas, methods, instructions or products referred to in the content.