Article

Qualitative Perturbation Analysis and Machine Learning: Elucidating Bacterial Optimization of Tryptophan Production

by
Miguel Angel Ramos-Valdovinos
1,
Prisciluis Caheri Salas-Navarrete
2,
Gerardo R. Amores
1,
Ana Lilia Hernández-Orihuela
3 and
Agustino Martínez-Antonio
1,*
1
Laboratorio de Ingeniería Biológica, Departamento de Ingeniería Genética, Centro de Investigación y de Estudios Avanzados del Instituto Politécnico Nacional (CINVESTAV-Unidad Irapuato), Km 9.6 Carr. Irapuato-León, Irapuato 36824, Guanajuato, Mexico
2
Data Science Manager Analytics and Data Governance, Nacional de Drogas Av. Vasco de Quiroga No. 3100 Col. Centro de Ciudad Santa Fe, Álvaro Obregón, Mexico City 01210, Mexico
3
Biofab México, 5 de Mayo No. 517, Irapuato 36500, Guanajuato, Mexico
*
Author to whom correspondence should be addressed.
Algorithms 2024, 17(7), 282; https://doi.org/10.3390/a17070282
Submission received: 29 May 2024 / Revised: 20 June 2024 / Accepted: 24 June 2024 / Published: 27 June 2024

Abstract

:
L-tryptophan is an essential amino acid widely used in the pharmaceutical and feed industries. Enhancing its production in microorganisms necessitates activating and inactivating specific genes to direct more resources toward its synthesis. In this study, we developed a classification model based on Qualitative Perturbation Analysis and Machine Learning (QPAML). The model uses pFBA to obtain optimal reactions for tryptophan production and FSEOF to introduce perturbations on fluxes of the optima reactions while registering all changes over the iML1515a Genome-Scale Metabolic Network model. The altered reaction fluxes and their relationship with tryptophan and biomass production are translated to qualitative variables classified with GBDT. In the end, groups of enzymatic reactions are predicted to be deleted, overexpressed, or attenuated for tryptophan and 30 other metabolites in E. coli with a 92.34% F1-Score. The QPAML model can integrate diverse data types, promising improved predictions and the discovery of complex patterns in microbial metabolic engineering. It has broad potential applications and offers valuable insights for optimizing microbial production in biotechnology.

1. Introduction

L-tryptophan is an essential amino acid and a crucial raw material for several industries. For instance, tryptophan is the precursor of an economically important auxin called Indole-3-Acetic Acid (IAA), which Plan Growth-Promoting Rhizobacteria (PGPR) uses to interact with and colonize plants [1].
Relevant gene expression should be modified to enhance metabolite flux in a biosynthetic pathway. These modifications mainly include overexpression, silencing, and attenuation [2].
The pathway for tryptophan production is intricately regulated [3], as revealed by meticulous studies. These studies have identified over 40 genetic modifications to enhance tryptophan production in E. coli [4,5,6,7,8,9,10,11,12,13,14,15,16,17]. Given tryptophan’s relevance, various strategies have been implemented to improve tryptophan production with different microorganisms [8].
A pivotal strategy for achieving efficient metabolite production through metabolic engineering involves coupling the metabolite of interest to biomass production. This approach assumes that cell growth is necessary to produce the metabolite of interest as a byproduct [18]. While growth-coupled production may apply to nearly all metabolites, the fine-tuned balance between growth and production necessitates controlled culture conditions and may require several genetic modifications [19]. For instance, achieving the overproduction of tryptophan by coupling anthranilate production to growth is feasible; however, it also necessitates the overexpression of downstream pathways to redirect the flux toward tryptophan production [17].

1.1. Related Work

The large number of reactions catalyzed by microorganisms like E. coli makes it impractical to conduct wet-lab experiments to test all potential genetic modifications, despite the availability of resources such as the Keio collection [20], which serves as a valuable repository for systematic genome-wide testing of single non-essential mutated genes in the E. coli K-12 BW25113 background.
In their place, algorithms are developed to make the selection of genes to modify more straightforward. Some available algorithms integrate Flux Balance Analysis (FBA) and bi-level optimization to identify reactions that improve metabolite production when silenced [2,18,21,22,23,24,25,26,27,28]. Parsimonious Enzyme Usage Flux Balance Analysis (pFBA) is centered on optimizing biomass production; the conception behind pFBA is that the cells with faster growth rates are selected over multiple generations because they develop a fitness advantage using the least number and quantity of enzymes [29]. pFBA classifies reactions into essential, optima, Metabolically Less Efficient (MLE), Enzymatic Less Efficient (ELE), and no-flux related to biomass production. On their part, the Flux Scanning based on Enforced Objective Flux (FSEOF) registers changes in the fluxes of the metabolic network when the system moves from reference to intermediate states until it arrives at the simulated theoretical maximum flux of the selected target metabolite [30]. The algorithm registers these changes by filtering the fluxes that increase when the target product increases; thus, it predicts reaction candidates to overexpression.
Transport reactions are crucial in producing metabolites such as tryptophan [4]. Secreting metabolites into the medium improves their production because it reduces the feedback inhibition of the enzymes of the biosynthetic pathway [31]. However, coupling transport reactions to biomass production in metabolic models necessitates multiple modifications to the metabolic network, especially if all competing pathways are contemplated.

1.2. Research Overview

This study begins with an assumption and a straightforward question: If we start from scratch to design genetic modifications on a metabolic pathway to optimize the production of a target metabolite, can we make a model that helps us to predict the reactions more relevant to modification? In this sense, tryptophan production is a suitable master pathway to comparison, given the extensive investigations that provide information on over 40 genetic modifications made by several research groups to increase its production. Few algorithms are capable of simultaneously predicting activation, inactivation, and attenuation. OptReg [2] is one of these algorithms; however, based on mixed-integer programming (MIP), proprietary software is required to solve MIP problems efficiently. When multiple reaction modifications are allowed, the computational demand grows exponentially, so it is not practical to obtain a general overview of the fluxes in a genome-scale metabolic network [28]. Furthermore, it has been found that algorithms based on optimization approaches, such as OptKnock, often fail to identify pathways that compete with metabolite production [21].
Most algorithms to identify candidate reactions that affect the production of metabolites have been developed based on mathematical optimization models. Our classification model is the first trained with experimentally tested genetic modifications. The model is also fed with information generated by COBRA methods, such as pFBA and FSEOF, combining its characteristics and extending their separated functionality. Surprisingly, being trained with only 40 validated reactions to overproduce tryptophan, the qualitative variables compile and fuse to build the QPAML model integer the reactions fluxes for optimizing the production of metabolites in a more general way, yielding classification of 322 reactions that improve the production of 30 other endogenous metabolites without the need to retrain the model.
The robustness of the QPAML model is based on using FSEOF to introduce perturbations on optima reactions and observing the resulting changes in the flux distribution, identifying potential bottlenecks and competing reactions [32], and extracting information about the optimal structure of the involved metabolic network [33]. To select the optimal reactions to be perturbed, we used the pFBA algorithm to define an optimal pathway to synthesize tryptophan from glucose.
However, the information currently available to relate the production of metabolites with genetic modifications is dispersed and needs to be improved in terms of quantity and quality. To deal with this problem, we translate quantitative to qualitative variables by implementing Qualitative Perturbation Analysis (QPA) [34]. An advantage of employing QPA lies in its ability to predict system responses to defined perturbations and, conversely, to identify perturbations that cause a system response [35]. This approach allows the computational demand to be low when classifying all the reactions of the metabolic network.
Perturbation theory has been synergistically incorporated with machine learning (ML), for instance, to predict medication regimes and calculate metabolic network properties [33]. Notably, the Gradient-Boosting Decision Tree (GBDT) stands out as an ML algorithm recognized for its high accuracy in real-world classification problems [36]. Thus, GBDT was used to make final reaction classifications of the qualitative variables.
Consequently, the result of coupling Qualitative Perturbation Analysis with Machine Learning (QPAML) introduced here is the first classification model that reveals biochemical reaction fluxes when a metabolite overproduction is intended [37].
The results of the QPAML model are congruent with 322 experimentally reported reactions in the overproduction of 31 metabolites. Particularly notable is the model’s proficiency in identifying competing pathways. Furthermore, the model demonstrates robustness to culture conditions and different E. coli genetic backgrounds.
Since our focus was on tryptophan, but measuring it could be challenging, we used a plasmid with two genes that transform tryptophan to indole acetic acid (IAA) and quantified this last in some single-gene deletions to compare with the model predictions. The model could differentiate reactions with the highest impact on the production of tryptophan and provide a rational explanation for reactions with less impact when testing individual mutants of the Keio collection.
Unlike other MIP-based algorithms, our model is computationally efficient and does not require proprietary software. The code is available at https://gitlab.com/amalib/qpaml (accessed on 31 January 2024). We hope QPAML provides insights into the critical reactions that govern the production of metabolites and allows for an understanding of the metabolic dynamics inside bacteria.

2. Materials and Methods

2.1. Bacterial Strains, Media, and Growth Conditions

The list of bacterial strains used in this study is presented in Table 1. Escherichia coli wild type (BW25113) or strains genetically depleted of poxB, gltB, pykA, pykF, tdcD, ackA, tyrA, pheA, tnaA, tnaB, and mtr [20] served as a host for the pIAAMHs plasmid used in this study (see Supplementary Figure S1). E. coli cells were grown in Luria Broth media (1% tryptone, 0.5% yeast extract, and 1% NaCl) at 37 °C, 220 rpm, for 24 h, supplemented with the appropriate antibiotic Kanamycin (35 µg/mL) or Carbenicillin (100 µg/mL) when necessary.
The pIAAMHs plasmid was constructed in the biological engineering laboratory by co-author Hernández-Orihuela derived from the pCold IV vector (Takara Bio Inc., San Jose, CA, USA), containing synthetic genes from Pseudomonas savastanoi responsible for the conversion of tryptophan to indole-3-acetamide (iaaM) and its subsequent conversion to IAA (iaaH), was individually transformed into each strain. The competent cell preparations and plasmid transformation were conducted following the protocols described by Sambrook and Russell [38].

2.2. Growth Kinetics

Each strain was inoculated and grown overnight, as indicated above. Stationary phase cultures were diluted to a final optical density (OD 600 nm) of 0.05 in 200 μL of LB medium. Cell growth was quantified every 30 min over an 11 h incubation at 37 °C using a Victor X3 plate reader (PerkinElmer, Waltham, MA, USA). Under these conditions, all strains presented similar growth rates with or without plasmid (Supplementary Figures S2 and S3). Data were analyzed from three biological samples, and the mean and standard error for each strain were calculated and graphed using Microsoft Excel software version 2405.

2.3. pIAAMHs Induction for IAA Production

A single clone of each strain was inoculated and grown overnight as indicated at growth conditions. Stationary phase cultures were diluted to a final OD at 600 nm of 0.05 in 20 mL of LB medium and grown at 37 °C for 2–4 h to an OD between 0.7 and 0.9. A 1 mL aliquot was taken to determine IAA (T = 0). Subsequently, Isopropyl-β-D-1-thiogalactopyranoside (IPTG) was added at the final concentration of 0.1 mM; meanwhile, the culture was cooled on ice at 4 °C for 20 min. Immediately, the culture was incubated at 16 ˚C, 220 rpm for 24 h. Finally, 1.5 mL of the culture was pelleted at 13000 rpm for 1.5 min. The supernatant was employed to determine growth (OD 600 nm) and IAA (OD 530 nm) (T = 24) in a 1 mL spectrophotometer cuvette.

2.4. IAA/Tryptophan Determination

The Salkowski reagent method [39] is simple, rapid, and affordable; allows the analysis of bacterial supernatants; and detects IAA and derivates of tryptophan [40]. This method was used with slight modifications to indirectly determine the production of tryptophan through IAA quantification. The Salkowski solution was prepared by weighing 0.41 g of FeCl3 and dissolved in 20 mL of H2SO4 plus 33 mL of sterile water. Then, the solution was diluted 1:1 on distilled water (50 mL of water was added). The determination occurred by mixing 500 µL of Salkowski reagent with 500 µL of culture supernatant in a 1 mL spectrophotometer cuvette. The mixture was left in the dark for 30 min at room temperature, and the absorption spectra to quantify IAA was 530 nm. The concentration of IAA for each strain was determined by comparison with a standard curve using 0–100 µg/mL of IAA under the same conditions. Then, the units of IAA production on each strain were determined considering its growth (µg/mL/OD600). The statistical multiple differences were compared against E. coli BW25113 using the Tukey test and implemented using JASP software version 0.18.1 [41].

2.5. Genome-Scale Metabolic Network Model of E. coli

We use the iML1515a GEM representing Escherichia coli K12 MG1655, which comprises 1877 metabolites, 2713 enzymatic reactions, and 1516 genes. Simensen and collaborators determined the objective biomass function of this model experimentally [42]. Some adjustments to the directionality of specific reactions were necessary to align the enzymatic reactions in the model in agreement with the reported literature (see Supplementary Table S1) [4,6,7,8,9,11,13,14,15,16,43,44,45,46,47,48,49,50,51,52,53,54,55,56].

2.6. Primary Software Utilized

COBRA methods were mainly executed in the COBRApy framework version 0.22.0, encompassing Flux Variability Analysis (FVA), pFBA, and the assessment of single-reaction deletions [57]. A modification was implemented to the FSEOF method provided by CAMEO version 0.13.6 [58]; this modification involved an instruction to retrieve a table containing the fluxes of all reactions, to a difference of the standard FSEOF algorithm that retrieves only those reactions associated with increased production of the targeted metabolite after a simulated overexpression. The scikit-learn suite version 1.3.0 was implemented as a framework for constructing the Machine Learning model and normalization data [59]. Graph generation and analysis were performed with the NetworkX package version 3.1 [60]. All packages used and developed were executed in Python 3.8.

2.7. Compilation of Reference Reactions from the Literature

A comprehensive literature review recovered genetic modifications to improve the production of endogenous metabolites in E. coli using glucose as the sole carbon source. The selected genes encode enzymes with known enzymatic reactions. Transcription factors or other genes associated with regulation were excluded from consideration because they are not annotated in the GEMs. Some reactions were not considered because they only make sense in a regulatory context. For instance, the overexpression of thrA is required to restore the growth of E. coli when the overproduction of L-serine as a tryptophan precursor strongly represses the biosynthesis of the essential amino acid L-threonine [9].
Additionally, modifications requiring specialized culture medium formulations were excluded, such as the citT gene, which requires the incorporation of citrate from the environment for tryptophan production [6]. Genes like tyrA and pheA, which result in mutant auxotrophic strains for L-tyrosine and L-phenylalanine during tryptophan production, were annotated as targets for a knockdown. Genes with eliminated feedback inhibition were identified as potential candidates for overexpression.
The modifications annotated encompassed overexpression, silencing, or knockdown of specific genes, with an additional nine reactions rendering low flux used as a reference to assess the impact of silencing techniques on metabolite production or its absence of effect [61]. Notably, no modifications affecting biomass were found as these alterations do not directly influence the targeted metabolites’ production. To train the model using enzymatic reactions with low effects and those related to biomass production, we selected reactions exhibiting similar behavior, as described in Section 2.10, upon introducing perturbations.
The literature review also excluded instances involving heterologous pathways, except in cases where these pathways altered the reversibility of a pre-existing reaction of the metabolic model, necessitating independent simulations.
Annotations were made at the enzymatic reaction level, considering only those reactions associated with each gene in the publication. This consideration was followed when multiple reactions were annotated in the metabolic model. The complete list of genetic modifications is accessible in Supplementary Table S2 [4,6,7,8,9,11,12,13,14,15,16,43,44,45,46,47,48,49,50,51,52,53,54,55,56,61,62,63,64,65,66,67,68,69,70,71,72,73,74,75,76,77,78,79,80,81,82,83,84,85,86,87,88,89,90].

2.8. Generation of Optima Reactions for Tryptophan Biosynthesis with pFBA

Since we seek to improve the production of tryptophan, we identified that it was necessary to create a context within the metabolic network to identify each reaction’s role in producing the metabolite. To create this context, we used the pFBA algorithm on the iML1515a GEM, which allowed us to define the optimal metabolic pathway without manually defining the participating reactions. It is essential to clarify that the pFBA algorithm implemented for optima reactions here is like that used by the Cobra Toolbox based on the complete work of Lewis et al. (2010) [91] and not the basic version of COBRApy [57]. In Lewis et al., the growth rate is maximized through the directed evolution of E. coli by maintaining an exponential phase for several generations. The in silico analysis of the changes that occurred in the selected bacteria corresponds to the classification of the reactions depending on their effect on the growth rate as essential for biomass production; reactions that achieve maximum biomass production with the minimum use of enzymes and substrates were denominated as pFBA optima, reactions that require more substrates as MLE or extra steps as ELE to produce the same biomass and no-flux reactions. In this way, pFBA optimal reactions represent the most efficient pathway to achieve an objective function, maximizing the conversion rate of substrates and reducing the number of enzymes required.
The pFBA algorithm [29] was modified to define the tryptophan production pathway, starting from glucose. Equation (1) describes the linear programming for basic pFBA, and Equation (2) describes the linear programming for pFBA optima reaction classification. The value of the target metabolite ( v t a r g e t ) was set to the theoretical maximum ( v t a r g e t m a x ) while biomass ( v b i o m a s s ) production was optimized. Fluxes v i are minimized as a constrain.
m a x v   v b i o m a s s s u b j e c t   t o S · v = 0 v t a r g e t = v t a r g e t m a x v i l b v i m i n ( v i )
where
  • v b i o m a s s : Reaction representing biomass formation.
  • S : Stochiometric matrix.
  • v : A vector containing the flux values of individual reactions.
  • v t a r g e t : Flux of the target reaction to be maximized.
  • v t a r g e t m a x : Flux of v t a r g e t when it is maximized.
  • v i : Minimized flux of reaction i.
  • v i l b : Lower bound of reaction i.
The resulting minimized fluxes ( v i ) from Equation (1) are used as the lower limits for each reaction ( v j ) in Equation (2), where reaction i is the same as reaction j. If a reaction can maintain flux when maximized ( v k m a x ) and that flux is less than the upper limit ( v k u b ), this means that it is not involved in a loop and is not an exchange reaction; then that reaction is labeled as pFBA optima ( V O p t i m a ) . The union of pFBA optima reactions represents the core pathway for tryptophan production from glucose. This algorithm does not distinguish between pFBA optima reactions and essential reactions.
m a x v   v k s u b j e c t   t o S · v = 0 v i v j < v j u b ,   i = j 0 < v k m a x < v k u b ,   k   Ω V O p t i m a v k m a x = 0 ,   k   Ω V O p t i m a
where
  • v k : The flux of reaction that was evaluated as pFBA optima.
  • v j : The flux of reaction j when v k is maximized.
  • v k u b : The upper bound of reaction as evaluated to be pFBA optima.
  • v j u b : The upper bound of reaction j.
  • v k m a x : The maximized value of reaction k.
We compared the objective function in Equation (1) to tryptophan production, but we maintained biomass production because, if changed, slight changes in the predicted pFBA optima reactions related to cofactors production were observed. For this reason, we kept biomass as an objective function, hoping that the production of cofactors would help to produce tryptophan and biomass.

2.9. Perturbating Reactions with FSEOF

We introduced perturbations on each pFBA optima reaction defined with pFBA to evaluate what happens when the biosynthetic pathway has a bottleneck or competing pathways. The rationale followed is that microorganisms respond to environmental changes, adjusting their metabolic fluxes, and one of these adjustments includes that metabolites overproduced in one part of the metabolic pathway could be redirected to other pathways to maintain homeostasis and growth rate [92]. Our conception requires registering how these perturbations drive the production of the interest metabolites or what happens with the excessive flux when it is not directed to metabolite production. Since FSEOF provided by CAMEO only returns increased fluxes, we modified the instructions so that it returns the fluxes of all reactions when each pFBA optima reaction was simulated to increase in flux (See Equation (3)), creating a redistribution of fluxes divided between biomass and target metabolite production. For each of the pFBA optima reactions obtained in Equation (2), its flux is calculated when the flux in the target reaction is maximized ( v p e r t u r b e d v t a r g e t m a x ). To avoid an impossible solution, the flux value for the pFBA optima reaction is the minimum between the maximum value that this reaction can achieve ( v p e r t u r b e d m a x ), and the value of pFBA optima reaction obtained when the flux of the target reaction is maximized ( v p e r t u r b e d v t a r g e t m a x ), multiplied by an arbitrary perturbation factor (PF).
The target reaction’s minimum ( v t a r g e t m i n ) and maximum ( v t a r g e t m a x ) fluxes are calculated. The range of both fluxes is divided into N levels, and each level is used as a value for the target reaction. Thus, N flux values for each reaction in GEM are obtained by maximizing biomass production with the previous restrictions.
m a x v   v b i o m a s s s u b j e c t   t o S · v = 0 v t a r g e t = n ( v t a r g e t m a x v t a r g e t m i n ) N ,   N   N + 0 n N ,   n N + v p e r t u r b e d = min v p e r t u r b e d m a x , v p e r t u r b e d v t a r g e t m a x P F ,   p e r t u r b e d   Ω V O p t i m a v i l b v i v i u b
where
  • v t a r g e t m i n : Flux of v t a r g e t when it is minimized.
  • v p e r t u r b e d : Flux of a pFBA optima reaction subjected to perturbation.
  • v p e r t u r b e d m a x : Maximum flux of v p e r t u r b e d in each simulation.
  • v p e r t u r b e d v t a r g e t m a x : Flux of v p e r t u r b e d when the v t a r g e t is maximized.
  • P F : Perturbation factor, this was set to 1.5 in simulations.
  • N : Number of enforced flux levels for FSEOF (default = 10).

2.10. Use of QPA to Transform the Perturbation Fluxes to Reaction–Metabolite Relationships

When perturbation fluxes were obtained, we realized that reactions with experimental evidence affecting tryptophan production were insufficient in terms of quantity and detail for quantitative analysis. To correct the lack of data and obtain attributes that describe the reactions, we allowed them to be classified according to their effect on producing tryptophan, performing QPA [34,35,93]. This process consists of using quantitative variables (flux) to find relationships without proportionality, for example, we can express the following correlation, y = 2x, as a positive relationship between x and y, which indicates that y increases as x increases, regardless of whether the proportionality between both variables is two factor. Following this idea, the maximum reaction fluxes in each perturbation (10 fluxes represented by N in Equation (3)) were normalized and plotted as a function of biomass production. In most cases, the resulting graph was a line, and the behavior was compared with the plots in Supplementary Figure S4a–d to assign a relationship concerning tryptophan production. The relationship generated by each perturbation was counted and used to create Table 2. The number of relationships generated new qualitative variables that helped us classify groups of reactions based on their profile and the experimental effect of known reactions in tryptophan production.
Thus, the goal of QPA was to generate a Qualitative Linear Model (QLM), constituted by qualitative variables that represent the relationships among the variation of reaction fluxes generated from GEM concerning tryptophan production.

2.11. Use of QLM and GBDT to Train the QPAML Model with Experimentally Validated Tryptophan Reactions

GBDT and QLM have similarities: both use input variables, assign importance to each variable, and generate an output. However, GBDT automatically adjusts the importance of variables to minimize the error in the outputs using training data. On their part, the QLM construction seeks to minimize the difference between the predictions and the observed system output in the same way as GBDT. Therefore, we guide variable selection with QLM and evaluate the model performance with GBDT (see Figure 1). The overall classification of reactions obtained with this approach is the output of QPAML.
Algorithm 1 describes the variable selection for QPAML model. A list of 40 genetic modifications validated in the literature for tryptophan production (See Supplementary Table S3) guided the classification as the ground truth label vector (y) [6,7,8,9,12,13,14,15,16]. A GBDT model (F) was trained by testing these qualitative variables (x) calculated from perturbated fluxes (V). When a new qualitative variable (Xi) was tested, the multi-class log-loss function (L) was calculated: if introducing Xi reduces L, Xi is selected to construct the model; otherwise, it is discarded. This process continued until the loss function was zero or no more tested variables were available.
Algorithm 1: QPAML model construction algorithm.
Input:
  
Truth label vector y
  
Qualitative variables X
Output
  
QPAML model F
1. 
Obtain pFBA optima reactions with Equation (2): VOptima
2. 
V = []
3. 
for vperturbed in VOptima:
4. 
  Calculate fluxes perturbing vperturbed with Equation (3): v
5. 
  V = V ∪ [v]
6. 
end for
7. 
Calculate X values using V
8. 
i = 1
9. 
x = []
10. 
While L(y, p)n > 0 and X ≠ ∅:
11. 
  x = x ∪ [Xi]
12. 
  Fit F(x, y)
13. 
  Calculate L(y, p)n+1
14. 
  If L(y, p)n+1 < L(y, p)n then:
15. 
   L(y, p)n = L(y, p)n+1
16. 
  else:
17. 
   x = x − [Xi]
18. 
  end if
19. 
  X = X − [Xi]
20. 
  i = i + 1
21. 
end while
22. 
return F

2.12. Classification of 322 Reactions to Produce Tryptophan and Other 30 Endogenous Metabolites

Once the GBDT model was trained with the tryptophan production pathway, it could be used to classify all the reactions of the metabolic model to produce another 30 metabolites without the need to train the model again. The classification process is described in Algorithm 2. For each new metabolite production, pFBA optima reactions are re-calculated. The values of the fluxes are obtained (V) using FSEOF as described in Equation (3) and are used to calculate the values of the qualitative variables (x) that were selected to train the model. For each of the reactions, the GBDT model (F) is run to predict the class of the reaction ( y ^ r e a c t i o n ) using the values of the qualitative variables for that reaction (xreaction). A vector is generated with the predicted classes for all reactions ( Y ^ ).
Algorithm 2: Algorithm for classification of reactions.
Input:
  Target reaction vtarget
Output
  Predicted class vector Y
1. 
Obtain pFBA optima reactions with Equation (2): VOptima
2. 
V = []
3. 
for vperturbed  in VOptima:
4. 
  Calculate fluxes perturbing vperturbed with Equation (3): v
5. 
  V = V ∪ [v]
6. 
end for
7. 
Calculate x values using V
8. 
Y ^ = []
9. 
For reaction in GEM:
10. 
   y ^ r e a c t i o n = F(xreaction)
11. 
   Y ^ = Y ^ ∪ [ y ^ r e a c t i o n ]
12. 
end for
13. 
return  Y ^

2.13. Final Qualitative Variables

The final qualitative variables were calculated from metabolic fluxes as described below. FVA [29] was performed to identify reactions in the GEM that cannot sustain flux because substrates are not available [61] or constraints are infeasible [94]; these reactions are referred to as blocked elsewhere. Essential reactions for biomass production were identified using the single-reaction-deletion method of COBRApy. Suppose a reaction whose slope does not overlap in any perturbation with those for tryptophan production. In that case, the reaction is tagged as having an unclear relationship or no flux variation. When all the reaction fluxes in the perturbations fit Equation (4), the reaction is tagged as biomass-correlated (See Supplementary Figure S5a). Reactions with most of the perturbations that have a positive relationship with tryptophan secretion are tagged as correlated to tryptophan (see Supplementary Figure S5c). The scripts and simulations are available at https://gitlab.com/amalib/qpaml (accessed on 31 January 2024).
v i = m · v b i o m a s s + b
where
  • v i : Flux of reaction.
  • m: Slope of line, most be greater than 0.
  • b: Intersection at origin, must be 0.
  • v _ b i o m a s s : Flux of biomass.
The interpretation of the QPAML model indicates that the resulting optimal pFBA reactions are candidates to be activated, although these could be reactions that have few fluxes in the metabolic network. Likewise, reactions whose fluxes behave similarly to the target reaction (See Supplementary Figure S5c) are candidates to be activated. Reactions that do not present variations in their fluxes are not good candidates to be modified. Some reactions are correlated to biomass production but not to tryptophan; these reactions could affect biomass production if they are mutated. Finally, the rest of the reactions are classified as candidates to be silenced if they are not essential for biomass production and candidates to be attenuated if essential (See Supplementary Figure S6).

2.14. Distance Measurement of Relevant Reactions Respect the 76 pFBA Optima Reactions for Tryptophan Production

We were interested in observing the distribution of relevant predicted and experimentally validated reactions in the metabolic network for tryptophan production to identify some correlation of genetic modification concerning the metabolic network structure.
After categorizing reactions for tryptophan production, we used pFBA optima, silence, and attenuation target reactions to construct a directed graph in NetworkX. The graph included the participating metabolites and the directionality of their reactions. We selected the 76 pFBA optima reactions in the graph and performed a search for the neighbors or outgoing nodes, avoiding highly connected metabolites. These first neighbor nodes were then chosen to repeat the search until no additional nodes could be added. The shortest distances from the central pathway were measured regarding reactions rather than nodes. This search methodology represents an adaptation of the Breadth-First Search algorithm [95].

3. Results

3.1. pFBA Implementation to Define the Core Pathway from Glucose to Tryptophan

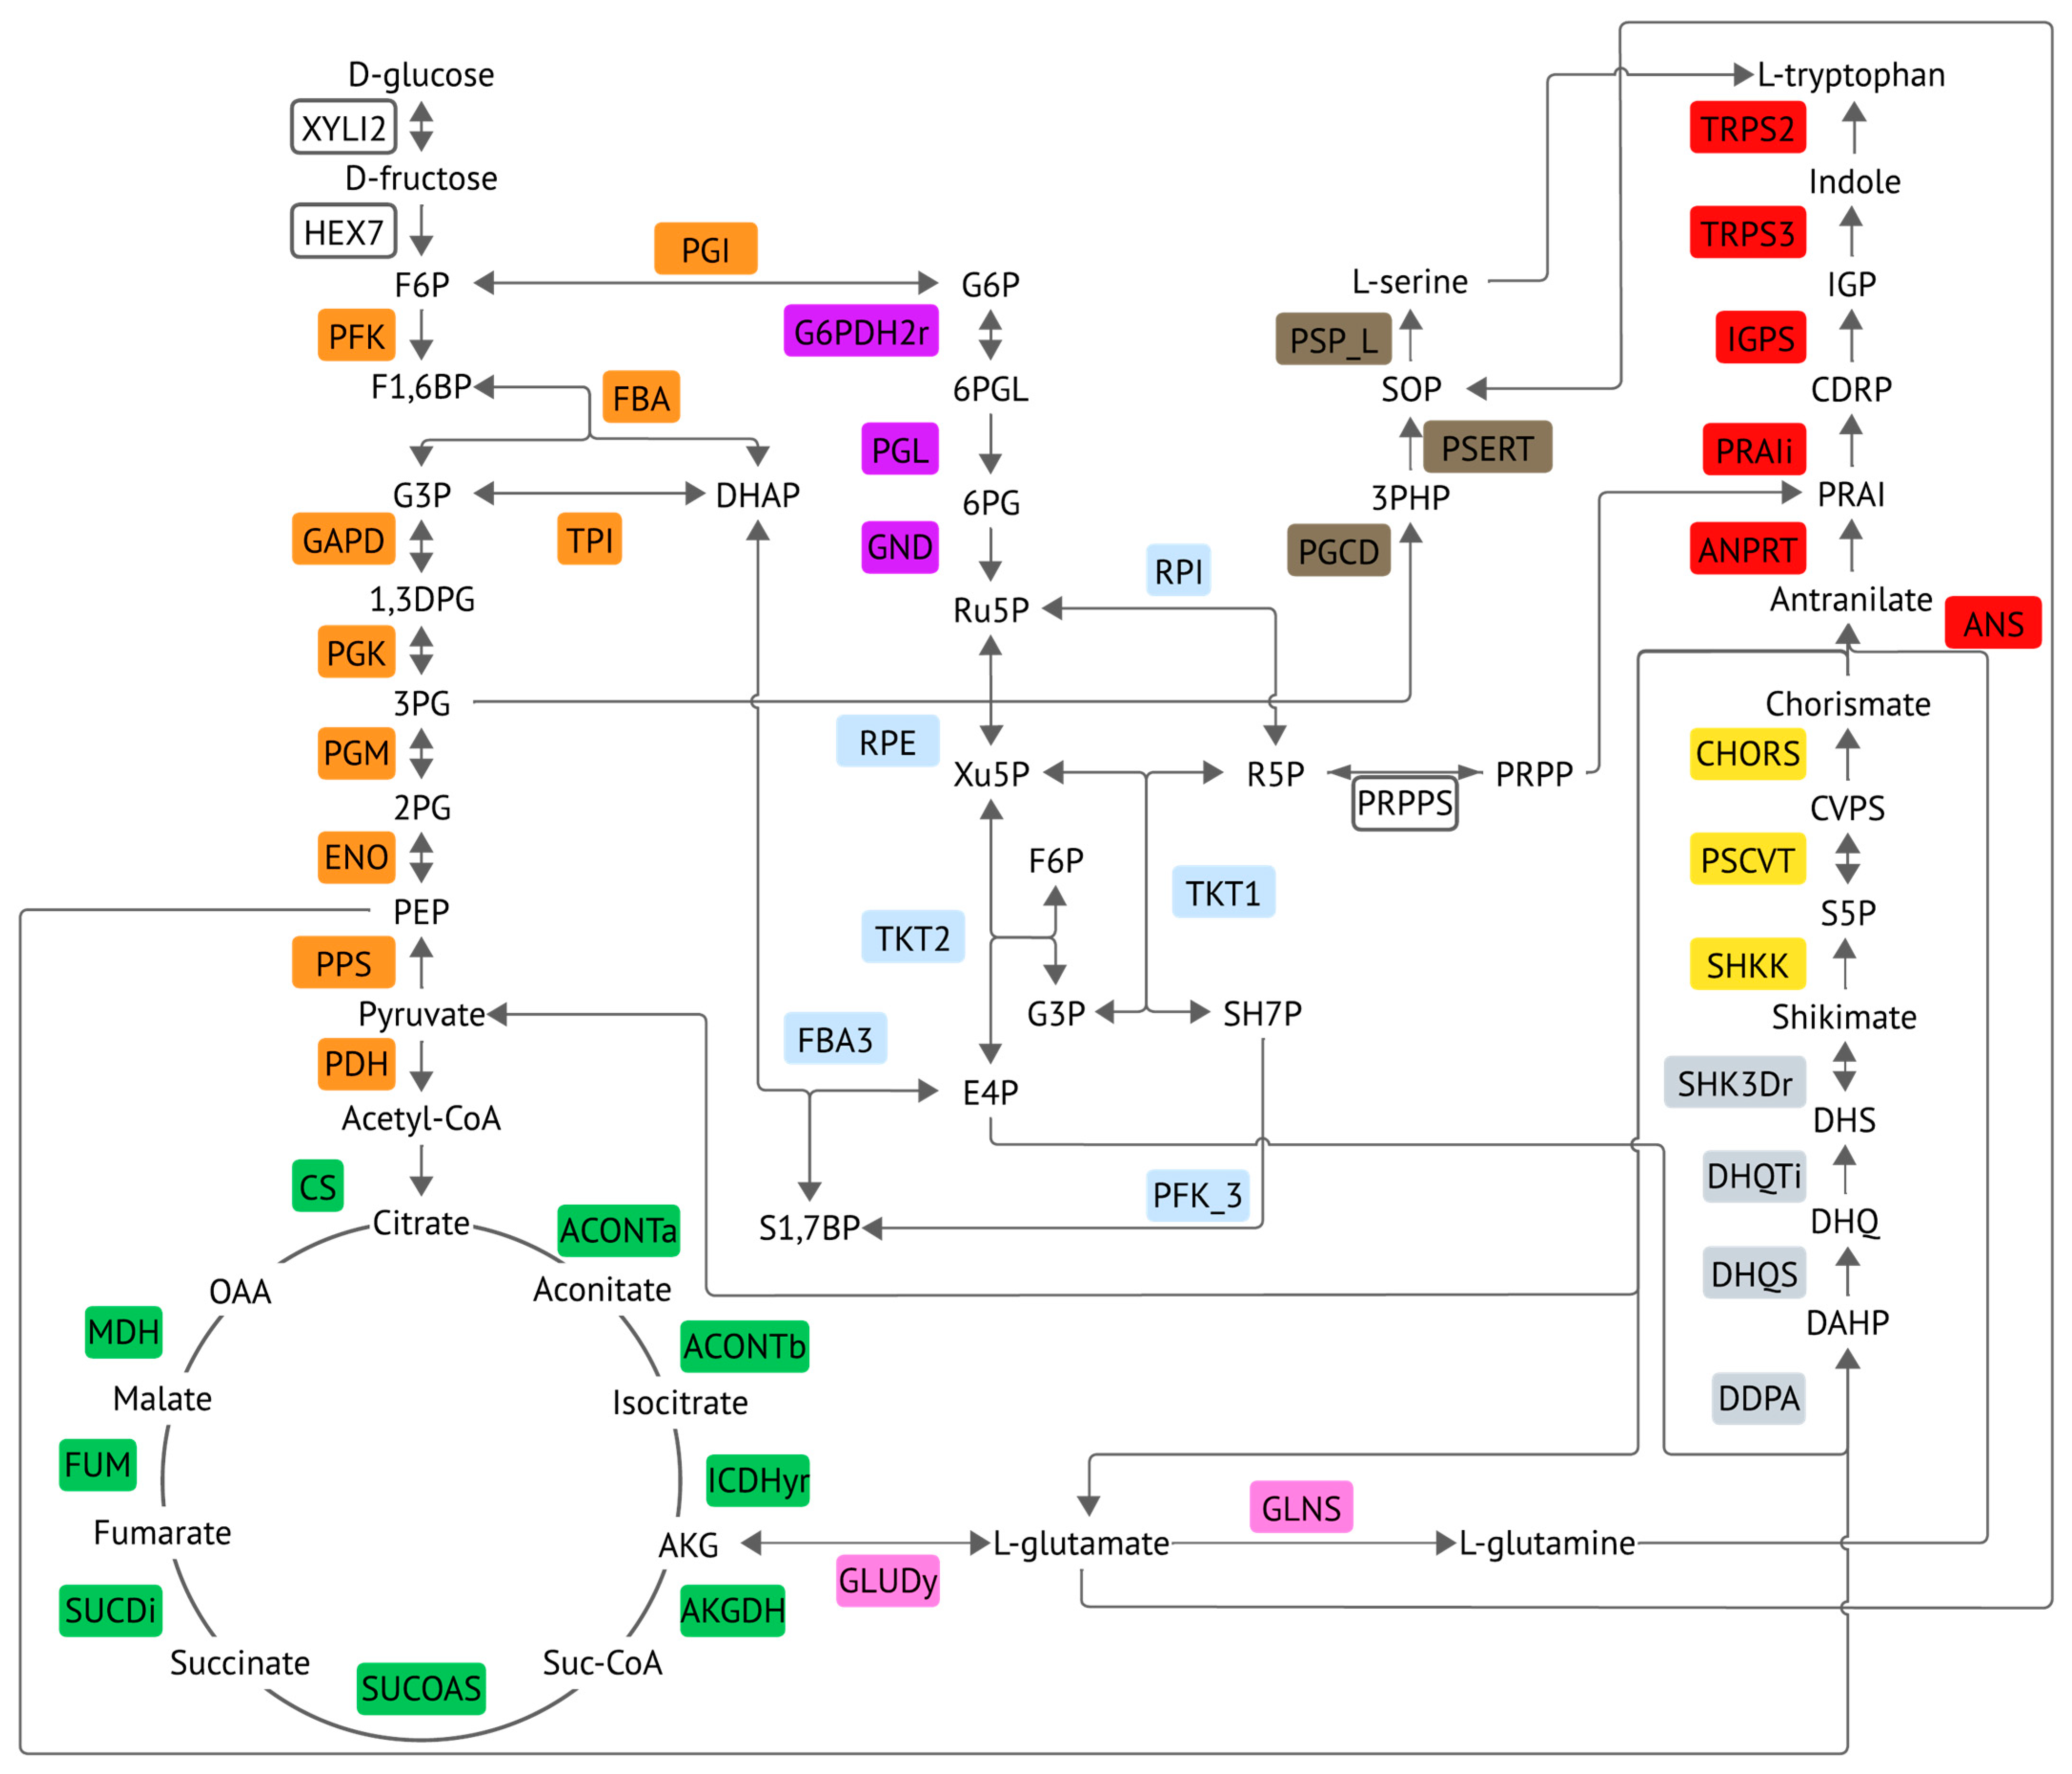
Implementing the pFBA algorithm defined 76 reactions as producing tryptophan, starting from D-glucose as optima reactions. Interestingly, the pathways described correspond with the proposed anthranilate growth-coupled production, with phosphoenolpyruvate and pyruvate as the key metabolites [17]. Highly connected metabolites and transport reactions for tryptophan and D-glucose were identified but not included in Figure 2 to facilitate their visualization.

3.2. Analysis of Perturbations in Fluxes Propagated by FSEOF

By introducing reaction flux perturbations with the FSEOF algorithm, we apply flux increases for each of the 76 reactions. To define the magnitude of perturbations, the fluxes of each reaction were determined after maximizing the production of tryptophan (4.52 mmol/L/h) with minimal biomass production (Equation (3)). Under these conditions, the enzyme DHQS rends a flux of 4.54 mmol/L/h. The flux was multiplied by a perturbation factor of 1.5, giving a flux of 6.81 mmol/L/h to ensure that fluxes overpass the maximal capacity for tryptophan production; in this way, when the FSEOF method is applied, the L-tryptophan pathway can only consume as much as 4.54 mmol/L/h of DHQS flux, and the rest of the flux is propagated in the rest of the metabolic network. As such, we had ten fluxes for each of the 2713 reactions in the GEM and 76 perturbation simulations to have around 2 million fluxes for classification and analysis. However, this classification was challenging because biochemical or biological information only supports some of these reactions.
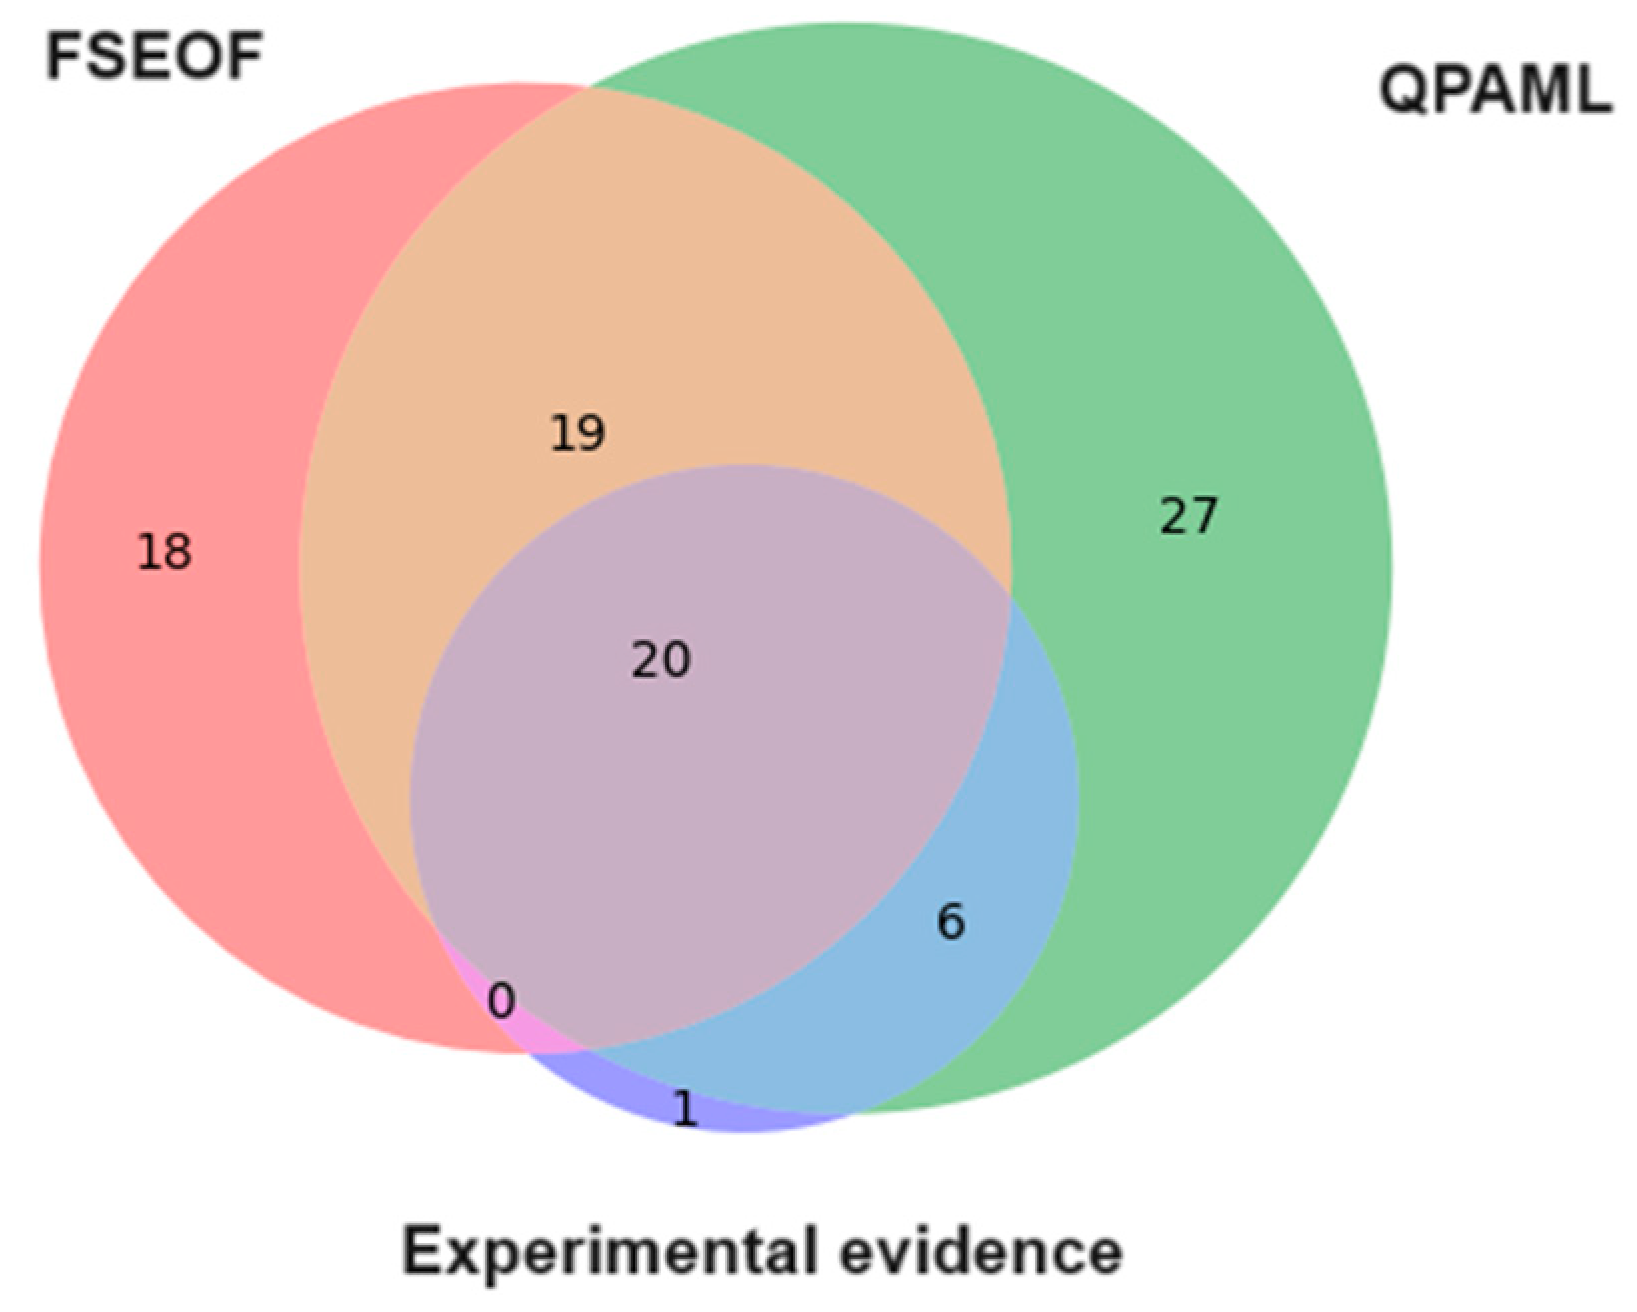
The QPA uses the FSEOF to analyze how perturbations propagate in the metabolic network. Taking the tryptophan production pathway as context, the overall capacity of QPAML to identify potential reactions to be overexpressed is greater than that of the FSEOF only. QPAML can recognize 26 of the 27 reactions reported in the literature to overproduce tryptophan, while the FSEOF can only predict 20 (See Figure 3, Supplementary Table S4 and S5) of experimentally validated reaction on tryptophan production [6,7,8,9,11,12,13,14,15,16].
None of the tools classify the NAD transhydrogenase reaction, which is overexpressed to compensate for the overexpression of NAD(P) transhydrogenase [9]. However, QPAML predicts this reaction after simulating NAD transhydrogenase overexpression.

3.3. Conversion of the Flux Variables to a Classification Model Based on QPAML

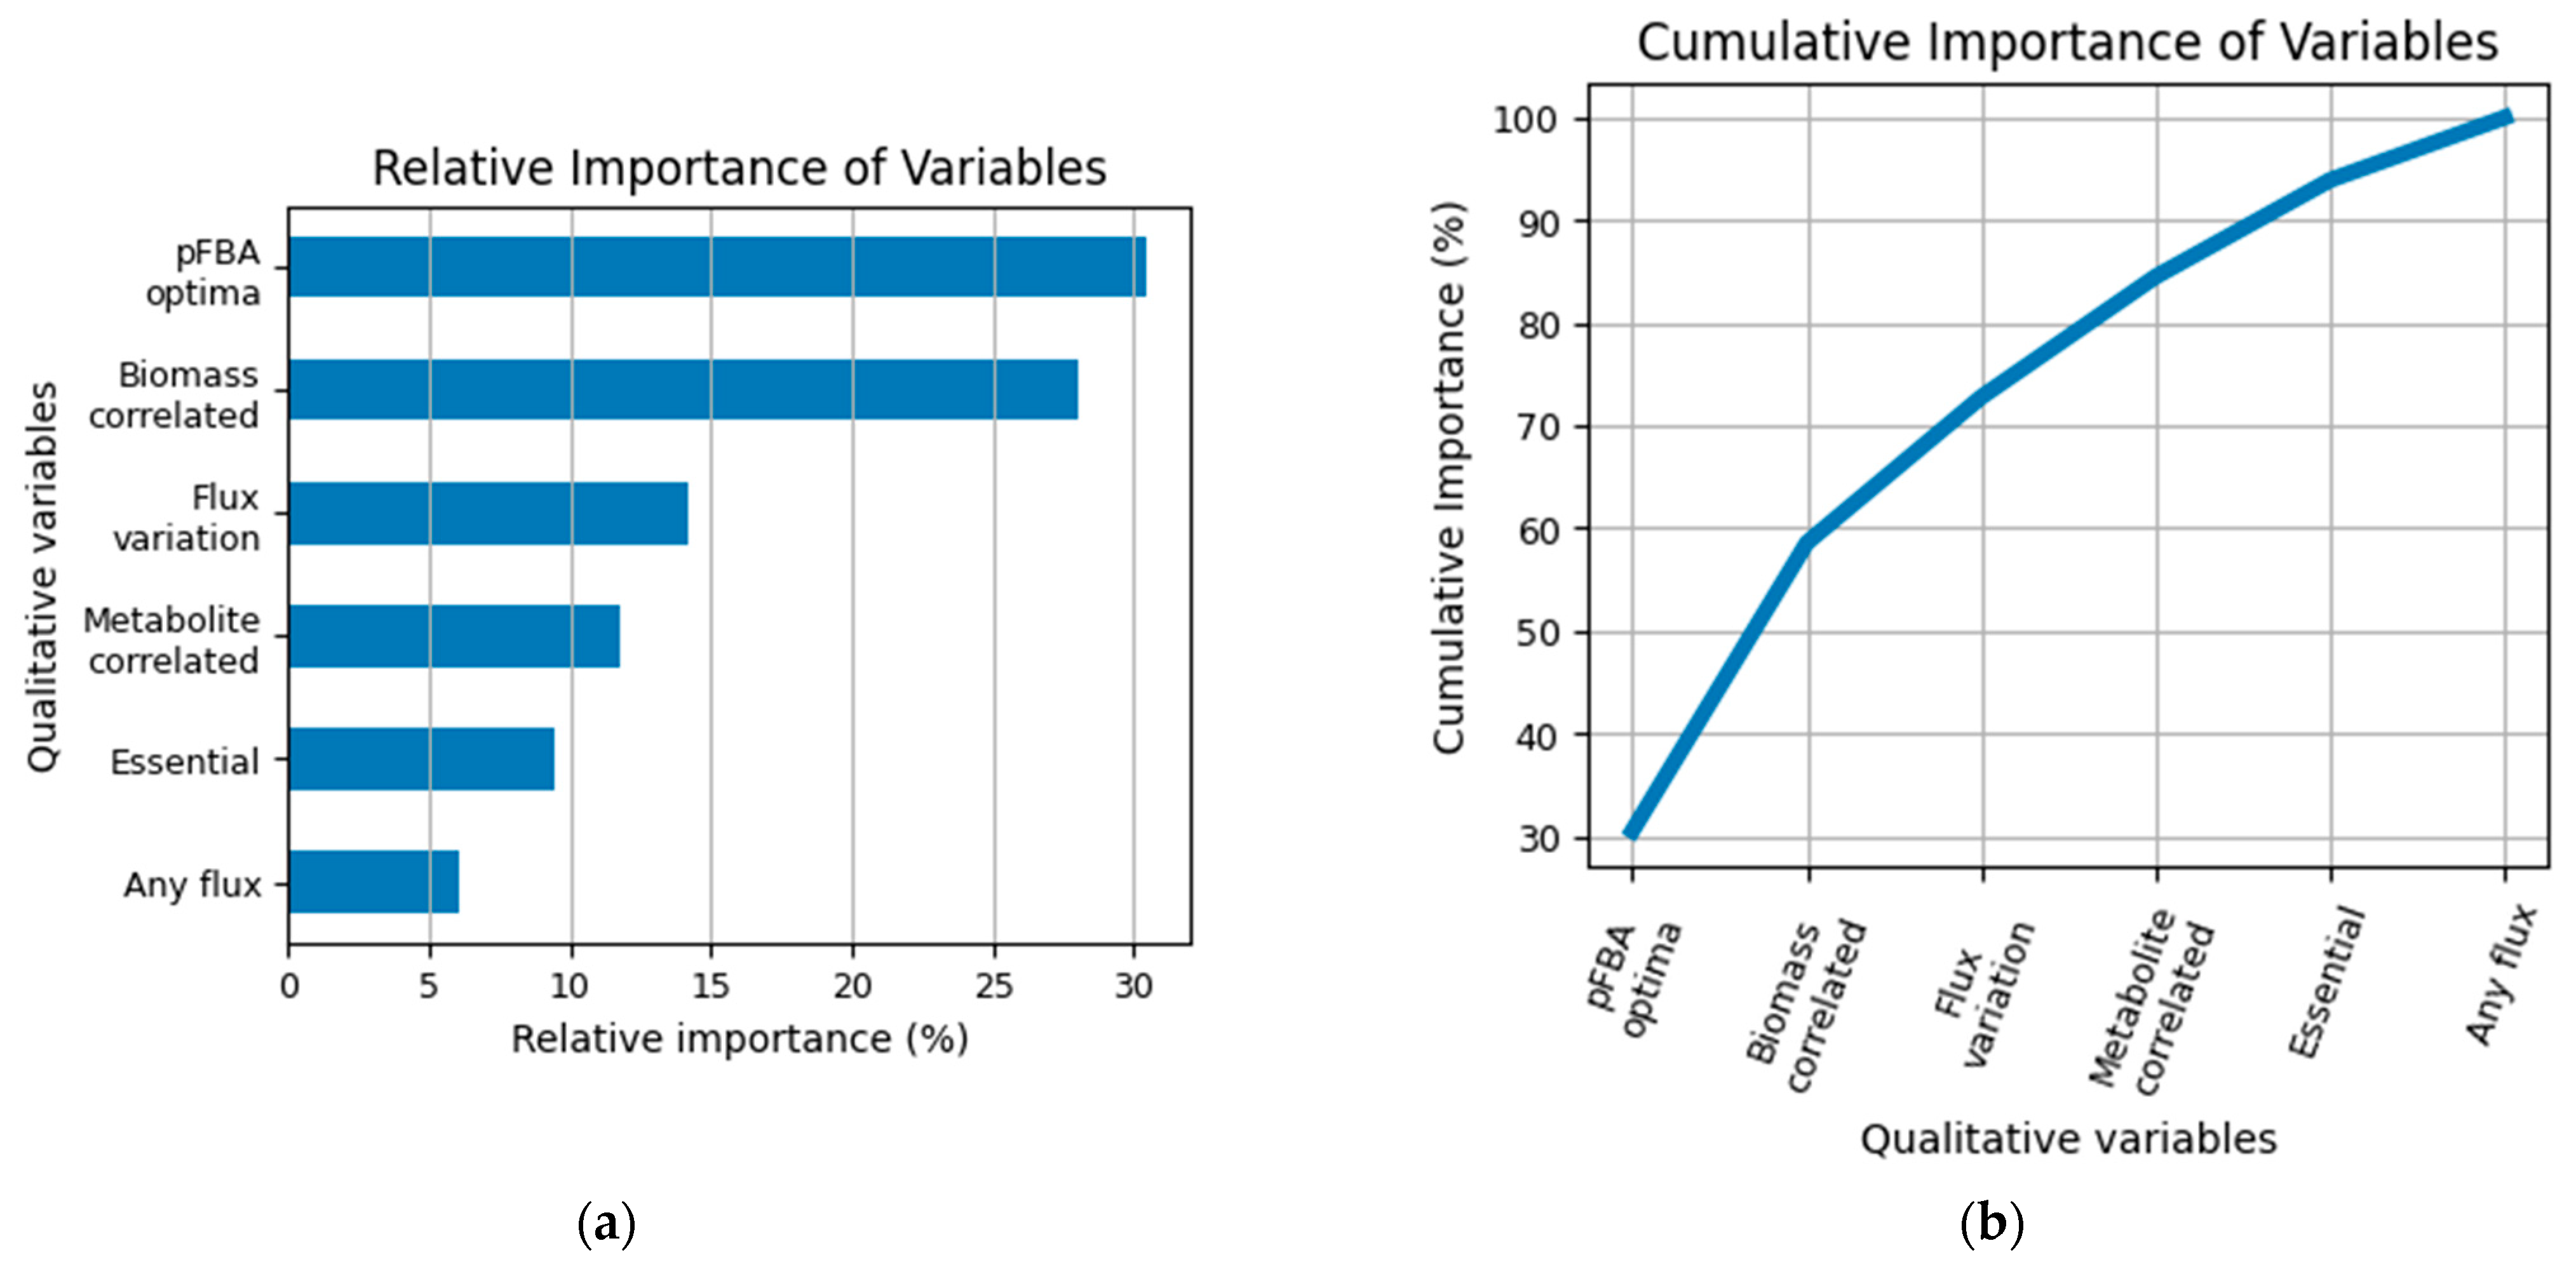
From the behavior of the ten fluxes per reaction obtained after each perturbation regarding the tryptophan or biomass production, the QPA led us to select six qualitative variables (pFBA optima, any flux, biomass-correlated, metabolite-correlated, flux variation, and essential) for the QPAML construction. These qualitative variables were fed to GBDT to identify if they adequately represent the relationship between reactions and tryptophan production, comparing predictions with experimental evidence. The qualitative variable hierarchy for the trained model was elucidated as delineated in Figure 4. The qualitative variables assess (1) whether reactions are part of the 76 pFBA optima reactions to tryptophan production; (2) if reactions contribute to biomass but not to metabolite production; (3) the presence of flux variation across the 76 simulations; (4) the contribution of flux to tryptophan production; (5) the essentiality of reactions for biomass production; and (6) the maintenance of flux in reactions across any simulation. This latter variable is intrinsically linked to flux variation.
The model groups the reactions into five metabolic classes: low flux, biomass, overexpression, knockout (KO), and knockdown (KD). The last three classes are relevant for trying genetic modifications.
The model uses the following criteria for classification (see Supplementary Figure S6):
FSEOF designates reactions with no variation as unrelated to target metabolite production [30]. Deng and colleagues [61] interrupted genes that utilize unavailable carbon sources in the media with no observed effect on growth or metabolite production. Westers removed 332 superfluous genes from Bacillus subtil is without changes in the metabolic flux [96]. Using these analogies, reactions that cannot sustain any flux in simulations are categorized as reactions without effect. Extending the behavior of these reactions, those with no variation in flux or variations lacking a clear correlation with tryptophan production are classified as reactions with low flux or without effect. A pertinent example in this context is the poxB gene, representing a secondary pathway of acetate production. This pathway is less active than the one governed by pta-ackA genes and tends to be active only in the stationary phase [8]. Although we named this variable low flux, this class encompasses several kinds of reactions: the reactions with zero flux because their substrates are not available; reactions with stoichiometric unfavourability represented in the model as zero flux, but they present fluxes in the cell due to biochemical noise and leaks of metabolism; and other reactions with an unclear relationship.
Reactions with fluxes showing a consistent positive relationship with the metabolite production in most perturbations are selected for overexpression (see Supplementary Figure S5c), reflecting an approach similar to that employed by the FSEOF algorithm [30]. An illustrative example is the NAD(P) transhydrogenase (THD2pp) encoded by the pntBA genes [9]. Additionally, the algorithm identifies pFBA optima reactions for overexpression, even when they do not exhibit a positive relationship with tryptophan production in most perturbations, complementing those already documented in the literature—for instance, the isocitrate dehydrogenase (NADP) reaction (ICDHyr) [9]. pFBA optima reactions encompass the biosynthesis pathways of tryptophan and its precursors, aligning with strategies involving gene overexpression in metabolic pathways [6,7,8,9,12,13,14,15,16].
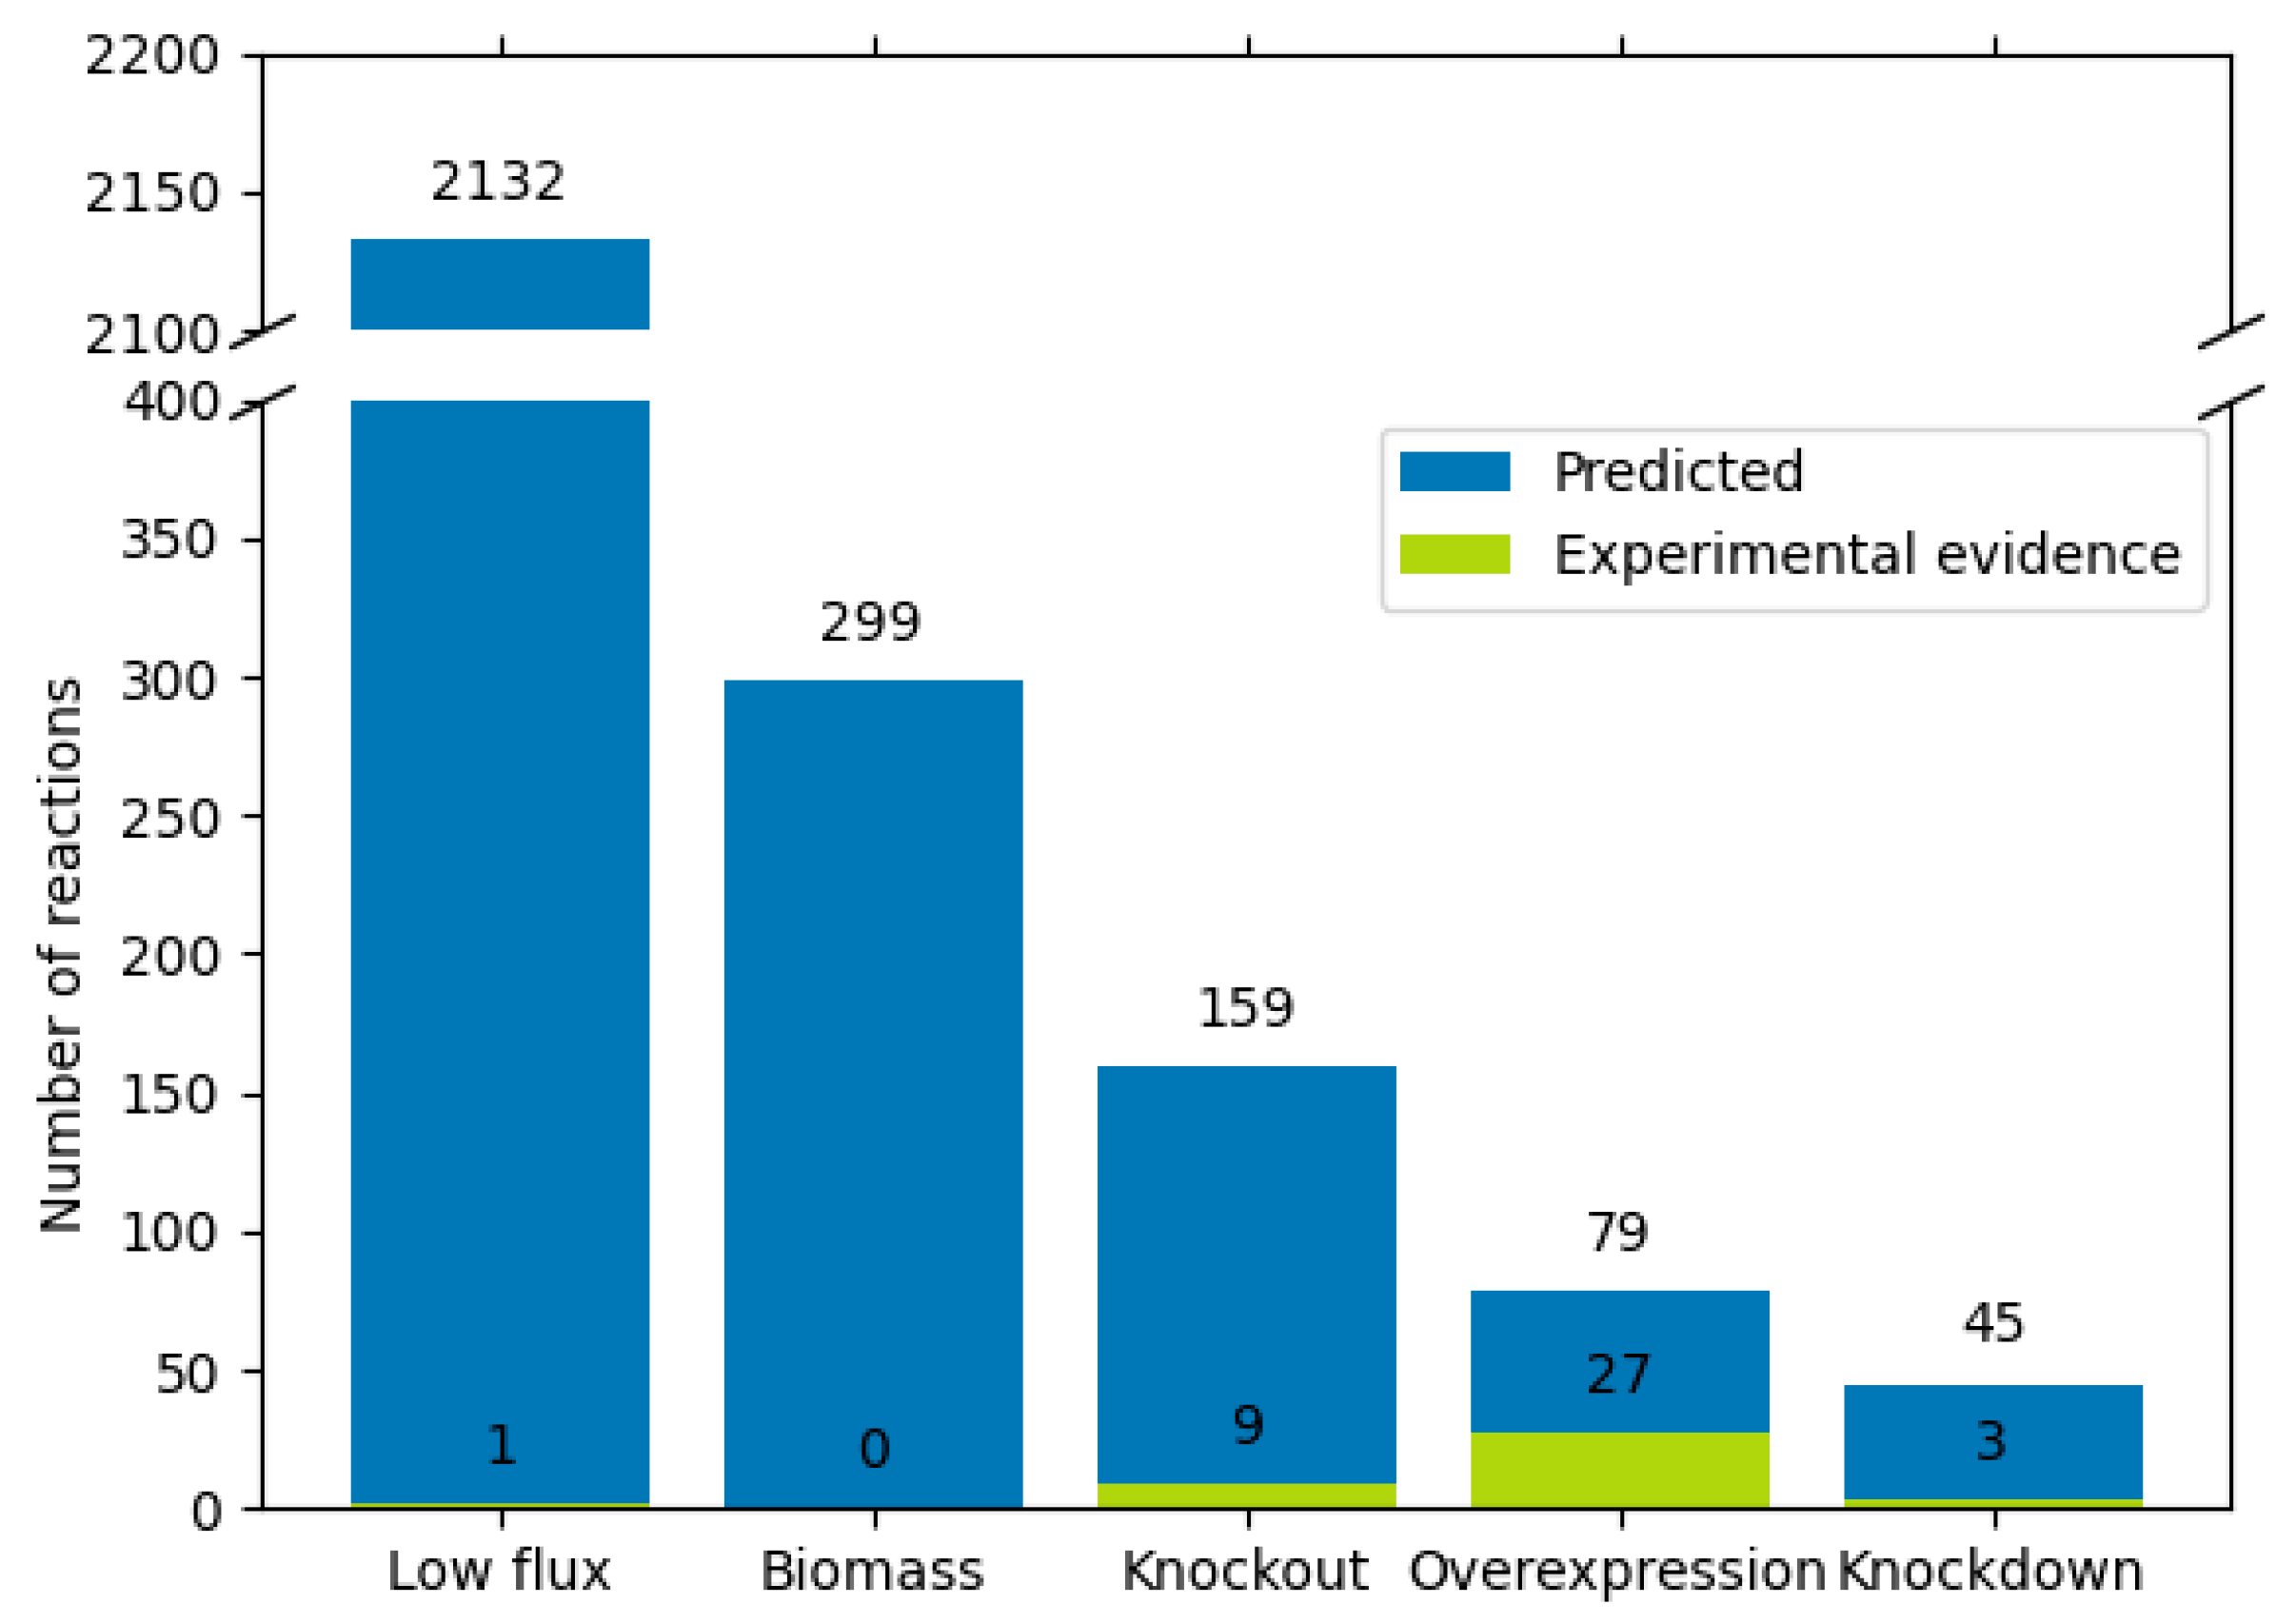
FSEOF categorizes reactions into promoting, hindering, and without discernible effects on tryptophan production [30]. When perturbations are introduced, some reactions that impede the production of tryptophan exhibit the same response pattern, regardless of the perturbation introduced (See Supplementary Figure S5a). The individual fluxes for each perturbation correspond to holistic-growth-coupled (hGC) reactions proposed by Alter and Ebert [18]. Although there are 299 reactions with this behavior, more than silence and attenuation candidates together, no modifications of these reactions have been reported in the literature.
Reactions showing a negative correlation between their fluxes and tryptophan production and not categorized as biomass-related were identified as candidates for disruption. A literature review on pheA and tyrA genes reveals that knocking out these genes necessitates external L-phenylalanine and L-tyrosine due to the induced auxotrophies. The model classifies these reactions as essential. Pharkya and Maranas address this observation further [2].
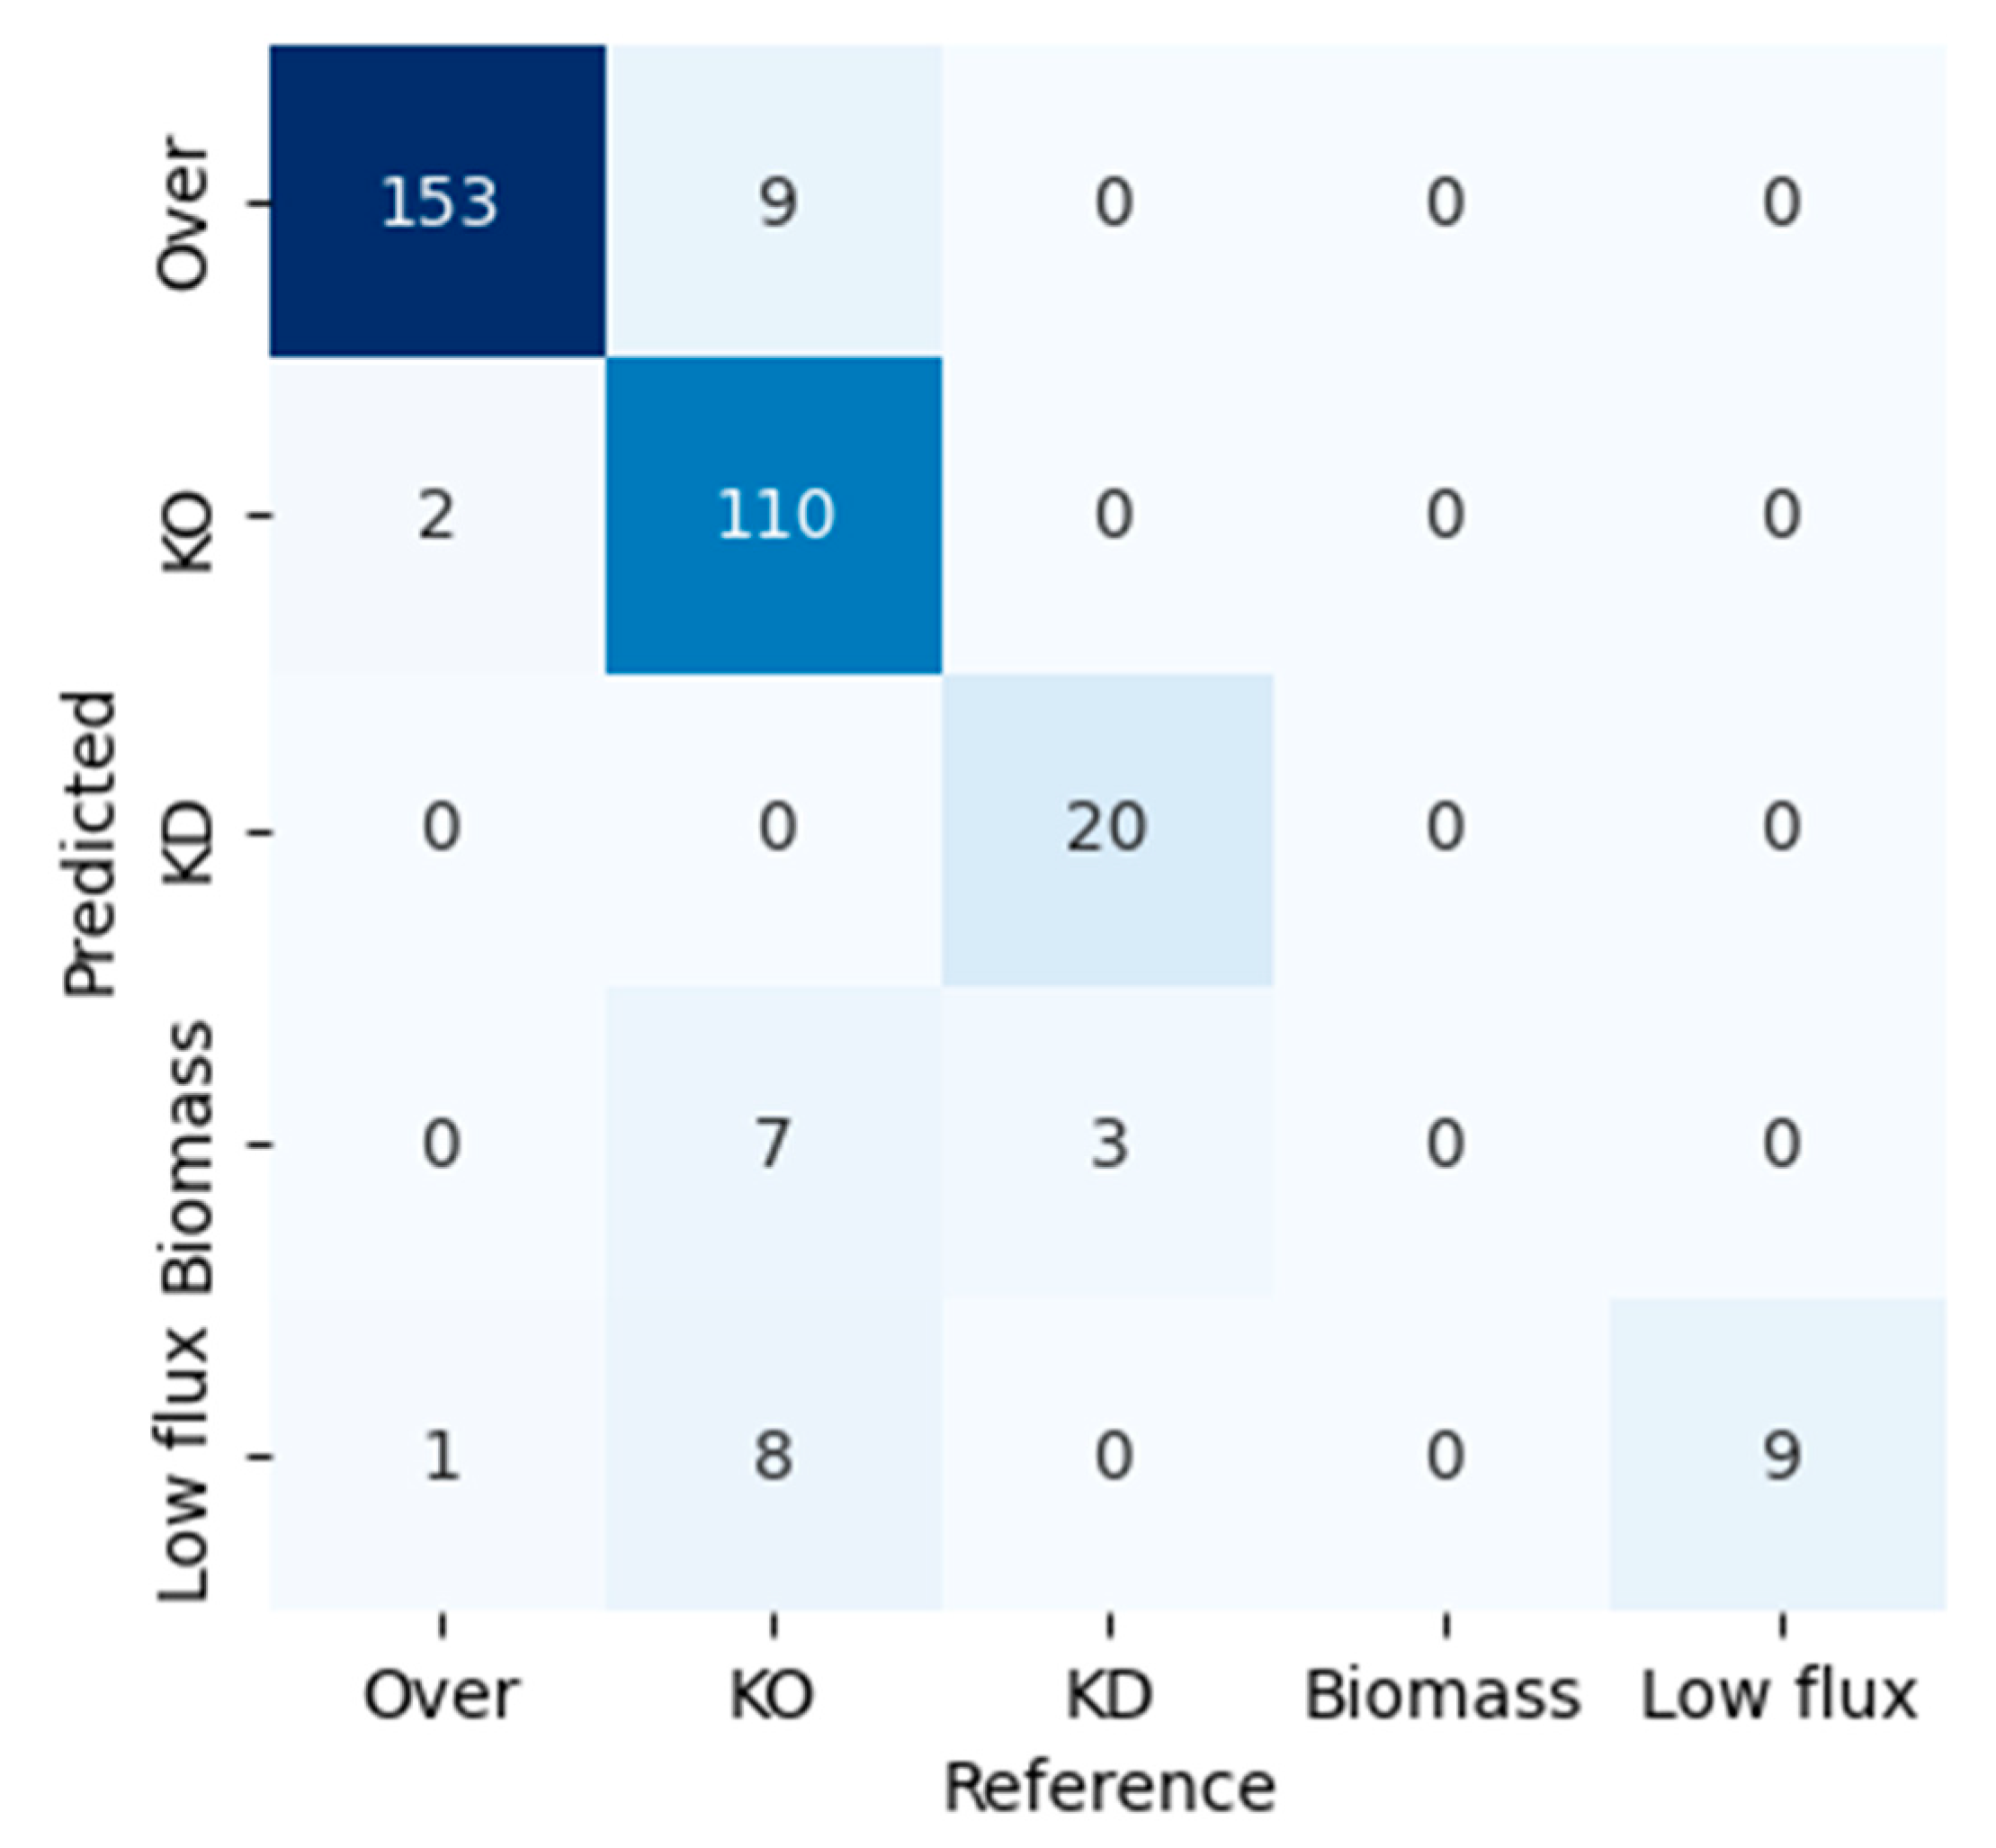
The QPAML model was tested for all reactions in the metabolic model during the production of tryptophan, and the classification was compared against the reference reactions. The results are shown in Figure 5.
The QPAML classification model, trained for tryptophan overproduction, was utilized to categorize 322 genetic modifications reported in the literature about the overproduction of tryptophan and 30 other endogenous metabolites using glucose as a carbon source (See Supplementary Table S2). As delineated in Figure 6, the model manifested a weighted precision of 95.17%, a sensitivity of 90.68%, and an F1-Score of 92.34%. Notably, the knockout class exhibited the lowest sensitivity at 82.09%. This lesser sensitivity likely derives from false negatives, predominantly within the low flux category, yielding a precision of only 50.00% for this class.

3.4. Shortest Distance from pFBA Optima Reactions

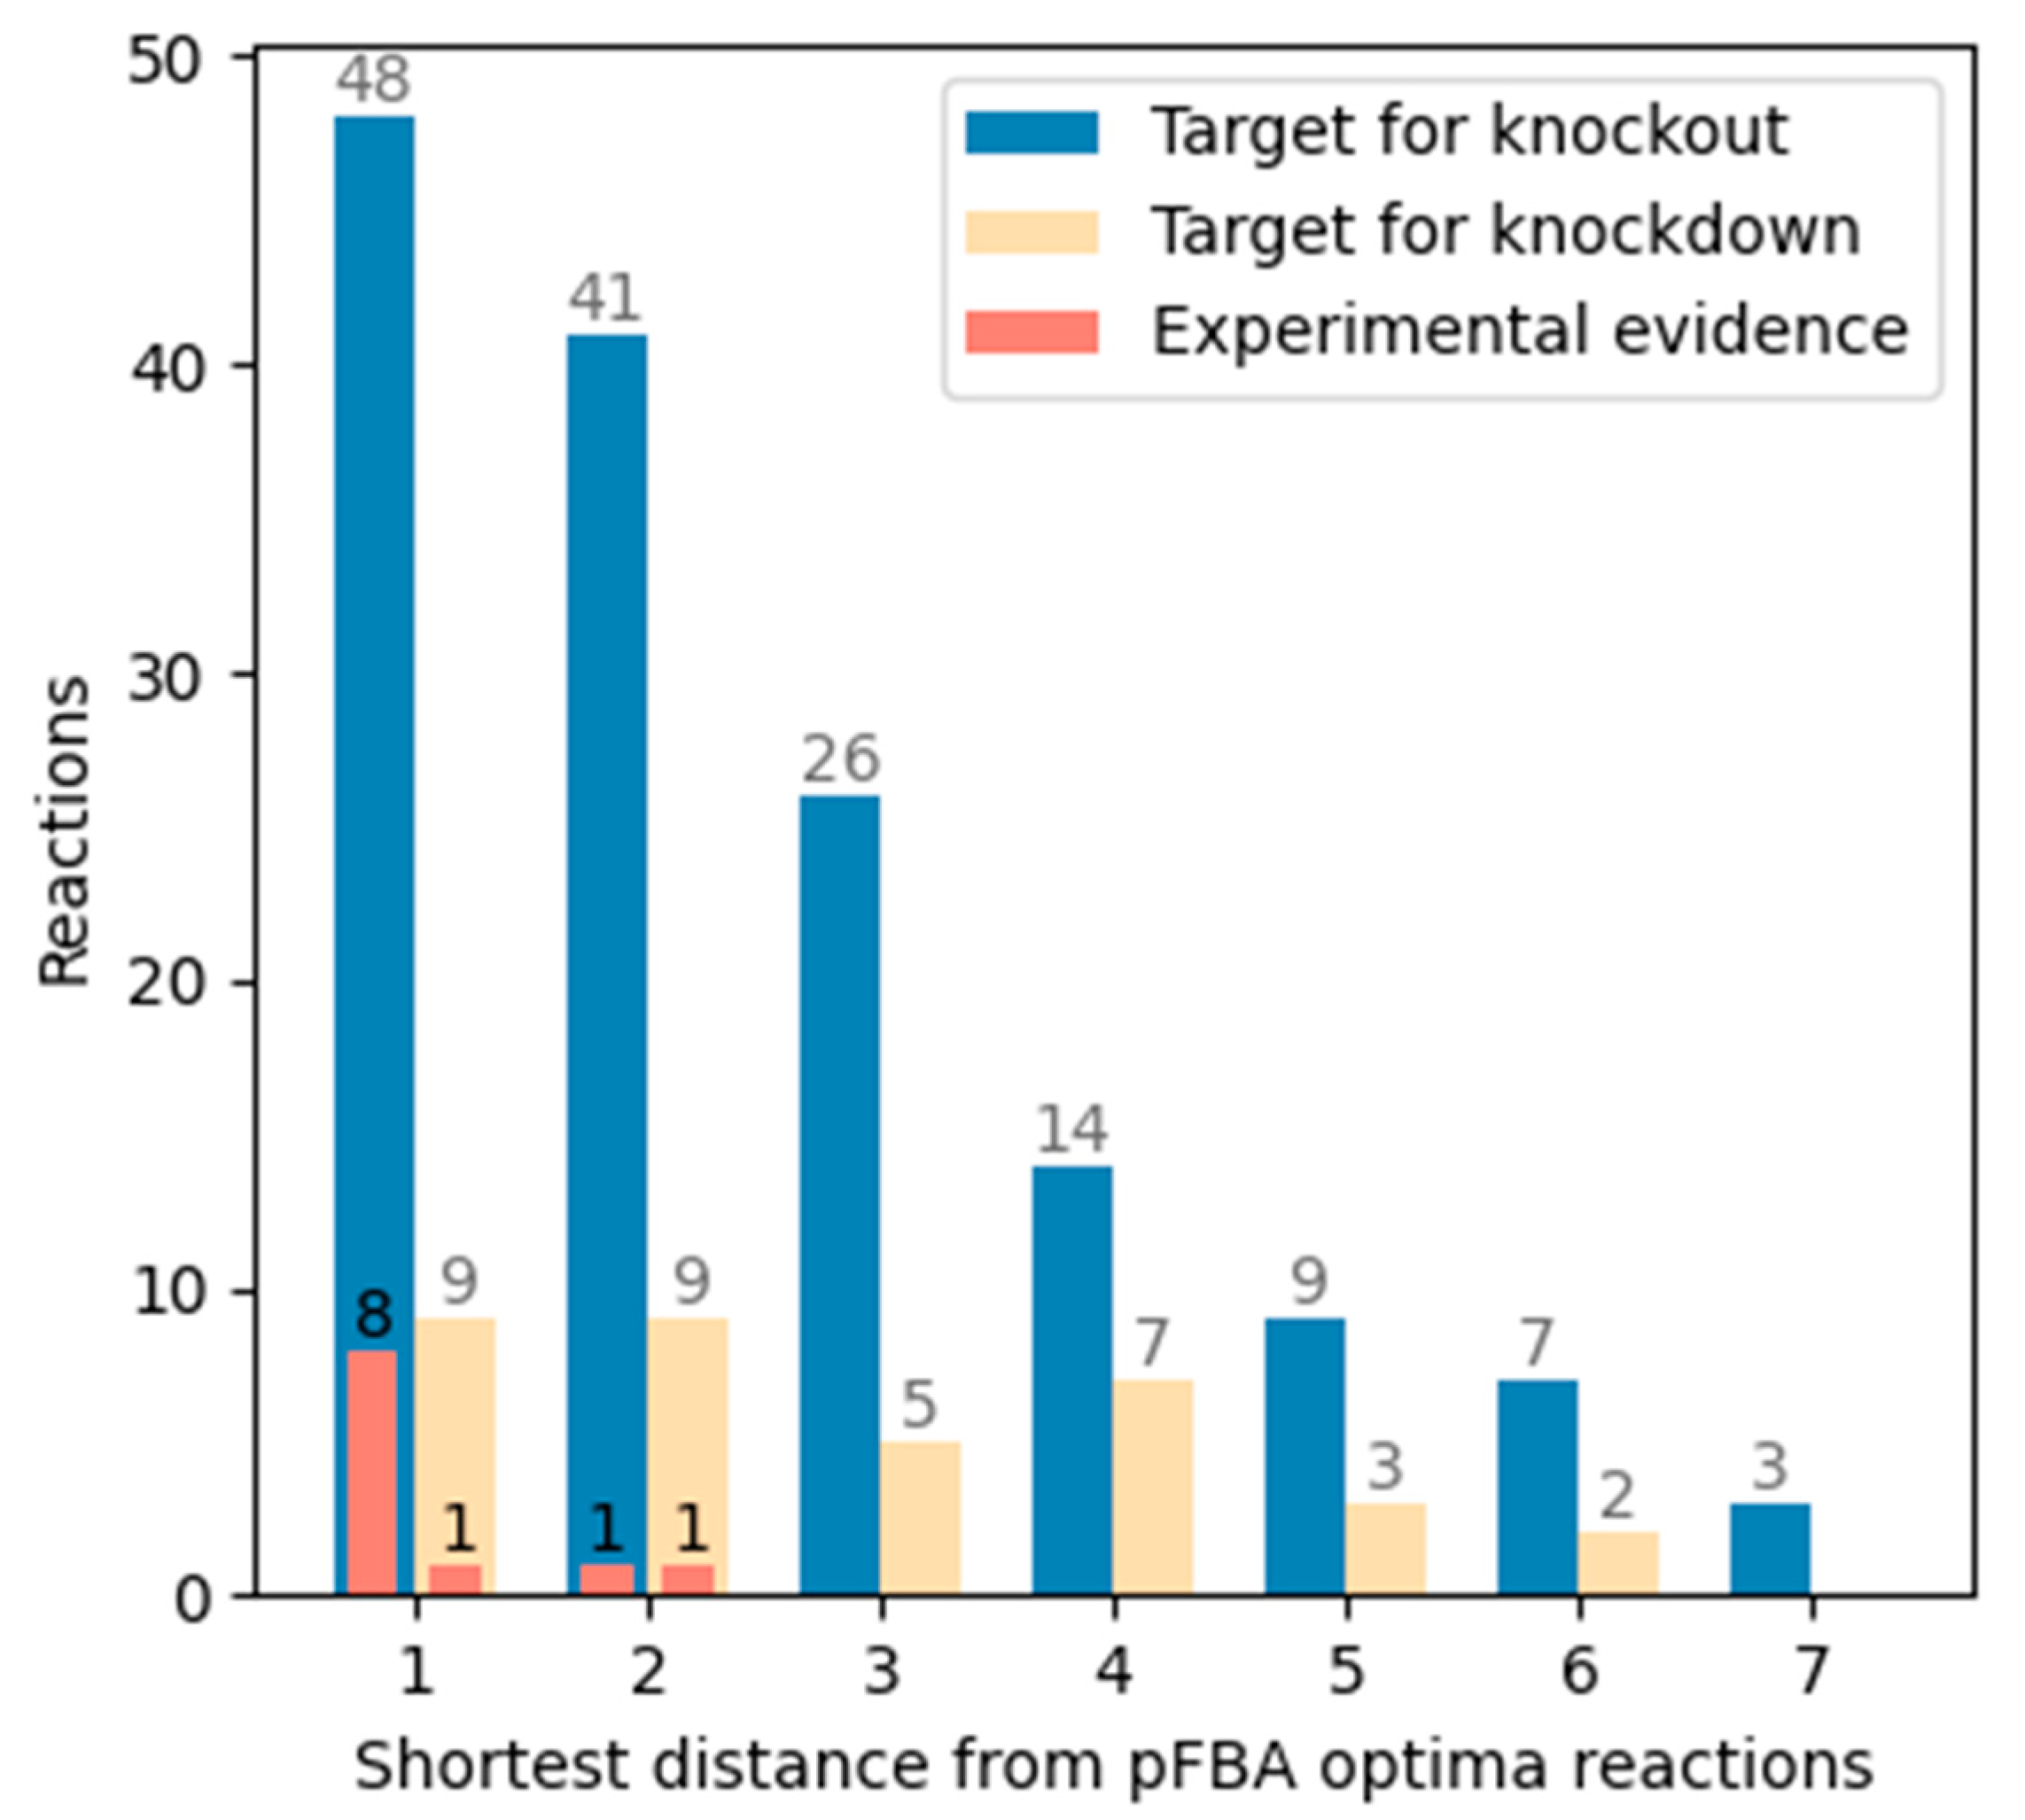
In enzymatic reactions, the distance of reactions that deviate from the optima 76 reactions and are classified as candidates for silence and attenuation is at a maximum of seven and six steps, respectively. Interestingly, enzymatic reactions with experimental evidence are positioned at distances of one and two reactions from the central pathway (refer to Figure 7). Additionally, reactions with empirical evidence at two reactions have a predecessor reaction at one step reaction, also with experimental evidence.

3.5. Production of Indole-3-Acetic Acid by the Keio Mutants

Reaction disruptions with experimental evidence that deviated from the model’s predictions were compared with reactions competing for their substrates and reactions predicted correctly by the model using Keio mutants. The reactions predicted by QPAML were directly associated with the genes annotated in the metabolic model. Two were selected when more than one gene was associated with a reaction, considering one could have lower activity. Although a gene can participate in more than one metabolic pathway, as is the case of the tdcD gene annotated in producing propionate and acetate, we maintain the selected genes. It is possible that the silencing of a gene can have multiple effects by participating in more than one metabolic pathway, which is why the analysis we developed with QPAML focused on reactions. For instance, the trpD gene encodes the bifunctional enzyme anthranilate synthase and anthranilate phosphoribosyltransferase in anthranilate production. The first function produces anthranilate, while the second consumes it, which is why a mutant with reduced anthranilate phosphoribosyltransferase activity was used for improving anthranilate production [64]. These types of complexities are outside the scope of our model, but it indicates that using reactions is a better approach than using genes. For this reason, the conversion of genetic modifications to the activity of metabolic reactions is performed as described in Section 2.7.
The tyrA and pheA genes are responsible for L-tyrosine and L-phenylalanine synthesis and compete with the tryptophan pathway [7,8]; poxB, ackA, and tdcD are involved in two acetate production pathways that affect biomass production [11,97]; tnaA encodes the tryptophan-degradation enzyme tryptophanase [6,7,8,11]; mtr and tnaB encode for tryptophan importers [6,8,9]; the pykA and pykF genes encode pyruvate kinase isoforms that compete for phosphoenolpyruvate, an essential precursor of chorismate [6,8,76]; and gltB is a glutamate synthase that degrades glutamine an anthranilate amino donator [11].
The complexity of the media in which tryptophan is present hinders its quantification. Additionally, distinguishing free tryptophan from protein residues proves challenging. Conventional separation, such as high-performance liquid chromatography (HPLC), may result in poor throughput. Therefore, an alternative approach involves derivatizing tryptophan using enzymes to produce more specific metabolites for colorimetric quantification [39].
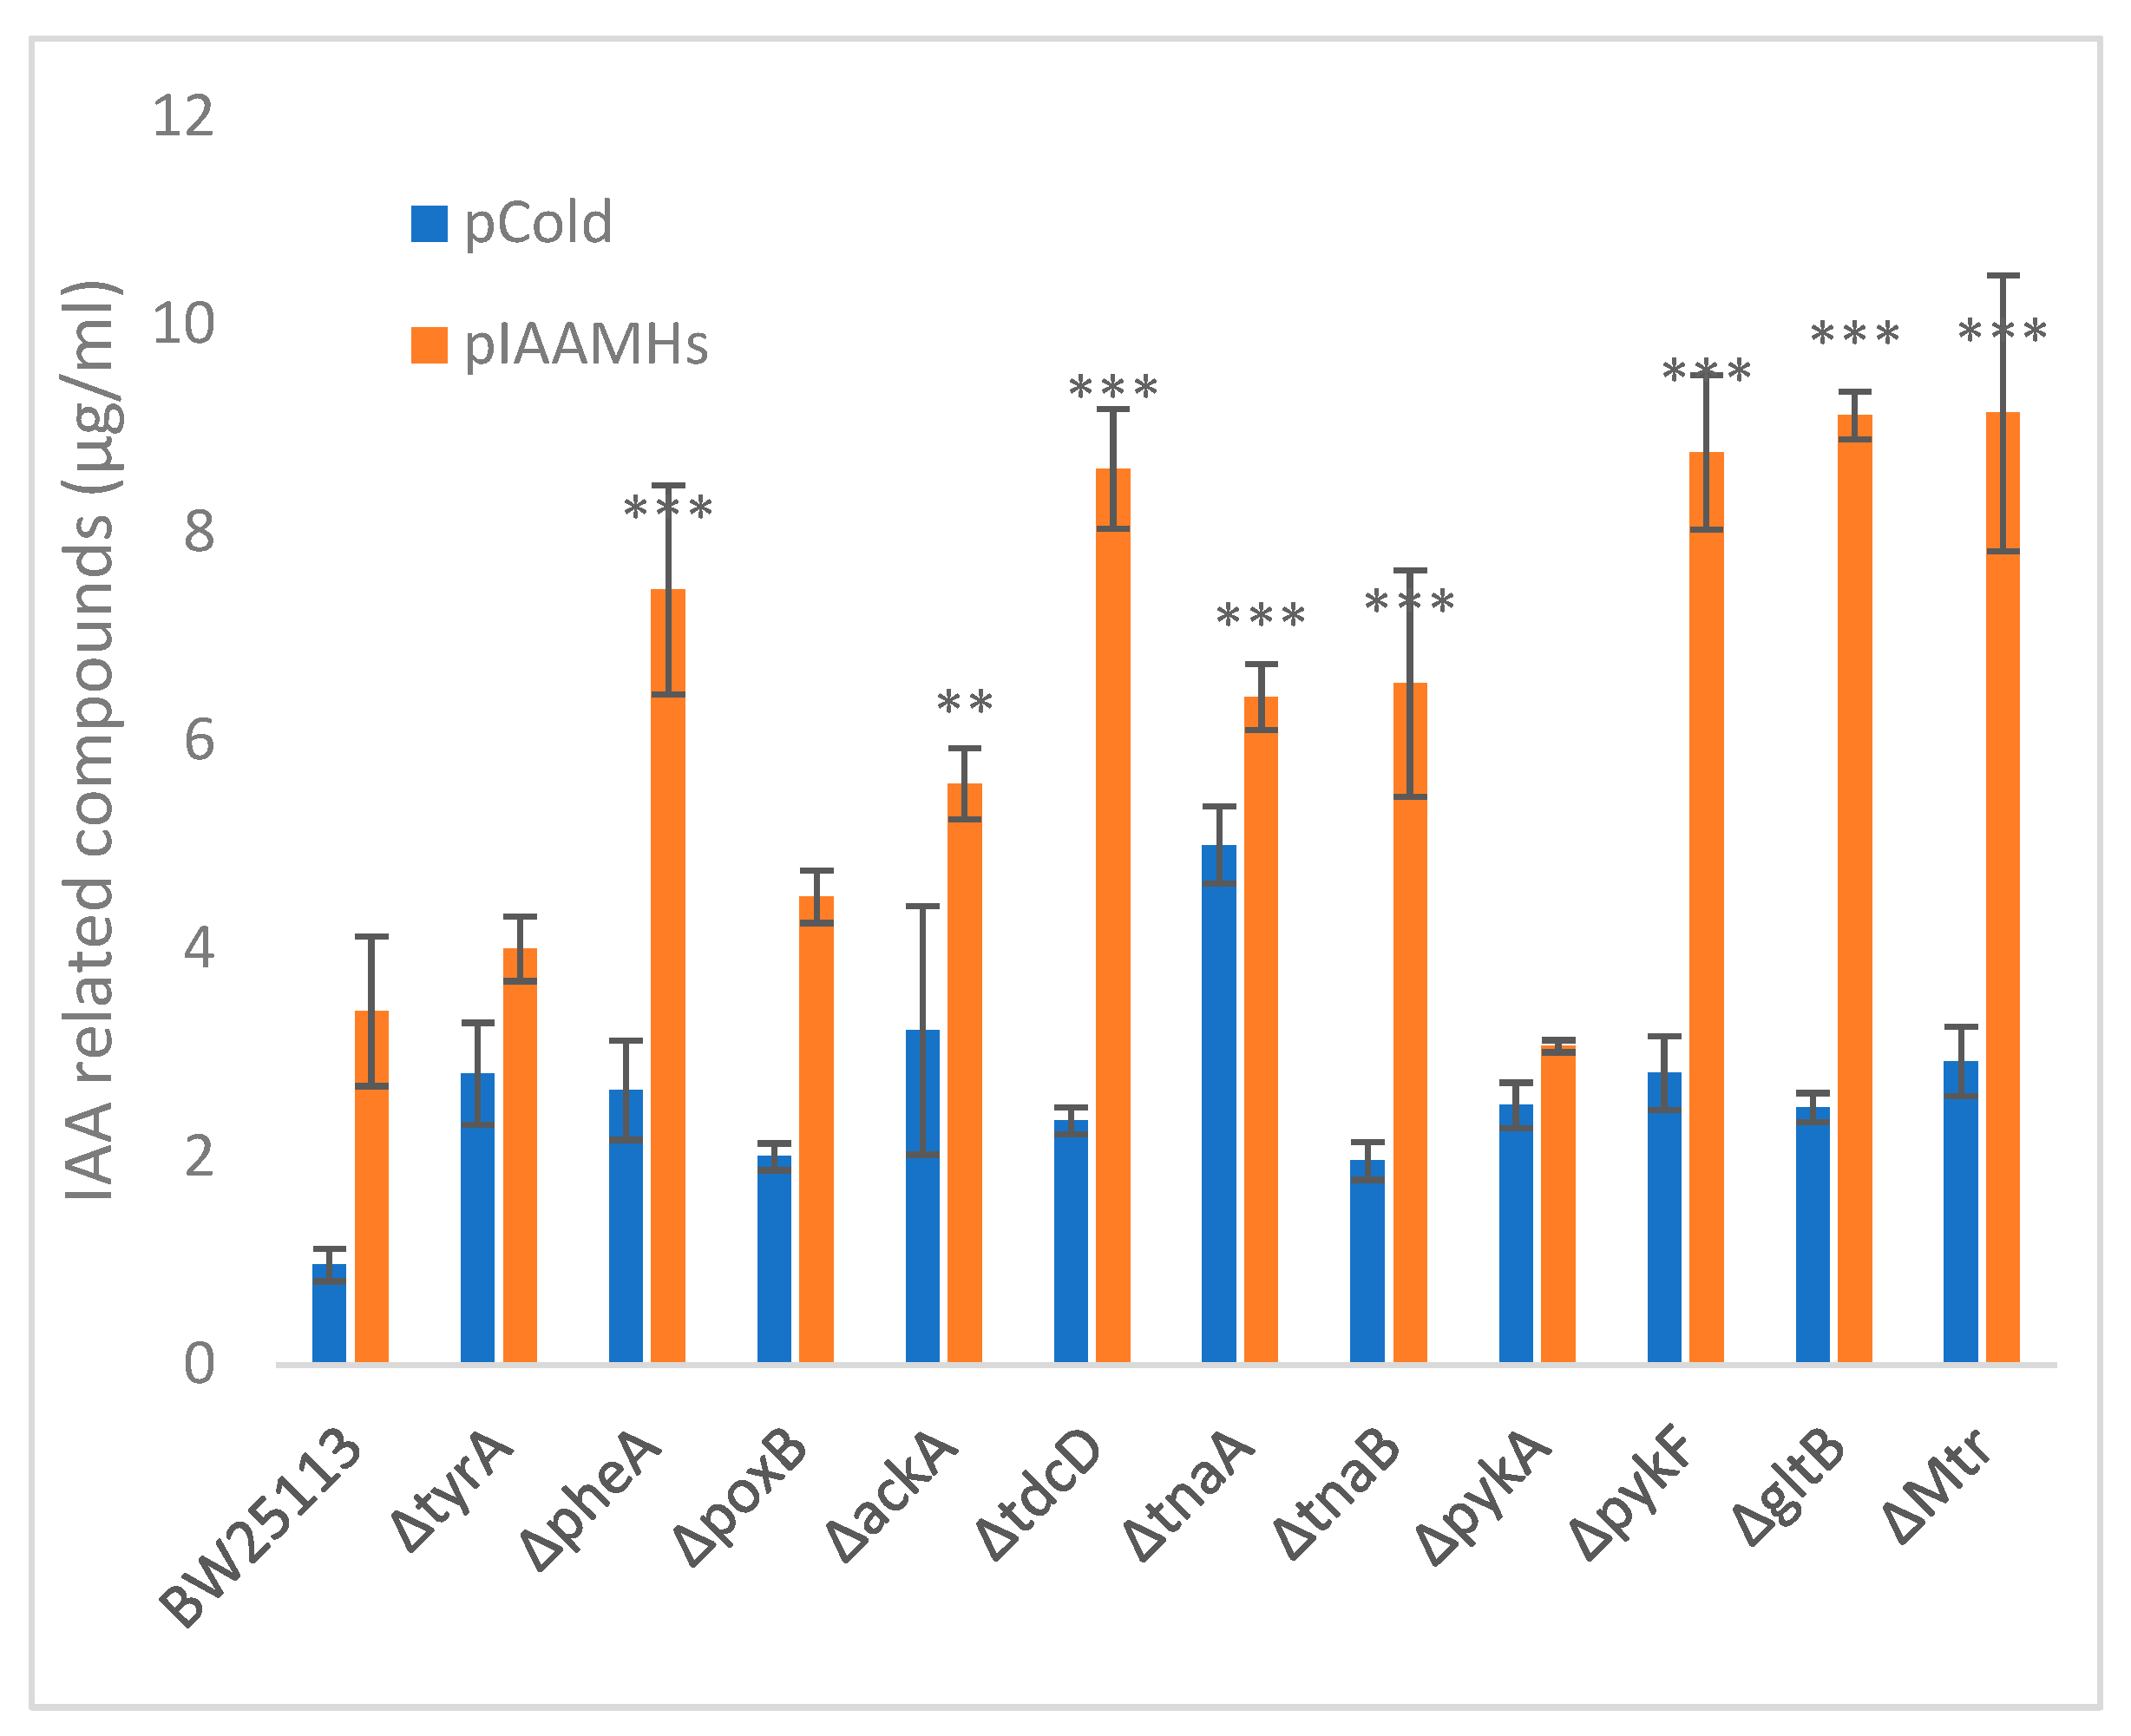
Tryptophan production was indirectly determined through conversion to IAA and quantified using the Salkowski reagent. The pIAAMHs plasmid expresses two enzymes of Pseudomonas savastanoi that efficiently convert tryptophan into IAA. Figure 8 presents the IAA quantification data for relevant Keio mutants.
Indole acetic acid (IAA) production in an E. coli strain through the indole-3-acetamide pathway has been documented [98]. Moreover, the specificity of the Salkowski reagent for indoles derived from tryptophan, as demonstrated in previous studies [40], rationalizes the widespread occurrence of the Salkowski reaction across all tested strains. Upon transformation with pIAAMHs, the parental strain produced 3.12 µg/mL of IAA in the LB medium. Notably, when evaluating the Tukey test, the pykA, tyrA, and poxB mutants did not display significant differences in IAA production compared to the parental strain. In contrast, the remaining mutants demonstrated a substantial and statistically significant increase in the production of IAA.
The measurements of parental strain replicas exhibit substantial variation, which is why other strains show higher production, although the difference is not statistically significant.
The ackA, tdcD, and poxB genes compete for pyruvate, while tyrA and pheA compete for prephenate. When reactions competing for the same precursor are compared, the reactions identified for the model as candidates for disruption produce significantly more IAA. It is noteworthy that silencing pykA does not show a significant improvement in tryptophan production despite performing the same reaction as pykF, perhaps because pykA is less active than pykF by complementing it in the same way as ackA and tdcD. The model predicts tnaA, tnaB, gltB, and mtr as candidates for the knockout, and they align with findings in the existing literature.

4. Discussion

4.1. Interpretation of the Bacterial Response to Enzymatic Perturbations

Cells respond to changing environmental conditions, adjusting their metabolic flux to maintain homeostasis [92]. Perturbations were introduced into the metabolic model by augmenting the flux of 76 pFBA optima reactions. In response, the system strives to return as much as possible to an undisturbed state characterized by maximizing biomass production. However, these responses inherently compete with tryptophan production. The goal was to identify response patterns to these perturbations and attenuate them, as illustrated in Figure 1.
Introducing these perturbations facilitated the identification of competing reactions that would typically exhibit no flux when using FBA or FSOEF, as Tepper and Shlomi have described before when not all competing pathways are found by OptKnock. The conceptual representation of these perturbations is the overexpression of genes involved and the establishment of reservoirs of intermediate metabolites due to bottleneck formation.

4.2. Comparison of FSEOF and QPAML

By introducing perturbations into the metabolic model and propagating them, we were able to take advantage of the flux variation profiles observed by Choi et al. (2010) [30], extending the ability of FSEOF from only predicting reactions for activation to also predicting candidate reactions to be silenced or attenuated.
By comparing the reactions predicted by both models to be activated, FSEOF selects as candidates the reactions that contribute to the production of a metabolite under specific growth conditions; however, QPAML first considers which is the optimal pathway to produce a metabolite without the limitations of the culture medium. This allowed our algorithm to correctly classify 26 reactions of the 27 that have experimental evidence, while FSEOF identified only 20 of these reactions (See Figure 3). QPAML also uses the FSEOF approach to identify which reactions can be overexpressed. However, it integrates information from multiple perturbations to identify which reactions are more robust in producing a metabolite when there are limitations in the culture medium.
By introducing enzymatic perturbations, emergent properties of the metabolic network arose; FSEOF classifies reactions by whether they favor, affect, or have no effect on producing a metabolite. We found that among the reactions that affect the production of a metabolite, there is a large group of reactions whose fluxes are positively correlated with biomass production but are not affected by changes in the production of a metabolite, so they are not good candidates to be modified.
Finally, introducing perturbations allowed us to identify candidate reactions to be silenced, such as the reaction catalyzed by the enzyme tryptophanase. Using only FSEOF, this reaction does not present flux. It is considered a reaction that does not affect the production of tryptophan. However, using FSEOF in the context of QPAML, tnaA presents an inverse relationship with tryptophan and classifies it correctly as a candidate to be silenced.
To a difference of FSEOF, QPAML is a classification model that can integrate other types of information to be trained, for example, it uses the essentiality of reactions to distinguish between reactions that are candidates to be silenced or attenuated.

4.3. Limitations of the QPAML Classification Model

The QPAML is fed with FBA simulations, and therefore, it is predominantly driven by stoichiometric forces, omitting thermodynamic and regulatory factors.
The model may misclassify specific reversible reactions because fluxes could not represent truly physiological conditions. For instance, the tryptophanase reaction degrades tryptophan under normal conditions. Still, the reverse reaction is a shorter pathway to produce tryptophan, which is only possible in exceptional conditions with low concentrations of tryptophan and high concentrations of pyruvate and ammonia [44]. A potential solution to this limitation could be the implementation of thermodynamic Flux Balance Analysis (tFBA) [99], albeit with the drawback of requiring reaction thermodynamic values. Alternatively, manual correction can be applied by ensuring that pFBA optima reactions align with the most frequently described pathways.
The QPAML model demonstrates robustness in classifying most reactions that enhance tryptophan production, such as the overexpression of pntBA genes that reinforce the supply of NAD and NADPH cofactors when depleted by the Crabtree effect [9,10]. However, the overexpression of sthA, catalyzing the reverse reaction, may be explained as a compensatory mechanism to pntBA overexpression [9].
Since this model relies on QPA, its classification is purely qualitative, lacking scores for reaction modulation. This algorithm restriction is attributed to limited experimental information; however, the model can adapt to the availability of more data by applying Extended Qualitative Perturbation Analysis, which provides quantitative results [34].
In this study, we used QPAML built with qualitative attributes of the reactions that constitute a metabolic network. Once the candidate reactions for disruption were classified, they were prioritized, considering their position in the metabolic network. Currently, algorithms such as Fuzzy-Based Deep Attributed Graph Clustering use the graph’s structure and the attributes of its nodes and vertices to perform seamless clustering tasks [100]. These algorithms could be used for reaction classification when a larger dataset of genetic modifications is available.

4.4. Identification of Branching Reactions

As a positive finding, QPAML classifies reactions reported in the literature as candidates for disruption, as well as subsequent reactions in the same pathway, just as in a real disruption would occur, regardless of whether the fluxes are not equal. The resulting reactions classified for disruption span the entire metabolic pathway, as indicated by the connectivity of reactions in Figure 7. Consequently, silencing branching reactions may deactivate multiple reactions. For instance, silencing the chorismate mutase reaction inactivates the enzymatic reactions of the L-tyrosine and L-phenylalanine biosynthesis pathways.
All reactions with experimental evidence were at distances of 1 or 2 from the 76 pFBA optima enzymatic reactions.
Reactions adjacent to pFBA optima are more suitable for silencing. Reactions at a distance of 2 reported in the literature were considered either due to the presence of a bifunctional enzyme encoded by pheA [76] or the incomplete silencing of adjacent reactions due to the lack of acknowledgment of the eutD encoded isoenzyme [97,98,99,100,101]. Apart from the reactions reported in the literature to enhance the production of tryptophan, the algorithm identified reactions that have been silenced to increase the production of precursor metabolites (Table 3).
The enumeration of metabolic pathways has been a challenging problem that has been addressed from different points of view [58,107,108]. A more accurate method for measuring reaction distance is necessary to avoid classifying reactions in the last part of salvage pathways as branching reactions. For instance, reactions involved in the β-oxidation pathway that are tightly regulated [109] may not be suitable for disruption.

4.5. Application of the QPAML Model in Other Metabolic Pathways

Examining the results against the confusion matrix (Figure 6) revealed specific classification patterns. Despite the model’s primary training in the tryptophan pathway, it demonstrated effective categorization of reactions from the metabolic pathways of 31 metabolites, achieving a notable F1-score of 92.34. Notably, there were no misclassifications of candidate reactions for knockdown as low flux, highlighting the essential nature of knockdown reactions for cell growth and the good performance of the iML1515a model. Furthermore, the model consistently differentiated between silence and attenuation reactions based on their essentiality, with no interchanges in classifications between these two classes. A reaction for overexpression involving the conversion of acetate to acetyl-CoA (ACS) was misclassified as low flux [83]. As an alternative strategy, the model advised silencing the ACKr and PTAr reactions to prevent acetyl-CoA conversion to acetate, thereby avoiding a futile cycle.
The specific conditions of the culture influence reaction assignment for overexpression instead of knockout. For instance, the model identified organic acid fermentation reactions as overexpression targets, potentially driven by an imbalance in the NADH/NAD ratio under microaerobic conditions. In scenarios where these reactions regenerate NAD without adequate oxygen, they become essential for growth under anaerobic conditions [53].

4.6. Prioritization in Inactivating Reactions and Objective Function

The QPAML classified specific reactions, supported by experimental evidence of being inactivated, as either low flux or biomass-related. For example, prephenate dehydrogenase (PPND), encoded by the tyrA gene, competes for prephenate with prephenate dehydratase (PPNDH), encoded by the pheA gene. Both genes have been inactivated to enhance tryptophan production, but not in the same genetic background [7]. In our tested mutants, pheA produces IAA that increases by 132.81%. In contrast, the tyrA mutant does not significantly increase, aligning with model predictions. The preference for a pathway could be explained using NAD as a cofactor by PPND; this observation can be rationalized because surplus fluxes of perturbations are redirected to biomass production to maximize the objective function, as documented by Lewis et al. [29].
Acetate secretion represents a carbon waste in E. coli; two pathways produce it. The primary pathway involves the conversion of acetyl-CoA to acetyl-phosphate via phosphotransacetylase (pta/eutD), followed by acetate and ATP formation through acetate kinase (ackA/tdcD/purT). In the secondary pathway, pyruvate oxidase B (POX) converts pyruvate to acetate. Deletion of poxB amplifies pyruvate accumulation [87], but its effect on tryptophan production is paradoxical, potentially diminishing its production [11]. The POX reaction is classified as low flux by QPAML, contrasting with the primary pathway reactions (PTAr and ACKr) designated for the knockout.
In the poxB mutant, no statistically significant enhancement in IAA production is observed. ACKr knockdown, via ackA or tdcD deletions, improves IAA production by 79.03% and 176.15%, respectively. Analogously to the pheA and tyrA genes, poxB appears less proficient in biomass synthesis, given that the primary pathway yields one ATP molecule per acetate molecule produced.
The mtr mutant showed the most significant enhancement, with a 193.3% increase in IAA production. The increase in IAA production in the mtr and tnaB mutant aligns with the significant role of tryptophan transport, as explained in the molecular dynamic model created by Castro-López et al. [4]. It is important to note that the purpose of testing individual mutations on specific genes of the Keio collection was to assess the contribution of each mutant and validate the model to some extent. However, this does not represent a comprehensive model validation, nor is it the intention to optimize tryptophan or IAA production.

4.7. Model Interpretation and Strategies Used to Produce Tryptophan

Giving biological meaning to the variables used to construct the QPAML model based on previous strategies for producing tryptophan highlights the need to define an optimal pathway. Reactions belonging to this pathway and reactions that provide precursors and cofactors could be candidates for overexpression. Reactions that compete for resources must be disrupted, especially if they are branching reactions. Non-essential reactions must be deleted, but essential reactions can be attenuated to prevent impairment of bacterial growth. Some reactions appear related to biomass production but are not affected by tryptophan production and are not a good target for genetic modification. Finally, inactive reactions are not good candidates for tuning.
The above statements describe the strategies used to select candidate genes to be modified to improve tryptophan production in E. coli. The selection of variables was not approached from a biological point of view but rather through a deep analysis of the data and their adjustment to the experimental observations.

4.8. Advantages of the QPAML Model

QPAML was developed to rationalize the role of reactions in the production of tryptophan, taking advantage of new technologies. It can handle multiple scenarios, offering a comprehensive perspective of the metabolic system. This model runs with computationally efficient algorithms, relying on the size of the metabolic network and the target biosynthetic pathway. Its flexibility is evident in its capacity to accept diverse data types and discern complex relationships. Initially trained using data from tryptophan production, the model could be extended to other metabolites. A more refined version of the model could be crafted by incorporating information from different metabolic pathways. The analysis of perturbations could unveil emerging properties, identifying biomass-related reactions as a notable example of reactions exhibiting suboptimal performance in metabolite overproduction.

5. Conclusions

We developed a Qualitative Perturbation Analysis and Machine Learning (QPAML) classification model to identify enzymatic reaction candidates to be deleted, attenuated, or overexpressed to enhance metabolite production in E. coli. The model was run on the iML1515a Genome-Scale Metabolic Network Model (GEM). Internally, the model integrates several algorithms: pFBA first defined a core of 76 optima reactions from glucose to tryptophan. Afterward, FSEOF introduced perturbation over fluxes on each of the 76 reactions and registered its propagation along the whole iML1515a genome model. These perturbations resulted in ten fluxes per enzymatic reaction that were graphed against tryptophan and biomass production, and based on their slopes, these were classified in a table of qualitative variables. This table was used to feed the Gradient-Boosting Decision Tree (GBDT) that results in reactions classified as candidates for overexpression, silencing, or attenuation concerning tryptophan production and the other two valuable classes. Although the model performance is 92.34% in F1-Score, limitations arise when regulatory and kinetic parameters are involved in producing target metabolites. This work was limited to a qualitative analysis due to the limited availability of standardized genetic modifications; it is necessary to develop databases that collect information on genetic modifications and levels of production of the desired metabolite. It is also necessary to develop standardized conditions to report the production of different metabolites to facilitate the study of metabolic networks.
The QPAML model performs excellently with only six variables representing general properties of reactions in the context of target metabolite production. Better accuracy could be achieved by including more variables when new data are available. The new variables may represent more complex properties of the network, whose patterns require more powerful tools, such as deep learning.
This model can help us understand the properties that define the role of reactions in driving microbial production of valuable metabolites, such as tryptophan. It could be an additional tool that contributes to paving the way for efficient strain engineering and unlocking a treasure trove of potential applications in biotechnology.

Supplementary Materials

The following supporting information can be downloaded at: https://www.mdpi.com/article/10.3390/a17070282/s1; Figure S1: Circular map of the pIAAMHs expression vector for directing the synthesis of IAA in E. coli; Figure S2: Growth curves on E. coli BW25113 and Keio mutants transformed with pCold vector; Figure S3: Growth curves on E. coli BW25113 and Keio mutants transformed with pIAAMHs plasmid; Figure S4: Examination of the relationship between reactions and metabolite production within each perturbation; Figure S5: Behavior of reactions upon perturbation are introduced; Figure S6: Decision tree for reaction classification; Table S1: Modifications made to the metabolic model iML1515a [4,6,7,8,9,11,13,14,15,16,43,44,45,46,47,48,49,50,51,52,53,54,55,56]; Table S2: List of Experimentally Evaluated Genetic Modifications for overproduction of endogenous metabolites in E. coli [4,6,7,8,9,11,12,13,14,15,16,43,44,45,46,47,48,49,50,51,52,53,54,55,56,61,62,63,64,65,66,67,68,69,70,71,72,73,74,75,76,77,78,79,80,81,82,83,84,85,86,87,88,89,90]; Table S3: Genetic modifications were utilized to train the GBDT model [6,7,8,9,12,13,14,15,16]; Table S4: Experimentally activated reactions to improve tryptophan production [6,7,8,9,11,12,13,14,15,16]; Table S5: Comparison of reactions predicted by QPAML and FSEOF. The QPAML code and simulations can be reached at https://gitlab.com/amalib/qpaml (accessed on 31 January 2024).

Author Contributions

Conceptualization, M.A.R.-V., P.C.S.-N. and A.M.-A.; methodology, M.A.R.-V. and P.C.S.-N.; software, M.A.R.-V.; validation, M.A.R.-V., A.L.H.-O. and G.R.A.; formal analysis, M.A.R.-V.; investigation, M.A.R.-V., A.L.H.-O. and G.R.A.; resources, A.M.-A.; data curation, M.A.R.-V.; writing—original draft preparation, M.A.R.-V.; writing—review and editing, A.M.-A.; visualization, M.A.R.-V.; supervision, A.M.-A.; project administration, A.M.-A.; funding acquisition, A.M.-A. All authors have read and agreed to the published version of the manuscript.

Funding

The Consejo Nacional de Ciencia, Humanidades y Tecnología (CONAHCYT), with grant number 319,732 (2021) given to A.M-A., funded this research; also, M.A.R.-V. was the recipient of CONAHCYT Ph.D. fellowship no. 486528. The pIAAMHs plasmid construction was supported by the IDEA Guanajuato project CFINN0177 (2016) given to A.M-A.

Data Availability Statement

The QPAML code and simulations can be reached at https://gitlab.com/amalib/qpaml (accessed on 31 January 2024).

Acknowledgments

The authors thank Guillermo Gosset Group for generously providing us with the E. coli BW25113 strain and samples from the Keio collection and Lucía C. Alzati Ramírez for aiding in data curation.

Conflicts of Interest

The authors declare no conflicts of interest.

References

  1. Gang, S.; Sharma, S.; Saraf, M.; Buck, M.; Schumacher, J. Analysis of Indole-3-Acetic Acid (IAA) Production in Klebsiella by LC-MS/MS and the Salkowski Method. Bio-Protocol 2019, 9, e3230. [Google Scholar] [CrossRef] [PubMed]
  2. Pharkya, P.; Maranas, C.D. An Optimization Framework for Identifying Reaction Activation/Inhibition or Elimination Candidates for Overproduction in Microbial Systems. Metab. Eng. 2006, 8, 1–13. [Google Scholar] [CrossRef] [PubMed]
  3. Chen, L.; Chen, M.; Ma, C.; Zeng, A.-P. Discovery of Feed-Forward Regulation in L-Tryptophan Biosynthesis and Its Use in Metabolic Engineering of E. coli for Efficient Tryptophan Bioproduction. Metab. Eng. 2018, 47, 434–444. [Google Scholar] [CrossRef]
  4. Castro-López, D.A.; González de la Vara, L.E.; Santillán, M.; Martínez-Antonio, A. A Molecular Dynamic Model of Tryptophan Overproduction in Escherichia coli. Fermentation 2022, 8, 560. [Google Scholar] [CrossRef]
  5. Panichkin, V.B.; Livshits, V.A.; Biryukova, I.V.; Mashko, S.V. Metabolic Engineering of Escherichia coli for L-Tryptophan Production. Appl. Biochem. Microbiol. 2016, 52, 783–809. [Google Scholar] [CrossRef]
  6. Du, L.; Zhang, Z.; Xu, Q.; Chen, N. Central Metabolic Pathway Modification to Improve L-Tryptophan Production in Escherichia coli. Bioengineered 2019, 10, 59–70. [Google Scholar] [CrossRef] [PubMed]
  7. Zhao, Z.-J.; Zou, C.; Zhu, Y.-X.; Dai, J.; Chen, S.; Wu, D.; Wu, J.; Chen, J. Development of L-Tryptophan Production Strains by Defined Genetic Modification in Escherichia coli. J. Ind. Microbiol. Biotechnol. 2011, 38, 1921–1929. [Google Scholar] [CrossRef] [PubMed]
  8. Liu, S.; Xu, J.-Z.; Zhang, W.-G. Advances and Prospects in Metabolic Engineering of Escherichia coli for L-Tryptophan Production. World J. Microbiol. Biotechnol. 2022, 38, 22. [Google Scholar] [CrossRef]
  9. Li, Z.; Ding, D.; Wang, H.; Liu, L.; Fang, H.; Chen, T.; Zhang, D. Engineering Escherichia coli to Improve Tryptophan Production via Genetic Manipulation of Precursor and Cofactor Pathways. Synth. Syst. Biotechnol. 2020, 5, 200–205. [Google Scholar] [CrossRef]
  10. Zhao, C.; Cheng, L.; Xu, Q.; Wang, J.; Shen, Z.; Chen, N. Improvement of the Production of L-Tryptophan in Escherichia coli by Application of a Dissolved Oxygen Stage Control Strategy. Ann. Microbiol. 2016, 66, 843–854. [Google Scholar] [CrossRef]
  11. Xu, Q.; Bai, F.; Chen, N.; Bai, G. Gene Modification of the Acetate Biosynthesis Pathway in Escherichia coli and Implementation of the Cell Recycling Technology to Increase L-Tryptophan Production. PLoS ONE 2017, 12, e0179240. [Google Scholar] [CrossRef] [PubMed]
  12. Wang, J.; Cheng, L.-K.; Wang, J.; Liu, Q.; Shen, T.; Chen, N. Genetic Engineering of Escherichia coli to Enhance Production of L-Tryptophan. Appl. Microbiol. Biotechnol. 2013, 97, 7587–7596. [Google Scholar] [CrossRef] [PubMed]
  13. Shen, T.; Liu, Q.; Xie, X.; Xu, Q.; Chen, N. Improved Production of Tryptophan in Genetically Engineered Escherichia coli with TktA and PpsA Overexpression. J. Biomed. Biotechnol. 2012, 2012, 605219. [Google Scholar] [CrossRef] [PubMed]
  14. Liu, L.; Duan, X.; Wu, J. L-Tryptophan Production in Escherichia coli Improved by Weakening the Pta-AckA Pathway. PLoS ONE 2016, 11, e0158200. [Google Scholar] [CrossRef] [PubMed]
  15. Liu, S.; Wang, B.-B.; Xu, J.-Z.; Zhang, W.-G. Engineering of Shikimate Pathway and Terminal Branch for Efficient Production of L-Tryptophan in Escherichia coli. Int. J. Mol. Sci. 2023, 24, 11866. [Google Scholar] [CrossRef] [PubMed]
  16. Schoppel, K.; Trachtmann, N.; Korzin, E.J.; Tzanavari, A.; Sprenger, G.A.; Weuster-Botz, D. Metabolic Control Analysis Enables Rational Improvement of E. coli L-Tryptophan Producers but Methylglyoxal Formation Limits Glycerol-Based Production. Microb. Cell Fact. 2022, 21, 201. [Google Scholar] [CrossRef]
  17. Wang, J.; Zhang, R.; Zhang, Y.; Yang, Y.; Lin, Y.; Yan, Y. Developing a Pyruvate-Driven Metabolic Scenario for Growth-Coupled Microbial Production. Metab. Eng. 2019, 55, 191–200. [Google Scholar] [CrossRef]
  18. Alter, T.B.; Ebert, B.E. Determination of Growth-Coupling Strategies and Their Underlying Principles. BMC Bioinform. 2019, 20, 447. [Google Scholar] [CrossRef] [PubMed]
  19. von Kamp, A.; Klamt, S. Growth-Coupled Overproduction Is Feasible for Almost All Metabolites in Five Major Production Organisms. Nat. Commun. 2017, 8, 15956. [Google Scholar] [CrossRef]
  20. Baba, T.; Ara, T.; Hasegawa, M.; Takai, Y.; Okumura, Y.; Baba, M.; Datsenko, K.A.; Tomita, M.; Wanner, B.L.; Mori, H. Construction of Escherichia coli K-12 In-frame, Single-gene Knockout Mutants: The Keio Collection. Mol. Syst. Biol. 2006, 2, 2006.0008. [Google Scholar] [CrossRef]
  21. Tepper, N.; Shlomi, T. Predicting Metabolic Engineering Knockout Strategies for Chemical Production: Accounting for Competing Pathways. Bioinformatics 2010, 26, 536–543. [Google Scholar] [CrossRef] [PubMed]
  22. Kim, J.; Reed, J.L. OptORF: Optimal Metabolic and Regulatory Perturbations for Metabolic Engineering of Microbial Strains. BMC Syst. Biol. 2010, 4, 53. [Google Scholar] [CrossRef]
  23. Pharkya, P.; Burgard, A.P.; Maranas, C.D. OptStrain: A Computational Framework for Redesign of Microbial Production Systems. Genome Res. 2004, 14, 2367–2376. [Google Scholar] [CrossRef] [PubMed]
  24. Kim, J.; Reed, J.L.; Maravelias, C.T. Large-Scale Bi-Level Strain Design Approaches and Mixed-Integer Programming Solution Techniques. PLoS ONE 2011, 6, e24162. [Google Scholar] [CrossRef]
  25. Ranganathan, S.; Suthers, P.F.; Maranas, C.D. OptForce: An Optimization Procedure for Identifying All Genetic Manipulations Leading to Targeted Overproductions. PLoS Comput. Biol. 2010, 6, e1000744. [Google Scholar] [CrossRef]
  26. Burgard, A.P.; Pharkya, P.; Maranas, C.D. Optknock: A Bilevel Programming Framework for Identifying Gene Knockout Strategies for Microbial Strain Optimization. Biotechnol. Bioeng. 2003, 84, 647–657. [Google Scholar] [CrossRef]
  27. Patil, K.R.; Rocha, I.; Förster, J.; Nielsen, J. Evolutionary Programming as a Platform for in Silico Metabolic Engineering. BMC Bioinform. 2005, 6, 308. [Google Scholar] [CrossRef]
  28. Ohno, S.; Shimizu, H.; Furusawa, C. FastPros: Screening of Reaction Knockout Strategies for Metabolic Engineering. Bioinformatics 2014, 30, 981–987. [Google Scholar] [CrossRef] [PubMed]
  29. Lewis, N.E.; Hixson, K.K.; Conrad, T.M.; Lerman, J.A.; Charusanti, P.; Polpitiya, A.D.; Adkins, J.N.; Schramm, G.; Purvine, S.O.; Lopez-Ferrer, D.; et al. Omic Data from Evolved E. coli Are Consistent with Computed Optimal Growth from Genome-scale Models. Mol. Syst. Biol. 2010, 6, 390. [Google Scholar] [CrossRef]
  30. Choi, H.S.; Lee, S.Y.; Kim, T.Y.; Woo, H.M. In Silico Identification of Gene Amplification Targets for Improvement of Lycopene Production. Appl. Environ. Microbiol. 2010, 76, 3097–3105. [Google Scholar] [CrossRef]
  31. Doroshenko, V.; Airich, L.; Vitushkina, M.; Kolokolova, A.; Livshits, V.; Mashko, S. YddG from Escherichia coli Promotes Export of Aromatic Amino Acids. FEMS Microbiol. Lett. 2007, 275, 312–318. [Google Scholar] [CrossRef] [PubMed]
  32. Gonzalez-Diaz, H.; Arrasate, S.; Gomez-SanJuan, A.; Sotomayor, N.; Lete, E.; Besada-Porto, L.; Ruso, J. General Theory for Multiple Input-Output Perturbations in Complex Molecular Systems. 1. Linear QSPR Electronegativity Models in Physical, Organic, and Medicinal Chemistry. Curr. Top. Med. Chem. 2013, 13, 1713–1741. [Google Scholar] [CrossRef] [PubMed]
  33. Diéguez-Santana, K.; Casañola-Martin, G.M.; Green, J.R.; Rasulev, B.; González-Díaz, H. Predicting Metabolic Reaction Networks with Perturbation-Theory Machine Learning (PTML) Models. Curr. Top. Med. Chem. 2021, 21, 819–827. [Google Scholar] [CrossRef] [PubMed]
  34. D’Ambrosio, B. Qualitative Perturbation Analysis. In Qualitative Process Theory Using Linguistic Variables; Springer: New York, NY, USA, 1989; pp. 120–141. [Google Scholar]
  35. De Mori, R.; Prager, R. Perturbation Analysis with Qualitative Models. Int. Jt. Conf. Artif. Intell. Organ. 1989, 2, 1180–1186. [Google Scholar]
  36. Zhang, C.; Zhang, Y.; Shi, X.; Almpanidis, G.; Fan, G.; Shen, X. On Incremental Learning for Gradient Boosting Decision Trees. Neural Process Lett. 2019, 50, 957–987. [Google Scholar] [CrossRef]
  37. Sahu, A.; Blätke, M.-A.; Szymański, J.J.; Töpfer, N. Advances in Flux Balance Analysis by Integrating Machine Learning and Mechanism-Based Models. Comput. Struct. Biotechnol. J. 2021, 19, 4626–4640. [Google Scholar] [CrossRef] [PubMed]
  38. Sambrook, J.; Russell, D.W. Preparation and Transformation of Competent E. coli Using Calcium Chloride. Cold Spring Harb. Protoc. 2006, 2006, pdb.prot3932. [Google Scholar] [CrossRef]
  39. Salkowski, E. Ueber Das Verhalten Der Skatolcarbonsäure Im Organismus. Biol. Chem. 1885, 9, 23–33. [Google Scholar] [CrossRef]
  40. Glickmann, E.; Dessaux, Y. A Critical Examination of the Specificity of the Salkowski Reagent for Indolic Compounds Produced by Phytopathogenic Bacteria. Appl. Environ. Microbiol. 1995, 61, 793–796. [Google Scholar] [CrossRef]
  41. Love, J.; Selker, R.; Marsman, M.; Jamil, T.; Dropmann, D.; Verhagen, J.; Ly, A.; Gronau, Q.F.; Smíra, M.; Epskamp, S.; et al. JASP: Graphical Statistical Software for Common Statistical Designs. J. Stat. Softw. 2019, 88, 1–17. [Google Scholar] [CrossRef]
  42. Simensen, V.; Schulz, C.; Karlsen, E.; Bråtelund, S.; Burgos, I.; Thorfinnsdottir, L.B.; García-Calvo, L.; Bruheim, P.; Almaas, E. Experimental Determination of Escherichia coli Biomass Composition for Constraint-Based Metabolic Modeling. PLoS ONE 2022, 17, e0262450. [Google Scholar] [CrossRef] [PubMed]
  43. Kim, B.; Binkley, R.; Kim, H.U.; Lee, S.Y. Metabolic Engineering of Escherichia coli for the Enhanced Production of L-tyrosine. Biotechnol. Bioeng. 2018, 115, 2554–2564. [Google Scholar] [CrossRef] [PubMed]
  44. Decottignies-Le Maréchal, P.; Calderón-Seguin, R.; Vandecasteele, J.P.; Azerad, R. Synthesis of L-Tryptophan by Immobilized Escherichia coli Cells. Eur. J. Appl. Microbiol. Biotechnol. 1979, 7, 33–44. [Google Scholar] [CrossRef]
  45. Long, M.; Xu, M.; Ma, Z.; Pan, X.; You, J.; Hu, M.; Shao, Y.; Yang, T.; Zhang, X.; Rao, Z. Significantly Enhancing Production of Trans-4-Hydroxy-L-Proline by Integrated System Engineering in Escherichia coli. Sci. Adv. 2020, 6, eaba2383. [Google Scholar] [CrossRef]
  46. Qian, Z.; Xia, X.; Lee, S.Y. Metabolic Engineering of Escherichia coli for the Production of Cadaverine: A Five Carbon Diamine. Biotechnol. Bioeng. 2011, 108, 93–103. [Google Scholar] [CrossRef] [PubMed]
  47. Wu, H.; Li, Y.; Ma, Q.; Li, Q.; Jia, Z.; Yang, B.; Xu, Q.; Fan, X.; Zhang, C.; Chen, N.; et al. Metabolic Engineering of Escherichia coli for High-Yield Uridine Production. Metab. Eng. 2018, 49, 248–256. [Google Scholar] [CrossRef] [PubMed]
  48. Zhang, S.; Yang, W.; Chen, H.; Liu, B.; Lin, B.; Tao, Y. Metabolic Engineering for Efficient Supply of Acetyl-CoA from Different Carbon Sources in Escherichia coli. Microb. Cell Fact. 2019, 18, 130. [Google Scholar] [CrossRef] [PubMed]
  49. Song, C.W.; Kim, D.I.; Choi, S.; Jang, J.W.; Lee, S.Y. Metabolic Engineering of Escherichia coli for the Production of Fumaric Acid. Biotechnol. Bioeng. 2013, 110, 2025–2034. [Google Scholar] [CrossRef] [PubMed]
  50. Deng, Y.; Ma, N.; Zhu, K.; Mao, Y.; Wei, X.; Zhao, Y. Balancing the Carbon Flux Distributions between the TCA Cycle and Glyoxylate Shunt to Produce Glycolate at High Yield and Titer in Escherichia coli. Metab. Eng. 2018, 46, 28–34. [Google Scholar] [CrossRef]
  51. Jantama, K.; Haupt, M.J.; Svoronos, S.A.; Zhang, X.; Moore, J.C.; Shanmugam, K.T.; Ingram, L.O. Combining Metabolic Engineering and Metabolic Evolution to Develop Nonrecombinant Strains of Escherichia coli C That Produce Succinate and Malate. Biotechnol. Bioeng. 2008, 99, 1140–1153. [Google Scholar] [CrossRef]
  52. Moon, S.Y.; Hong, S.H.; Kim, T.Y.; Lee, S.Y. Metabolic Engineering of Escherichia coli for the Production of Malic Acid. Biochem. Eng. J. 2008, 40, 312–320. [Google Scholar] [CrossRef]
  53. Dong, X.; Chen, X.; Qian, Y.; Wang, Y.; Wang, L.; Qiao, W.; Liu, L. Metabolic Engineering of Escherichia coli W3110 to Produce L-malate. Biotechnol. Bioeng. 2017, 114, 656–664. [Google Scholar] [CrossRef] [PubMed]
  54. Zha, W.; Rubin-Pitel, S.B.; Shao, Z.; Zhao, H. Improving Cellular Malonyl-CoA Level in Escherichia coli via Metabolic Engineering. Metab. Eng. 2009, 11, 192–198. [Google Scholar] [CrossRef]
  55. Chen, X.; Li, M.; Zhou, L.; Shen, W.; Algasan, G.; Fan, Y.; Wang, Z. Metabolic Engineering of Escherichia coli for Improving Shikimate Synthesis from Glucose. Bioresour. Technol. 2014, 166, 64–71. [Google Scholar] [CrossRef]
  56. Stols, L.; Donnelly, M.I. Production of Succinic Acid through Overexpression of NAD(+)-Dependent Malic Enzyme in an Escherichia coli Mutant. Appl. Environ. Microbiol. 1997, 63, 2695–2701. [Google Scholar] [CrossRef]
  57. Ebrahim, A.; Lerman, J.A.; Palsson, B.O.; Hyduke, D.R. COBRApy: COnstraints-Based Reconstruction and Analysis for Python. BMC Syst. Biol. 2013, 7, 74. [Google Scholar] [CrossRef]
  58. Cardoso, J.G.R.; Jensen, K.; Lieven, C.; Lærke Hansen, A.S.; Galkina, S.; Beber, M.; Özdemir, E.; Herrgård, M.J.; Redestig, H.; Sonnenschein, N. Cameo: A Python Library for Computer Aided Metabolic Engineering and Optimization of Cell Factories. ACS Synth. Biol. 2018, 7, 1163–1166. [Google Scholar] [CrossRef]
  59. Pedregosa, F.; Varoquaux, G.; Gramfort, A.; Michel, V.; Thirion, B.; Grisel, O.; Blondel, M.; Müller, A.; Nothman, J.; Louppe, G.; et al. Scikit-Learn: Machine Learning in Python Pedregosa, Varoquaux, Gramfort et Al. J. Mach. Learn. Res. 2011, 12, 2825–2830. [Google Scholar]
  60. Hagberg, A.A.; Schult, D.A.; Swart, P.J. Exploring Network Structure, Dynamics, and Function Using NetworkX. In Proceedings of the 7th Python in Science conference (SciPy 2008), Pasadena, CA, USA, 19–24 August 2008; Varoquaux, G., Vaught, T., Millman, J., Eds.; Los Alamos National Laboratory (LANL): Los Alamos, NM, USA, 2008; pp. 11–15. [Google Scholar]
  61. Deng, M.-D.; Severson, D.K.; Grund, A.D.; Wassink, S.L.; Burlingame, R.P.; Berry, A.; Running, J.A.; Kunesh, C.A.; Song, L.; Jerrell, T.A.; et al. Metabolic Engineering of Escherichia coli for Industrial Production of Glucosamine and N-Acetylglucosamine. Metab. Eng. 2005, 7, 201–214. [Google Scholar] [CrossRef] [PubMed]
  62. Zhou, L.; Zhu, Y.; Yuan, Z.; Liu, G.; Sun, Z.; Du, S.; Liu, H.; Li, Y.; Liu, H.; Zhou, Z. Evaluation of Metabolic Engineering Strategies on 2-Ketoisovalerate Production by Escherichia coli. Appl. Environ. Microbiol. 2022, 88, e00976-22. [Google Scholar] [CrossRef]
  63. Farmer, W.R.; Liao, J.C. Reduction of Aerobic Acetate Production by Escherichia coli. Appl. Environ. Microbiol. 1997, 63, 3205–3210. [Google Scholar] [CrossRef] [PubMed]
  64. Balderas-Hernández, V.E.; Sabido-Ramos, A.; Silva, P.; Cabrera-Valladares, N.; Hernández-Chávez, G.; Báez-Viveros, J.L.; Martínez, A.; Bolívar, F.; Gosset, G. Metabolic Engineering for Improving Anthranilate Synthesis from Glucose in Escherichia coli. Microb. Cell Fact. 2009, 8, 19. [Google Scholar] [CrossRef]
  65. Piao, X.; Wang, L.; Lin, B.; Chen, H.; Liu, W.; Tao, Y. Metabolic Engineering of Escherichia coli for Production of L-Aspartate and Its Derivative β-Alanine with High Stoichiometric Yield. Metab. Eng. 2019, 54, 244–254. [Google Scholar] [CrossRef] [PubMed]
  66. Zhang, X.; Jantama, K.; Moore, J.C.; Shanmugam, K.T.; Ingram, L.O. Production of L-Alanine by Metabolically Engineered Escherichia coli. Appl. Microbiol. Biotechnol. 2007, 77, 355–366. [Google Scholar] [CrossRef]
  67. Chang, D.-E.; Jung, H.-C.; Rhee, J.-S.; Pan, J.-G. Homofermentative Production of D- or L-Lactate in Metabolically Engineered Escherichia coli RR1. Appl. Environ. Microbiol. 1999, 65, 1384–1389. [Google Scholar] [CrossRef]
  68. Deng, Y.; Mao, Y.; Zhang, X. Metabolic Engineering of E. coli for Efficient Production of Glycolic Acid from Glucose. Biochem. Eng. J. 2015, 103, 256–262. [Google Scholar] [CrossRef]
  69. Ginesy, M.; Belotserkovsky, J.; Enman, J.; Isaksson, L.; Rova, U. Metabolic Engineering of Escherichia coli for Enhanced Arginine Biosynthesis. Microb. Cell Fact. 2015, 14, 29. [Google Scholar] [CrossRef]
  70. Liu, H.; Fang, G.; Wu, H.; Li, Z.; Ye, Q. L-Cysteine Production in Escherichia coli Based on Rational Metabolic Engineering and Modular Strategy. Biotechnol. J. 2018, 13, 1700695. [Google Scholar] [CrossRef] [PubMed]
  71. Nonaka, G.; Takumi, K. Cysteine Degradation Gene YhaM, Encoding Cysteine Desulfidase, Serves as a Genetic Engineering Target to Improve Cysteine Production in Escherichia coli. AMB Express 2017, 7, 90. [Google Scholar] [CrossRef] [PubMed]
  72. Liu, H.; Hou, Y.; Wang, Y.; Li, Z. Enhancement of Sulfur Conversion Rate in the Production of L-Cysteine by Engineered Escherichia coli. J. Agric. Food Chem. 2020, 68, 250–257. [Google Scholar] [CrossRef]
  73. Wu, H.; Tian, D.; Fan, X.; Fan, W.; Zhang, Y.; Jiang, S.; Wen, C.; Ma, Q.; Chen, N.; Xie, X. Highly Efficient Production of L-Histidine from Glucose by Metabolically Engineered Escherichia coli. ACS Synth. Biol. 2020, 9, 1813–1822. [Google Scholar] [CrossRef] [PubMed]
  74. Park, J.H.; Oh, J.E.; Lee, K.H.; Kim, J.Y.; Lee, S.Y. Rational Design of Escherichia coli for L-Isoleucine Production. ACS Synth. Biol. 2012, 1, 532–540. [Google Scholar] [CrossRef] [PubMed]
  75. Huang, J.-F.; Liu, Z.-Q.; Jin, L.-Q.; Tang, X.-L.; Shen, Z.-Y.; Yin, H.-H.; Zheng, Y.-G. Metabolic Engineering of Escherichia coli for Microbial Production of L-Methionine. Biotechnol. Bioeng. 2017, 114, 843–851. [Google Scholar] [CrossRef] [PubMed]
  76. Yakandawala, N.; Romeo, T.; Friesen, A.D.; Madhyastha, S. Metabolic Engineering of Escherichia coli to Enhance Phenylalanine Production. Appl. Microbiol. Biotechnol. 2008, 78, 283–291. [Google Scholar] [CrossRef] [PubMed]
  77. Báez-Viveros, J.L.; Osuna, J.; Hernández-Chávez, G.; Soberón, X.; Bolívar, F.; Gosset, G. Metabolic Engineering and Protein Directed Evolution Increase the Yield of L-phenylalanine Synthesized from Glucose in Escherichia coli. Biotechnol. Bioeng. 2004, 87, 516–524. [Google Scholar] [CrossRef] [PubMed]
  78. Zhang, Y.; Kang, P.; Liu, S.; Zhao, Y.; Wang, Z.; Chen, T. GlyA Gene Knock-out in Escherichia coli Enhances L-Serine Production without Glycine Addition. Biotechnol. Bioprocess Eng. 2017, 22, 390–396. [Google Scholar] [CrossRef]
  79. Wang, C.; Wu, J.; Shi, B.; Shi, J.; Zhao, Z. Improving L-Serine Formation by Escherichia coli by Reduced Uptake of Produced l-Serine. Microb. Cell Fact. 2020, 19, 66. [Google Scholar] [CrossRef] [PubMed]
  80. Mundhada, H.; Seoane, J.M.; Schneider, K.; Koza, A.; Christensen, H.B.; Klein, T.; Phaneuf, P.V.; Herrgard, M.; Feist, A.M.; Nielsen, A.T. Increased Production of L-Serine in Escherichia coli through Adaptive Laboratory Evolution. Metab. Eng. 2017, 39, 141–150. [Google Scholar] [CrossRef] [PubMed]
  81. Tran, K.-N.T.; Eom, G.T.; Hong, S.H. Improving L-Serine Production in Escherichia coli via Synthetic Protein Scaffold of SerB, SerC, and EamA. Biochem. Eng. J. 2019, 148, 138–142. [Google Scholar] [CrossRef]
  82. Lee, K.H.; Park, J.H.; Kim, T.Y.; Kim, H.U.; Lee, S.Y. Systems Metabolic Engineering of Escherichia coli for L-threonine Production. Mol. Syst. Biol. 2007, 3, 149. [Google Scholar] [CrossRef]
  83. Dong, X.; Quinn, P.J.; Wang, X. Metabolic Engineering of Escherichia coli and Corynebacterium Glutamicum for the Production of L-Threonine. Biotechnol. Adv. 2011, 29, 11–23. [Google Scholar] [CrossRef] [PubMed]
  84. Lee, J.H.; Sung, B.H.; Kim, M.S.; Blattner, F.R.; Yoon, B.H.; Kim, J.H.; Kim, S.C. Metabolic Engineering of a Reduced-Genome Strain of Escherichia coli for L-Threonine Production. Microb. Cell Fact. 2009, 8, 2. [Google Scholar] [CrossRef] [PubMed]
  85. Park, J.H.; Lee, K.H.; Kim, T.Y.; Lee, S.Y. Metabolic Engineering of Escherichia coli for the Production of L-Valine Based on Transcriptome Analysis and in Silico Gene Knockout Simulation. Proc. Natl. Acad. Sci. USA 2007, 104, 7797–7802. [Google Scholar] [CrossRef] [PubMed]
  86. Qian, Z.; Xia, X.; Lee, S.Y. Metabolic Engineering of Escherichia coli for the Production of Putrescine: A Four Carbon Diamine. Biotechnol. Bioeng. 2009, 104, 651–662. [Google Scholar] [CrossRef] [PubMed]
  87. Moxley, W.C.; Eiteman, M.A. Pyruvate Production by Escherichia coli by Use of Pyruvate Dehydrogenase Variants. Appl. Environ. Microbiol. 2021, 87, e00487-21. [Google Scholar] [CrossRef]
  88. Thakker, C.; Martínez, I.; San, K.; Bennett, G.N. Succinate Production in Escherichia coli. Biotechnol. J. 2012, 7, 213–224. [Google Scholar] [CrossRef] [PubMed]
  89. Lin, H.; Bennett, G.N.; San, K.-Y. Metabolic Engineering of Aerobic Succinate Production Systems in Escherichia coli to Improve Process Productivity and Achieve the Maximum Theoretical Succinate Yield. Metab. Eng. 2005, 7, 116–127. [Google Scholar] [CrossRef] [PubMed]
  90. Lee, S.J.; Lee, D.-Y.; Kim, T.Y.; Kim, B.H.; Lee, J.; Lee, S.Y. Metabolic Engineering of Escherichia coli for Enhanced Production of Succinic Acid, Based on Genome Comparison and in Silico Gene Knockout Simulation. Appl. Environ. Microbiol. 2005, 71, 7880–7887. [Google Scholar] [CrossRef]
  91. Heirendt, L.; Arreckx, S.; Pfau, T.; Mendoza, S.N.; Richelle, A.; Heinken, A.; Haraldsdóttir, H.S.; Wachowiak, J.; Keating, S.M.; Vlasov, V.; et al. Creation and Analysis of Biochemical Constraint-Based Models Using the COBRA Toolbox v.3.0. Nat. Protoc. 2019, 14, 639–702. [Google Scholar] [CrossRef]
  92. Hartline, C.J.; Schmitz, A.C.; Han, Y.; Zhang, F. Dynamic Control in Metabolic Engineering: Theories, Tools, and Applications. Metab. Eng. 2021, 63, 126–140. [Google Scholar] [CrossRef]
  93. D’Ambrosio, B. Fuzzy Logic Control. In Qualitative Process Theory Using Linguistic Variables; Springer: New York, NY, USA, 1989; pp. 5–15. [Google Scholar]
  94. Burgard, A.P.; Nikolaev, E.V.; Schilling, C.H.; Maranas, C.D. Flux Coupling Analysis of Genome-Scale Metabolic Network Reconstructions. Genome Res. 2004, 14, 301–312. [Google Scholar] [CrossRef] [PubMed]
  95. Bundy, A.; Wallen, L. Breadth-First Search. In Catalogue of Artificial Intelligence Tools; Springer: Berlin/Heidelberg, Germany, 1984; p. 13. [Google Scholar]
  96. Westers, H. Genome Engineering Reveals Large Dispensable Regions in Bacillus Subtilis. Mol. Biol. Evol. 2003, 20, 2076–2090. [Google Scholar] [CrossRef]
  97. Kakuda, H.; Hosono, K.; Shiroishi, K.; Ichihara, S. Identification and Characterization of the AckA (Acetate Kinase A)-Pta (Phosphotransacetylase) Operon and Complementation Analysis of Acetate Utilization by an AckA-Pta Deletion Mutant of Escherichia coli. J. Biochem. 1994, 116, 916–922. [Google Scholar] [CrossRef] [PubMed]
  98. Ball, E. Heteroauxin and the Growth of Escherichia coli. J. Bacteriol. 1938, 36, 559–565. [Google Scholar] [CrossRef] [PubMed]
  99. Henry, C.S.; Broadbelt, L.J.; Hatzimanikatis, V. Thermodynamics-Based Metabolic Flux Analysis. Biophys. J. 2007, 92, 1792–1805. [Google Scholar] [CrossRef] [PubMed]
  100. Yang, Y.; Su, X.; Zhao, B.; Li, G.; Hu, P.; Zhang, J.; Hu, L. Fuzzy-Based Deep Attributed Graph Clustering. IEEE Trans. Fuzzy Syst. 2024, 32, 1951–1964. [Google Scholar] [CrossRef]
  101. Bologna, F.P.; Campos-Bermudez, V.A.; Saavedra, D.D.; Andreo, C.S.; Drincovich, M.F. Characterization of Escherichia coli EutD: A Phosphotransacetylase of the Ethanolamine Operon. J. Microbiol. 2010, 48, 629–636. [Google Scholar] [CrossRef] [PubMed]
  102. Kim, J.; Flood, J.J.; Kristofich, M.R.; Gidfar, C.; Morgenthaler, A.B.; Fuhrer, T.; Sauer, U.; Snyder, D.; Cooper, V.S.; Ebmeier, C.C.; et al. Hidden Resources in the Escherichia coli Genome Restore PLP Synthesis and Robust Growth after Deletion of the Essential Gene PdxB. Proc. Natl. Acad. Sci. USA 2019, 116, 24164–24173. [Google Scholar] [CrossRef] [PubMed]
  103. Zhu, J.; Yang, W.; Wang, B.; Liu, Q.; Zhong, X.; Gao, Q.; Liu, J.; Huang, J.; Lin, B.; Tao, Y. Metabolic Engineering of Escherichia coli for Efficient Production of L-Alanyl-l-Glutamine. Microb. Cell Fact. 2020, 19, 129. [Google Scholar] [CrossRef]
  104. Causey, T.B.; Shanmugam, K.T.; Yomano, L.P.; Ingram, L.O. Engineering Escherichia coli for Efficient Conversion of Glucose to Pyruvate. Proc. Natl. Acad. Sci. USA 2004, 101, 2235–2240. [Google Scholar] [CrossRef]
  105. Sarkar, D.; Siddiquee, K.A.Z.; Araúzo-Bravo, M.J.; Oba, T.; Shimizu, K. Effect of Cra Gene Knockout Together with Edd and IclR Genes Knockout on the Metabolism in Escherichia coli. Arch. Microbiol. 2008, 190, 559–571. [Google Scholar] [CrossRef] [PubMed]
  106. Ba, F.; Ji, X.; Huang, S.; Zhang, Y.; Liu, W.; Liu, Y.; Ling, S.; Li, J. Engineering Escherichia coli to Utilize Erythritol as Sole Carbon Source. Adv. Sci. 2023, 10, 2207008. [Google Scholar] [CrossRef] [PubMed]
  107. Carbonell, P.; Delépine, B.; Faulon, J.-L. Extended Metabolic Space Modeling. In Synthetic Metabolic Pathways: Methods and Protocols; Springer: Berlin/Heidelberg, Germany, 2018; pp. 83–96. [Google Scholar]
  108. Faust, K.; Croes, D.; van Helden, J. Metabolic Pathfinding Using RPAIR Annotation. J. Mol. Biol. 2009, 388, 390–414. [Google Scholar] [CrossRef] [PubMed]
  109. Tarasava, K.; Lee, S.H.; Chen, J.; Köpke, M.; Jewett, M.C.; Gonzalez, R. Reverse β-Oxidation Pathways for Efficient Chemical Production. J. Ind. Microbiol. Biotechnol. 2022, 49, kuac003. [Google Scholar] [CrossRef] [PubMed]
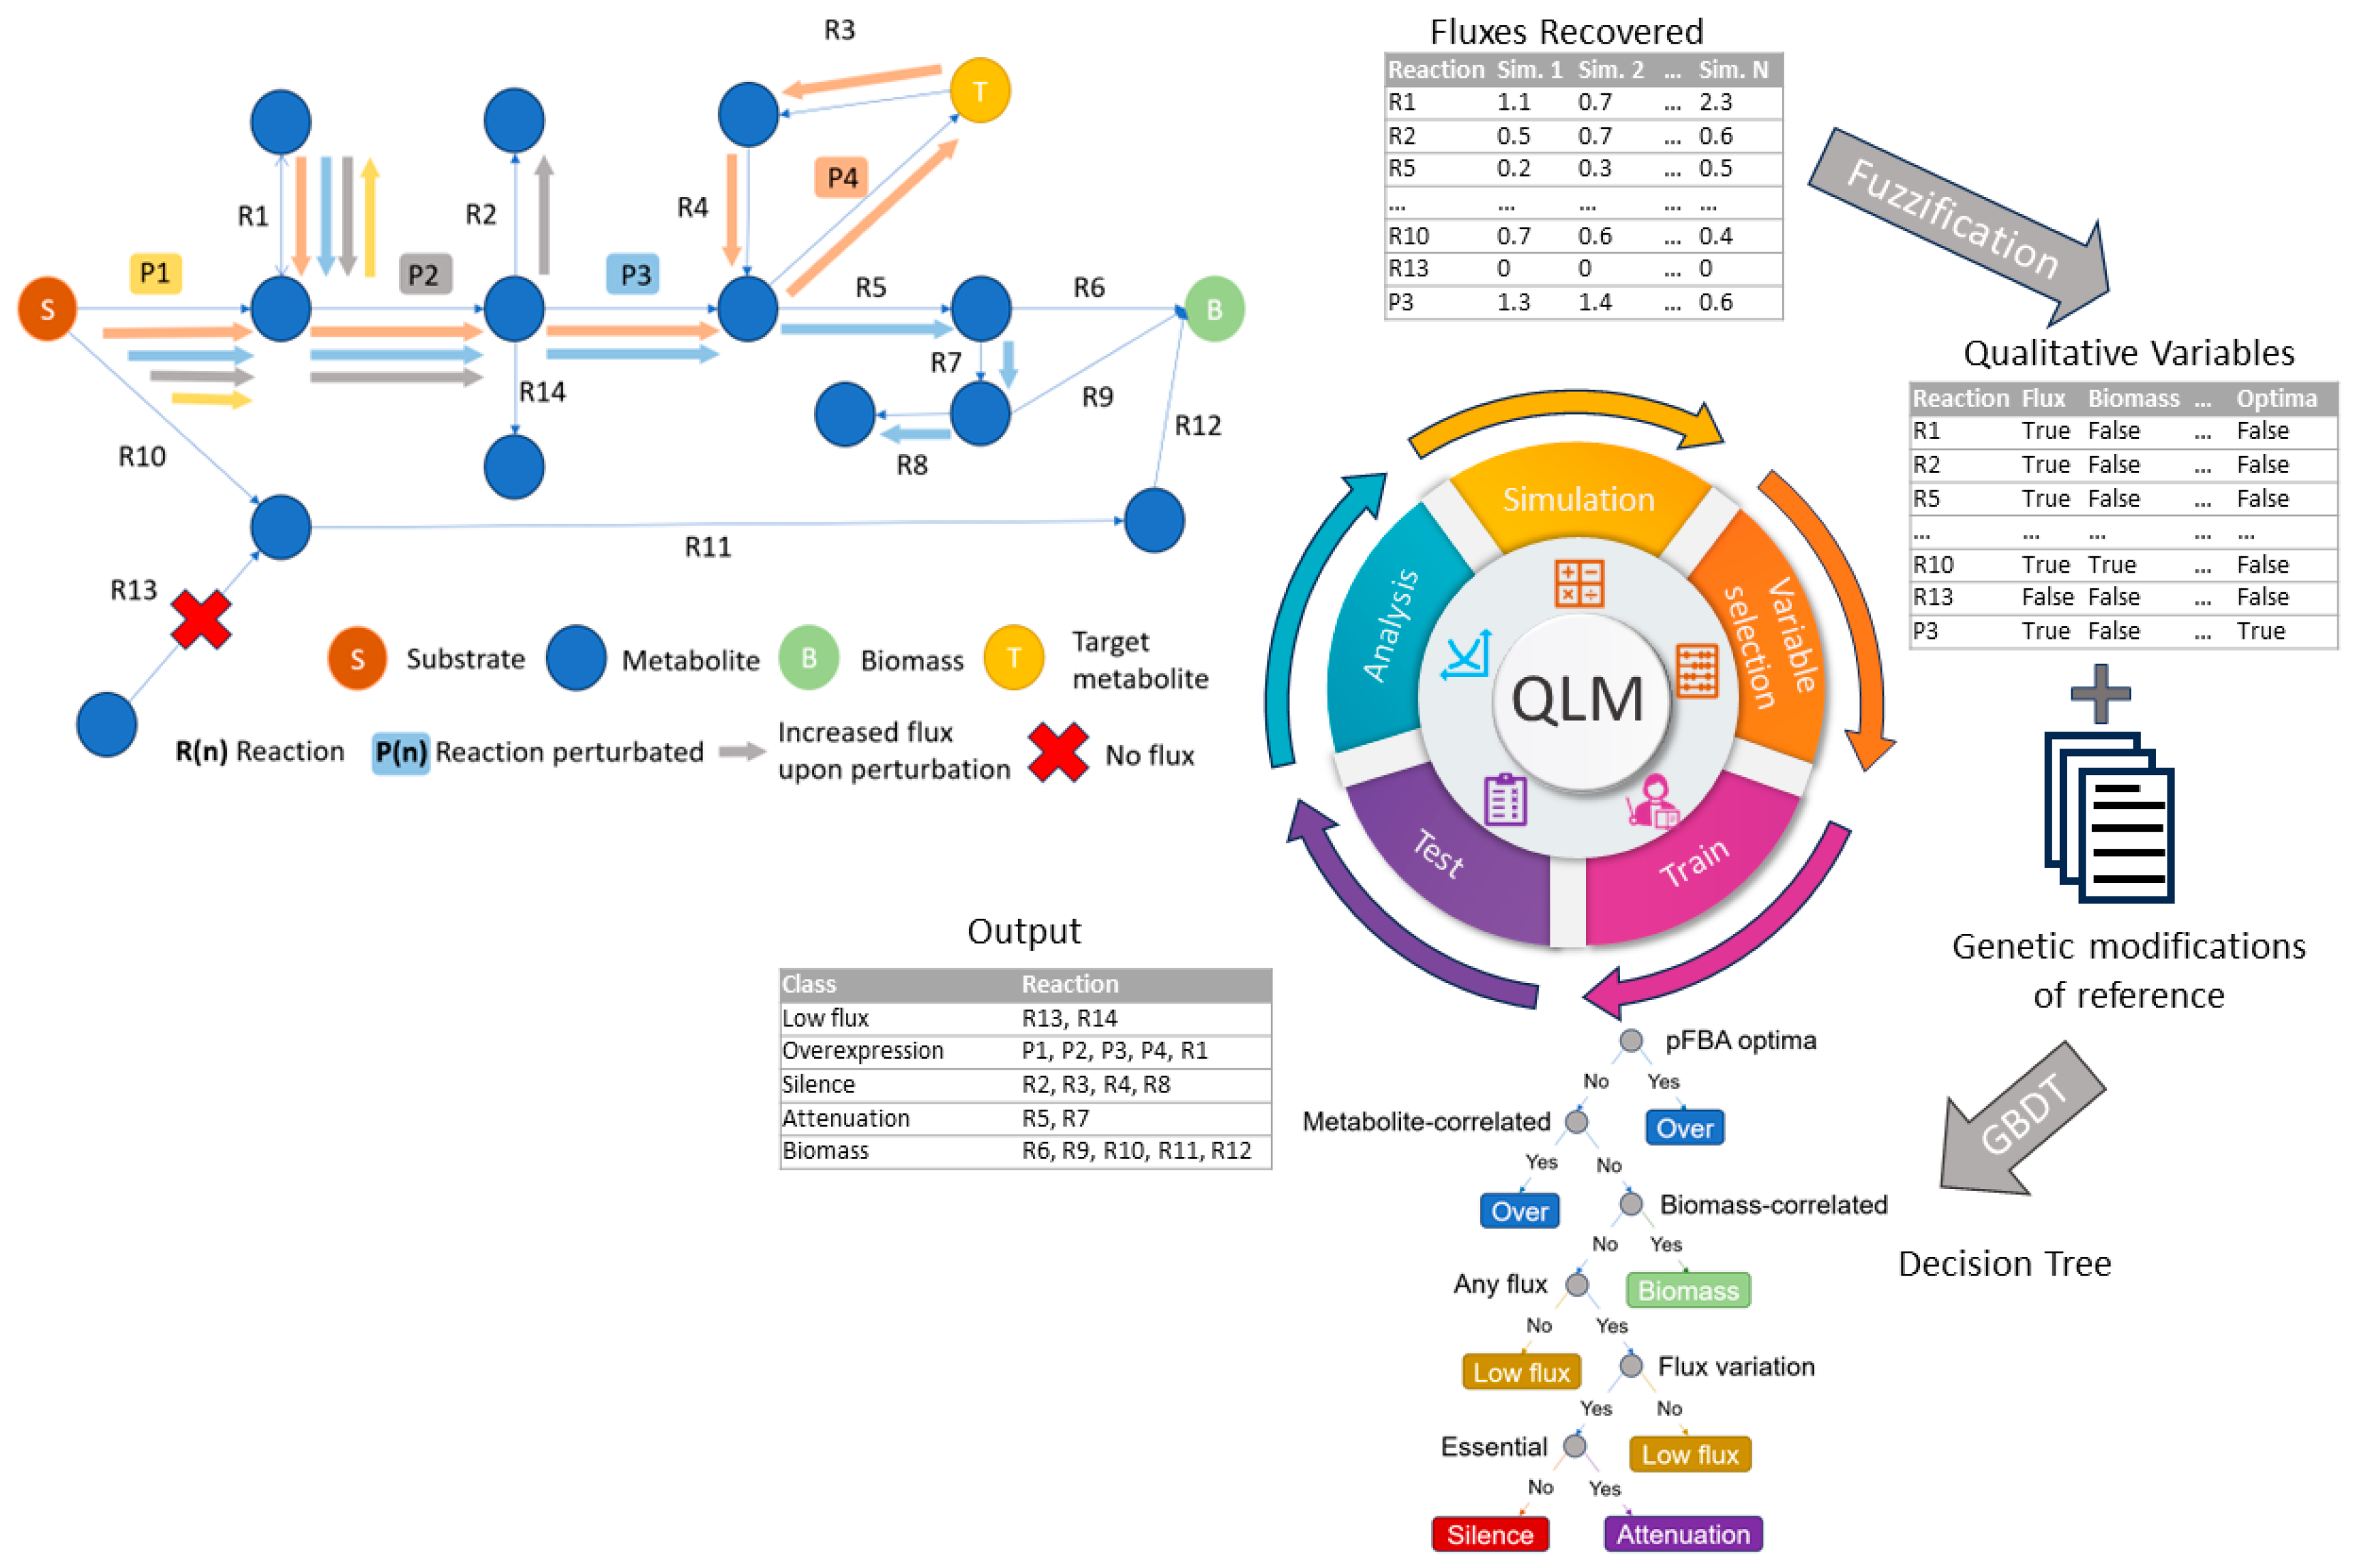
Figure 1. Workflow used to build the QPAML model. First, the pFBA algorithm identifies 76 core reactions to produce tryptophan (T) from glucose (S), represented by the orange line fluxes in the figure. The FSEOF algorithm was then applied to the GEM after increasing the flux in each of the 76 enzymatic reactions to perturb them, as shown in the figure represented by P1-P4. The colored arrows represent the directions of fluxes and whether they increase flux to the main path for tryptophan synthesis and biomass or deviate from it to lateral reactions. The color of the arrows indicates the distribution of fluxes for perturbations P1 (yellow), P2 (gray), P3 (blue), and P4 (orange). Some lateral reactions are activated to compensate for the perturbations and maintain the cell’s growth state (B). The modified FSEOF algorithm generates a table with ten flux values for each of the 76 perturbations. These fluxes are converted into qualitative variables (see Section 2.10) to create a QLM. The GBDT is then trained with the selected qualitative variables and experimental evidence to assign a role in tryptophan production for each enzymatic reaction of GEM. The cycle is stopped if the model categorizes all the literature reactions correctly and no more variables are defined. Otherwise, another cycle is started by selecting new variables. Reactions with a cross symbolize no metabolic flux due to insufficient substrates or stoichiometric unfavourability. Reactions R3 and R4 represent salvage pathways, while R10–R12, R6, and R9 represent reactions unaffected by the production of the target metabolite but are crucial for biomass production. Lastly, reaction R2 represents a competing pathway for tryptophan production.
Algorithms 17 00282 g001
Figure 2. The pFBA identified 76 optima reactions as the shorter pathway with the minimal number of reactions to produce tryptophan from glucose in the iML1515a GEM. Rectangles highlight the reactions, with color codes indicating the associated pathway: glycolysis (orange), the Krebs cycle (green), the non-oxidative (purple) and oxidative (light blue) phases of the pentose phosphate pathway, glutamine (pink), L-serine (brown), shikimate (gray), chorismate (yellow), L-tryptophan (red), and others (white). The abbreviations in the figure are as follows: D-fructose 6-phosphate (F6P), D-fructose 1,6-biphosphate (F1,6BP), glyceraldehyde 3-phosphate (G3P), dihydroxyacetone phosphate (DHAP), 3-Phospho-D-glyceroyl phosphate (1,3DPG), 3-Phospho-D-glycerate (3PG), D-Glycerate 2-phosphate (2PG), phosphoenolpyruvate (PEP), 2-oxoglutarate (AKG), succinyl-CoA (Suc-CoA), oxaloacetate (OAA), D-glucose 6-phosphate (G6P), 6-phospho-D-glucono-1,5-lactone (6PGL), 6-Phospho-D-gluconate (6PG), D-Ribulose 5-phosphate (Ru5P), D-xylulose 5-phosphate (Xu5P), α-D-ribose 5-phosphate (R5P), D-erythrose 4-phosphate (E4P), sedoheptulose 7-phosphate (SH7P), sedoheptulose 1,7-bisphosphate (S1,7BP), 5-phospho-alpha-D-ribose 1-diphosphate (PRPP), 3-phosphohydroxypyruvate (3PHP), O-phospho-L-serine (SOP), 2-dehydro-3-deoxy-D-arabino-heptonate 7-phosphate (DAHP), 3-dehydroquinate (DHQ), 3-dehydroshikimate (DHS), shikimate 5-phosphate (S5P), 5-O-(1-carboxyvinyl)-3-phosphoshikimate (CVPS), N-(5-phospho-D-ribosyl)anthranilate (PRAI), 1-(2-carboxyphenylamino)-1-deoxy-D-ribulose 5-phosphate (CDRP), C′-(3-indolyl)-glycerol 3-phosphate (IGP), xylose isomerase (XYLI2), hexokinase (HEX7), phosphofructokinase (PFK), phosphoglycerate mutase (PGM), enolase (ENO), phosphoenolpyruvate synthase (PPS), pyruvate dehydrogenase (PDH), citrate synthase (CS), aconitase A (ACONTa), aconitase B (ACONTb), isocitrate dehydrogenase (ICDHyr), 2-oxogluterate dehydrogenase (AKGDH), succinyl-CoA synthetase (SUCOAS), succinate dehydrogenase (SUCDi), fumarase (FUM), malate dehydrogenase (MDH), glucose-6-phosphate isomerase (PGI), fructose-bisphosphate aldolase (FBA), triose-phosphate isomerase (TPI), glucose 6-phosphate dehydrogenase (G6PDH2r), 6-phosphogluconolactonase (PGL), phosphogluconate dehydrogenase (GND), ribose-5-phosphate isomerase (RPI), ribulose 5-phosphate 3-epimerase (RPE), transketolase 1 (TKT1), transketolase 2 (TKT2), sedoheptulose 1,7-bisphosphate D-glyceraldehyde-3-phosphate-lyase (FBA3), phosphofructokinase (SH7P) (PFK_3), glutamate dehydrogenase (GLUDy), glutamine synthetase (GLNS), phosphoribosylpyrophosphate synthetase (PRPPS), phosphoglycerate dehydrogenase (PGCD), phosphoserine transaminase (PSERT), phosphoserine phosphatase (PSP_L), 3-deoxy-D-arabino-heptulosonate 7-phosphate synthetase (DDPA), 3-dehydroquinate synthase (DHQS), 3-dehydroquinate dehydratase (DHQTi), shikimate dehydrogenase (SHK3Dr), shikimate kinase (SHKK), 3-phosphoshikimate 1-carboxyvinyltransferase (PSCVT), chorismate synthase (CHORS), anthranilate synthase (ANS), anthranilate phosphoribosyltransferase (ANPRT), phosphoribosylanthranilate isomerase (PRAIi), indole-3-glycerol-phosphate synthase (IGPS), tryptophan synthase (IGP) (TRPS3), and tryptophan synthase (indole) (TRPS2).
Algorithms 17 00282 g002
Figure 3. Comparison of QPAML and FSEOF performance in predicting 27 overexpressed reactions validated for tryptophan production. The bottom blue circle represents the 27 experimentally validated overexpressed reactions; the light salmon circle represents the FASEOF predictions; and the green circle represents the QPAML predictions. The number in the intersections represents the shared predictions concerning the experimentally validated reactions.
Algorithms 17 00282 g003
Figure 4. The relative importance of qualitative variables for the QPAML classification model. The charts delineate the relative importance of variables within the trained classification model; variables with higher scores contribute more significantly to the model’s decision-making process, indicating a more significant influence on predictions. Conversely, variables with lower scores have a diminished impact. It is important to note that the collective importance of all variables governs the final classification of the model. The sum of these scores is normalized to 100.0%, providing a relative measure of each variable’s contribution to the overall model: (a) Illustrates the relative importance of each variable within the trained model. (b) Presents a cumulative representation of these variables.
Algorithms 17 00282 g004
Figure 5. Classification of reactions based on their effect on tryptophan production. Blue bars delineate the number of reactions predicted by the model, whereas yellow bars signify reactions supported by experimental evidence.
Algorithms 17 00282 g005
Figure 6. Confusion Matrix of Classified Reactions. The references pertain to genetic modifications in E. coli documented in the literature to enhance the production of 31 metabolites. In contrast, predicted modifications denote classifications derived from the QPAML model. In the matrix, the diagonal signifies the correctly classified reactions, the horizontal misclassified elements indicate false positives, and the vertically misclassified components represent false negatives.
Algorithms 17 00282 g006
Figure 7. Distribution of reaction steps based on their distance from the pFBA optimal path. The X-axis represents the shortest path length from reactions categorized for disruption (knockout and knockdown) to pFBA optima reactions. Blue bars depict reactions categorized for knockout, yellow bars represent target reactions for knockdown, and orange bars represent reactions with experimental evidence.
Algorithms 17 00282 g007
Figure 8. Quantification of IAA Production in Keio Mutants. Blue bars denote IAA production levels in strains containing the empty pCold vector as a control. In contrast, red bars signify IAA production in strains transformed with the pIAAMHs plasmid. Asterisks represent statistical significance (** p < 0.01 and *** p < 0.001).
Algorithms 17 00282 g008
Table 1. Bacterial strains and plasmid used in this study.
NameDescriptionReference
Strain
BW25113 *Δ(araD-araB)567, ΔlacZ4787(::rrnB-3), λ-, rph-1, Δ(rhaD-rhaB)568, hsdR514[20]
JW0855-1F-, Δ(araD-araB)567, ΔlacZ4787(::rrnB-3), λ-, ΔpoxB772::kan, rph-1, Δ(rhaD-rhaB)568, hsdR514[20]
JW3179-3F-, Δ(araD-araB)567, ΔlacZ4787(::rrnB-3), λ-, ΔgltB740::kan, rph-1, Δ(rhaD-rhaB)568, hsdR514[20]
JW1843-2F-, Δ(araD-araB)567, ΔlacZ4787(::rrnB-3), λ-, ΔpykA779::kan, rph-1, Δ(rhaD-rhaB)568, hsdR514[20]
JW1666-3F-, Δ(araD-araB)567, ΔlacZ4787(::rrnB-3), λ-, ΔpykF751::kan, rph-1, Δ(rhaD-rhaB)568, hsdR514[20]
JW5806-1F-, Δ(araD-araB)567, ΔlacZ4787(::rrnB-3), λ-, ΔtdcD731::kan, rph-1, Δ(rhaD-rhaB)568, hsdR514[20]
JW2293-1F-, Δ(araD-araB)567, ΔlacZ4787(::rrnB-3), λ-, ΔackA778::kan, rph-1, Δ(rhaD-rhaB)568, hsdR514[20]
JW2581-1F-, Δ(araD-araB)567, ΔlacZ4787(::rrnB-3), λ-, ΔtyrA763::kan, rph-1, Δ(rhaD-rhaB)568, hsdR514[20]
JW2580-1F-, Δ(araD-araB)567, ΔlacZ4787(::rrnB-3), λ-, ΔpheA762::kan, rph-1, Δ(rhaD-rhaB)568, hsdR514[20]
JW3686-7F-, Δ(araD-araB)567, ΔlacZ4787(::rrnB-3), λ-, rph-1, ΔtnaA739::kan, Δ(rhaD-rhaB)568, hsdR514[20]
JW5619-1F-, Δ(araD-araB)567, ΔlacZ4787(::rrnB-3), λ-, rph-1, ΔtnaB740::kan, Δ(rhaD-rhaB)568, hsdR514[20]
JW3130-1F-, Δ(araD-araB)567, ΔlacZ4787(::rrnB-3), λ-, Δmtr-773::kan, rph-1, Δ(rhaD-rhaB)568, hsdR514[20]
Plasmids
pCold IVAmpr Cold Shock Expression SystemTakara Bio Inc., San Jose, CA, USA
pIAAMHspCold IV derivative; iaaMHBiological engineering laboratory
* Parental strain.
Table 2. Table relating relationships with qualitative variables.
ReactionNumber of RelationshipsQualitative
Variable
PositiveNegativeNo RelationNo Clear
R174020Metabolite-correlated
R200760No flux
R307600Possible
Biomass-correlated
R4234940Negatively
metabolite-correlated
R500742Flux variation
Table 3. Reactions classified for disruption related to tryptophan precursors.
ReactionEnzymeL-Tryptophan PrecursorReference
GHMT2rGlycine hydroxymethyltransferaseL-serine[78,79,80]
SERD_LL-serine deaminaseL-serine[5,78,79,80]
HPYRP3-phosphohydroxypyruvate phosphataseL-serine[102]
GLUNGlutaminaseL-glutamine[103]
ICLIsocitrate lyaseL-glutamate (L-proline)[45]
FRD2Fumarate reductaseL-glutamate (L-alanine)[66]
FRD3Fumarate reductaseL-glutamate (L-alanine)[66]
MGSAMethylglyoxal synthaseL-glutamate (L-alanine)[66]
ACALDAcetaldehyde dehydrogenaseL-glutamate (L-alanine)[66]
LDH_DD-lactate dehydrogenaseL-glutamate (L-alanine)[66]
PFLPyruvate formate lyasePyruvate[104]
EDD6-phosphogluconate dehydratasePhosphoenolpyruvate[105]
F6PAFructose 6-phosphate aldolasePhosphoenolpyruvate[105]
TALATransaldolaseD-erythrose-4-phosphate[106]
Disclaimer/Publisher’s Note: The statements, opinions and data contained in all publications are solely those of the individual author(s) and contributor(s) and not of MDPI and/or the editor(s). MDPI and/or the editor(s) disclaim responsibility for any injury to people or property resulting from any ideas, methods, instructions or products referred to in the content.