Abstract
The simultaneous estimation of multiple quantiles is a crucial statistical task that enables a thorough understanding of data distribution for robust analysis and decision-making. In this study, we adopt a Bayesian approach to tackle this critical task, employing the asymmetric Laplace distribution (ALD) as a flexible framework for quantile modeling. Our methodology implementation involves the Hamiltonian Monte Carlo (HMC) algorithm, building on the foundation laid in prior work, where the error term is assumed to follow an ALD. Capitalizing on the interplay between two distinct quantiles of this distribution, we endorse a straightforward and fully Bayesian method that adheres to the non-crossing property of quantiles. Illustrated through simulated scenarios, we showcase the effectiveness of our approach in quantile estimation, enhancing precision via the HMC algorithm. The proposed method proves versatile, finding application in finance, environmental science, healthcare, and manufacturing, and contributing to sustainable development goals by fostering innovation and enhancing decision-making in diverse fields.
1. Introduction
Quantile regression, which is garnering increased attention from both theoretical and empirical perspectives [1,2,3,4,5], serves as a statistical cornerstone for modeling the intricate relationship between a set of predictor variables and a response variable [6,7]. This method excels in estimating the conditional quantiles of the response variable, going beyond conventional mean estimation. By shedding light on the varying impacts of predictor variables across different segments of a distribution, quantile regression offers a nuanced understanding of complex relationships in data analysis. As researchers delve into unraveling the intricacies of variable interplay, the application of quantile regression emerges as an invaluable approach for capturing and interpreting diverse patterns. For instance, we can enumerate examples in various fields such as the economy [8,9], ecology [10], epidemiology [11], survival analysis [12], and environmental economics [13,14]. Furthermore, quantile regression is a form of statistical and econometric regression analysis that adds a particular method to estimating families of conditional quantile functions and supplements the exclusive focus of least squares techniques based on the estimation of conditional mean functions [15]. Originating from the seminal work of [16], quantile regression introduces a versatile method for estimating conditional quantiles.
The authors demonstrated that any linear quantile of order could be derived from minimizing a check function, , where represents the indicator function. In exclusively linear regression models, Koenker et al. [16] suggest a straightforward method to estimating conditional quantiles, consider the regression linear normal model, as the solution of the minimization problem that follows:
where denote a sequence of (row), is the transposed of , K-vector of a known design matrix, and are a random sample on the regression process having distribution function F. Then, the -th sample quantile, , may be defined as any solution of the minimization problem (1).
In the framework of statistical research, Bayesian approaches have emerged as effective tools for investigating quantile regression [17,18,19,20] after the notable developments presented in [21]. The authors utilize a likelihood function grounded in the asymmetric distribution of Laplace to advance the understanding of quantile regression. While both frequentist and Bayesian perspectives prove suitable for examining individual quantiles [22], the complexities of real-world applications often demand more nuanced exploration. To intricately capture the relationship between the response variable and explanatory variables, it becomes imperative to estimate regression quantiles at various orders. Although it is conceivable to perform separate estimations for these quantiles, this approach proves unsatisfactory; particularly in scenarios involving multiple explanatory variables, it provides estimators that do not respect the property of the non-crossing of the regression quantiles.
To circumvent this limitation, a more favorable approach involves the simultaneous estimation of multiple regression quantiles [23,24,25,26]. This ensures a coherent and consistent estimation procedure, particularly in situations characterized by the presence of multiple explanatory variables.
In pursuit of refining the Bayesian quantile estimation paradigm, this article directs its attention to the groundwork laid by Merhi Bleik in the seminal work presented in [27]. The author’s utilization of the Metropolis–Hastings within Gibbs algorithm proved instrumental in sampling unknown parameters from their full conditional distribution, offering a new methodological framework. The proposed estimation procedure, SBQR, for simultaneous Bayesian quantile regression, as presented in [27], guarantees the fundamental property of non-crossing, under the assumption that the Asymmetric Laplace distribution (ALD) is the underlying data distribution. In extending and enhancing this foundational approach, our primary objective is to present a unified computational methodology. This methodology is designed to facilitate the simultaneous estimation of regression quantiles, employing the advanced Hamiltonian Monte Carlo (HMC) algorithm. Building on the achievements of [27], our proposed methodology aims to overcome potential limitations and further streamline the quantile estimation process. By integrating the HMC algorithm, we seek to harness its efficiency in exploring parameter spaces, thus enhancing the precision of quantile estimates. To evaluate the performance of our algorithm, we compare the mean of the Bayesian estimators with the theoretical quantile values using the root mean square error. For this reason, our objective is to simultaneously estimate the Bayesian regression quantile using the HMC algorithm. The main contributions of the paper are then the following:
- Conduct a simultaneous quantile estimation embedded with the HMC algorithm through Bayesian inference;
- Conduct a sensitivity analysis on the performance of the HMC algorithm in handling univariate linear quantiles and multivariate linear quantiles.
This article serves as a comprehensive guide to the unified computational framework, providing researchers and practitioners with a robust tool for simultaneous regression quantile estimation. By addressing challenges associated with multiple quantile modeling in a cohesive manner, our methodology proves versatile across diverse fields when used with ALD data. Notably, applications in finance, where risk assessment demands a nuanced understanding of the distribution, benefit from the precision offered by simultaneous regression quantile estimation. In environmental science, the ability to capture extreme events accurately is crucial, while in healthcare, predicting patient outcomes relies on a comprehensive grasp of varying response scenarios. Additionally, in manufacturing, ensuring quality control is facilitated by an in-depth understanding of distributional patterns. This versatility aligns with the broader societal goals, contributing to Sustainable Development Goal 9: Industry, Innovation, and Infrastructure. By fostering innovation in statistical methodologies and decision-making processes, our approach seeks to enhance the well-being of societies and align with broader sustainability objectives.
This paper introduces a novel approach by combining existing research with the innovative application of the HMC algorithm to simultaneous quantile estimation, offering significant advancements in the field. The paper is organized as follows: The ALD and its Gaussian mixture are presented in Section 2, in addition to the method proposed by the author in [27] for simultaneous Bayesian quantiles. A brief overview of HMC is presented in Section 3. The performance of the HMC algorithm is examined in cases of univariate linear quantiles and multivariate linear quantiles on a simulated data set in Section 4. Finally, Section 5 highlights the paper’s contributions and provides a discussion of perspectives.
2. Simultaneous Quantile Regression
2.1. Asymmetric Laplace Distribution
The ALD is a probability distribution that is used to model data with asymmetric tails and skewness. It is a continuous probability distribution defined on the real line. The distribution is characterized by three parameters: location, scale, and skewness parameters. Indeed, the ALD is often used in Bayesian statistics, particularly in the context of Bayesian regression models that involve quantile regression.
A random variable U follows an ALD(, , ) if its probability density is given by
where is the skew parameter, is the scale parameter, and is the location parameter. The mean and variance of the ALD with density (2) are
Some other ALD properties can be found in [28]. In order to simplify the posterior inference of the quantiles, it is convenient to use the location scale mixture representation. In particular, we are obliged to use it in HMC because ALD is not differentiable and to calculate the full conditional distributions (for more details, see [20]). The location-scale mixture of the ALD distribution will be used. Let be an exponential latent variable with parameter denoted by and let Z be a standard normal variable so that and Z are independent, then has the following representation:
where and .
2.2. Regression Quantile
We begin with a fundamental definition of sample quantiles, a concept readily extended to the linear regression model without the typical need for an ordered set of sample observations. Consider the set of independent and identically distributed (i.i.d.) observations on a random variable Y governed by the distribution function F. The -th sample quantile, where , can then be characterized as any solution to the minimization problem:
where is the check loss function, defined as
Equivalently, we may write the minimization problem as
Huber et al. [29] observed the difficulty in identifying outliers within the context of regression, emphasizing the inherent confusion in extending standard notions of sample quantiles to linear models based on the ordering of sample observations. This confusion is effectively addressed by a direct generalization of the earlier-described minimization problem. Consider a sequence of k-vectors from a known design matrix denoted by . Assume that constitutes a random sample from the regression process, where follows a distribution function F such that . The -th quantile of the linear regression model, with , is defined as any solution to the minimization problem:
2.3. Bayesian Linear Quantile Regression
Consider the following quantile regression model:
We assume that the error and are independent, and , F is unknown, but . Hence, denotes the -th quantile of . For all , suppose the relationship between and could be modeled as , where is a vector with unknown interest parameters. From i.i.d issued from the model defined in Equation (5), we are interested in estimating quantiles of the law via the Bayesian approach. It then suffices to estimate .
If F is unknown, the likelihood is not available, but the Bayesian approach requires some likelihood; hence, we use the “working likelihood” defined as the ALD:
where and is as defined in (3). The -th quantile of this distribution is zero; hence, the pseudo posterior is
Equation (6) describes the ALD probability distribution, where is the observed data point, is the design matrix for observation t, is a set of parameters, is a scale parameter, and is a quantile parameter. This equation provides a natural way to solve the problem of Bayesian estimation of the quantile of order . Moreover, the relationship between minimizing the loss function (3) and maximizing a likelihood function is demonstrable. This equivalence arises when the likelihood function is constructed by combining independently distributed asymmetric densities of the Laplace distribution. Furthermore, it is noteworthy to emphasize that the simple Bayesian quantile can be regarded as a specific instance of a Bayesian regression quantile. In this particular case, the simplicity is characterized by setting and considering only the variable x, with the absence of additional co-variables. This distinction highlights a specialized scenario within the broader framework of Bayesian quantile regression.
2.4. Simultaneous Quantile Regression
Many approaches have been proposed to overcome the crossing problem. See, among others, in the frequentist context [30,31,32]. In the simultaneous Bayesian context, on the other hand, Ref. [33] suggested a two-stage semi-parametric regression method. Steven G Xu and Brian J Reich [34] have also proposed a novel treatment to nonlinear simultaneous quantile regression. They have achieved this by specifying a Bayesian nonparametric model for the conditional distribution. In a similar vein, Das and Ghosal [35] represent the quantile process by articulating it as a weighted sum of B-spline basis functions corresponding to the quantile level. In this study, the method proposed in [27] is considered, which assumes the error term has an ALD. It is noteworthy that imposing a given distribution on is restrictive but provides a fully Bayesian approach to handling simultaneous regression quantiles of different orders. This is performed first by partitioning the entire sample into s sub-samples, where s is the number of quantiles of interest; second, by using the relationship between any two ALD quantiles; and third, by rewriting the entire likelihood into s terms where the j-th term depends only on , where is the j-th term of the vector of quantiles. Let us explain how it works:
- Consider partitioning the entire sample into the sub-samples below:where and with and ; assume that is an integer without loss of generality.
- In order to characterize the likelihood through all quantiles of interest, we use the relationship that connects any -th quantile to the p-th quantile of the :where .
3. Hamiltonian Monte Carlo
Markov chain Monte Carlo (MCMC) was employed to simulate state distributions for an idealized molecular system. An alternative molecular dynamics approach was implemented, featuring deterministic molecular movement adhering to Newton’s law of motion elegantly formalized as Hamiltonian dynamics. The inaugural MCMC algorithm incorporating Hamiltonian dynamics was the static HMC [36]. HMC [37,38] has favorable properties in complex models. The sampling from Metropolis–Hastings [39] and Gibbs [40] relies on random samples from an easy-to-sample distribution of proposals or conditional densities. In complex problems, these algorithms may not give good results; for example, random walks have difficulty “exploring” distributions. The purpose of the HMC algorithm is to use a different kind of sampling that is expected to more effectively “explore” the posterior distribution. Moreover, the HMC requires the differentiability of the density function. According to [41], HMC’s strength is its ability to explore high-dimensional parameter spaces more effectively. By utilizing gradient information from the posterior distribution, HMC avoids the random-walk nature of traditional MCMC methods. This results in a faster convergence, lower autocorrelation, and enhanced mixing, which provides more accurate estimates of the posterior distribution using fewer samples (a simple example is presented in Appendix B). In addition, HMC outperforms Gibbs sampling and Metropolis–Hastings by efficiently exploring high-dimensional target distributions without succumbing to random walk behavior or sensitivity to correlated parameters [42]. Beyond its ability to manage complex and multimodal distributions, HMC’s versatility extends to diverse fields, making it a useful tool in areas such as machine learning, physics, and more.
HMC, essentially a variant of Metropolis–Hastings, draws inspiration from a physical analogy with a distinct approach to proposal generation. The dynamics can be visualized in two dimensions, such as that of a frictionless puck that slides across a variable-height surface. The state of this system comprises the puck position, provided by a two-dimensional vector z, and the puck momentum, provided by a two-dimensional vector p (its mass times its speed). The puck’s potential energy, , is proportional to its present position’s ground height, while its kinetic energy, , is equal to , where m is the puck’s mass. The puck passes at a steady velocity, equivalent to , at a level part of the surface. The potential energy for these factors forms the negative logarithm of the probability density.
This physical analogy serves as a conceptual tool for understanding the dynamic interplay between position and momentum in the system, providing valuable insight into the foundational principles of the HMC algorithm. Subsequently, in HMC applications, Hamiltonian functions are commonly employed and can be represented as follows:
Here, is called potential energy and is defined as minus the distribution log probability density for z that we want to sample, plus any useful constant. is called kinetic energy and is generally described as
Here, M is a symmetric, positive-definite “mass matrix”.
After identifying our potential and kinetic energy functions and introducing momentum variables that are relevant to our position variables, we can simulate a Markov chain in which each iteration takes place:
- Randomly sample momentum variables, regardless of present position;
- Update Metropolis using simulated Hamiltonian dynamics (implemented by the leapfrog method, for example).
More specifically, the momentum variable determines where the position z passes during this second dynamic proposal, and the gradient of determines how the momentum p changes in accordance with the equations of Hamilton:
Some properties of Hamiltonian dynamics are reversibility, conservation of the Hamiltonian, volume preservation, and symplecticness (for more details, see [38]).
- Leapfrog Method:
Hamilton’s equations need to be approximated by discretizing time for software execution using some tiny step size, . We do this by assuming that the Hamiltonian has the form , as in Equation (8), and by assuming that kinetic energy has the form , as in Equation (9); moreover, M is diagonal, with diagonal components, so that
The leapfrog method works as follows:
For the momentum variables, we begin with a half step, then we perform a complete step for the position variables using the current momentum variables’ values, and lastly, we perform another half step for the momentum variables using the current position variables’ values.
- HMC Algorithm:
Each iteration of the HMC algorithm has two steps:
- New values are drawn randomly from their Gaussian distribution for the momentum variables, irrespective of the current position variables values.
- Updating Metropolis is performed using Hamiltonian dynamics to suggest a new state. Starting with the current state , Hamiltonian dynamics is simulated using the leapfrog method (or some other reversible method that preserves volume) for L steps, using a step size of . At the end of this L-step trajectory, the momentum variables are then negated, resulting in a suggested state . This proposed state is accepted as the next state in the Markov chain with probability:If the proposed state is not approved (i.e., dismissed), the following state will be the same as the present state.
4. Numerical Results
In this section, we will perform a Bayesian quantile regression procedure to estimate simultaneous regression quantiles using HMC. HMC will be used through the probabilistic programming language STAN [43,44,45] program to estimate simultaneous linear quantiles. STAN provides a flexible framework for specifying and fitting a wide range of Bayesian models. Numerous probability densities, matrix operations, and numerical ODE solvers are supported by the expressive language STAN [46].
Two different models will be considered for the -th quantile for the model provided by (5):
- Univariate linear quantile: with .
- Multivariate linear quantile: , with , and either or , .
Our methodology involves the utilization of the state-of-the-art STAN program, leveraging Hamiltonian Monte Carlo for statistical modeling and high-performance statistical computing. This platform has been extensively employed across diverse disciplines, including the social, biological, and physical sciences, engineering, and industry, for tasks such as statistical modeling, data analysis, and prediction. Given the inherent relationship between any two ALD quantiles, we recognize that distinct quantiles vary solely in terms of their intercepts . Consequently, all quantiles of interest have the same slope ; then, the unknown vector parameter is . The prior of is Gaussian, with mean 0 and variance 1. For further details about the STAN code, refer to the Appendix A.
4.1. Univariate Linear Quantile
Suppose the error terms . As the Bayesian approach requires a likelihood, we use the ALD to make the Bayesian inference, and our quantiles of interest are and ; hence, we use the relationship between the two ALDs mentioned in Section 2.
We independently generate 300 observations, using R, issued from the model defined in Equation (5). Since we are using simulated data, the theoretical quantiles are , , and .
To study the quality of the estimate of the quantiles, we calculate the root mean square error:
where is the theoretical quantile and is the posterior mean quantile regression.
To assess the impact of data variance on estimation, we assumed that the error terms . The obtained results are presented in Table 1.

Table 1.
Mean, standard deviation, theoretical quantile, and RMSE of for the univariate model with and
.
We run our algorithm for 20,000 iterations, with half of them being burn-in. Gelman–Rubin diagnostic (R-hat) values are depicted in Figure 1, with approaching 1, indicating the convergence of multiple chains. The densities of the estimated s are depicted in Figure 2, providing insight into the distribution patterns.
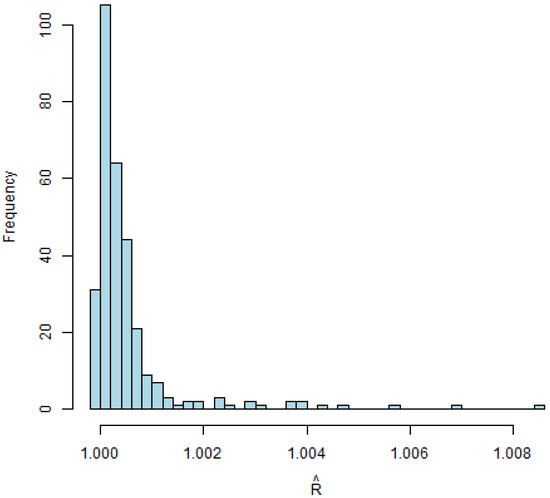
Figure 1.
for univariate model.
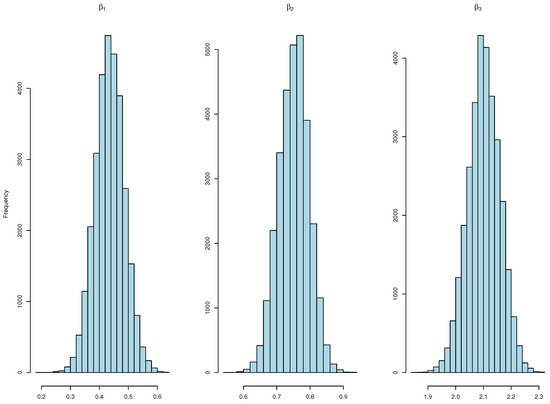
Figure 2.
Histograms showcasing diverse values for the univariate model.
Furthermore, Figure 3 illustrates that the autocorrelation of each chain converges to 0. While comparing the HMC method used in this paper with the Metropolis–Hastings within Gibbs algorithm used in [27], we find that using HMC exhibits lower autocorrelation at earlier lags (around 0 after 10 lags) compared to the Metropolis–Hastings within Gibbs algorithm, where autocorrelation remains around 0 only after 50 lags. This suggests that HMC achieves greater independence between samples sooner, indicating potentially more efficient sampling and better exploration of the distribution space compared to the algorithm used in [27].
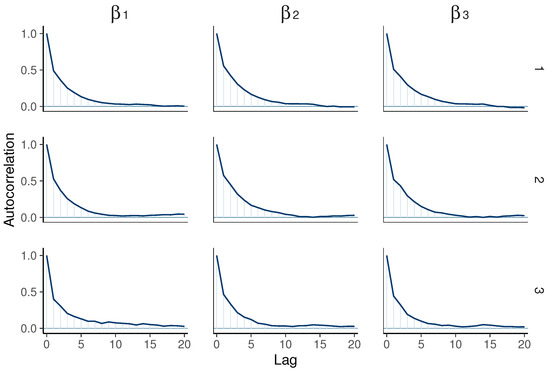
Figure 3.
Autocorrelation plots for various values in the univariate model ( on the left, in the middle, and on the right), showing chain 1 (top), chain 2 (middle), and chain 3 (bottom).
Additionally, the examination of the trace plots in Figure 4 reveals consistent and stable behavior in the MCMC chains, showcasing no discernible oscillation, drift, or other abnormalities. This pattern suggests a thorough exploration of the parameter space, indicating successful convergence to the target distribution.
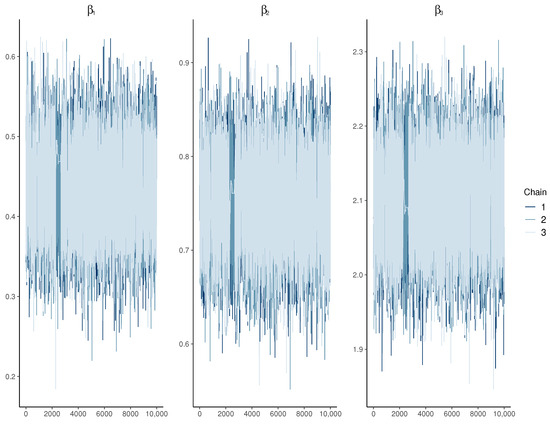
Figure 4.
Trace plots depicting various values for the univariate model.
The small variance observed in Table 1 further supports the reliability of the results. Furthermore, the Monte Carlo standard error (MCSE) is 0 for all s, indicating that the estimated values are likely close to the true values, as shown in Table 1. In addition, when the variance of the data is larger, the estimation worsens (higher RMSE and higher variance). This is normal, as a larger variance makes it harder to estimate the parameters.
It should be noted that diagnostics can only reliably be used to determine a lack of convergence and not detect convergence [47]. Therefore, from the obtained results, the trace plots do not seem to indicate non-stationary behavior.
4.2. Multivariate Linear Quantile
Suppose the error terms . As the Bayesian approach requires a likelihood, we use the ALD to make the Bayesian inference, and the quantiles of interest are and ; hence, we use the relationship between the two ALDs mentioned in Section 2.
We independently generate 300 and 3000 observations, using R, issued from the model defined in Equation (5) with .
Since we are using simulated data, the theoretical quantiles are: , , , , , , , , , , , , and . We run our algorithm for 20,000 iterations, with half of them being burn-in. Despite Y being univariate, our model is multivariate as we estimate quantiles at different levels ( and ), treating each as a distinct response variable.
The Gelman–Rubin diagnostic (R-hat) values are depicted in Figure 5, with approaching 1, indicating the convergence of multiple chains. The histograms of the estimated s are depicted in Figure 6, providing insights into the distribution patterns.
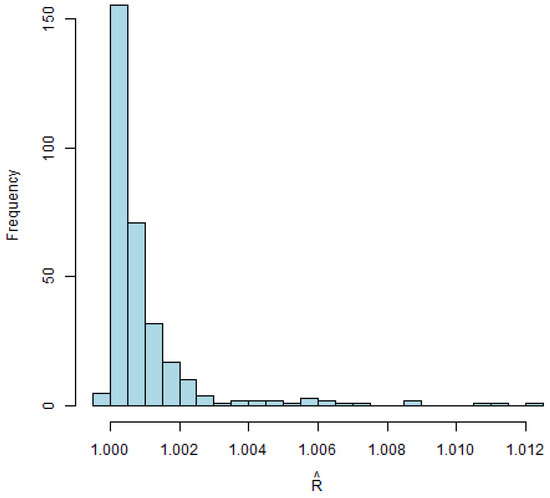
Figure 5.
for multivariate model with 300 observations.
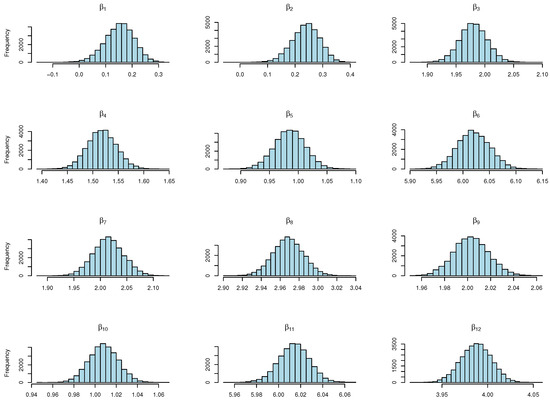
Figure 6.
Histograms showcasing diverse values for the multivariate model with 300 observations.
Furthermore, Figure 7 illustrates that the autocorrelation of each chain converges to 0. While comparing the HMC method used in this paper with the Metropolis–Hastings within Gibbs algorithm used in [27], we find that using HMC exhibits lower autocorrelation at earlier lags (around 0 before 10 lags) compared to the Metropolis–Hastings within Gibbs algorithm, where autocorrelation remains around 0 only after 10 lags. This suggests that HMC achieves greater independence between samples sooner, indicating potentially more efficient sampling and better exploration of the distribution space compared to the algorithm used in [27].
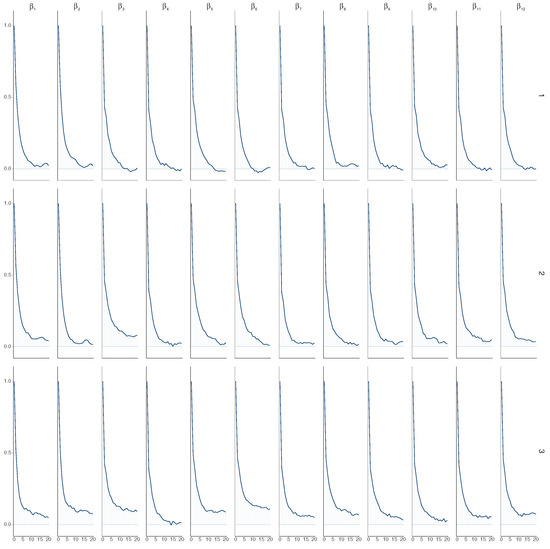
Figure 7.
Autocorrelation plots for varying values ( on the left, next to , and so on) in the multivariate model, showing chain 1 (top), chain 2 (middle), and chain 3 (bottom) with 300 observations.
Additionally, an examination of the trace plots in Figure 8 reveals consistent and stable behavior in the MCMC chains, showcasing no discernible oscillation, drift, or other abnormalities. This pattern suggests a thorough exploration of the parameter space, indicating successful convergence to the target distribution.
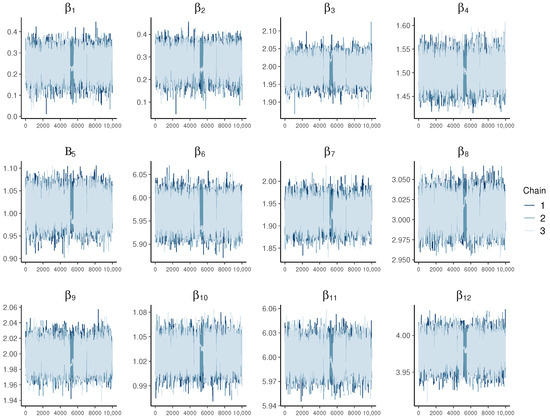
Figure 8.
Trace plots depicting various values for the multivariate model with 300 observations.
The small variance observed in Table 1 further supports the reliability of the results. Furthermore, the MCSE is 0 for all s, indicating that the estimated values are likely close to the true values, as shown in Table 2. The sampler parameters for our model were configured with a value of approximately 50 for all chains, indicating that each iteration of the sampler took around 50 leapfrog steps to explore the parameter space.

Table 2.
Mean, standard deviation, theoretical quantile, and RMSE of for the multivariate model with 300 and 3000 observations.
From the obtained results, the trace plots do not seem to indicate non-stationary behavior.
Furthermore, upon comparing the results presented in Table 2 for 300 observations with those for 3000 observations, we observe an improvement in estimation accuracy with higher observation counts, indicated by lower RMSE values and reduced variance across most quantiles. This phenomenon is expected, as larger observation sizes generally lead to improved estimations.
5. Conclusions
This article introduces a Bayesian methodology for simultaneous regression quantile estimation. The framework assumes an ALD for the error term in the quantile regression model and leverages the inter-quantile relationships within the ALD. This approach allows for a comprehensive characterization of the model likelihood across a range of quantiles, providing a nuanced understanding of the estimation process.
Diverging from the methodology presented in [21], which addresses simple quantiles and regression quantiles across diverse data types, our proposed approach is tailored specifically to ALD data in the context of simultaneous regression quantiles. The utilization of HMC for estimation yields promising results, as demonstrated by our RMSE interpretation. However, it is important to note that the current formulation of the HMC method, as described in this study, is not explicitly designed to handle categorical predictors, making it an interesting area for future investigation.
Our estimation procedure, facilitated by HMC, enables the fitting of parametric quantile functions in both univariate linear and multivariate linear quantile settings. The simulation study validates the convergence of HMC algorithms, supported by diagnostic results. Our study demonstrates that HMC achieves greater independence between samples sooner compared to the algorithm used in [27], suggesting potentially more efficient sampling and better exploration of the distribution space. This finding highlights the effectiveness of HMC in Bayesian analysis and underscores its potential for improving computational efficiency in future research. This work represents a substantial advancement towards achieving a fully Bayesian estimation of multiple quantiles.
An exciting perspective to explore for future research involves extending the methodology introduced in [27] to accommodate any conditional distribution of . Such an extension would broaden the applicability of the proposed approach, enhancing its adaptability to various modeling scenarios. Another perspective within this framework involves conducting sensitivity analyses on key parameters and assumptions related to the HMC algorithm, such as step size and the number of leapfrog steps, to provide further insights into its robustness and effectiveness across various scenarios.
Author Contributions
Conceptualization, H.H. and C.A.; methodology, H.H. and C.A.; investigation, H.H. and C.A.; resources, C.A.; software, H.H.; visualization, H.H. and C.A.; formal analysis, H.H. and C.A.; writing—original draft, H.H. and C.A.; writing—review and editing, H.H. and C.A. All authors have read and agreed to the published version of the manuscript.
Funding
This research received no external funding.
Data Availability Statement
No new data were created or analyzed in this study. Data sharing is not applicable to this article.
Conflicts of Interest
The authors declare no conflicts of interest.
Correction Statement
This article has been republished with a minor correction to the existing affiliation information. This change does not affect the scientific content of the article.
Appendix A. STAN Code
Before proceeding with the STAN interface, users are expected to start with an integration code using R. Users Interested can follow the following link: https://www.r-bloggers.com/2019/01/an-introduction-to-stan-with-r/ to get started.
| data{ |
| int<lower=1> n; // number of observations |
| int<lower=1> d; // number of covariables |
| int<lower=1> q; // number(quantiles) |
| real Y[n]; // response variable |
| matrix[n, d + q] X ; // covariates |
| real<lower=0, upper=1> tau[q]; // quantiles of interest |
| real<lower=0, upper=1> p; // hyperparameter used to caracterize ALD |
| } |
| transformed data{ |
| real gammap = (1. − 2.∗p) / (p ∗ (1.−p)) ; // in prior of Beta |
| real delta2p = 2. / (p ∗ (1.−p)) ; // in prior of Beta |
| vector[n] G ; |
| real g[q] ; |
| int sub_sample_size = n/q ; |
| for (j in 1:q) { |
| // q is the size of tau |
| // q is also the size of sub-samples |
| // j is always used for the id in 1:q |
| if (tau[j]<=p) { |
| g[j] = log(tau[j]/p) / (1.−p); |
| } else { |
| g[j] = −log((1.−tau[j])/(1.−p)) / p ; |
| } |
| } |
| for(j in 1:q) { |
| for(i in ((j−1)∗sub_sample_size + 1):(j ∗ sub_sample_size )) { |
| G[i] = g[j]; |
| } |
| } |
| } |
| parameters{ |
| vector[d + q] Beta; |
| real <lower=0> sigma; |
| real <lower=0> omega[n]; // depends on sigma |
| } |
| model{ |
| sigma ~ inv_gamma(1., 0.01); |
| omega ~ exponential(1/sigma); |
| Beta ~ normal(0, 1.); |
| for(i in 1:n){ |
| Y[i] ~ normal( X[i] ∗ Beta - sigma∗G[i] + gammap ∗ omega[i], |
| sqrt(delta2p ∗ sigma ∗ omega[i])); |
| } |
| } |
Appendix B. Univariate Linear Quantile
Suppose the error terms . As the Bayesian approach requires a likelihood, we use the ALD to make Bayesian inference, and our quantile of interest is , thus we use . We suggest detecting the quantile of order by placing a prior on . For all algorithms, we generate 300 independent observations issued from the model defined in Equation (5). Since we are using simulated data, the theoretical quantiles are known, which are and .
We run all the algorithms for 3000 iterations, with half of them designated as burn-in.

Table A1.
Mean, standard variation, the theoretical quantile and RMSE of for univariate linear model using different algorithms.
Table A1.
Mean, standard variation, the theoretical quantile and RMSE of for univariate linear model using different algorithms.
| Mean | SD | Theoretical Quantile | RMSE | |
|---|---|---|---|---|
| HMC | ||||
| 4.27 | 0.1 | 4.33 | 0.06 | |
| 2.05 | 0.2 | 2 | 0.05 | |
| Gibbs | ||||
| 4.64 | 0.08 | 4.33 | 0.31 | |
| 2.1 | 0.17 | 2 | 0.1 | |
| Metropolis-Hastings | ||||
| 4.7 | 0.17 | 4.33 | 0.37 | |
| 1.64 | 0.27 | 2 | 0.36 | |
It is noteworthy that for both the Metropolis-Hastings and Gibbs algorithms using R, we received the following message: “Cannot compute Gelman & Rubin’s diagnostic for any chain segments for variables . This indicates convergence failure.” We received the same message for . By computing by hand, we obtained values less than 1, indicating that the standard deviation between chains is less than the standard deviation within chains. Hence, we did not achieve convergence of the chains. This is not the case when using HMC. Therefore, if we are interested in estimating a univariate linear quantile (not simultaneously), it is preferable to use HMC based on the results obtained in Table A1. Additionally, the estimated quantiles using HMC are better than the ones estimated using Gibbs and Metropolis-Hastings. Hence, for a more complex model like simultaneous regression quantile, it is definitely better to use HMC. This is the main motivation behind using HMC.
References
- Buhai, S. Quantile regression: Overview and selected applications. Ad Astra 2005, 4, 1–17. [Google Scholar]
- Yang, J.; Meng, X.; Mahoney, M. Quantile regression for large-scale applications. Int. Conf. Mach. Learn. 2013, 28, 881–887. [Google Scholar] [CrossRef]
- Lusiana, E.D.; Arsad, S.; Buwono, N.R.; Putri, I.R. Performance of Bayesian quantile regression and its application to eutrophication modelling in Sutami Reservoir, East Java, Indonesia. Ecol. Quest. 2019, 30, 69–77. [Google Scholar] [CrossRef]
- Koenker, R. Quantile regression: 40 years on. Annu. Rev. Econ. 2017, 9, 155–176. [Google Scholar] [CrossRef]
- Firpo, S.; Fortin, N.M.; Lemieux, T. Unconditional quantile regressions. Econometrica 2009, 77, 953–973. [Google Scholar]
- Cade, B.S.; Noon, B.R. A gentle introduction to quantile regression for ecologists. Front. Ecol. Environ. 2003, 1, 412–420. [Google Scholar] [CrossRef]
- He, X.; Pan, X.; Tan, K.M.; Zhou, W.X. Smoothed quantile regression with large-scale inference. J. Econom. 2023, 232, 367–388. [Google Scholar] [CrossRef] [PubMed]
- Härdle, W. Applied Nonparametric Regression; Cambridge University Press: Cambridge, UK, 1990. [Google Scholar]
- Granger, C.W.; Teräsvirta, T. Modelling Nonlinear Economic Relationships; Oxford University Press: Oxford, UK, 1993. [Google Scholar]
- Cade, B.S. Quantile regression applications in ecology and the environmental sciences. In Handbook of Quantile Regression; Chapman and Hall/CRC: Boca Raton, FL, USA, 2017; pp. 429–454. [Google Scholar]
- Wei, Y.; Kehm, R.D.; Goldberg, M.; Terry, M.B. Applications for quantile regression in epidemiology. Curr. Epidemiol. Rep. 2019, 6, 191–199. [Google Scholar] [CrossRef]
- Peng, L.; Huang, Y. Survival analysis with quantile regression models. J. Am. Stat. Assoc. 2008, 103, 637–649. [Google Scholar] [CrossRef]
- Abid, N.; Ahmad, F.; Aftab, J.; Razzaq, A. A blessing or a burden? Assessing the impact of climate change mitigation efforts in Europe using quantile regression models. Energy Policy 2023, 178, 113589. [Google Scholar] [CrossRef]
- Che, C.; Li, S.; Yin, Q.; Li, Q.; Geng, X.; Zheng, H. Does income inequality have a heterogeneous effect on carbon emissions between developed and developing countries? Evidence from simultaneous quantile regression. Front. Environ. Sci. 2023, 11, 1271457. [Google Scholar] [CrossRef]
- Bernardi, M.; Gayraud, G.; Petrella, L. Bayesian tail risk interdependence using quantile regression. Bayesian Anal. 2015, 10, 553–603. [Google Scholar] [CrossRef]
- Koenker, R.; Bassett, G., Jr. Regression quantiles. Econom. J. Econom. Soc. 1978, 46, 33–50. [Google Scholar] [CrossRef]
- Benoit, D.F.; den Poel, D.V. bayesQR: A Bayesian approach to quantile regression. J. Stat. Softw. 2017, 76, 1–32. [Google Scholar] [CrossRef]
- Alhamzawi, R.; Algamal, Z.Y. Bayesian bridge quantile regression. Commun. Stat.-Simul. Comput. 2019, 48, 944–956. [Google Scholar] [CrossRef]
- Lancaster, T.; Jun, S.J. Bayesian quantile regression methods. J. Appl. Econom. 2010, 25, 287–307. [Google Scholar] [CrossRef]
- Kozumi, H.; Kobayashi, G. Gibbs sampling methods for Bayesian quantile regression. J. Stat. Comput. Simul. 2011, 81, 1565–1578. [Google Scholar] [CrossRef]
- Yu, K.; Moyeed, R.A. Bayesian quantile regression. Stat. Probab. Lett. 2001, 54, 437–447. [Google Scholar] [CrossRef]
- Koenker, R.; Chernozhukov, V.; He, X.; Peng, L. Handbook of Quantile Regression; CRC Press: Boca Raton, FL, USA, 2017. [Google Scholar]
- Cannon, A.J. Non-crossing nonlinear regression quantiles by monotone composite quantile regression neural network, with application to rainfall extremes. Stoch. Environ. Res. Risk Assess. 2018, 32, 3207–3225. [Google Scholar] [CrossRef]
- Liu, Y.; Wu, Y. Simultaneous multiple non-crossing quantile regression estimation using kernel constraints. J. Nonparametric Stat. 2011, 23, 415–437. [Google Scholar] [CrossRef]
- Takeuchi, I.; Furuhashi, T. Non-crossing quantile regressions by SVM. In Proceedings of the 2004 IEEE International Joint Conference on Neural Networks (IEEE Cat. No. 04CH37541), Budapest, Hungary, 25–29 July 2004; Volume 1, pp. 401–406. [Google Scholar]
- Firpo, S.; Galvao, A.F.; Pinto, C.; Poirier, A.; Sanroman, G. GMM quantile regression. J. Econom. 2022, 230, 432–452. [Google Scholar] [CrossRef]
- Merhi Bleik, J. Fully Bayesian estimation of simultaneous regression quantiles under asymmetric Laplace distribution specification. J. Probab. Stat. 2019, 2019, 8610723. [Google Scholar] [CrossRef]
- Yu, K.; Zhang, J. A three-parameter asymmetric Laplace distribution and its extension. Commun. Stat. Methods 2005, 34, 1867–1879. [Google Scholar] [CrossRef]
- Huber, P.J. Robust regression: Asymptotics, conjectures and Monte Carlo. Ann. Stat. 1973, 1, 799–821. [Google Scholar] [CrossRef]
- Liu, Y.; Wu, Y. Stepwise multiple quantile regression estimation using non-crossing constraints. Stat. Interface 2009, 2, 299–310. [Google Scholar] [CrossRef]
- Bondell, H.D.; Reich, B.J.; Wang, H. Noncrossing quantile regression curve estimation. Biometrika 2010, 97, 825–838. [Google Scholar] [CrossRef] [PubMed]
- Sangnier, M.; Fercoq, O.; d’Alché-Buc, F. Joint quantile regression in vector-valued RKHSs. In Proceedings of the 30th Conference on Neural Information Processing Systems (NIPS 2016), Barcelona, Spain, 5–10 December 2016; pp. 3693–3701. [Google Scholar]
- Reich, B.J.; Fuentes, M.; Dunson, D.B. Bayesian spatial quantile regression. J. Am. Stat. Assoc. 2011, 106, 6–20. [Google Scholar] [CrossRef]
- Xu, S.G.; Reich, B.J. Bayesian nonparametric quantile process regression and estimation of marginal quantile effects. Biometrics 2023, 79, 151–164. [Google Scholar] [CrossRef] [PubMed]
- Das, P.; Ghosal, S. Bayesian non-parametric simultaneous quantile regression for complete and grid data. Comput. Stat. Data Anal. 2018, 127, 172–186. [Google Scholar] [CrossRef]
- Duane, S.; Kennedy, A.D.; Pendleton, B.J.; Roweth, D. Hybrid Monte Carlo. Phys. Lett. B 1987, 195, 216–222. [Google Scholar] [CrossRef]
- Warner, B.A. Bayesian Learning for Neural Networks (Lecture Notes in Statistics Vol. 118). J. Am. Stat. Assoc. 1997; 92, 791. [Google Scholar]
- Neal, R.M. MCMC using Hamiltonian dynamics. In Handbook of Markov Chain Monte Carlo; Chapman and Hall/CRC: Boca Raton, FL, USA, 2011; Volume 2, p. 2. [Google Scholar]
- Hastings, W.K. Monte Carlo Sampling Methods Using Markov Chains and Their Applications; Oxford University Press: Oxford, UK, 1970. [Google Scholar]
- Geman, S.; Geman, D. Stochastic relaxation, Gibbs distributions, and the Bayesian restoration of images. In Readings in Computer Vision; Elsevier: Amsterdam, The Netherlands, 1987; pp. 564–584. [Google Scholar]
- Betancourt, M. A conceptual introduction to Hamiltonian Monte Carlo. arXiv 2017, arXiv:1701.02434. [Google Scholar]
- Hoffman, M.D.; Gelman, A. The No-U-Turn sampler: Adaptively setting path lengths in Hamiltonian Monte Carlo. J. Mach. Learn. Res. 2014, 15, 1593–1623. [Google Scholar]
- Stan Development Team. RStan: The R interface to Stan, Version 2.5.0; Stan Development Team: New York, NY, USA, 2014.
- Gelman, A.; Lee, D.; Guo, J. Stan: A probabilistic programming language for Bayesian inference and optimization. J. Educ. Behav. Stat. 2015, 40, 530–543. [Google Scholar] [CrossRef]
- Carpenter, B.; Gelman, A.; Hoffman, M.D.; Lee, D.; Goodrich, B.; Betancourt, M.; Brubaker, M.A.; Guo, J.; Li, P.; Riddell, A. Stan: A probabilistic programming language. J. Stat. Softw. 2017, 76, 1. [Google Scholar] [CrossRef]
- Grinsztajn, L.; Semenova, E.; Margossian, C.C.; Riou, J. Bayesian workflow for disease transmission modeling in Stan. Stat. Med. 2021, 40, 6209–6234. [Google Scholar] [CrossRef]
- Gelman, A.; Shirley, K. Inference from simulations and monitoring convergence. In Handbook of Markov Chain Monte Carlo; CRC Press: Boca Raton, FL, USA, 2011; Volume 6, pp. 163–174. [Google Scholar]
Disclaimer/Publisher’s Note: The statements, opinions and data contained in all publications are solely those of the individual author(s) and contributor(s) and not of MDPI and/or the editor(s). MDPI and/or the editor(s) disclaim responsibility for any injury to people or property resulting from any ideas, methods, instructions or products referred to in the content. |
© 2024 by the authors. Licensee MDPI, Basel, Switzerland. This article is an open access article distributed under the terms and conditions of the Creative Commons Attribution (CC BY) license (https://creativecommons.org/licenses/by/4.0/).