Abstract
The rapid proliferation of new technologies such as Internet of Things (IoT), cloud computing, virtualization, and smart devices has led to a massive annual production of over 400 zettabytes of network traffic data. As a result, it is crucial for companies to implement robust cybersecurity measures to safeguard sensitive data from intrusion, which can lead to significant financial losses. Existing intrusion detection systems (IDS) require further enhancements to reduce false positives as well as enhance overall accuracy. To minimize security risks, data analytics and machine learning can be utilized to create data-driven recommendations and decisions based on the input data. This study focuses on developing machine learning models that can identify cyber-attacks and enhance IDS system performance. This paper employed logistic regression, support vector machine, decision tree, and random forest algorithms on the UNSW-NB15 network traffic dataset, utilizing in-depth exploratory data analysis, and feature selection using correlation analysis and random sampling to compare model accuracy and effectiveness. The performance and confusion matrix results indicate that the Random Forest model is the best option for identifying cyber-attacks, with a remarkable F1 score of 97.80%, accuracy of 98.63%, and low false alarm rate of 1.36%, and thus should be considered to improve IDS system security.
1. Introduction
With the rapid increase in cyber traffic and the emergence of highly sophisticated intrusion attacks, there is a critical need for an adaptive and real-time intrusion detection system. Cyber-attack can take many forms including malware infections, phishing attempts, and unauthorized access to sensitive data, which can result in severe consequences such as financial loss, reputational damage, and compromise of sensitive information [1,2]. It is essential to remain vigilant and take proactive measures to protect individuals, businesses, and industries from these types of cyber threats. An adaptive and real-time intrusion detection system continuously monitors, detects, and responds to emerging threats, enabling organizations to defend against cyber-attacks proactively and reduce the impact of successful breaches [3,4].
Existing intrusion detection methods are inadequate in addressing the dynamic and complex nature of modern cyber threats. This is because of the need to improve the number of false positives and accuracy in general. The details about the existing studies are investigated in Section 2. However, machine learning has introduced a new approach, where algorithms can be trained with real-time datasets to identify specific patterns and anomalies in network traffic [5]. This approach is especially useful in the era of the Internet of Things (IoT), where there is an overwhelming amount of network traffic. Data analytics has become a crucial aspect of cybersecurity research, offering a way to collect, store and process cybersecurity information beyond the analysis of logs and alerts generated by firewalls, intrusion detection systems (IDS), web application firewalls (WAF), and other security systems [6]. It encompasses communication data, such as social networking activity, voice, email, and user data, and logs of web applications and files for advanced analytics, which can help identify user behavior. Incorporating configuration information of assets and business process data can also aid in risk assessments [7,8]. The poor accuracy in these systems is because of the high number of false positives mainly because of the high correlation between data as well as data imbalanced problems as the number of abnormal data is usually higher than the normal data.
Hence, this paper examines the analysis and prediction of cyber-attacks by utilizing supervised machine learning algorithms as well as in-depth exploratory data analysis and feature selection to support network intrusion detection systems (IDS). Through machine learning methods, the paper aims to comprehend the patterns and features of attacks, which will enable organizations to detect potential threats early and implement preventive measures using robust intrusion detection systems (IDS). Hence, collecting, and preprocessing UNSW_NB15 network traffic data will be the core focus which will consist of selecting an appropriate model and hyperparameters, conducting model training and performance evaluation, and analyzing, and comparing the results. This paper is organized as follows. Section 2 reviews the related works. Section 3 proposes the architecture. Section 4 discusses the dataset and develops the pre-processing methodology. Section 5 presents and discusses the results. Section 6 concludes the work and addresses the future work.
2. Related Work
The book ‘Big Data Analytics in Cyber Security’, written by [9] emphasizes the significance of data analytics in leveraging cyber security. The authors suggest that by analyzing vast amounts of network data, Big Data is creating new opportunities for cyber security, such as building models and configuring network infrastructure for organizations. Rajwat’s study demonstrates how the efficiency of machine learning algorithms in the Internet of Things (IoT) industry can improve network security by maintaining the reliability, security, availability, and survivability of security assets. Deep learning is recommended to enhance the performance of network building in smart cities and IoT devices [10]. Note that machine learning and IoT are becoming an integral part of modern life, with around 25 billion IoT-connected devices generating significant amounts of data that require analysis for improving performance. Machine learning algorithms, such as decision trees, neural networks and Bayesian networks, enable devices to identify patterns in datasets and make decisions based on their analysis. According to [11], the increasing frequency of cyber-attacks on physical systems is the biggest concern for industrial control systems (ICS). A multilayer cyber-attack detection system can be utilized for detecting cyber-attacks and establishing additional security within the network to prevent physical impacts and consequences. The research group in [12] presents a survey on the impact of security analytics, which concluded that analytics could assist network managers and IT security teams in real-time monitoring and surveillance of network activity. Machine learning can also help in detecting real-time malicious and suspicious patterns, making security analytics a crucial solution for cyber security in the near future. According to [13], deep learning can detect cyber-attacks and should be considered in building IoT devices and smart cities. The paper represented by [5] talks about a new intrusion detection system that can detect five different types of threats in a network, including Exploit, DOS, Probe, Generic, and Normal. The system is based on the UNSW-NB15 dataset and uses an integrated classification-based model to detect malicious activity. The proposed model is evaluated and found to have a considerably higher accuracy of 83.8% on a real-time data set generated at NIT Patna CSE lab. According to [6], machine learning-based intrusion detection systems are effective in identifying network attacks. However, these systems are challenged by high-dimensional data and imbalanced datasets, resulting in lower accuracy and higher false positive rates. A filter-based feature reduction method utilizing the XGBoost algorithm is presented by the author [6] along with an analysis of the UNSW-NB15 intrusion detection dataset. The study implemented various machine learning approaches, such as Support Vector Machine (SVM), k-Nearest-Neighbors (KNN), Logistic Regression (LR), Neural Network (NN), and Decision Tree (DT), using the reduced feature space. According to the findings, the XGBoost-based feature selection approach enables techniques like the DT to raise the test accuracy of the binary classification scheme from 88.13% to 90.85%.
The authors in [14] discussed the importance of Network Intrusion Detection Systems (NIDS) in the context of internet security issues in the IoT environment. According to this study, the UNSW-NB15 dataset is more appropriate for evaluating NIDS. The experimental results show that the SVM method outperforms other methods, achieving an accuracy of 85.99% for binary-classification and 75.77% for multi-classification. The study represented by [15] discusses the problem of classifying network intrusions and how ordinary machine learning algorithms are not efficient due to the large amount of data. According to this research, deep Learning is suggested as a more effective solution due to its ability to classify with high dimensionality and complex features. The deep learning model using a feed-forward neural network shows an accuracy of 99% with a lower false alarm rate. As per the study presented by [16], traditional defense systems such as firewalls and IDSs suffer continuous database updates to detect threats. To create more reliable systems with better detection rates and fewer false alarms, intrusion detection systems need to take a new approach that makes use of machine learning models. This study solved the imbalanced class problem with 99% accuracy by using the synthetic minority oversampling technique. Classification algorithms play an essential part in assisting IDS in identifying various types of attacks, as demonstrated by a comparative analysis of the UNSW_NB15 dataset conducted by [17]. As per this study, the Random Forest classification model is more credible as compared to other classification problems with an accuracy of 97.49%. In [18], the performance of various classification machine learning models has been implemented using Apache Spark and compared with related research based on the UNSW_NB15 dataset. This study states the Random Forest model is more accurate and provides the highest accuracy compared to the Decision Tree and Naïve Bayes. The experiment conducted by [19] discusses the importance of network intrusion detection systems in identifying cyber threats, and the various approaches used to develop such systems, including classical, hybrid, and ensemble methods. To attempt to increase the IDS system’s accuracy, this study has proposed stacking machine learning models with Mutual Information Gain and Extra Tree Classifier feature selection techniques. Tested on the UNSW-NB15 dataset, this model yields an accuracy of 96.24% and performs better than any other recent competing model. The classification and regression trees (CART) model analysis by [20] shows the hybrid model performs well using effective feature selection with the help of the Random Forest algorithm to find the most important features combined with CART for the classification of different attack classes and shows the accuracy of 95.37%. In [21], the comparative analysis of the UNSW_NB15 dataset and CICIDS2017 has been carried out. This research work concludes the SVM model with the naïve Bayes feature embedding method gives an accuracy of 98.92% on the UNSW_NB15 dataset.
It has been demonstrated that the highest accuracy of the IDS on the UNSW_NB15 dataset is 98.92%. This accuracy needs more enhancement to reduce the probability of false detection which affects the overall accuracy of the system. Hence, this paper is trying to enhance the system performance to exceed that threshold of accuracy by using in-depth EDA, feature selection and supervised learning models.
3. Proposed Research Methodology
In the following we describe four algorithms that are considered for the analysis as part of IDS enhancement. These algorithms have been selected for various reasons, including its wider applications for binary classification and existing applications in machine learning-enabled IDS. The details are explained below.
3.1. Logistic Regression
For binary classification issues, supervised machine learning methods are typically employed [22]. With the use of one or more predictor variables, it is frequently employed to predict a binary result (True/False). The logistic function, sometimes referred to as the sigmoid function, is used by the algorithm to define the relationship between the predictor variables and the binary output variable. Any input value is translated by the sigmoid function to a number between 0 and 1, which is the likelihood that the binary result will be 1. Within the regression family, a logistic regression has specifically been applied to perform classification, specifically binary classification. Therefore, it is relatively common to use this method when constructing machine learning for binary classification tasks.
By employing optimization strategies like gradient descent to minimize a cost function, such as the cross-entropy loss, the logistic regression model gains knowledge from the training set [23]. Based on the values of the predictor variables, the model can be trained to predict the binary outcome for new occurrences. The following is the main characteristic of logistic regression:
- Logit function: The logistic regression model determines the likelihood that the dependent variable will take a particular value using the logit function.
- S-shaped curve: The logistic regression model generates an S-shaped curve that shows the likelihood that, for a given value of the independent variables, the dependent variable will take the value of 1.
- Maximum Likelihood Estimation: The logistic regression model estimates the model parameters using maximum likelihood estimation.
We included logistic regression because it is a well-established and widely used algorithm for binary classification tasks, making it a standard classifier in the field. Moreover, it is a simple and efficient classifier, making logistic regression a good benchmark for evaluating binary classification problems.
3.2. Decision Tree
Commonly employed for both classification and regression applications, decision trees are a type of machine-learning technique. Using the training set of data, the algorithm creates a tree-like model of decisions and their outcomes [24]. The tree structure helps to visualize and interpret the decision-making process.
The key features of a Decision Tree algorithm include:
- Simple to comprehend and interpret since they provide a visualizable, tree-like framework for the decision-making process.
- Their ability to handle both categorical and numerical data makes them useful for a wide range of applications.
- Non-parametric meaning they do not make any assumptions about the distribution of the data.
- Can handle missing values in the data by using different techniques such as surrogate splits or imputation.
Decision trees provide a tree-like model that is easy to interpret, offering insights into feature importance. The tree-based approach is suitable for capturing non-linear relationships. In the context of IDS, decision trees have been used as part of several IDS constructions (see, e.g., [25,26]), particularly on finding relevant features for classification.
3.3. Random Forest
The Random Forest approach reduces overfitting and increases prediction accuracy by combining numerous decision trees [27]. Random Forest is frequently applied to classification and regression issues. The basic idea is to build a forest of decision trees, allow each tree to grow and produce a forecast on its own, and then aggregate all of the trees’ predictions to produce the final prediction. With this being said, the key features of Random Forest are:
- Random sampling of the training data: a random subset of the training data is used to train each tree in the forest.
- Random feature selection: a random collection of features is taken into consideration for splitting at each decision tree split.
- Prediction aggregation: the ultimate forecast is derived from the sum of the forecasts made by each tree within the forest.
The main advantage of Random Forest is that, in comparison to a single decision tree, it is less prone to overfitting, as indicated by the previously mentioned points [28]. This is due to the fact that every tree in the forest is trained using a distinct subset of the data and only takes a portion of the features into account when it splits. Therefore, the final prediction is less likely to be biased towards the idiosyncrasies of the training data. Additionally, Random Forest can handle a large number of input variables and can provide a measure of the importance of each input variable in the prediction.
Random Forest is an ensemble of decision trees that combines multiple models for robust performance. The collective strength of multiple models achieves robust and accurate performance in identifying cyber-attacks within the network traffic dataset. Whilst considering evaluation of decision trees, it is intuitive to compare the performance with Random Forest.
3.4. Support Vector Machine
Regression analysis and classification are two applications for the Support Vector Machine (SVM) technique. The method uses labeled data as input and searches for the optimum hyperplane to maximize the margin—the distance between the hyperplane and the closest data points from each class—while separating the various classes [29].
SVM can handle complex datasets very well since it can determine the decision boundary that maximizes the separation between distinct classes. Additionally capable of handling high-dimensional data, SVM may separate data that is not linearly separable in the original space by transforming the input data into a higher-dimensional space using a variety of kernel functions. The following are SVM’s primary features:
- Maximum margin: SVM seeks to identify the hyperplane with the greatest margin between classes. The gap between each class’s nearest data points and the hyperplane is known as the margin. Through margin maximization, SVM may minimize overfitting and improve generalization performance.
- Kernel trick: To separate data that is not linearly separable in the original space, SVM can apply various kernel functions to transform the input data into a higher-dimensional space. SVM can handle complex datasets thanks to a technique called the kernel trick.
- Robustness against outliers: Because SVM only takes into account data points that are closest to the decision border, it is less susceptible to outliers than other classification methods.
- Binary classification: SVM is limited to classifying data into two groups because it is a binary classification system. It can, however, be expanded to address multi-class classification issues by utilizing strategies like one-vs-all or one-vs-one.
SVM is known for its versatility and effectiveness in handling complex decision boundaries. This can enhance the accuracy of the detection of a complex data pattern. The attractive characteristics of SVM have been demonstrated in the number of IDS developments [25,26], particularly those using the intrusion detection’s AWID dataset [30].
4. Dataset Description and Properties
In this work, we consider enhancement of IDS based on analysis of the UNSW-NB15 dataset [31]. Herein this dataset is utilized due to its recency and its wide applications to the general-purpose IDS development in the literature. This is in contrast to other similar datasets such as AWID [30] where its utilization is mainly intended for intrusion detection in wireless data traffic.
The UNSW-NB15 dataset was created by researchers at the Australian Centre for Cyber Security (ACCS) lab at the University of New South Wales (UNSW), using the Perfect-Storm tool [31]. This dataset contains raw network traffic data of 100 GB monitored by TCP-Dump tool containing 2,540,044 realistic records. The dataset includes a wide variety of different types of network traffic, such as TCP, UDP, ICMP, and HTTP, and it also includes information about the source and destination of the traffic, as well as the time and duration of each packet [32]. The total number of training and testing normal data are 56,000 and 37,000, respectively.
According to [32], the dataset UNSW-NB15 contains information regarding nine instances of cyber-attacks with the following explanation.
- Fuzzers: These cyberattacks overwhelm and crash servers and network systems by using a large amount of randomized data, or “fuzz”. This has 18,184 and 6062 instances for training and testing, respectively.
- Backdoors: These are exploits that employ reputable system gateways to obtain unauthorized access and install malicious software that gives attackers remote access to a system to facilitate an exploit. This has 1746 and 583 instances for training and testing, respectively.
- Analysis: This attack also known as Active Reconnaissance, uses various methods such as port scans, vulnerability scans, spam files and foot printing to gather information about a network without exploiting it. This has 2000 and 677 instances for training and testing, respectively.
- Exploits: The target of this attack is to know vulnerabilities in operating systems to gain unauthorized access and control. Exploit software can be used to automate these attacks once a potential vulnerability is detected. This has 33,393 and 11,132 instances for training and testing, respectively.
- Denial of service (DoS): When too many unauthorized connections are made to a network, resources are either momentarily or permanently blocked from being accessed by authorized users. Although it can be challenging to spot these attacks, several obvious indications can be offered. This has 12,264 and 4089 instances for training and testing, respectively.
- Generic: A generic attack is a type of cryptographic attack that targets the secret key used in encryption. This type of attack can be used against various types of ciphers such as block ciphers, stream ciphers, and message authentication code ciphers, and is frequently mentioned as a “birthday attack” due to the vulnerability of ciphers to collisions, which occur more frequently with random attack attempts. This has 40,000 and 18,871 instances for training and testing, respectively.
- Reconnaissance: This involves discovering as much as possible about a target host or public network. By utilizing the information acquired, exploit techniques are employed to gain access to the target host or network. This kind of reconnaissance includes social media searches in addition to using publicly accessible information like Whois, ARIN records, and Shodan. This has 10,491 and 3496 instances for training and testing, respectively.
- Shellcode: An exploit attack that makes uses a payload (small piece of code), to gain unauthorized access to a target’s computer. The payload is inserted into an active application, giving the attacker control over the compromised device through a command shell. This has 1133 and 378 instances for training and testing, respectively.
- Worms: A worm is a type of cyberattack that rapidly spreads through a network by infecting multiple systems. It infects the individual computers and leverages them as controlled devices, known as “zombies” or “bots”, which can then be used in coordinated attacks as part of a larger network of infected devices, called a “botnet”. This has 130 and 44 instances for training and testing, respectively.
4.1. Dataset Features
As shown in Table 1, further explanations of the important features, its description and data are highlighted. Proto, service and state are the only categorical features present in the UNSW_NB15 dataset. sbytes and dbytes attributes are used to create a new feature called network_byte. For more details on the dataset description, please refer to [31]. The dataset has 49 attributes in total, which are split into three different data types: binary, nominal, and categorical. The attributes are a combination of both Packet-based and Flow-based features. Furthermore, the dataset consists of nine different attacks in addition to the normal class.

Table 1.
UNSW-NB15 Features.
The dataset is available in 4 CSV files, below are the details:
Figure 1 illustrates the step-by-step process used to build a robust machine learning model for detecting cyber-attacks. The following steps were carried out.
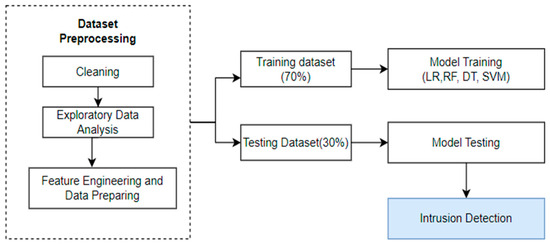
Figure 1.
Overview of Data Processing and ML Implementation of UNSW_NB15 Dataset.
- Data collection and cleaning: The dataset was collected from the four files listed in Table 2. Target features were identified, null values were checked, and numerical and categorical features were identified.
Table 2. UNSW-NB15 data file details.
- Exploratory Data Analysis: A heatmap was used to identify and remove highly correlated values.
- Feature Engineering and Data Preparation: New features were added, and the data was standardized using the standard scalar and Onehotencode functions.
- Train and Test Data Split: A training set (70%) and a testing set (30%) were generated from the dataset.
- Training and Testing of the Models: On the training set, methods for logistic regression, decision trees, random forests, and linear SVM were applied; on the testing set, their efficacy was assessed.
4.2. Data Pre-Processing
Data pre-processing enhances efficiency and minimizes prediction errors in software cost estimation. It is imperative to meticulously choose machine learning methods and datasets based on their respective characteristics [33]. The data pre-processing has been performed on the UNSW_NB15 dataset by combining data from all four CSV files. The imbalanced dataset has more categorical data points than the attack category. The training dataset has 83.77% of class 0 and 12.66% of class 1. The null values from the attributes ct_flw_http_mthd, is_ftp_login, attack_cat have been removed for this study to attain further accuracies. Hence, the dataset has a total of 9 columns with datatype object: namely, ‘state’, ‘service’, ‘ct_ftp_cmd’, ‘attack_cat’, ‘srcip’, ‘sport’, ‘dstip’, ‘dsport’ and ‘proto’. According to [17], the ‘ct_ftp_cmd’ column is supposed to be of numeric type. However, upon closer examination, it was found that this column contained blank entries which have been replaced by ‘0’ to aid the learning process and the data type was changed from object to int. ‘is_ftp_login’ is a binary attribute having values except 1 and 0 are replaced by 0. The ‘attack_cat’ attribute has been found with few non-unique values like ‘backdoors’ and is replaced by the correct value ‘backdoor’.
4.3. Exploratory Data Analysis
Exploratory data analysis helps to understand the distribution, relationships, and patterns in the data and enables the selection and preprocessing of appropriate features to improve the accuracy of the machine learning model [34]. In this experiment, the correlation between the features has been calculated with two perspectives, one correlation between features without class labels using Pearson’s Correlation Coefficient (PCC) and a second correlation between two tables with class labels using the Gain Ration method. Table 3 presents the correlation value between the two variables.
Table 3.
Correlation Value between two variables.
For better accuracy, it is important to drop highly correlated features and keep features with low correlation with each other. Hence, Sloss, ct_srv_dst, ct_src_dport_ltm, dpkts, ltime, dloss, ct_dst_src_ltm features have been removed from the dataset.
4.4. Feature Engineering and Data Preparing
To provide a collection of input features that will be utilized to train a machine learning model, feature engineering is the process of choosing, altering, and extracting features from raw data. Based on network analysis, a new feature called “network_bytes” has been built to represent the transmitted bytes over the network [35]. Network bytes are total bytes transferred by sbytes (source to destination bytes) and dbytes (destination to source bytes). In the context of improving the performance of the machine learning model, it is important to standardize the data for the numerical data standard scalar method. This helps in streamlining numerical data by transforming variables so that they are on the same scale, that aims to enhance the efficiency of the used machine learning algorithms and make the variables more interpretable [36]. One hot encoding process has been used to process categorical data. This is a process which transforms the categorical variables into a format that is suitable for modelling. Categorical variables are variables that take on values that are drawn from a limited set of categories. In this experiment, Onehot encoding has been applied to proto, service and state columns. After applying the one-hot function, the encoded data had 197 columns.
5. Results and Discussion
The experiments presented in this work are conducted on standard libraries of Python 3.11.1 developed with Jupiter Notebook 6.5.2. Hardware details include Microsoft Windows 11 x64-based-pc, Intel Core i5 processor and 16 GB RAM. The ML models are built, tested, and evaluated on the Scikit Learn ML Python framework.
5.1. Performance Matrix
While there are numerous metrics available for evaluating machine learning-based intrusion detection systems (IDS), this research focuses on maximizing the accuracy of predictions, for instance in the test dataset. The main metric of interest is the Accuracy (AC), which is calculated using True Positive (TP) for correctly identified attacks, True Negative (TN) for legitimate traffic correctly classified as legitimate, False Positive (FP) for legitimate traffic classified as attacks, and FN for legitimate traffic classified as intrusions [37,38]. Precision may be defined as the model’s total number of positive predictions divided by the number of genuine positive predictions. The model’s recall is calculated by dividing the total number of genuine positive predictions by the number of real positive cases found in the data [39,40]. Additionally, the research considers other metrics such as F1score, which is determined by taking the harmonic mean of the recall and accuracy of the model, and False Alarm Rate (FAR), which measures the number of false positives relative to all negatives and is a common metric for assessing a model’s accuracy. A false positive occurs when a model predicts something incorrectly, whereas a correct prediction generates a negative. Evaluating a model’s accuracy often involves considering its false alarm rate and a lower rate is indicative of a higher level of accuracy [41,42].
5.2. AUC and ROC
The Receiver Operating Characteristic (ROC) and Area Under the Curve (AUC) are common assessment metrics for binary classification problems. The performance of a binary classifier at various classification thresholds is shown graphically via the ROC curve. Plotting the true positive rate (TPR) vs the false positive rate (FPR) at different threshold levels is how it is made. A helpful tool for assessing the effectiveness of various classifiers is the ROC curve. Higher AUC scores indicate better separation of the two classes, making them superior classifiers. The area under the ROC curve is represented by a single-value statistic called AUC, on the other hand. Higher values correspond to greater classifier performance; the range is 0 to 1. An overall indicator of the classifier’s capacity to distinguish between positive and negative classes across all potential thresholds is provided by the AUC. Both AUC and ROC are useful metrics for evaluating the performance of a binary classifier, especially when the two classes have imbalanced data distribution.
5.3. Experiment Analysis
Our research involves experimenting with seven machine learning models on the dataset. These models include logistic regression, SVM, decision tree, Random Forest, decision tree-xgb classifier, decision tree with feature selection, and Random Forest with feature selection.
5.4. Hyper-Parameter Tuning
After defining the performance matrix, the initial experiment focuses on Logistic Regression. Table 4 details the step-by-step implementation of Logistic regression, considering hyperparameters such as penalty and alpha. Hyperparameter tuning is conducted using the grid search method. Subsequently, the linear support vector classifier is explored, utilizing the same hyperparameters (penalty and alpha) for tuning. Following the assessment of logistic regression and linear support vector machine models, attention shifts to the decision tree model. Despite obtaining a lower AUC compared to the linear support vector model, efforts are made to enhance the decision tree model’s accuracy. Three hyperparameters, namely “min_sample_leaf”, “min_sample_split”, and “max_depth”, are considered for tuning. Optimal values for “min_sample_split” and “max_depth” are determined to be 6 and 10, respectively. Hyperparameter tuning for “min_sample_leaf” reveals its optimal value as 9.
Table 4.
Logistic regression—steps-by-step implementation.
After evaluating the Decision Tree model, the subsequent experiment involves implementing the Random Forest model. Through a train and cross-validation (CV) approach, optimal hyperparameters are identified as criterion = “gini”, Max_depth = 22, min_sample_split = 6, n_estimators = 300, and n_jobs = −1. The Gradient Boosted Decision Tree model requires adjustment of several hyperparameters, including “learning_rate”, “max_depth”, “colsample_bylevel”, “subsample”, and “n_estimators”. Experimentation with various parameter combinations reveals the significant influence of ‘learning_rate’, and to a lesser extent, ‘max_depth’ and ‘n_estimators’, while the impact of the other two parameters is minimal. The best hyperparameters for the model are determined as ‘n_estimators’: 400, ‘max_depth’: 12, ‘learning_rate’: 0.1, ‘colsample_bylevel’: 0.5, and ‘subsample’: 0.1.
5.5. Models with Important Features
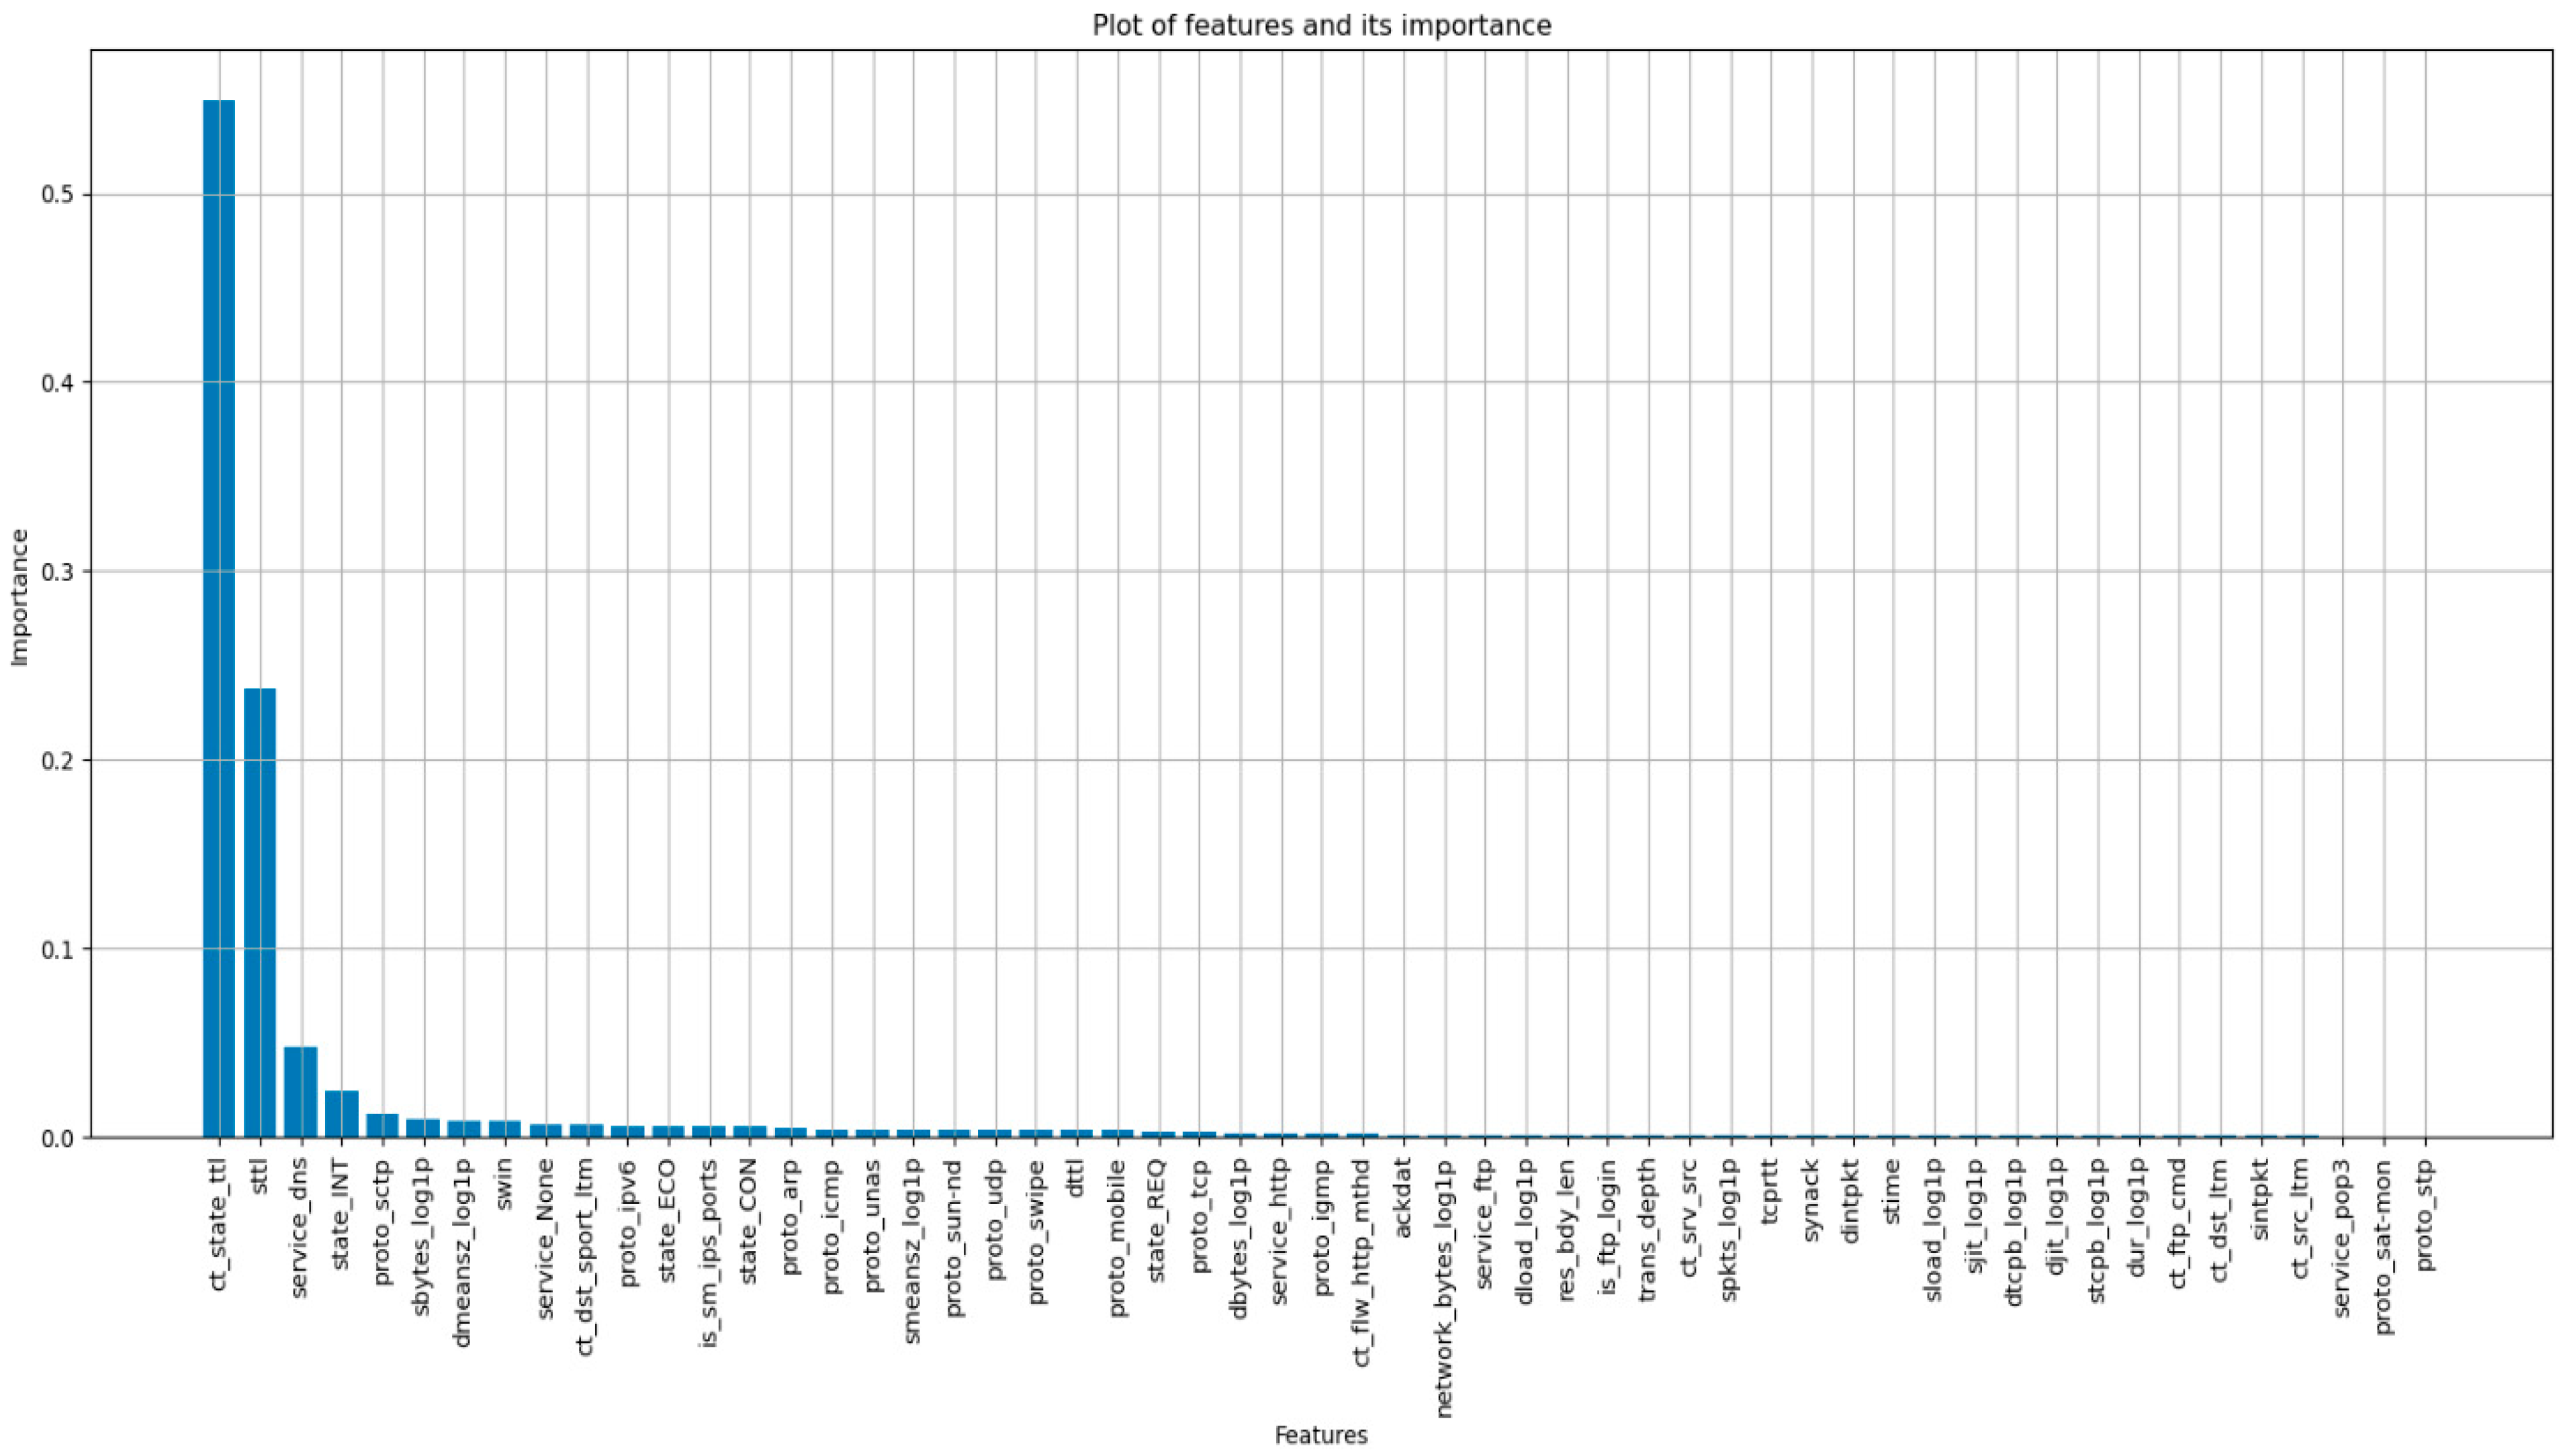
The process of choosing a subset of suitable features from a larger collection of characteristics to enhance a machine learning model’s performance is known as feature selection. The dataset contains 197 features, but not all of them hold equal importance. Therefore, to identify the important features, the XBGClassifier feature importance method was utilized. This method revealed 55 significant features, as illustrated in Figure 2. Subsequently, we retrained the decision tree and Random Forest models using these important features.
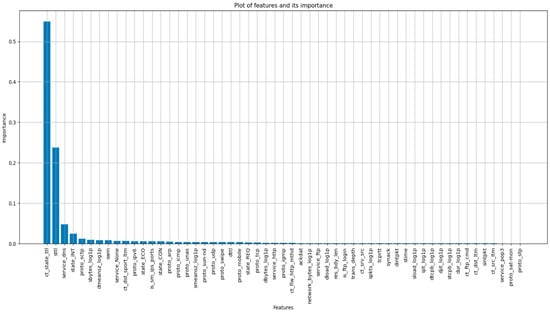
Figure 2.
Plot of importance of Features.
Once all the crucial features were identified, we retrained the decision tree model with consistent parameters (min_sample_split = 6, max_depth = 1, min_sample_leaf = 9). Similarly, the Random Forest model was assessed using the identified important features, maintaining the same hyperparameters (criterion = ‘gini’, max_depth = 22, min_samples_split = 6, n_estimators = 300, n_jobs = −1). The inclusion of significant characteristics resulted in improved performance for the Random Forest model, yielding the highest f1-score among all models. Table 5 and Table 6 present AUC values and confusion matrices for training and testing across all algorithms. The logistic regression model achieved a balanced AUC of 0.98 on both datasets, with a corresponding confusion matrix indicating strong overall performance, though with a higher count of false negatives. The linear SVM surpassed logistic regression, attaining 99.17% accuracy on the training set and 99.16% on the test set, showcasing minimal overfitting. The confusion matrix revealed increased true positives and true negatives.
Table 5.
AUC results for training and test datasets for all ML algorithms.
Table 6.
Confusion matrix of all ML models.
The decision tree model demonstrated an AUC of 98.79% on training data and 98.77% on the test data, with a balanced performance and an improved f1-score of 96.28%. The confusion matrix indicated a reduction in false positives. The Random Forest model exhibited AUC values of 99.26% and 98.56% on the training and testing datasets, respectively, suggesting slight overfitting. Notably, false positives were significantly reduced in this model, as depicted in the confusion matrix. The gradient-boosted decision tree (GBDT) using Xgboost showed a small gap between training and testing scores, hinting at potential overfitting. The confusion matrix revealed nearly equal numbers of false negatives and false positives. Comparing decision tree models with and without important features, a slight improvement in false positives was observed. No significant overfitting was detected, and the accuracy reached 98.77% on the training dataset and 98.73% on the testing dataset. The Random Forest model with important features demonstrated increased true positives and true negatives compared to the model without feature selection, with AUC values indicating no overfitting, achieving 99.41% on the training dataset and 98.63% on the testing dataset.
In terms of the confusion matrix values, Logistic Regression has 1,539,416 true positives (TP) and 219,541 true negatives (TN) in training, highlighting its proficiency in distinguishing between positive and negative instances. Linear SVM, achieving 1,532,183 TP and 224,438 TN during training, also demonstrates robust classification capabilities. Decision Tree excels with 1,539,546 TP and 221,681 TN, indicating its effectiveness in capturing intricate data relationships. Random Forest has 1,241,042 TP and 177,687 TN, highlighting its prowess in handling diverse data patterns. In testing, these models sustain their competence, reflecting the reliability of their learned patterns. Logistic Regression maintains precision with 660,174 TP and 93,652 TN. Linear SVM continues its strong performance with 657,023 TP and 95,784 TN. Decision Tree upholds its effectiveness with 660,123 TP and 94,587 TN. Random Forest demonstrates its capability with 663,950 TP and 93,630 TN. The Gradient Boosted Decision Tree impresses with 663,662 TP and 93,838 TN. Decision Tree with Feature Selection exhibits proficiency with 660,125 TP and 94,511 TN. Finally, Random Forest with Feature Selection sustains precision with 664,054 TP and 93,755 TN.
The results of seven machine learning models applied to the UNSW_NB15 dataset are presented in Table 7, showing their overall performance based on three evaluation metrics: Accuracy, Precision, Recall, F1-Score, and FAR. The Random Forest managed to achieve the highest accuracy score of 0.994 and 0.9945 for Random Forest and Random Forest with feature selection, respectively. Moreover, the precision, recall and f1 score were higher than 99.5% for both showing the stability of the detection of the model. Decision trees based on the Boost, decision trees and decision trees with feature selection also secured high accuracy with an accuracy of 0.9941, 0.9904 and 0.9903, respectively. Logistic regression and linear regression managed to get accuracy scores of 0.9893 and 0.9879, respectively, with high precision, recall and F1 score. In general, both precision and recall have reasonably good results which shows that the models have not overfitted. In terms of the FAR, Random Forest with feature selection and Random Forest have the lowest values with 0.0194 and 0.0204, respectively. The other models’ FAR ranges between 2.3 % and 8.4%, and more false alarms can be generated during detection. Therefore, the study concludes that the Random Forest ML model can be utilized to enhance the accuracy of cyber-attack detection.
Table 7.
Performance Evaluation for all ML models.
The observed can be attributed to various factors including model complexity, data importance and data imbalance. Model complexity, given the dataset’s 49 features, is one of these factors in which SVM and Decision Tree models are capable of handling data relationships, and exhibited high accuracy and recall scores. SVM, with the highest accuracy at 0.991621 and a recall of 0.9995, showcased its effectiveness in managing complex patterns. The Decision Tree model, achieving an accuracy of 0.987722 and a recall of 0.9977, also demonstrated competitive performance. Feature importance, especially highlighted in Random Forest and Decision Tree models with feature selection, emphasized the impact of identifying essential features on precision and recall. Random Forest, in particular, achieved an accuracy of 0.985477, precision of 0.9971, and recall of 0.9963. Ensemble methods, like Random Forest, known for their ability to reduce overfitting, contributed to competitive performance across multiple metrics. The significance of hyperparameter tuning was evident, with SVM’s fine-tuned configuration resulting in an accuracy of 0.991621 and a recall of 0.9995. Data imbalance introduced additional complexities, influencing precision, recall, and false alarm rates differently. The Decision Tree with Features and Random Forest with Feature selection underscored the impact of specific feature handling on overall performance. Lastly, algorithm sensitivity, with SVM excelling in handling specific patterns in the dataset, further contributed to the observed variations.
5.6. Comparative Analysis of the Models Implemented
Table 8 provides a comparison and evaluation between the proposed models and those featured in the existing studies, focusing on their accuracy metrics. The proposed logistic regression model stands out with an exceptional accuracy of 98.28%, clearly surpassing the accuracy reported in the logistic regression models implemented in [15]. Furthermore, the SVM, decision tree, and Random Forest models introduced in [18] all yielded lower accuracy scores when compared to the proposed model, reaffirming its superior performance across these algorithms. The stack model, as detailed in [19], demonstrated a commendable accuracy of 96.24%. However, the proposed model outshines even this, registering a slightly higher accuracy. Finally, in the context of [21], where an SVM model was implemented, the reported accuracy of 98.92% was less than the proposed model, which achieved an outstanding accuracy of 99.16%. This comprehensive analysis highlights the consistent excellence of the proposed model.
Table 8.
Result comparison of the proposed models.
6. Conclusions and Future Work
Cyber-attacks are a rapidly growing concern that poses a significant threat to global security. This study addresses this issue head-on by experimenting with the use of machine learning to detect and protect networks from these malicious acts. The study uses the UNSW_NB15 dataset, published by the ACCS lab in Australia, which contains 25,40,044 records. The dataset underwent various data cleansing and pre-processing activities to achieve the highest possible accuracy and the lowest false alarm rate. A variety of machine learning algorithms such as Logistic Regression, Support Vector Machines, Decision Trees, and Random Forests are used to solve this classification problem. The dataset is divided into training and testing sets, and some experiments were carried out on them to evaluate the effectiveness of the search. By experimenting with the feature selection approach, this study found that the Random Forest model has the highest accuracy of 99.45% and the lowest false alarm rate of 1.94% compared to the other recently published models. Although it is of a low value, the FAR will impact on the network bandwidth depending on the actions taken upon the intrusions being detected. When an IDS host detects an intrusion (but a false detection), it might coordinate and take actions with surrounding hosts of the same network. In such a case, unnecessary data exchange will occur, which will generate unnecessary network traffic, reducing an effective network bandwidth for data transmission. The penalty will be proportional to the value of FAR and the number of hosts involved in the intrusion detections and actions.
This study not only demonstrates the effectiveness of machine learning in protecting networks from cyber-attacks, but it also highlights the crucial role of analytics in the cyber security world. The results of this study conclusively show that the Random Forest model is an efficient and superior approach for detecting cyber-attacks and securing networks. Overall, this research provides valuable insights into the potential of machine learning as a tool for defending against cyber-attacks and protecting networks.
Although impressive accuracy and F1-score results were achieved in the experiment, there is still room for improvement and further optimization. More testing is necessary to evaluate the experiment’s performance on actual network traffic data, and new network-related features can be derived from existing features. Additionally, it would be beneficial to experiment on a balanced dataset. There is a significant scope to experiment with deep learning and artificial neural networks. While the current accuracy is close to 100%, it is insufficient for a Network Intrusion Detection System, and additional research should focus on developing new methodologies and approaches to improve its performance.
Author Contributions
Conceptualization, S.M. and A.T.A.; methodology, S.M. and A.T.A.; software, S.M.; validation, S.M., M.I., H.M. and A.T.A.; formal analysis, S.M. and M.I.; investigation, S.M., M.I., H.M. and A.T.A.; resources, S.M. and A.T.A.; data curation, S.M. and M.I.; writing—original draft preparation, S.M.; writing—review and editing, M.I., H.M. and A.T.A.; visualization, S.M. and M.I.; supervision, M.I., H.M. and A.T.A.; project administration, A.T.A.; funding acquisition, A.T.A. All authors have read and agreed to the published version of the manuscript.
Funding
The work of A.T.A. was supported in part by the Monash University Indonesia—Seed Grant, grant number IF112034.
Data Availability Statement
Publicly available datasets were analyzed in this study. This data can be found here: https://research.unsw.edu.au/projects/unsw-nb15-dataset (accessed on 3 January 2024).
Acknowledgments
The work of A.T.A. was started when he was affiliated full-time with Birmingham City University, Birmingham, UK.
Conflicts of Interest
The authors declare no conflicts of interest.
References
- Liu, H.; Lang, B. Machine learning and deep learning methods for intrusion detection systems: A survey. Appl. Sci. 2019, 9, 4396. [Google Scholar] [CrossRef]
- Vinayakumar, R.; Alazab, M.; Soman, K.P.; Poornachandran, P.; Al-Nemrat, A.; Venkatraman, S. Deep learning approach for intelligent intrusion detection system. IEEE Access 2019, 7, 41525–41550. [Google Scholar] [CrossRef]
- Almseidin, M.; Alzubi, M.; Kovacs, S.; Alkasassbeh, M. Evaluation of machine learning algorithms for intrusion detection systems. In Proceedings of the IEEE 15th International Symposium on Intelligent Systems and Informatics (SISY), Subotica, Serbia, 14–16 September 2017; pp. 000277–000282. [Google Scholar]
- Aldweesh, A.; Derhab, A.; Emam, A.Z. Deep learning approaches for anomaly-based intrusion detection systems: A survey, taxonomy, and open issues. Knowl.-Based Syst. 2020, 189, 105124. [Google Scholar] [CrossRef]
- Kumar, V.; Sinha, D.; Das, A.K.; Pandey, S.C.; Goswami, R.T. An integrated rule-based intrusion detection system: Analysis on UNSW-NB15 data set and the real time online dataset. Clust. Comput. 2020, 23, 1397–1418. [Google Scholar] [CrossRef]
- Kasongo, S.M.; Sun, Y. Performance Analysis of Intrusion Detection Systems Using a Feature Selection Method on the UNSW-NB15 Dataset. J. Big Data 2020, 7, 105. [Google Scholar] [CrossRef]
- Saba, T.; Rehman, A.; Sadad, T.; Kolivand, H.; Bahaj, S.A. Anomaly-based intrusion detection system for IoT networks through deep learning model. Comput. Electr. Eng. 2022, 99, 107810. [Google Scholar] [CrossRef]
- Abdulhammed, R.; Faezipour, M.; Abuzneid, A.; AbuMallouh, A. Deep and machine learning approaches for anomaly-based intrusion detection of imbalanced network traffic. IEEE Sens. Lett. 2018, 3, 1–4. [Google Scholar] [CrossRef]
- Savas, O.; Deng, J. Big Data Analytics in Cybersecurity; CRC Press: Boca Raton, FL, USA, 2017; Available online: https://www.google.co.uk/books/edition/Big_Data_Analytics_in_Cybersecurity/KD0PEAAAQBAJ?hl=en&gbpv=1&printsec=frontcover (accessed on 11 January 2023).
- Mishra, S.; Tyagi, A.K. The Role of Machine Learning Techniques in Internet of Things-Based Cloud Applications. In Internet of Things; Springer: Berlin/Heidelberg, Germany, 2022; pp. 105–135. [Google Scholar] [CrossRef]
- Zhang, F.; Kodituwakku, H.A.D.E.; Hines, J.W.; Coble, J. Multilayer Data-Driven Cyber-Attack Detection System for Industrial Control Systems Based on Network, System, and Process Data. IEEE Trans. Ind. Inform. 2019, 15, 4362–4369. [Google Scholar] [CrossRef]
- Mahmood, T.; Afzal, U. Security Analytics: Big Data Analytics for cybersecurity: A review of trends, techniques and tools. In Proceedings of the 2013 2nd National Conference on Information Assurance (NCIA), Rawalpindi, Pakistan, 11–12 December 2013; pp. 129–134. [Google Scholar] [CrossRef]
- Rajawat, A.S.; Bedi, P.; Goyal, S.B.; Shaw, R.N.; Ghosh, A. Reliability Analysis in Cyber-Physical System Using Deep Learning for Smart Cities Industrial IoT Network Node. In AI and IoT for Smart City Applications; Piuri, V., Shaw, R.N., Ghosh, A., Islam, R., Eds.; Studies in Computational Intelligence; Springer: Singapore, 2022; Volume 1002. [Google Scholar] [CrossRef]
- Jing, D.; Chen, H.-B. SVM Based Network Intrusion Detection for the UNSW-NB15 Dataset. In Proceedings of the 2019 IEEE 13th International Conference on ASIC (ASICON), Chongqing, China, 29 October–1 November 2019; pp. 1–4. [Google Scholar] [CrossRef]
- Zhiqiang, L.; Mohi-Ud-Din, G.; Bing, L.; Jianchao, L.; Ye, Z.; Zhijun, L. Modeling Network Intrusion Detection System Using Feed-Forward Neural Network Using UNSW-NB15 Dataset. In Proceedings of the 2019 IEEE 7th International Conference on Smart Energy Grid Engineering (SEGE), Oshawa, ON, Canada, 12–14 August 2019; pp. 299–303. [Google Scholar] [CrossRef]
- Moualla, S.; Khorzom, K.; Jafar, A. Improving the performance of machine learning-based network intrusion detection systems on the UNSW-NB15 dataset. Comput. Intell. Neurosci. 2021, 2021, 1–13. [Google Scholar] [CrossRef]
- Tahri, R.; Jarrar, A.; Lasbahani, A.; Balouki, Y. A comparative study of Machine learning Algorithms on the UNSW-NB 15 Dataset. In ITM Web of Conferences; EDP Sciences: Tangier, Morocco, 2022; Volume 48, p. 03002. [Google Scholar]
- Belouch, M.; El Hadaj, S.; Idhammad, M. Performance evaluation of intrusion detection based on machine learning using Apache Spark. Procedia Comput. Sci. 2018, 127, 1–6. [Google Scholar] [CrossRef]
- Kabir, M.H.; Rajib, M.S.; Rahman, A.S.M.T.; Rahman, M.M.; Dey, S.K. Network Intrusion Detection Using UNSW-NB15 Dataset: Stacking Machine Learning Based Approach. In Proceedings of the 2022 International Conference on Advancement in Electrical and Electronic Engineering (ICAEEE), Gazipur, Bangladesh, 24–26 February 2022; pp. 1–6. [Google Scholar] [CrossRef]
- Chkirbene, Z.; Eltanbouly, S.; Bashendy, M.; AlNaimi, N.; Erbad, A. Hybrid machine learning for network anomaly intrusion detection. In Proceedings of the 2020 IEEE International Conference on Informatics, IoT, and Enabling Technologies (ICIoT), Doha, Qatar, 2–5 February 2020; pp. 163–170. [Google Scholar]
- Gu, J.; Lu, S. An effective intrusion detection approach using SVM with naïve Bayes feature embedding. Comput. Secur. 2021, 103, 102158. [Google Scholar] [CrossRef]
- Besharati, E.; Naderan, M.; Namjoo, E. LR-HIDS: Logistic regression host-based intrusion detection system for cloud environments. J. Ambient Intell. Hum. Comput. 2019, 10, 3669–3692. [Google Scholar] [CrossRef]
- Bhusal, N.; Gautam, M.; Benidris, M. Detection of Cyber Attacks on Voltage Regulation in Distribution Systems Using Machine Learning. IEEE Access 2021, 9, 40402–40416. [Google Scholar] [CrossRef]
- Kumar, M.N.; Koushik, K.V.S.; Deepak, K. Prediction of heart diseases using data mining and machine learning algorithms and tools. Int. J. Sci. Res. Comput. Sci. Eng. Inf. Technol. 2018, 3, 887–898. [Google Scholar]
- Lee, S.J.; Yoo, P.D.; Asyhari, A.T.; Jhi, Y.; Chermak, L.; Chan, Y.Y.; Taha, K. IMPACT: Impersonation attack detection via edge computing using deep autoencoder and feature abstraction. IEEE Access 2020, 8, 65520–65529. [Google Scholar] [CrossRef]
- Rahman, M.A.; Asyhari, A.T.; Leong, L.S.; Satrya, G.B.; Tao, M.H.; Zolkipli, M.F. Scalable machine learning-based intrusion detection system for IoT-enabled smart cities. Sustain. Cities Soc. 2020, 61, 102324. [Google Scholar] [CrossRef]
- Apruzzese, G.; Andreolini, M.; Colajanni, M.; Marchetti, M. Hardening Random Forest Cyber Detectors Against Adversarial Attacks. In IEEE Transactions on Emerging Topics in Computational Intelligence; IEEE: New York, NY, USA, 2020; Volume 4, pp. 427–439. [Google Scholar] [CrossRef]
- Najar, A.A.; Manohar Naik, S. DDoS attack detection using MLP and Random Forest Algorithms. Int. J. Inf. Technol. 2022, 14, 2317–2327. [Google Scholar] [CrossRef]
- Cervantes, J.; Garcia-Lamont, F.; Rodríguez-Mazahua, L.; Lopez, A. A comprehensive survey on support vector machine classification: Applications, challenges and trends. Neurocomputing 2020, 408, 189–215. [Google Scholar] [CrossRef]
- Kolias, C.; Kambourakis, G.; Stavrou, A.; Gritzalis, S. Intrusion detection in 802.11 networks: Empirical evaluation of threats and a public dataset. IEEE Commun. Surv. Tutor. 2016, 18, 184–208. [Google Scholar] [CrossRef]
- Moustafa, N. The UNSW-NB15 Dataset, Research Data Australia. Available online: https://researchdata.edu.au/the-unsw-nb15-dataset/1957529 (accessed on 9 November 2023).
- The UNSW-NB15 Dataset (no Date) The UNSW-NB15 Dataset|UNSW Research. Available online: https://research.unsw.edu.au/projects/unsw-nb15-dataset (accessed on 9 November 2023).
- Huang, J.; Li, Y.F.; Xie, M. An empirical analysis of data preprocessing for machine learning-based software cost estimation. Inf. Softw. Technol. 2015, 67, 108–127. [Google Scholar] [CrossRef]
- Miranda-Calle, J.D.; Reddy, C.V.; Dhawan, P.; Churi, P. Exploratory data analysis for cybersecurity. World J. Eng. 2021, 18, 734–749. [Google Scholar] [CrossRef]
- Network Fields: Elastic Common Schema (ECS) Reference [Master] (no Date) Elastic. Available online: https://www.elastic.co/guide/en/ecs/master/ecs-network.html (accessed on 9 November 2023).
- Kocher, G.; Kumar, G. Analysis of machine learning algorithms with feature selection for intrusion detection using UNSW-NB15 dataset. Int. J. Netw. Secur. Its Appl. 2021, 13, 21–31. [Google Scholar]
- Dickson, A.; Thomas, C. Analysis of UNSW-NB15 Dataset Using Machine Learning Classifiers. In Proceedings of the Machine Learning and Metaheuristics Algorithms, and Applications: Second Symposium, SoMMA 2020, Chennai, India, 14–17 October 2020; Revised Selected Papers 2. Springer: Singapore, 2021; pp. 198–207. [Google Scholar]
- Choudhary, S.; Kesswani, N. Analysis of KDD-Cup’99, NSL-KDD and UNSW-NB15 datasets using deep learning in IoT. Procedia Comput. Sci. 2020, 167, 1561–1573. [Google Scholar] [CrossRef]
- Grandini, M.; Bagli, E.; Visani, G. Metrics for multi-class classification: An overview. arXiv 2020, arXiv:2008.05756. [Google Scholar]
- Lipton, Z.C.; Elkan, C.; Narayanaswamy, B. Thresholding classifiers to maximize F1 score. arXiv 2014, arXiv:1402.1892. [Google Scholar]
- Tama, B.A.; Comuzzi, M.; Rhee, K.H. TSE-IDS: A two-stage classifier ensemble for intelligent anomaly-based intrusion detection system. IEEE Access 2019, 7, 94497–94507. [Google Scholar] [CrossRef]
- Primartha, R.; Tama, B.A. Anomaly detection using random forest: A performance revisited. In Proceedings of the 2017 International Conference on Data and Software Engineering (ICoDSE), Palembang, Indonesia, 1–2 November 2017; pp. 1–6. [Google Scholar]

Disclaimer/Publisher’s Note: The statements, opinions and data contained in all publications are solely those of the individual author(s) and contributor(s) and not of MDPI and/or the editor(s). MDPI and/or the editor(s) disclaim responsibility for any injury to people or property resulting from any ideas, methods, instructions or products referred to in the content. |
© 2024 by the authors. Licensee MDPI, Basel, Switzerland. This article is an open access article distributed under the terms and conditions of the Creative Commons Attribution (CC BY) license (https://creativecommons.org/licenses/by/4.0/).