1. Introduction
Multi-attribute decision making is a key part of modern decision science, which is used to solve the problem of optimal selection and ranking. It is widely used in technology, engineering, management, and other fields, and mainly deals with evaluation and selection. The VIKOR method is a powerful tool to help decision makers find the best compromise solution between multiple attributes or objectives. It takes into account the concepts of compromise and balance, as well as the subjective tendencies of relevant decision makers, which can provide valuable solutions in complex decision problems. Many researchers have developed various extensions and improvements of the VIKOR method, which can play a more effective role in various application scenarios. Chiranjibe et al. [
1] proposed an improved version of the improved type-2 fuzzy interval VIKOR method (IT2FVIKOR) in order to obtain better ranking results for the MCDM problem. Alhadidi et al. [
2] introduced the FAHP weight into the VIKOR and proposed a new FAHP-VIKOR method. Zhang et al. [
3] proposed a VIKOR method According to regret theory. Yu et al. [
4] proposed a novel T-SF VIKOR method for tradeoff ranking in multicriteria analysis to adapt to complex real-world environments. Arunodaya et al. [
5] proposed an innovative multi-attribute decision making method by combining FHFSs and improved VIKOR. Although these extended VIKOR methods have their own characteristics, they all follow the basic principle of calculating individual regret value, group utility value, and decision index value, so as to obtain the final ranking. These methods improve the steps of VIKOR and introduce other concepts. At the same time, some studies have pointed out that the traditional MCDM method can only rank schemes, but not classify them. Zhang et al. [
6] saw unity in multi-attribute and three-way decisions as a viable research path, proposing a new TOPSIS method based on three-way decisions. Bisht et al. [
7] also believed that three-way decision making increases delayed decision and can efficiently cope with multi-attribute decision making by reducing decision risk. Therefore, the VIKOR method can be considered to combine with the three-way decisions to take into account both classification and ranking.
Based on human cognitive processes, a three-way decision model is constructed. People often put off making decisions that require deliberation. Three-way decisions solve complex problems by dealing with three different parts, so that the VIKOR method can deal with decision complexity, consider cost and uncertainty, and complete classification and ranking. Wang et al. [
8] proposed a three-way decision model on account of the third-generation prospect theory, introduced the α model and β model optimization of digital threshold solution, and simplified the three-way decision rules. Yang et al. [
9] generalize the related work of three-way decisions through complex network analysis. Zhan et al. [
10] combined regret theory with IIS prospect theory and proposed a new three-way decision method to further combine three-way decisions with behavioral decisions. Subhashini et al. [
11] proposed an opinion classification method combining three-way decisions with fuzzy concepts and semantic concepts to solve the problem of reducing the boundary area and maintaining high accuracy. In order to deal with the stability of the conflict system being affected by different preferences of decision makers, Jiang et al. [
12] combined three-way decisions and conflict analysis with a grey system to establish a new conflict analysis model. In order to reduce the risk of decision-making errors and express linguistic uncertainty, Luo et al. [
13] combined double-layer hesitant fuzzy term sets with multi-attribute three-way decision making. Recently, researchers focused on making reasonable decisions with limited info to reduce decision risks. Qi et al. [
14] combined the fuzzy attribute concept with the three-way decision model and utility theory and proposed the three-way utility decision model. In multilevel data, obtaining acceptable decisions at various granularities is crucial. Qian et al. [
15] proposed a multi-granularity hierarchical sequential three-way decision model to advance three-way decisions. Yi et al. [
16] combined Sigmoid utility with three-way decisions using Pythagorean fuzzy sets to solve related problems. Wang et al. [
17] constructed three fuzzy hesitant three-way decision methods to calculate the contingent probability of the target in the fuzzy hesitant information decision system without class labels. Pan et al. [
18] combined three-way decisions with interval values to propose a new method for solving multi-attribute decision-making problems in uncertain environments. In order to reduce the influence of different attribute types on decision results, Yan et al. [
19] integrated TOPSIS and regret theory into three-way decisions to settle multi-attribute decision-making difficulties in fuzzy environments without changing attribute types. The integration of three-way decisions and granular computing offered a befitting idea and method for the thinking of cognitive science and the trialization of information processing. Sequential three-way decisions are a classic representation of three-way granular computing, which makes multi-stage decisions through a series of transaction-optimization (TAO) models. Yang et al. [
20] integrated three-way decisions and multiple granularities to enhance the domain system’s hierarchy and structure. Creating a sequential three-way decisions model that combines three-way decisions and granular computing is becoming more and more important in classification. Pei et al. [
21] proposed four three-way sequential classifiers in order to solve the issue of the coarse and fine granularity of objects potentially causing conflict and thus affecting the decision accuracy. S3WD uses coarse-to-fine information granularity. Yu et al. [
22] addressed granularity construction and decision cost in the three-way sequential decision model, verified the model’s correctness and algorithm’s feasibility, and solved the double constraint problem. The sequential three-way decision method, enhanced by multi-level granularity, is proven effective for solving human problems. Ju et al. [
23] introduced a novel rational subspace classifier that outperforms advanced classifiers with fewer attributes. Combining granularity and multi-levels, this method efficiently handles uncertainty and dynamics in decision making.
The aforementioned researchers proposed improvements and extensions to the VIKOR method and three-way decisions to tailor them to their research fields. However, these enhancements did not integrate VIKOR with three-way decisions; VIKOR improvements focused solely on prioritization without classification. Similarly, three-way decision enhancements neglected ranking alternatives. This paper combines sequential three-way decisions with an improved VIKOR method, incorporating decision-makers’ subjective tendencies and considering both maximizing team utility and minimizing individual regret. It argues that relying solely on team utility or individual regret for classification and judgment can lead to significant errors. Instead, it constructs a sequential three-way decision model considering both values. VIKOR classifies schemes into three regions using three-way sequential decisions. Ranking rules and formulas based on intradomain and cross-domain comparisons are proposed, and their correctness and applicability are demonstrated through an example.
Section 2 introduces the basics of three-way sequential decisions and multi-attribute decisions.
Section 3 proposes the sequential three-way VIKOR method based on individual regret or group utility values, studying ordering rules within and across different areas.
Section 4 introduces the sequential three-way VIKOR method considering both individual regret and team utility values, verifying its feasibility.
Section 5 assesses the method’s reliability and usefulness using a real-world engineering investment case study.
Section 6 concludes the paper.
3. VIKOR Model of Sequential Three-Way Decisions Based on Individual Regret Value or Group Utility Value
Group utility value is a quantitative representation of decision-makers’ views and attitudes towards gain and loss effects, which is used to measure decision-makers’ subjective tendencies and preferences for certain things. The loss caused by the decision maker’s mistake is represented by the individual regret value, which is a special measure of the optimal value compared to other values in the scheme. In the VIKOR method, the individual regret value and group utility value are obtained by calculating the “specific measure” between the ideal solution and each alternative. The smaller value of the group utility value means the greater group utility of the corresponding alternative, and the larger value of the individual regret value means the greater individual regret of the corresponding alternative. In practical decision problems, more values can be deduced and calculated based on one or two ideal alternatives to rank all alternatives, but the ranking results must follow certain rules.
For example, if the group utility value of scheme is smaller than scheme , it means that scheme has greater group utility than scheme , and then should be better than . Conversely, if the individual regret value of is less than that of , the result should be that is inferior to .
In order to easily determine the importance degree of an alternative, this study first considers a single individual regret value or group utility value. It classifies the alternatives by the single value calculated for each alternative, as well as the ideal alternative using three-way sequential decisions. Different regions are assigned corresponding alternatives according to the maximum individual regret value or minimum group utility value among the alternatives. Finally, all the schemes are ranked based on the ranking rules of the different region or same regions. Next, the three-way sequential VIKOR model according to the minimum group utility value and the three-way sequential VIKOR model according to the maximum individual regret value are introduced.
3.1. Squential Three-Way VIKOR Model Based on Minimum Group Utility Value
The key step of this model is to derive the group utility value corresponding to each alternative through alternatives, NIS, and PIS, and then classify the alternatives through three-way sequential decisions. The decision index value is calculated according to the measurement formula, and the ultimately ranking result is obtained through the ranking regulations of different regions and the same region. Therefore, the next step is to give the definition of PIS and NIS, as well as the measurement formula and the corresponding scheme comparison process.
Definition 2. Worst solution (NIS) and optimal solution (PIS) of the alternatives attribute matrix.
Where is the condition attribute, the cost attribute set is , the benefit attribute set is , and the alternative and attribute sets are and .
According to the calculation results of the above formula, the NIS and PIS of all alternatives can be obtained, and then the group utility value of each alternative can be obtained on the basis of NIS and PIS. A smaller group utility value means that the corresponding scheme has better group utility.
Definition 3. Let there be alternatives, , , and a weight set , then the group utility value of alternative is defined as follows:where is the group utility value of the th scheme. Theorem 1. The schemes in the negative region are inferior to the schemes in the positive region, that is, the ranking rules belonging to the schemes in different regions are derived from the group utility values of all the schemes calculated.
Proof of Theorem 1. The alternatives in the positive region have relatively small group utility values and relatively large group utility. The alternatives that are in the negative region have larger group utility values and smaller group utility values. Therefore, the scheme for the negative region is inferior to the scheme for the positive region. To sum up, . □
Since three-way sequential decisions can only classify the alternatives, it is necessary to introduce an integral operator to rank the schemes in the different region and same regions. Opricovi et al. [
28] used the decision index value combining individual regret value and group utility value to rank, and the decision-making mechanism coefficient could help realize the minimization of single regret and the maximization of group utility. The larger the mechanism coefficient of decision-making process is, the more attention should be paid to the group maximum utility rather than the single regret. A smaller value of the decision index indicates a better alternative. By maximizing the team utility and minimizing the single regret, the compromise solution of each attribute of the alternative is obtained. The decision index value is defined as follows:
where,
denotes the decision index value of the
th alternative,
,
,
, the weights of maximum team utility and decision index coefficients are
, and
is usually assumed. According to Equation (5), the magnitude of
value is related to the difference between
and
,
and
.
is closer to
and
is closer to
. That is, the single regret value of the scheme is closer to the minimum value in the set of single regret values, and the team utility value is also closer to the minimum value in the set of team utility values. Currently, the team utility of the alternative is larger, and the single regret is smaller, and the value of
is smaller. This indicates that the individual regret value and group utility value of the better decision alternative are always as small as possible.
The steps of the three-way sequential VIKOR model according to minimum group utility value are as follows (where Algorithm 1 is used to Step 3):
Step 1. According to Definition 2, the NIS and PIS of the schemes are deduced from the multiple property message table.
Step 2. Calculate the group utility value for each alternative based on Definition 3.
Step 3. Algorithm 1 is used to classify the decision regions of the scheme.
Step 4. The decision index values of each scheme are calculated according to Equation (5).
Step 5. Sort the schemes belonging to the identical decision area in ascending order of their decision index values.
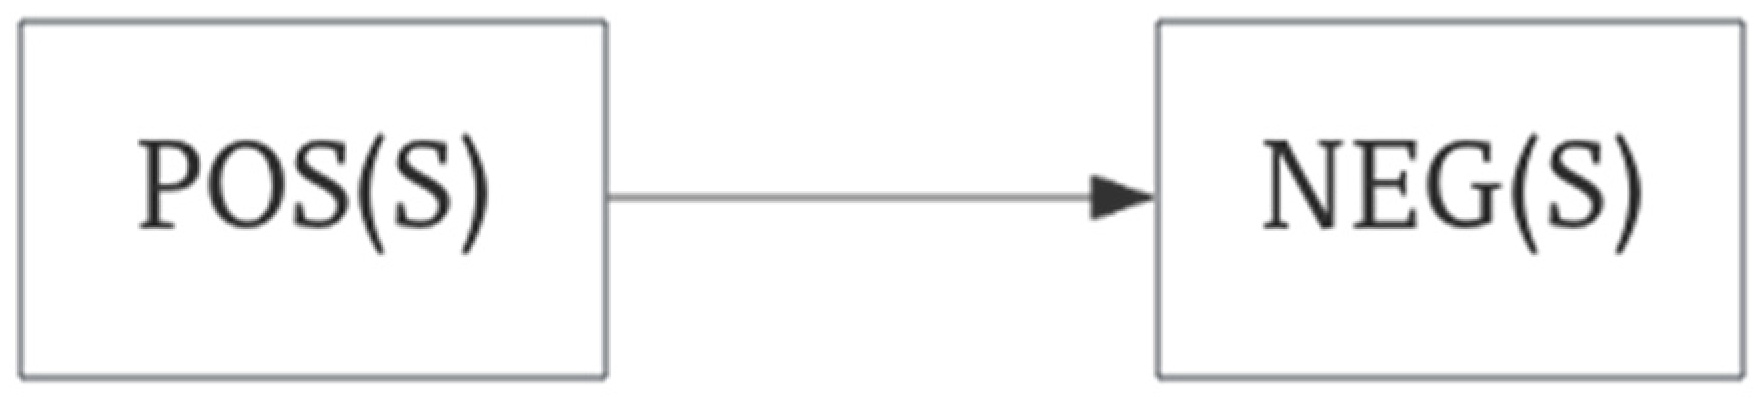
Step 6. The final ranking result is obtained by sorting the ranking rules about different regions shown in
Figure 1.
We will illustrate the time sophistication of Algorithm 1 as follows:
and are obtained in step 4 with a corresponding time sophistication of . Adding and to and in steps 5 to 8, respectively, has a corresponding time sophistication of . Steps 9 and 10 are the sequential process of processing and .
This time sophistication is . Lastly, is the time complexity of Algorithm 1. Next, the working process of the proposed model is briefly explained by an example.
Example 1. Suppose there are 8 alternatives . The attribute set of alternatives consists of two benefit attributes and one cost attribute , and the corresponding weight set is . The normalized attribute evaluation value table is shown in Table 2, and the uniformized determination matrix is expressed as .
(1) calculate PIS and NIS according to Definition 2 from the nature assessing values of all schemes in
Table 2, which can be obtained by
,
.
(2) obtain the team utility value of each alternative by PIS and NIS according to Definition 3. , , , , , , , .
(3) classify all alternatives regionally according to Algorithm 1.
, .
(4) calculate the decision index values of all schemes according to Equation (5) where
represents the decision index value of the
th scheme, which can be obtained by
,
,
,
,
,
,
, and
.
| Algorithm 1 Compute the decision region based on the lowest sequential three-way VIKOR of the group utility value |
input: Group utility values for m alternatives
, .
output: Three decision regions, and ;
1 POS = ∅, BND = {Am}, NEG = ∅, k = 0, S = {Sm};
2 while
3 , ;
4 , ;
5 Add to
6 ;
7 Add to
8 ;
9 ;
10 ;
11 end
12 Output , . |
(5) sort the alternatives in the same region according to the decision index value in ascending order, so that the ranking result in the domain is and the ranking result in domain is .
(6) through the ranking rules of different regional alternatives, , is the final sorting result.
3.2. Sequential Three-Way VIKOR Model Based on Minimum Individual Regret Value
Like the three-way sequential VIKOR model according to the minimum group utility value, the key steps of the ordinal three-way VIKOR model according to the minimum single regret value are to calculate the individual regret value for all alternatives, classify the alternatives using the sequential three-way decision method, calculate the decision indicator value of each scheme, and then sort schemes in the identical area. The final ranking results are acquired through the alternative ranking rules of different regions.
Definition 4. Let there be alternatives
, , , and a weight set is , then the individual regret value of alternative is defined as follows:where denotes the individual regret value of the th alternative. The ordinal three-way VIKOR model based on minimum individual regret value is illustrated as follows:
Step 1. Derive the NIS and PIS of schemes from the multi-attribute information table based on Definition 2.
Step 2. The individual regret value is calculated for each scheme according to Definition 4.
Step 3. Classify the alternatives by a similar procedure as in Algorithm 1.
Step 4. The decision index values of each scheme are calculated according to Equation (5).
Step 5. The schemes belonging to the identical decision area are sorted by the decision index value in ascending order.
Step 6. According to the ordering regulation of different areas, the schemes of different areas are ordered to obtain the final ranking results.
Example 2 (like Example 1)
. The alternatives in Table 2 are calculated according to the above steps, and the final ranking result of the three-way sequential VIKOR model on account of the minimum individual regret value is . It can be acquired through the ranking solutions of all alternatives in Table 2 by the two models, which are different. The final ranking result of the three-way sequential VIKOR model on account of the minimum group utility value is . However, the final ranking result of the three-way sequential VIKOR model on account of the minimum individual regret value is .
In the three-way sequential VIKOR model on account of the minimum group utility value, is divided into the and is divided into the , but in the three-way sequential VIKOR model on account of the minimum individual regret value, is divided into the and is divided into the , which eventually leads to diversities in the ultimate classification of results for the two models. At the same time, the diversity between the final ordering consequences of the two models also verifies this paper’s idea that only considering the single regret value or group utility value to classify and judge the alternatives will lead to large errors, and a single individual regret value and group utility value can only afford incomplete decision information. Thus, to make the ordering consequences of all schemes more accurate, this paper will simultaneously consider the single regret value and group utility value to sort through the three-way sequential decision method. 4. Sequential Three-Way VIKOR Model Based on Group Utility Value and Individual Regret Value
The two models mentioned above mainly classify the alternatives based on the minimum single regret value or group utility value, and then rank the same and different regions by calculating the integral operator formula. Therefore, in the model proposed next, the single regret value and group utility value of alternatives will be considered simultaneously. The three-way sequential VIKOR model will be established on account of the maximum individual regret value and the minimum group utility value. Finally, the sequential three-way VIKOR model will be established on account of the minimum single regret value and the maximum group utility value.
A good scheme should have a small single regret and a large group utility. The previous and the following models are classified on account of the three-way sequential decision method by calculating the single regret value and the group utility value of the scheme. Through the idea of three-way sequential decisions, all the schemes are reasonably and effectively separated into positive, boundary, and negative areas. The alternative is separated into the positive area, which signifies that it should be a good decision scheme and easy to be accepted by the decision maker. Dividing an alternative into a boundary region means that it has a large individual regret value and a small group utility value in the sequential three-way decision process, or on the contrary, that the decision maker needs to delay acceptance or rejection. The alternatives are classified into the negative region, which indicates that they should be inferior decision alternatives and easy to be rejected by decision makers. In the following part, all alternatives are separated into three areas—negative area, boundary area, and positive area—through three-way sequential decisions. Uncertain alternatives are put into the boundary region and the decision is delayed until more basis and support is obtained, to avoid misclassification and avoid the risk caused by directly accepting or rejecting alternatives. After that, the final sorting result is calculated according to the integral operator and the sorting rules of the different region and same regions. Next, the sequential three-way VIKOR model, based the maximum individual regret and the minimum group utility value, and the sequential three-way VIKOR model, based on the minimum individual regret value and the maximum group utility value, will be discussed.
4.1. Sequential Three-Way VIKOR Model Based on Minimum Group Utility Value and Maximum Individual Regret Value
Unlike the previously proposed model according to a single value, the proposed model comprehensively considers the single regret value and the group utility value. In most cases, it is impossible to obtain an accurate decision scheme by only considering the partial decision information corresponding to a single value. The alternative with larger group utility does not necessarily have smaller individual regret, and the decision scheme with smaller individual regret does not necessarily have larger group utility. When dealing with these alternatives, a new method is needed to identify the classification results of the schemes by considering both the single regret value and the group utility value of the alternatives.
Theorem 2. The alternatives with the largest single regret value and group utility value or vice versa are classified as boundary regions in the model. Based on the concept of three-way decisions, a ranking rule considering the alternatives in different regions of the boundary domain is proposed, as shown in Figure 2. Proof of Theorem 2. The individual regret of the alternatives divided into the positive region is relatively small and the group utility is relatively large, which is easy to be accepted by the decision maker. The schemes divided into the negative region have large single regret and relatively small group utility, which are easy for decision makers to reject. The single regret and group utility of the schemes separated into the boundary area are equivalent, so the decision maker needs to delay the decision. Therefore, the boundary region scheme is better than the negative region scheme and the boundary region scheme is inferior to the positive region scheme; this can be obtained by:□
The overall steps of the proposed model are the same as those of the model considering a single value, the main difference being that the proposed model considers both the single regret value and the group utility value. In the classification of the alternatives by each round of sequential three-way decisions, the scheme with the minimum group utility value is divided into the positive region, the alternative with the maximum individual regret value is separated into the negative region, and the alternative with the maximum individual regret value and the minimum group utility value is divided into the boundary region.
The steps of sequential three-way VIKOR model according to maximum individual regret value and minimum group utility value are as follows (where Algorithm 2 is used in Step 3):
Step 1. Derive the NIS and PIS of schemes from the multi-attribute information table based on Definition 2.
Step 2. Calculate the single regret value and group utility value for each alternative based on Definitions 3 and 4.
Step 3. Algorithm 2 is used to classify the alternatives.
Step 4. Calculate the decision index value for each alternative according to Equation (5).
Step 5. Sort the schemes belonging to the same decision area in ascending rank of their decision index values.
Step 6. According to the ordering regulations of different areas, the results of different areas are ordered to obtain the final ordering results.
We illustrate the time sophistication of Algorithm 2 as follows: In Step 4, the extraction of the minimum value in is denoted as and the extraction of the maximum value in is denoted as , and the time sophistication is . Steps 6 to 11 add the alternatives to the corresponding domain, respectively, with time sophistication . Steps 12 to 13 are sequential processing of the boundary region, and , and the time complexity is . In general, is the time sophistication of Algorithm 2.
Example 3. The process of using this model to process the normalized attribute matrix
and the corresponding weight set
shown in Table 2 is as follows: (1) derives the NIS and PIS of alternatives from the multiple message attribute information table on account of Definition 2.
(2) calculates the individual regret value and group utility value of each scheme on account of Definitions 3 and 4, where denotes the individual regret value of the scheme and represents the group utility value of the th scheme.
, , , , , , , . , , , , , , , .
(3) divides all the alternatives into corresponding regions according to Algorithm 2. , , .
(4) calculates the decision indicatrix value of each scheme according to Equation (5), where denotes the decision index value of the th alternative.
, , , , , , , .
(5) sorts alternatives for the same region in ascending order of decision index values based on the ordering regulations of alternatives in the identical area. The ordering result in the positive region is , the ranking result in the boundary area is , and the ranking result in the negative area is .
(6) Finally, the ranking rules use different regions when ranking the alternatives are shown in Figure 2. The final sorting result is . 4.2. Sequential Three-Way VIKOR Model Based on Maximum Group Utility Value and Minimum Individual Regret Value
In the sequential three-way decision classification, the scheme with the largest group utility value is separated into the negative area, and the scheme with the smallest individual regret value is divided into the positive region. If the alternative with the minimum single regret value and the maximum group utility value is also divided into the boundary region, the other steps of the proposed model are roughly like the sequential three-way VIKOR model according to the maximum individual regret value and the minimum group utility value.
| Algorithm 2 Sequential three-way VIKOR model based on minimum group utility value and maximum individual regret value |
Input: Group utility values and individual regret values for m alternatives
, ;
output: Three decision regions, and ;
1 POS = ∅, BND = {Am}, NEG = ∅, k = 0, S = {Sm}, R = {Rm}
2 while do
3 , ;
4 , ;
5 if
6 Add to
7 ;
8 else Add to
9 ;
10 Add to
11 ;
12 ;
13 ;
14 end
15 Output ,,. |
Example 4. (Similar to Example 3),
Using this model to process Table 2 can acquire the final ordering result of the schemes of the three-way sequential VIKOR model according to the minimum single regret value and the maximum group utility value as . It can be seen that the ranking results of the sequential three-way VIKOR model according to the maximum individual regret value and the minimum group utility value and the sequential three-way VIKOR model according to the minimum single regret value and the maximum group utility value are both
. It shows the effectiveness of considering the group utility value and single regret value and the stability of the final ranking result. Unlike the sequential three-way VIKOR model, according to a single individual regret value or group utility value, the three-way sequential VIKOR model based on individual regret value and group utility value separated the schemes into the negative area and positive area and divides the schemes that are difficult to judge into the boundary area. From Example 1 and Example 2, it can be seen that there is difference in the final ranking results of and . Example 1 divides into the positive area and into the negative area, while Example 2 divides into the positive area and into the negative area, which eventually leads to the difference in the ranking results. Therefore, it is difficult to acquire an accurate ranking consequence by only considering the partial decision information of single individual regret value or group utility value. By comprehensively considering the single regret value and group utility value, the result that is better than is consistent with the result obtained by VIKOR method.
The alternatives for these two models to be separated into the positive area are consistent with the alternatives to be classified into the negative area, and , respectively. It shows that these two models also follow the principle that the smaller the single regret, the larger the group utility, and the better the scheme, and the larger the single regret, the smaller group utility, and the worse the scheme. Through sequential three-way decisions and considering both single regret value and group utility value, decision makers can obtain more decision information to classify alternatives. The sequential three-way VIKOR model based on single regret value and group utility value reduces the range of the positive area and negative area, and divides the difficult solutions into the boundary area, which avoids the difference in ranking results due to misclassification to a certain extent.
5. Experiment and Analysis
In this chapter, the ranking results of the proposed two models in two examples are compared with other existing multi-attribute ranking methods to further illustrate the VIKOR-based sequential three-way model. The first example is from Zhang [
6] and the second example is from Ye [
29]. The selected examples are from other papers on the combination of multiple attribute decision-making methods and sequential three-way decisions, and papers on the combination of fuzzy information systems and sequential three-way systems. These are representative in terms of multiple attribute decision-making methods and sequential three-way decisions, and the selected examples are also classic in terms of decision ranking and investment decision problems. Therefore, the selected examples are representative.
Example 5. In order to the usefulness and feasibility of the newly proposed multiple attribute decision-making method related to TOPSIS, Zhang et al. [6] used the data related to an investment plan. The company needs to comprehensively consider the expected benefit, market saturation, environmental impact, social benefit, and energy saving degree of the eight investment plans proposed and select the best investment plan. The set of eight investment plans is , the corresponding attribute set of investment plans is , the benefit attribute is , and the cost attribute is . The set of weights corresponding to each attribute is , and the uniformized decision matrix corresponding to the eight investment alternatives is , as shown in Table 3. The visualization of Example 5 is presented in Figure 3.
Method 1. Sequential three-way VIKOR model according to maximum individual regret value and minimum group utility value:
Step 1. Calculate the PIS and NIS of all investment plans according to
Table 3, the larger value of benefit attribute.
Step 2. Calculate the single regret value and group utility value of all schemes on account of (4) and (6), where denotes the individual regret value of the th scheme and denotes the group utility value of the th alternative.
, , , , , , , . , , , , , , , .
Step 3. Classify the alternatives based on Algorithm 2 by the maximum single regret value and the minimum group utility value, which can be obtained , .The boundary region is empty because there is no alternative that has both the maximum single regret value and the minimum group utility value when classifying the alternatives by sequential three-way decisions.
Step 4. Calculate the decision index values of all schemes according to Equation (5), and represents the decision index value of the th scheme, which can be obtained by
, , , , , , , .
Step 5. On the basis of the ordering regulations of alternatives in the identical area, the alternatives in the identical area are sorted in ascending rank of decision index values, and the ranking result in the positive region is , and the ranking result in the negative region is .
Step 6. The final ranking result is obtained through the ordering regulations of different regions.
Method 2. Sequential three-way VIKOR model based on minimum individual regret value and maximum group utility value:
Step 1. This step is the same as in Method 1.
Step 2. This step is the same as in Method 1.
Step 3. According to Algorithm 2, the alternatives are classified by the maximum individual regret value and the maximum group utility value. , .
Step 4. is the same as in Method 1.
Step 5. Similar to Method 1, it can be observed that the ranking result in the positive domain is , and the ranking result in the negative domain is .
Step 6. The final ranking result is obtained through the ranking rules of different regional alternatives.
Through the final ranking results of the above two models, it can be found that the ordering consequences of the two models are consistent. This shows that the comprehensive consideration of single regret value and group utility value makes the decision information considered by decision makers more complete and shows the effectiveness and the stability of the final ranking results. In three-way sequential decisions, the individual regret value and group utility value are used to provide more effective ranking information for the alternatives. Three-way sequential decisions divide the alternatives into different domains to obtain preliminary ranking information, which avoids some unreasonable ranking results to a certain extent.
The weight information of Example 5 is changed to
, and the final ranking result is changed to
, as shown in
Table 4 and in the visualization of comparison results with other methods shown in
Figure 4. The ordering consequences of this method are consistent with other schemes or slightly different.
The imparity between the proposed method and other comparison methods is that the positions of alternatives with similar rank are exchanged with each other, and the overall ranking information is only slightly different. On the premise of ensuring the accuracy of the experimental consequences, the usefulness and availability of the proposed method are verified.
Example 6. Ye et al. [29] considered the information of six manager candidates in the company and selected the manager candidates according to their health status, educational background, social ability, work style, writing ability and work experience, which were all benefit attributes. The set of manager candidates is , the corresponding set of attributes is , and the corresponding set of attribute weights is , as shown in Table 5 and Figure 5. The final ordering result acquired by the proposed method is
and is compared with other methods, as shown in
Table 6 and visualization of comparison results with other methods shown in
Figure 6.
Table 6 shows that the ordering consequences of the proposed method are consistent with those of most methods. The ordering consequences of the proposed method are identical as those of Ye [
29] and VIKOR method [
28]. The imparity between the proposed method and other methods is that
is used as the optimal solution in this paper. In addition to Zhang [
6]’s method, other methods take
and
as optimal solutions at the same time.
Table 6 shows that the proposed method has the same worst and optimal alternatives as most of the reference methods. According to
Table 5, attributes
and
are evaluated by
and
with opposite values. Since the weights of
,
, and
are the same, there is intuitively no difference between
and
. Other methods mainly use TOPSIS for ranking, which is based on the set of distances from the ideal solution, and a compromise scheme with dominance ratio is improved by VIKOR, which is the basis of the TOPSIS method. The VIKOR method makes the decision of decision makers more conservative or radical by adding the decision mechanism coefficient since TOPSIS method. The process of TOPSIS method does not incorporate any subjective factors, so there are slight differences in the priority of
and
. Besides that, most methods are consistent with the ranking results of the proposed method. The consequences show that the proposed method is as effective as other methods in dealing with the above examples, and is more effective and simpler than other methods, which extends the application scope of sequential three-way decisions and VIKOR methods.
To further test the proposed method, Example 5 is used to quantitatively analyze the proposed method. Firstly, the sensitivity analysis of the decision-making mechanism coefficient
in Equation (5) is carried out, and the values in the interval [0, 1] are taken in turn with a step of 0.1 to analyze the decision index value
corresponding to the alternatives and the ranking order of the schemes. It can be observed from
Figure 7 that with the continuous increase of
, the proportion of the relative distance calculated by the group utility value becomes larger and larger. This means that the decision index value corresponding to the alternative with the smaller group utility value and the decision index value corresponding to the alternative with the larger single regret value and the group utility value corresponding to the alternative with the larger group utility value becomes larger and larger.
However, the relative order of all schemes is not changed, and only when , the ranking result is , and and are in the same priority. When , the group utility value is not considered in the calculation of the decision index value, and the individual regret values and of and are both 0.3 at this time. This possible decision error is caused by only referring to partial decision information, as mentioned in this paper. When , because the group utility values of and are not the same and the group utility value is considered in the calculation of the decision index value, the ordering consequence is , which is consistent with the ordering consequences of other cases. Therefore, the proposed method is stable.
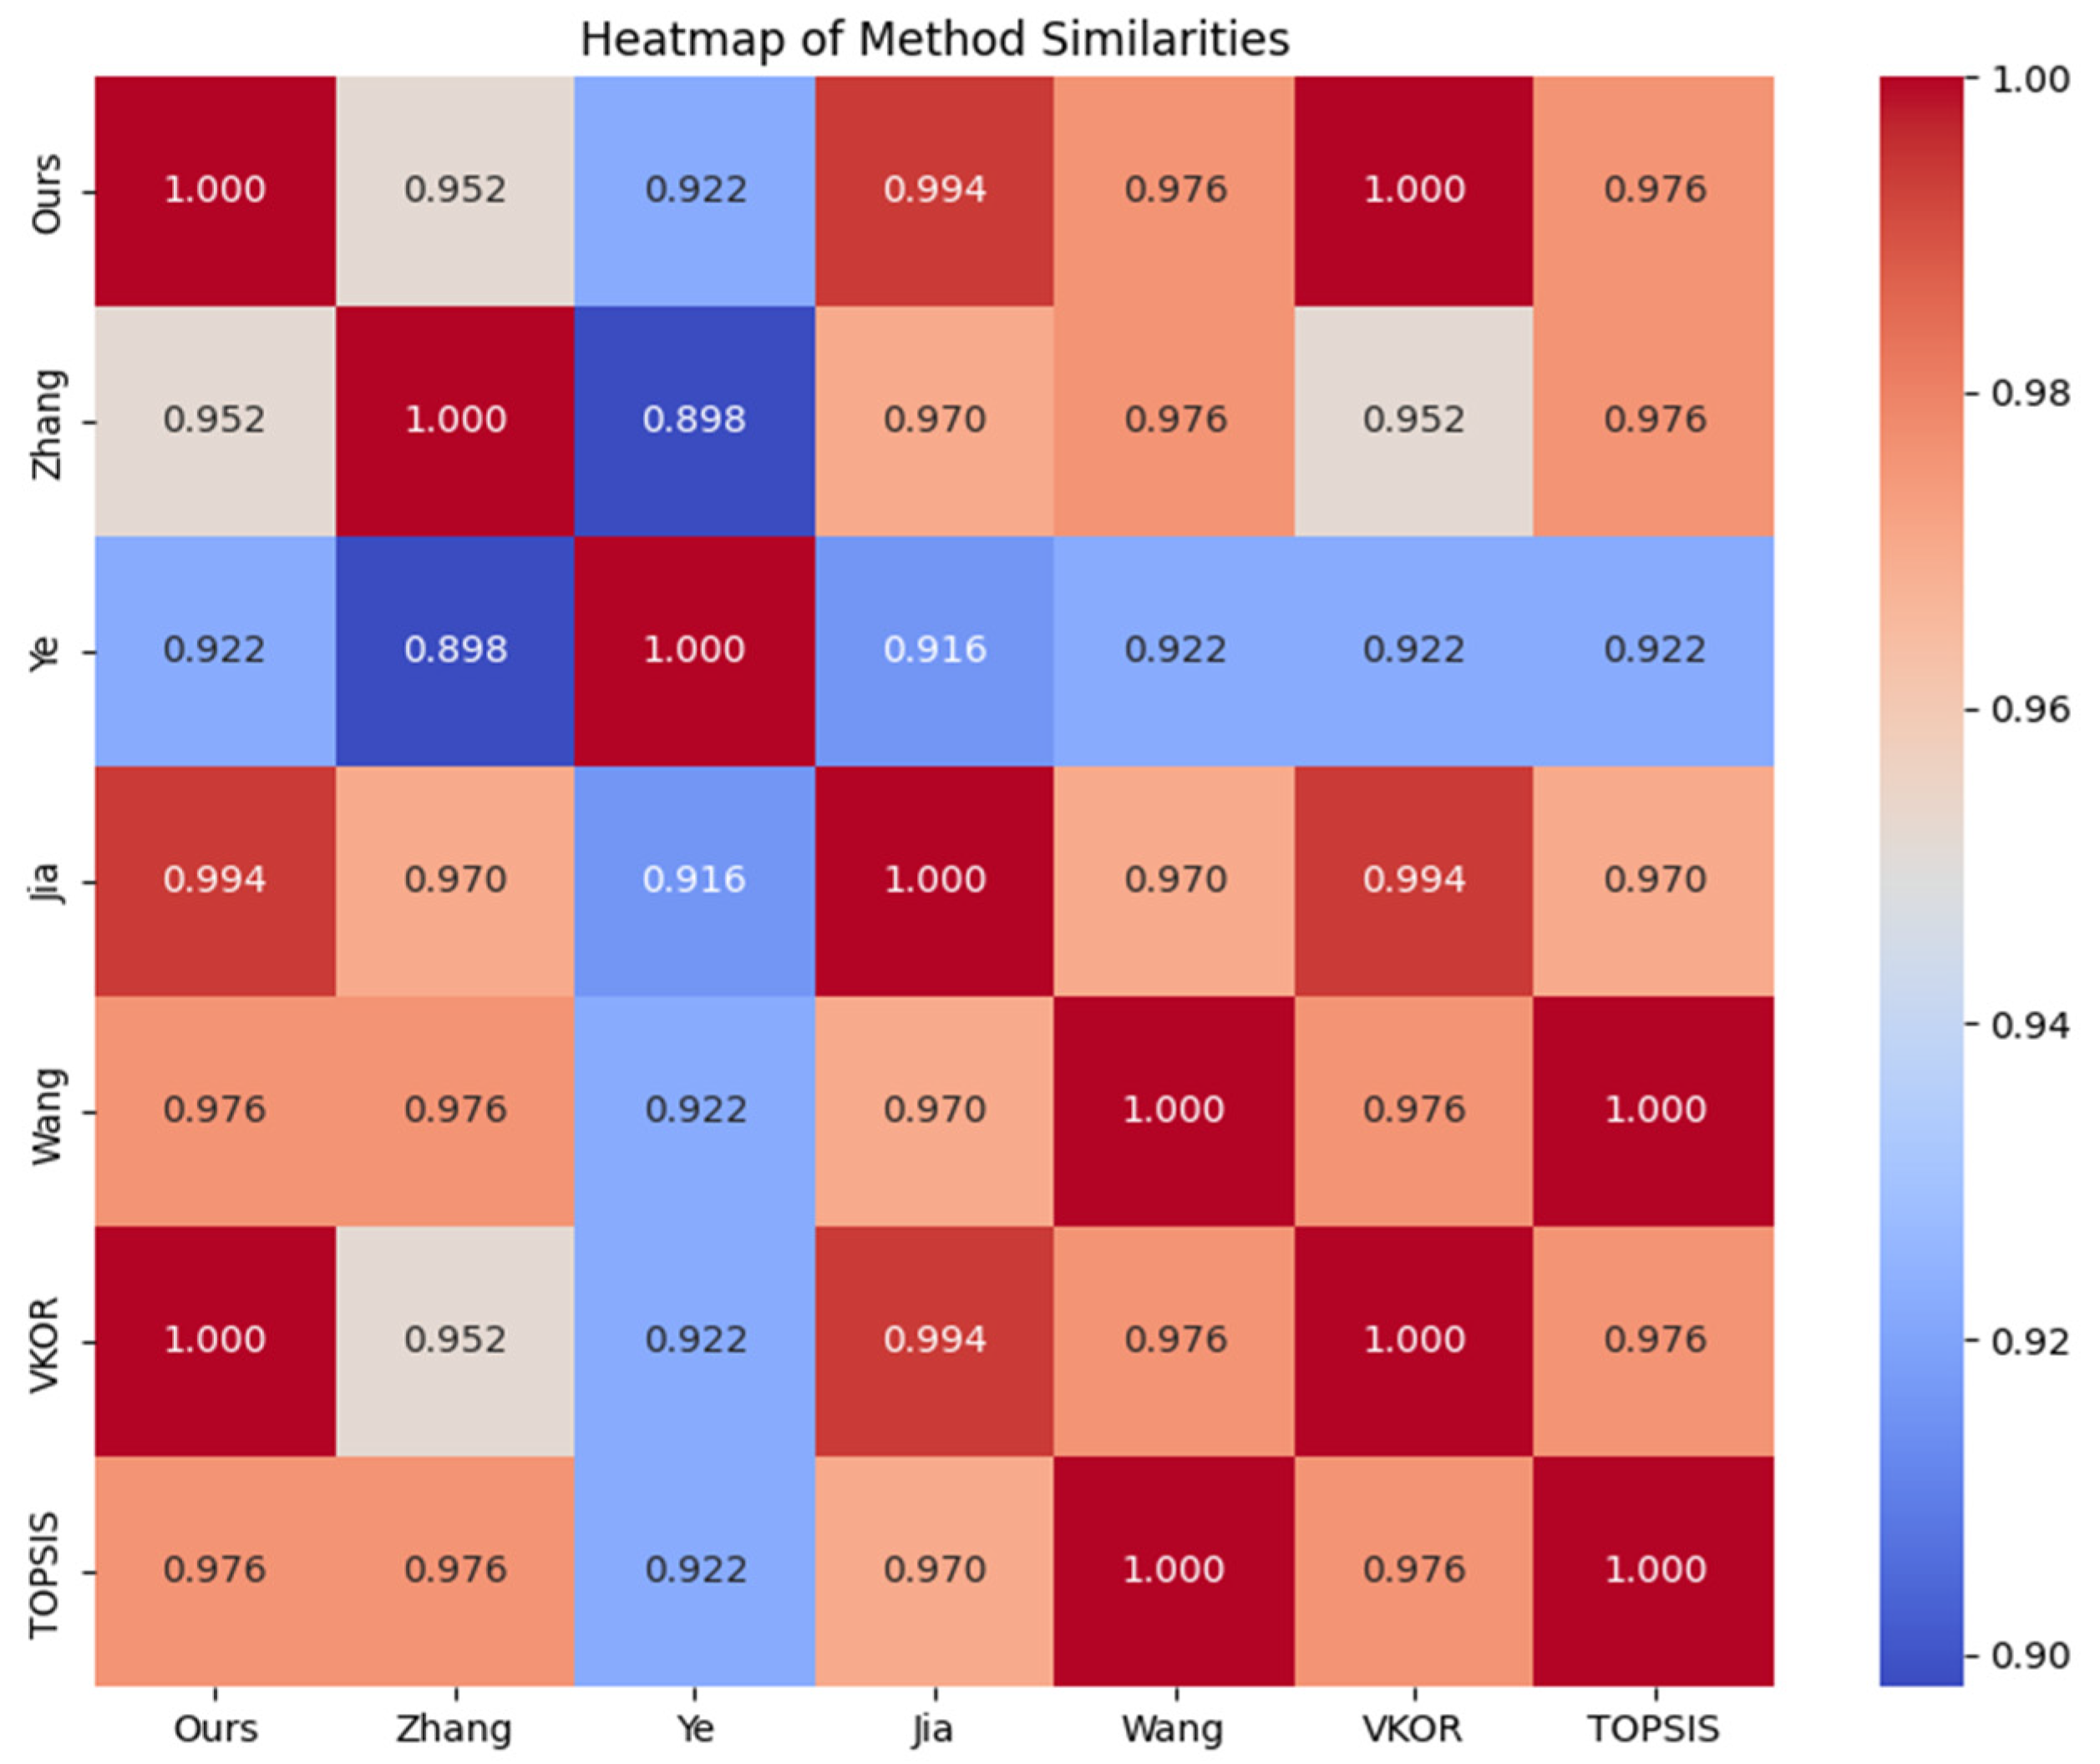
Next, the correlation between other methods and the ordering consequences of the proposed method is calculated by Example 5 as shown in
Table 7 and
Figure 8. It can be seen from
Table 7 that the proposed method is significantly correlated with other methods and has high consistency in the ranking results.
In addition, it can be observed that the correlation coefficients between the method proposed in this study and other methods are higher than or equal to the correlation coefficients between other methods. This indicates that the method proposed in this study is comparable to the other methods to some extent. In summary, the proposed method demonstrates a certain level of superiority and effectiveness.


