Article

Design and Development of Energy Efficient Algorithm for Smart Beekeeping Device to Device Communication Based on Data Aggregation Techniques

1
African Center of Excellence in Internet of Things (ACEIoT), College of Science and Technology, University of Rwanda, Kigali 4285, Rwanda
2
Department of Computer Engineering, School of ICT, Copperbelt University, Kitwe 21692, Zambia
3
National Council of Science and Technology (NCST), Kigali 20093, Rwanda
4
Education & Training Development Consulting, Lilongwe 207201, Malawi
*
Author to whom correspondence should be addressed.
Algorithms 2023, 16(8), 367; https://doi.org/10.3390/a16080367
Submission received: 10 June 2023 / Revised: 25 July 2023 / Accepted: 27 July 2023 / Published: 30 July 2023
(This article belongs to the Section Combinatorial Optimization, Graph, and Network Algorithms)

Abstract

:
Bees, like other insects, indirectly contribute to job creation, food security, and poverty reduction. However, across many parts of the world, bee populations are in decline, affecting crop yields due to reduced pollination and ultimately impacting human nutrition. Technology holds promise for countering the impacts of human activities and climatic change on bees’ survival and honey production. However, considering that smart beekeeping activities mostly operate in remote areas where the use of grid power is inaccessible and the use of batteries to power is not feasible, there is thus a need for such systems to be energy efficient. This work explores the integration of device-to-device communication with 5G technology as a solution to overcome the energy and throughput concerns in smart beekeeping technology. Mobile-based device-to-device communication facilitates devices to communicate directly without the need of immediate infrastructure. This type of communication offers advantages in terms of delay reduction, increased throughput, and reduced energy consumption. The faster data transmission capabilities and low-power modes of 5G networks would significantly enhance the energy efficiency during the system’s idle or standby states. Additionally, the paper analyzes the application of both the discovery and communication services offered by 5G in device-to-device-based smart bee farming. A novel, energy-efficient algorithm for smart beekeeping was developed using data integration and data scheduling and its performance was compared to existing algorithms. The simulation results demonstrated that the proposed smart beekeeping device-to-device communication with data integration guarantees a good quality of service while enhancing energy efficiency.

1. Introduction

Currently, cellular network technologies are unable to counter the growing demand of network subscribers due to various large-bandwidth-demanding applications such as video streaming and mobile computing, etc., and the volume of the data is increasing every day. It is predicted that, by 2025, trillions of wireless devices will be serving billions of people [1]. Beekeeping in Africa has been practiced for many years through successive generations and along inherited patterns. The activity has been traditional and of a non-commercial nature, with honey mostly being used as a food product, in medicine, and for brewing traditional liquor. Many development organizations have been involved in supporting beekeeping activities with producer organizations, but despite these attempts, the sector remains underdeveloped. Beekeepers also face challenges in accessing consistent and business-driven markets for their bee products. In addition, the honey bee population is decreasing due to colony collapse disorder (CCD), and information on the environmental conditions (e.g., temperature and humidity) surrounding beehives is not available to beekeepers due to the lack of monitoring and evaluation systems. To address these challenges, the deployment of smart beehives is essential. Internet of Things (IoT) technology has proved critical in driving the acceleration of the adoption of smart beehives. These innovative beehives enable an analysis of the conditions within the hive and the monitoring of environmental changes and potential threats. By providing real-time data and insights, smart beehives empower beekeepers to make informed decisions, optimize their honey production, and mitigate risks to bee health. Implementing such technologies can play a crucial role in advancing the beekeeping industry and ensuring its sustainability.
As with any other IoT-based system, the implementation of smart beehives also has its challenges. Issues such as power supply, data management, and connectivity pose obstacles to their widespread adoption. To overcome these challenges, the integration of 5G and device-to-device (D2D) communication technologies stands out as a promising solution. These advancements can enhance power efficiency, improve data transmission and management, and ensure robust connectivity [2]. It is against this background that this work proposes a novel algorithm that analyzes smart beekeeping D2D communications in terms of their energy efficiency and throughput while using 5G wireless networks.
The energy efficiency of smart beekeeping systems is an important aspect to consider for their successful implementation. 5G technology has been recognized as a promising solution that aligns with the goals of next-generation wireless communication networks (NGNs), offering improvements in terms of quality of service (QoS), including throughput, energy efficiency, delay, and supporting D2D communication [3]. Therefore, to improve the efficiency of smart beehives, 5G and D2D communication technologies can be incorporated to support smart beekeeping [4]. D2D communication enables direct communication between devices without the need for intermediate infrastructure, e.g., access points (APs) and base stations (BSs) [3]. Furthermore, D2D communication increases a system’s coverage, as it enables closed devices to relay data received from an unenclosed device. By supporting proximity-based data sharing, naturally, D2D communication is the right communication technology in 5G. Smart beekeeping with D2D (SBD2D) communication is being designed for the remote monitoring and timely reporting of the health status of bees, various environmental aspects, and the status of honey production [3].
Energy efficiency is one of the main concerns in a wireless sensor network because grid power is not available everywhere [5]. Alternatively, battery power can be used, but this is not appropriate because a battery’s life cycle is very short and requires frequent replacement, making the system expensive. In addition, due to the re-transmission of data during communication, its energy consumption is generally high. Therefore, a novel, energy-efficient algorithm based on data scheduling is proposed. This algorithm aims to optimize the energy usage within smart beekeeping systems. By efficiently incorporating data integration techniques and scheduling data transmissions, unnecessary power consumption can be minimized. To provide a comprehensive assessment, we compare the performance of the proposed 5G-supported D2D communications in terms of their energy efficiency and throughput with the existing systems commonly used in smart beekeeping. Through this analysis, valuable insights are provided on the benefits of adopting 5G and D2D communication technologies in terms of their energy efficiency and overall system performance. These contributions aim to advance the field of smart beekeeping, ensuring sustainable practices, optimizing honey production, and mitigating the challenges faced by beekeepers, such as power consumption.
This work is structured as follows: Section 1 presents the general introduction; Section 2 discusses the related works. Section 3 presents the system model and architecture design. Section 4 describes the energy-efficient algorithm for smart beekeeping D2D communication based on data scheduling and discusses the numerical results, while Section 5 summarizes the conclusion. Table 1 introduces the key mathematical notations and abbreviations used in this paper.

2. Literature Review

Different communication features, such as system capacity, throughput, spectral efficiency, and latency, are expected to be improved by applying the D2D communication techniques of 5G networks [6]. In [7], the focus was on optimizing the energy efficiency of a cellular network that incorporated D2D communication. The authors proposed a modified derivative algorithm and compared its performance with the original derivative algorithm using MATLAB simulations. The evaluation considered cellular density users and D2D density users in an uplink environment with multiple bands of the spectrum being shared by both the cellular and device users, each with a bandwidth of 25 MHz. The results showed that the modified derivative algorithm achieved an improved energy efficiency compared to the original algorithm. The simulations demonstrated a nearly ideal performance, indicating the suitability of the proposed algorithm for 5G applications. Additionally, the study suggested the possibility of determining the optimal D2D user and cellular density for each band and conducted trade-off analyses.
Several resource allocation schemes have been proposed to improve the throughput, quality of service (QoS), and battery lifetime of systems operating in remote areas without grid power. However, previous attempts to achieve energy efficiency in such scenarios have often resulted in poor QoS, a limited bandwidth, and insufficient throughput. The authors in [8,9,10,11,12] showed that D2D communications underlying cellular networks can extend the device battery life compared to traditional cellular communication. However, the high energy consumption during transmission remains a challenge. In [13], the authors proposed a power-efficient discovery strategy and power allocation communication. Unfortunately, their method resulted in poor QoS due to the lack of near-to-near discovery methods between devices located on the same cellular network. Furthermore, the time taken for scheduling to transmit data between devices is very high. Though technologies such as wireless fidelity (WiFi) or Bluetooth provide some D2D communication functionality in the unlicensed band, the main challenge is that the interference becomes uncontrollable [14]. In addition, they cannot provide security and QoS guarantees as cellular networks can. However, different recent works on D2D communication integrated into cellular systems have reported issues in energy efficiency, QoS, and radio resource allocation, as well as in communication session setup and management procedures [15,16].
In our proposed SBD2D communication application, energy efficiency is of the highest importance while exploiting the benefits of 5G and D2D communication. In [17], Mixed Integer Linear Programming (MILP) formulations to address various challenges and optimize resource allocation were used. Researchers have consistently employed MILP models for minimizing the transmit power, enhancing the fairness, and improving the resource allocation in D2D networks. These formulations tackle critical issues such as mode selection, scheduling, and power allocation, allowing for the efficient management of scalable interference. Furthermore, the MILP approach facilitates effective decision making with regard to admission control, mode selection, and power allocation, enabling the optimization of the system performance. By leveraging MILP techniques, researchers have been able to analyze and optimize the trade-offs between different objectives in D2D communication systems, leading to improved efficiency. In the study reported in [18], the authors focused on addressing the challenges of mode selection and resource allocation to improve the throughput and minimize the interference in cellular–D2D networks. The conventional approach faces difficulties, as the Base Station lacks channel quality information for the cellular–D2D link. This leads to uncertainties in achieving the desired Signal-to-Interference-plus-Noise Ratio (SINR) and maintaining the Quality of Service (QoS) requirements. To overcome this challenge, the authors propose a probabilistic resource allocation method that incorporates a quasi-convex optimization algorithm based on channel probability characteristics. This integration allows for the mitigation of channel state information uncertainties by gathering feedback through user selection. By leveraging the probabilistic resource allocation and optimization algorithm, the authors aim to enhance the overall system performance in terms of the throughput and interference management in the cellular–D2D network performance. The work in [19] provides a comprehensive review of the potential application areas of D2D technology, including IoT, wearables, and automated driving. It also examines the current status of D2D technology in 3GPP standardization. Furthermore, the study analyzes D2D-enhanced cellular networks from both base station and end-user perspectives, using various measurement-based LTE and Wi-Fi models. The findings indicate that significant energy reductions can be achieved with different types of base stations, such as macro, pico, and femto.

2.1. Energy Efficiency in 5G Networks

Recently, energy efficiency has emerged as a key performance indicator and primary concern in the design of 5G networks; there has been a paradigm shift from throughput-optimized to energy-efficiency-optimized communications [20]. Certainly, 5G systems will serve an unprecedented number of devices, providing ubiquitous connectivity, as well as innovative and rate-demanding services, as shown by the work conducted in [21,22]. In mobile communication, the process of implementing hardware efficiency plays a significant role in increasing the energy efficiency at the device and infrastructure levels. According to [23], to support mobile data traffic, several specific metrics are expected, including latency/QoS and energy efficiency. In [24], with a range of maximum transmitting powers, the results illustrated that the maximum energy efficiency roughly equates to maximizing the spectral efficiency for low transmitting power in 5G networks. But this did not succeed in providing the latency/QoS and data rate requirements for the 5G network. In [25], the maximization of energy efficiency could be carried out considering all the practical factors, which are normally enforced in 5G communication systems. Besides this, QoS metrics such as delay, throughput, and energy efficiency have started being enforced, including rate guarantees, minimum delay, and maximal delay bound [26].
5G D2D communication is considered to be a suitable technology for proximity-based data-sharing services, making it an appropriate candidate for SBD2D communications [26,27]. To address the increasing demand for data rates, 5G enables network compaction through the organization of cellular networks into small cells. Such a kind of compaction results in having a higher spectral efficiency, which can also lead to a reduction in the power consumption of beekeepers’ mobile devices due to their communication with a nearby pico-cell. Consequently, this solution significantly improves the network coverage in SBD2D communication. The simultaneous operation of these macro-, pico-, and femto-cells is named HetNets (Heterogeneous networks) and they play an important role during network performance analyses. Interference remains a critical challenge in 5G heterogeneous networks due to its uncoordinated nature. The authors are thus motivated to analyze the performance metrics of SBD2D when deploying the 5G D2D configuration for SBD2D communication.

2.2. Need for Smart Beekeeping Device-to-Device Communication (SBD2D)

Our proposed approach to providing energy efficiency in smart beekeeping D2D communication is based on two main approaches discussed below. The first approach is about the analysis of the energy efficiency and throughput performance of SBD2D communication, concerning both the discovery and communication phases of D2D communication. SBD2D communication supports beekeepers to remotely monitor the status of beehives and other operations. Different devices such as sensors, actuators, and microcontrollers are used in the implementation of SBD2D communication. All of these devices need to communicate directly with each other without the involvement of the base station. During the remote monitoring of beehives especially, all the captured data about the inside and outside environment of the hive should be remotely accessible to the beekeepers through a direct communication concept between near-to-near devices without the retransmission of these data; thus, energy efficiency can also be maintained. The second approach is about designing and developing an energy-efficient algorithm for the proposed SBD2D communication based on data scheduling during transmission. SBD2D transmits the data collected from the beekeeper’s apiary to the mobile phones of the bee farmers. To maintain the good performance of the SBD2D, different parameters such as the energy efficiency and QoS need to be maintained. To achieve these performance metrics, a novel, energy-efficient algorithm is proposed in this work. The SBD2D’s performance is analyzed, especially the communication and discovery phases.

3. System Model and Architecture Design

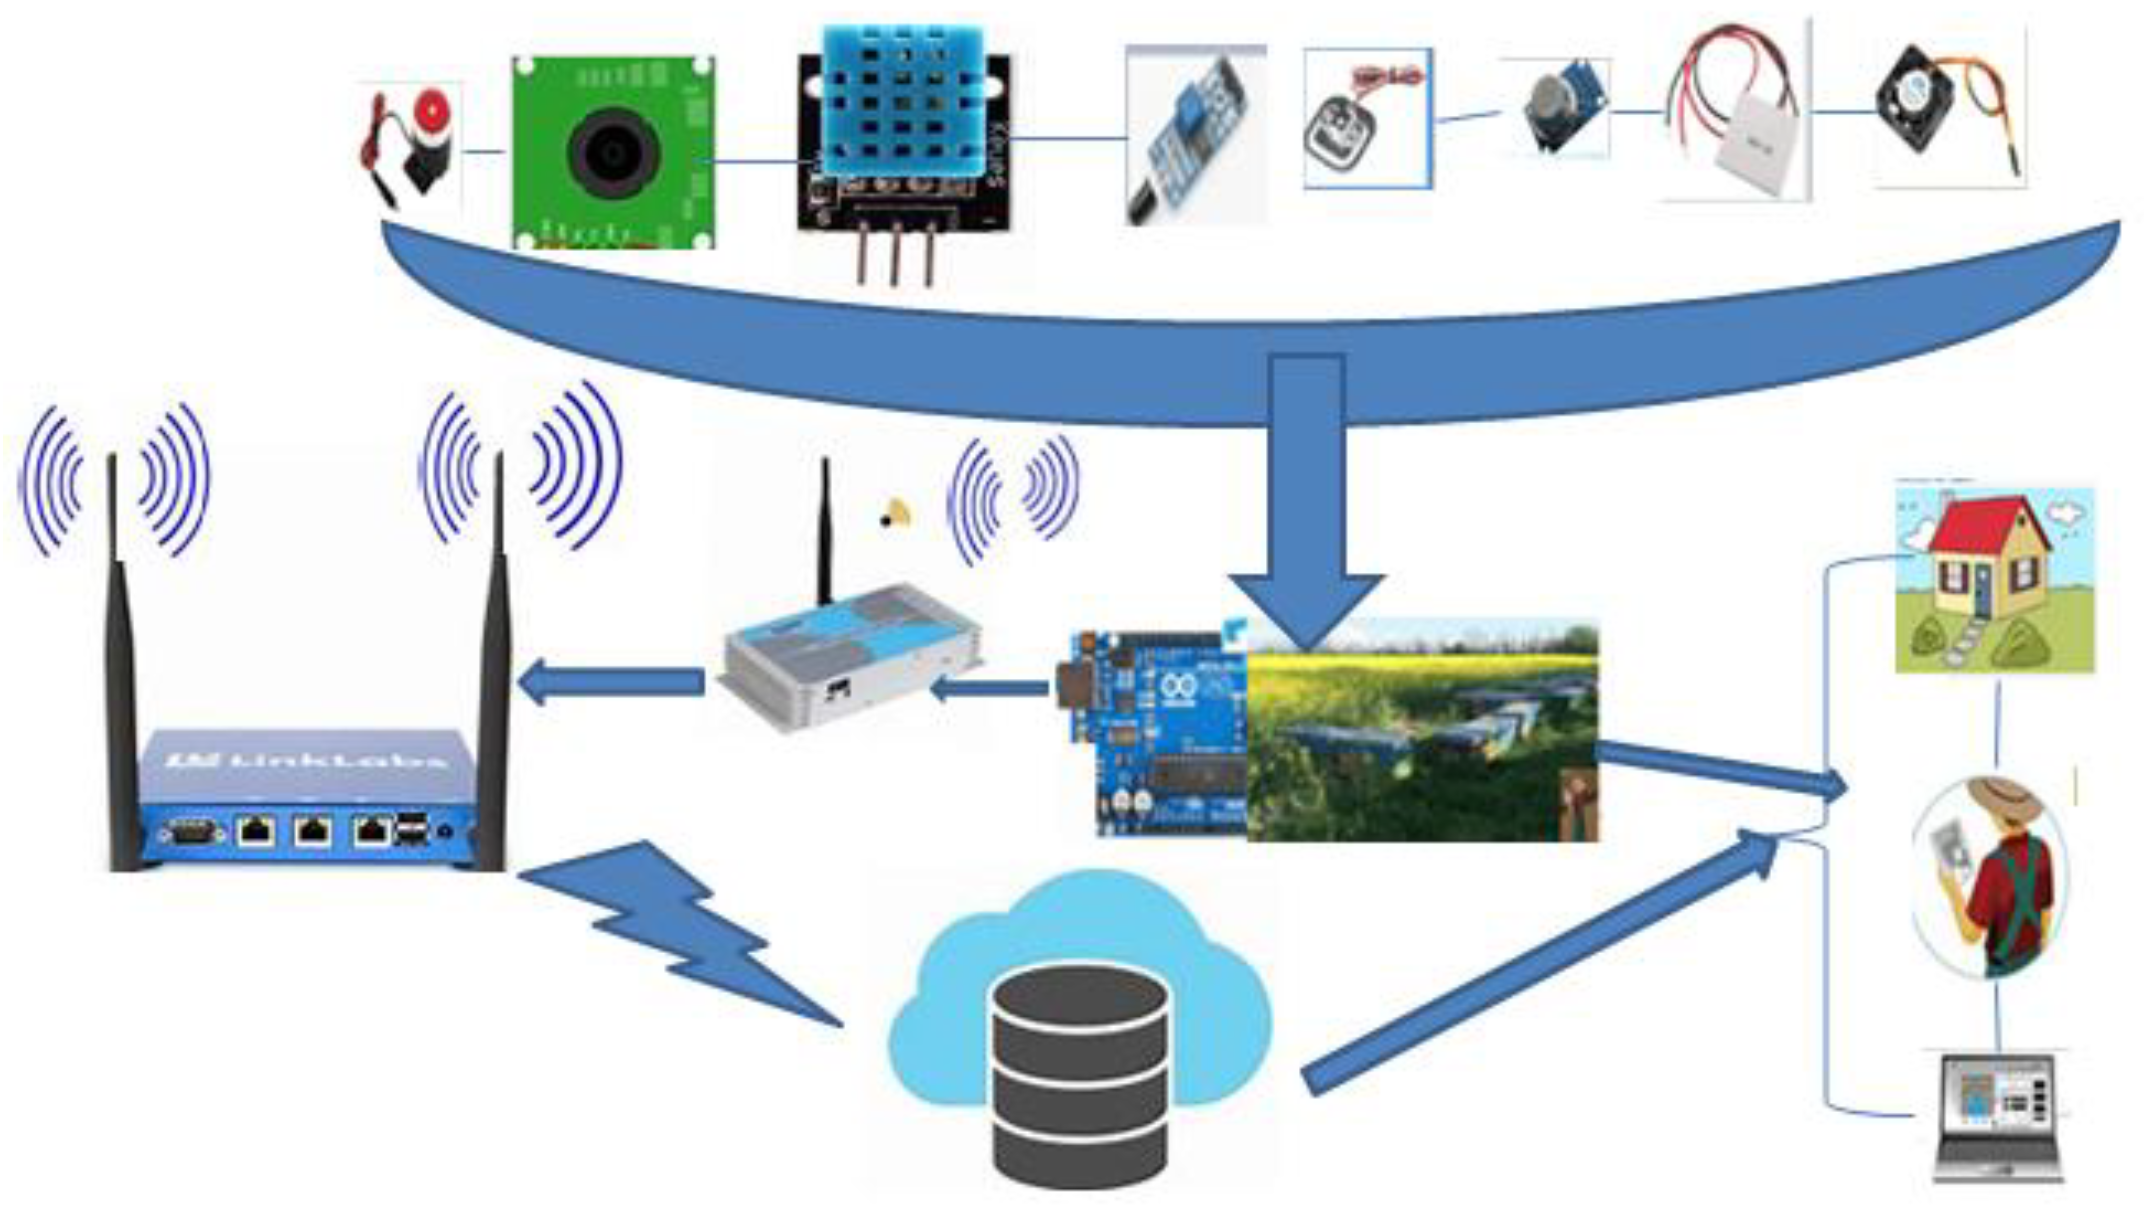
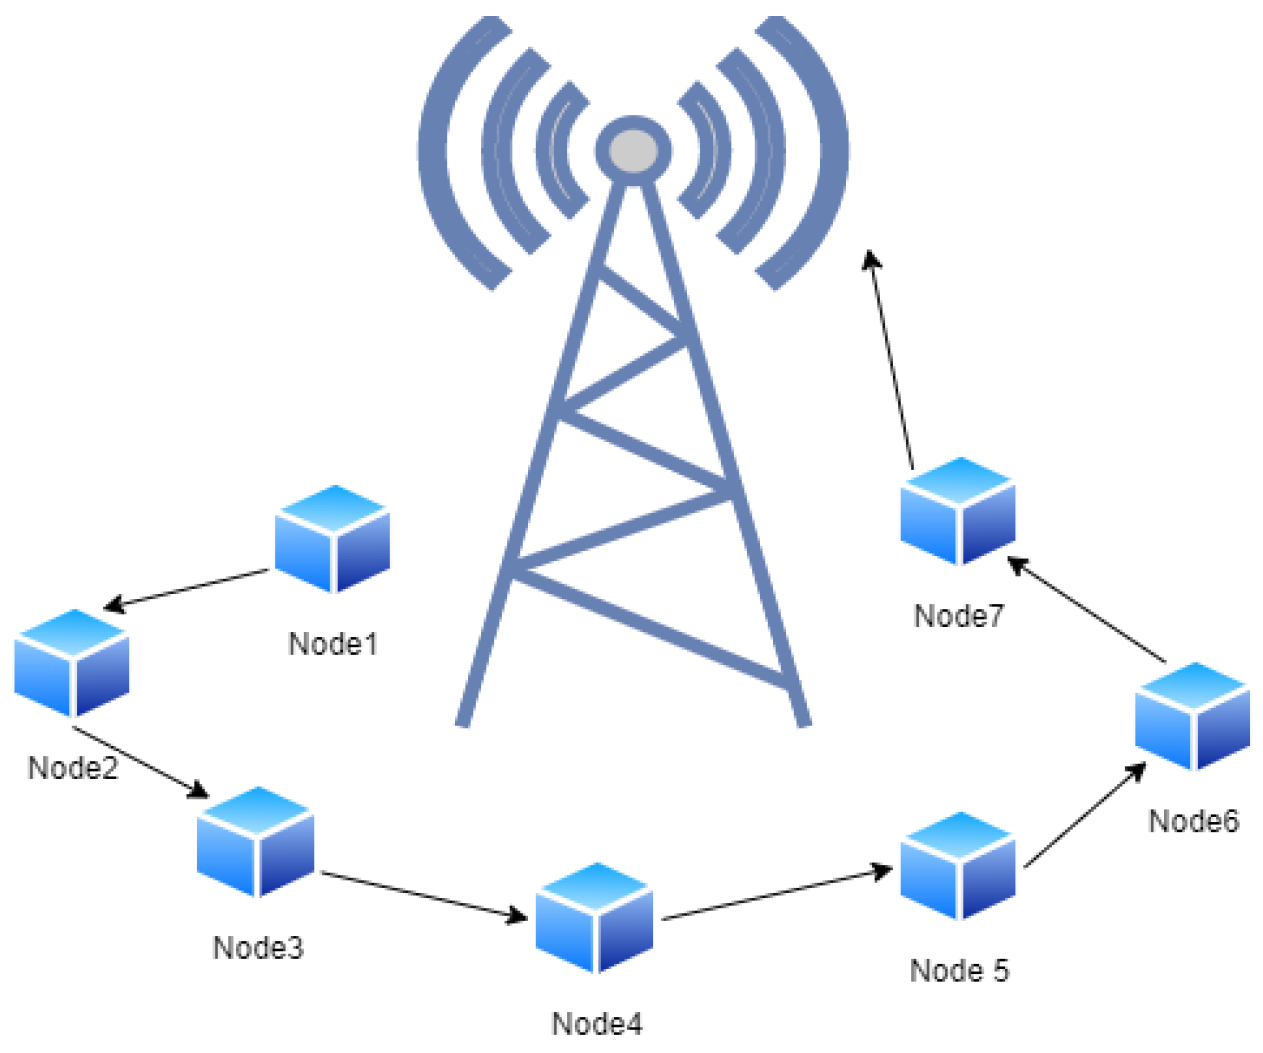
3.1. System Overview

The proposed system architecture integrates various IoT devices, including sensors, actuators, and user mobile devices that work together to form an integrated SBD2D communication infrastructure, as shown in Figure 1. As shown in Figure 1, the various devices can communicate directly without passing through the cellular base station.

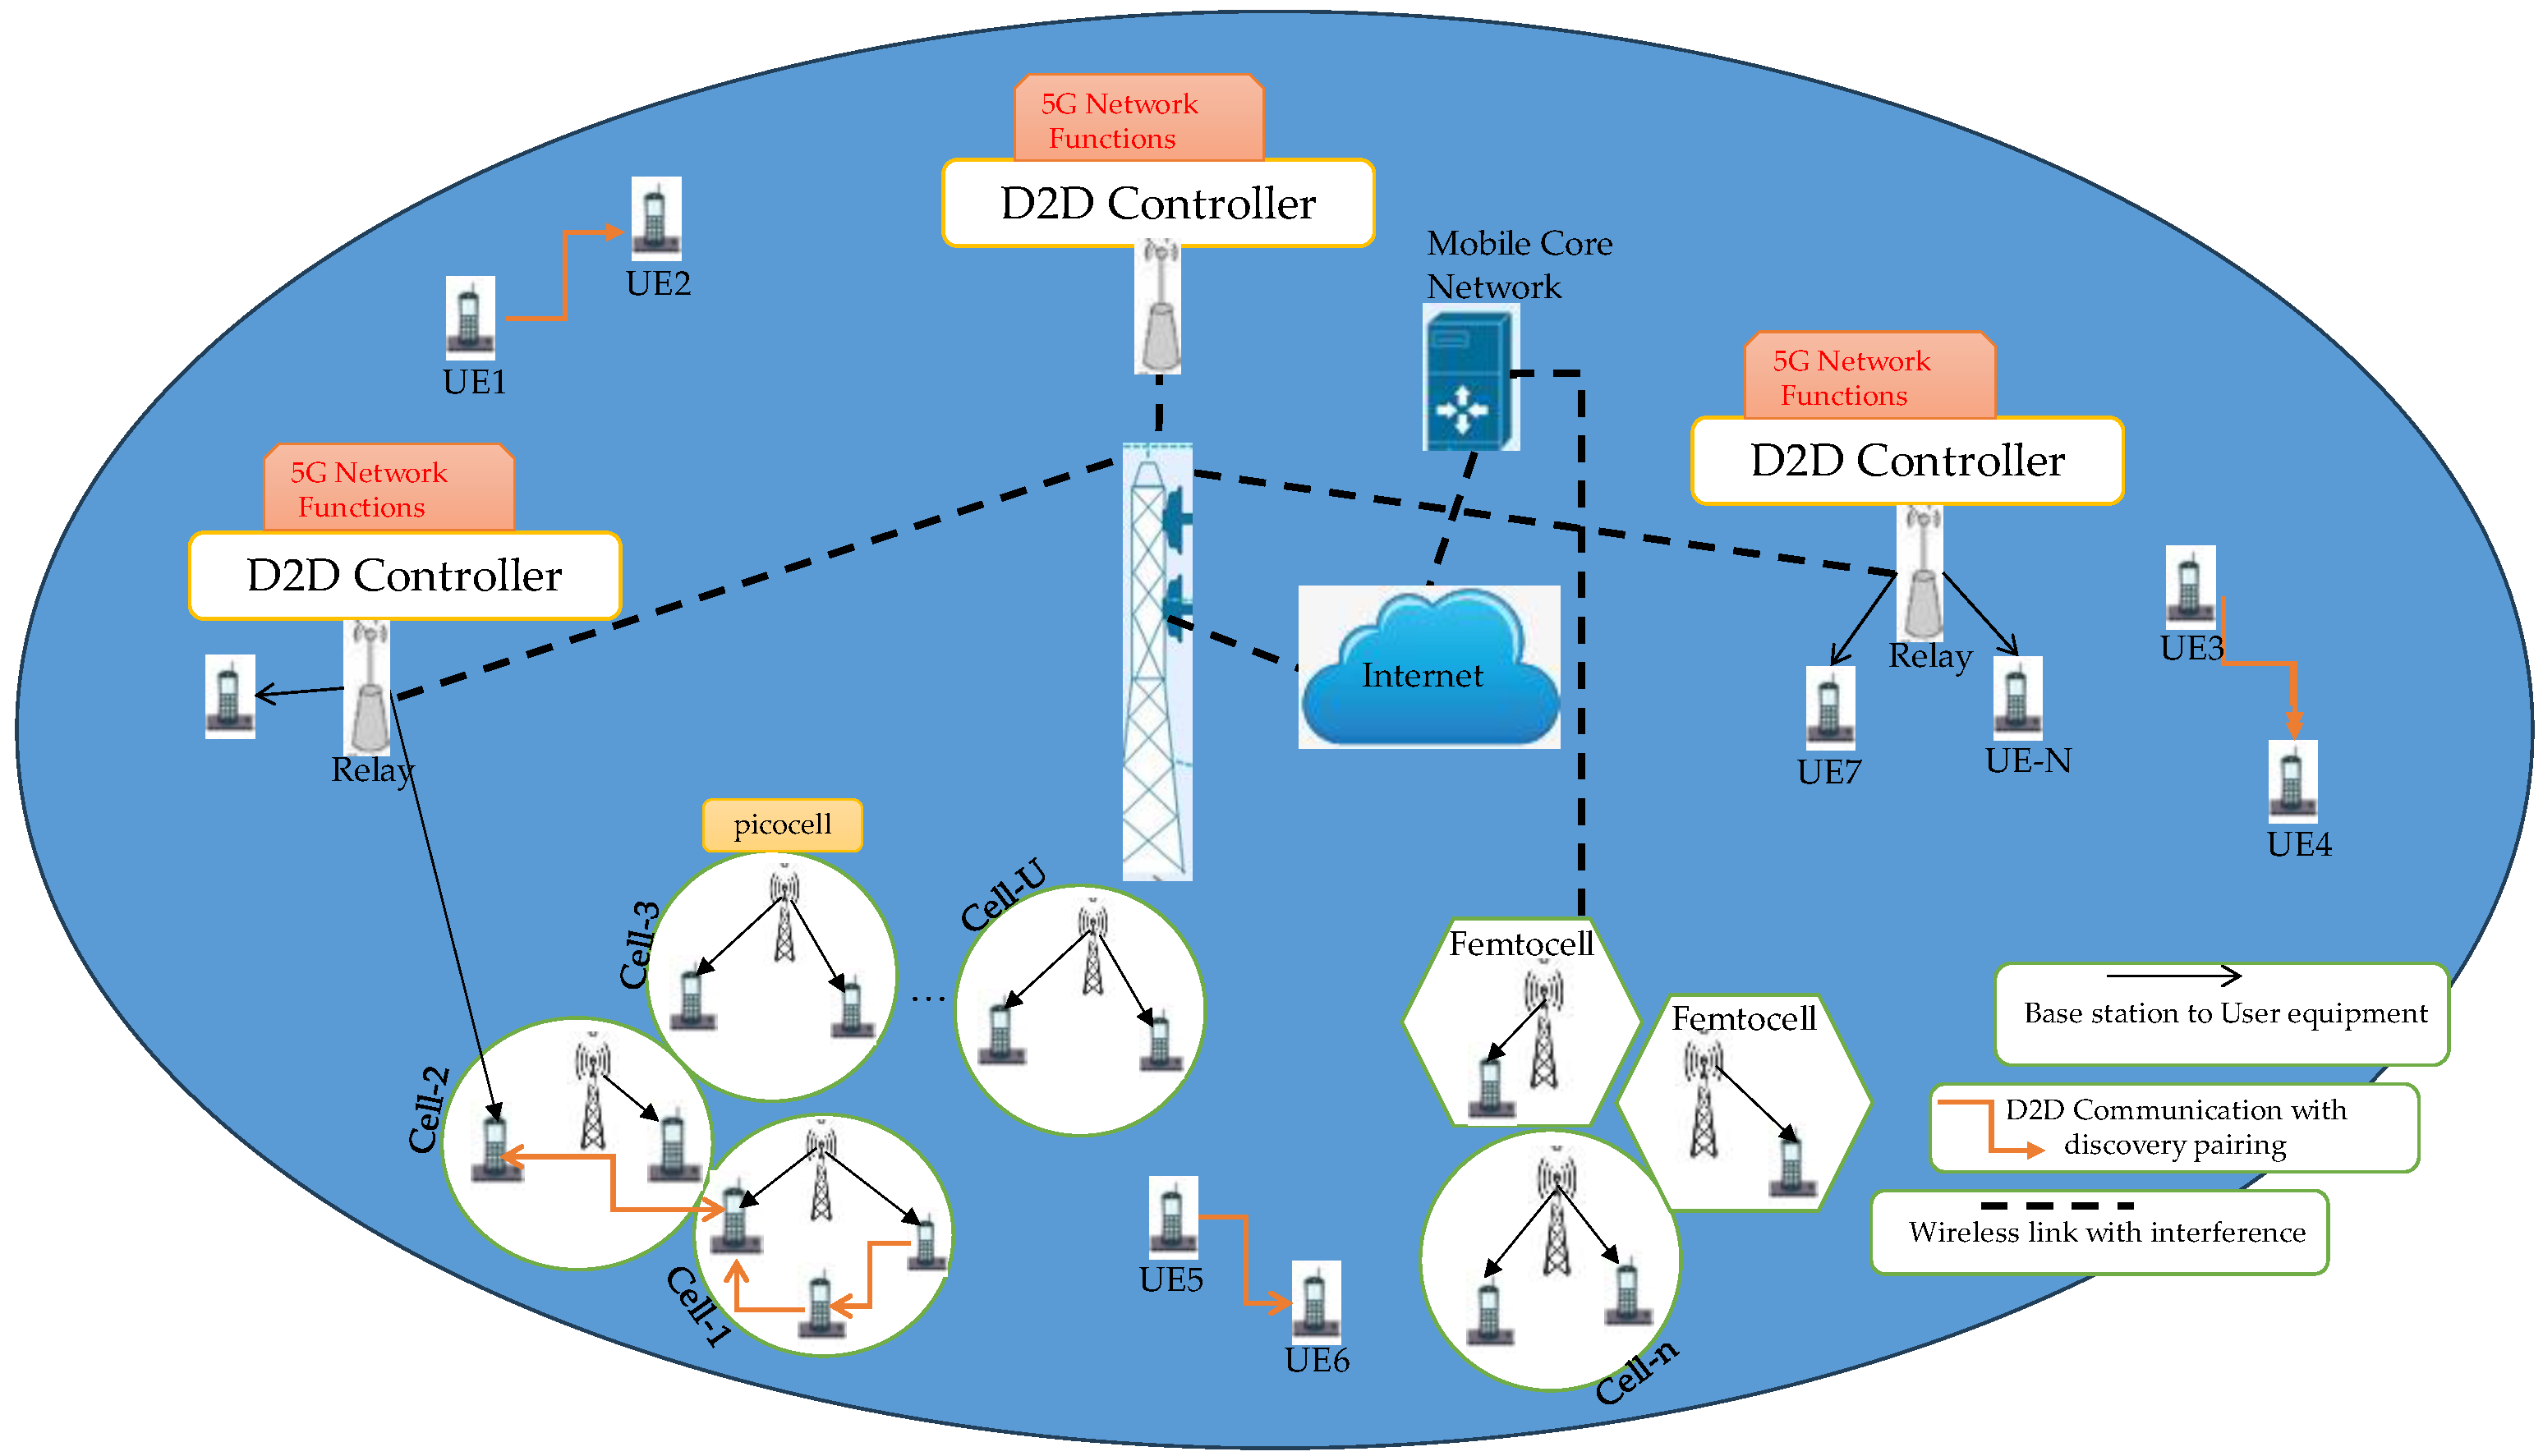
3.2. System Communication Model

As shown in Figure 2, the proposed system model for SBD2D communication takes into consideration the proximity of the nodes and data aggregation to further enhance the energy efficiency. The model consists of one base station (BS), three antennas, and three relays. Each antenna covers a sectored cell of the beekeeping apiary. Within the model, a set of devices (network nodes) is evenly distributed throughout the two-dimensional area, facilitating direct communication using SBD2D links when the nodes are near each other. This approach inherently supports SBD2D communication among all the devices in the scenario. SBD2D communication is defended inherently by all the devices in this scenario. We also assume that the direct links between the beekeeper’s mobile devices may use several radio access technologies (RATs) such as Bluetooth, Wi-Fi, and GSM. These devices perform D2D and, once there is a connection establishment, the SBD2D pair must be linked to the BS, and they act as a relay node to receive the data from the mobile network of the beekeeper. The signal that is received by the relay is retransmitted between the BS and mobile and can be used to boost the network throughput and enlarge the cellular network system. Because the infrastructure of the relay does not require a wired connection to the network, it offers backhaul savings costs. In this scenario, there will be a pairing procedure (discovery phase), which will be managed by the SBD2D controller like a centralized entity in a SBD2D communication pairing. The interference is the critical factor that masks the QoS when transmitting signals from the beekeeper user equipment (UE) to the BS or from the BUE (beekeeper user equipment) to the network antenna. The interference problem is minimized because the communication phase in SBD2D starts when the SBD2D pairing process has been established.
The topology shown in Figure 2 is defined as a graph G V , E , E , where V is a set of vertices for the sensors, E is the set of SBD2D communication links, and E is the set of interference edges. An SBD2D communication link x y implies that node x transmits data to node y , with y considered to be the parent node. Interference edge y z implies that the transmission of y will interfere with the transmission of z and similarly, the transmission of z will interfere with that of y . In the architecture above, a packet S i generated by the i-th node v i , is defined by Equation (1).
S i = β D R , φ g , T P , B
where β D R is the bandwidth, φ g is the data rate for a given SBD2D link r , TP is the total power, and B is the bandwidth. Our goal is to ensure that S i is transmitted in an energy-efficient manner.

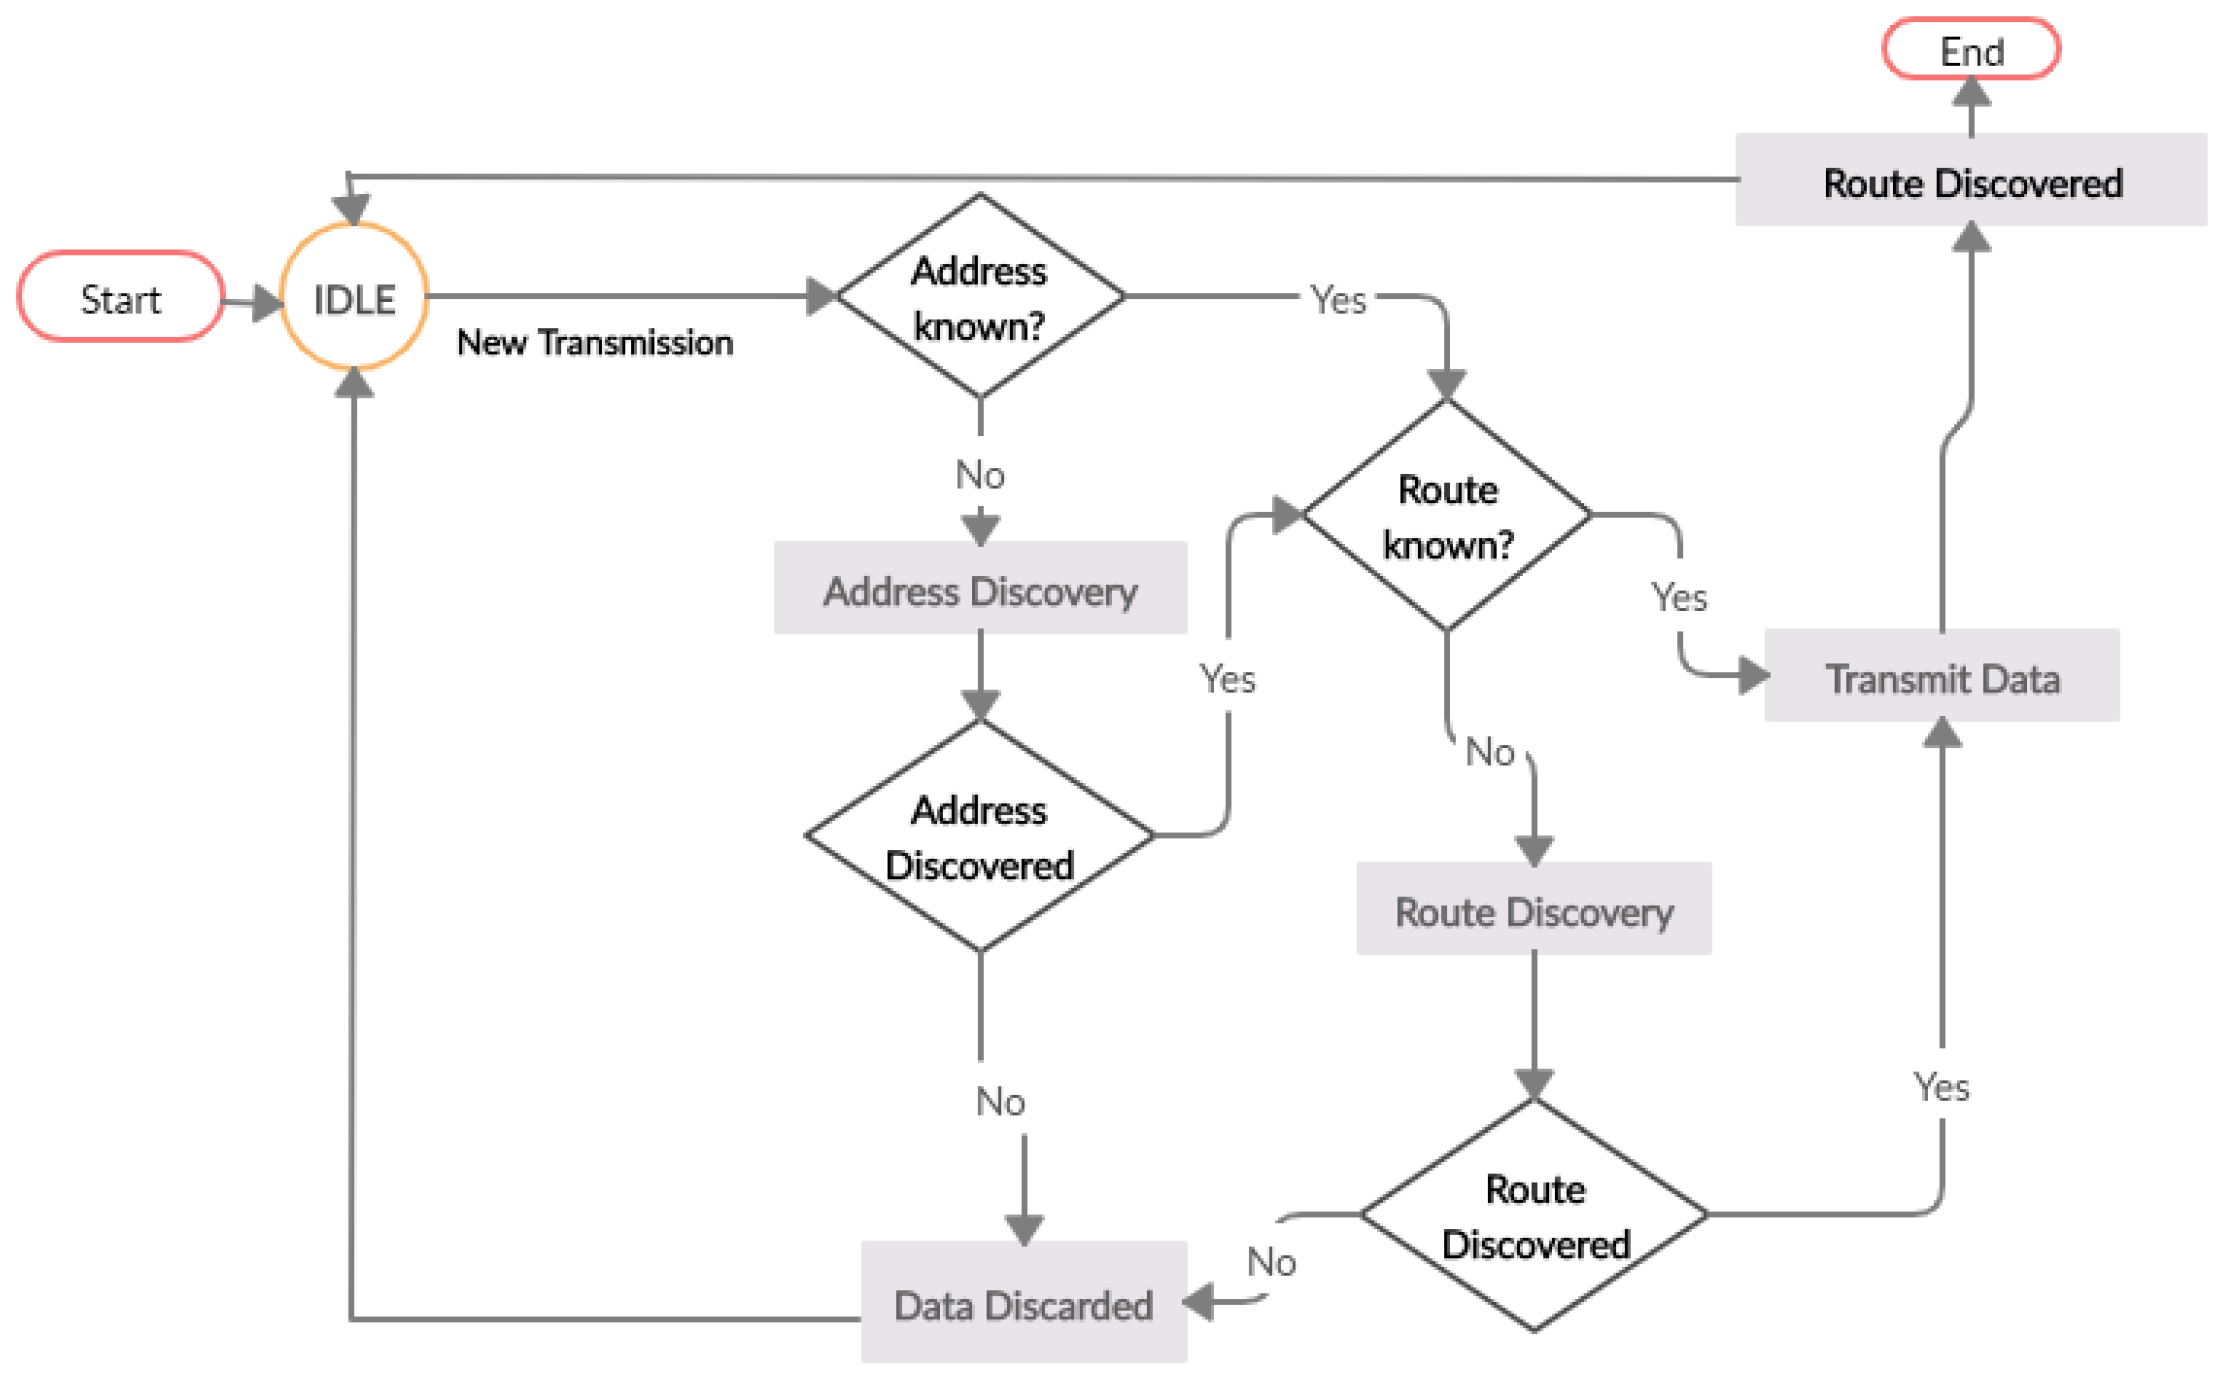
3.3. Pairing Process of SBD2D Communication

In the proposed scenario of the SBD2D discovery phase, as indicated in Figure 2 above, for two devices to directly communicate with one another, they must first discover that they are near each other. Peer discovery is a randomized procedure, in which a device sends signals (UE1 to UE2 or UE3 to UE 4) without any knowledge about the location of the intended peer. Figure 3 depicts the transmission flow of a relay node, which involves the discovery phase.
The knowledge of the nearby device location of the network is used to identify which device could benefit from D2D communication. When an SBD2D pair is found, the network coordinates the time and frequency allocation for the sending/scanning of devices. Due to the exchange of signals that is taking place, the signal-to-noise and interference ratio (SINR) of every paired device is computed. We intend to analyze the achievable network throughput of each SBD2D link and the consumed energy (energy efficiency) in this pairing scenario of SBD2D communication. As the beekeepers’ equipment is connected to the BS and the relay, the network controller also selects which device will act as a relay node. The one that is connected to the serving BS directly is considered a relay to the other device. Consider the model (geometry) of the system illustrated in Figure 2, where it is assumed that it contains U cells. At the D2D receiver, the SINR is measured as β D R , and can be computed as follows:
β D R = k D 2 D M D l D α i = 1 U k n R 2 M C n l C n α + T 0
where k D 2 D and k n R are the fading coefficients of the D2D link and the link between the UE (D2D User Equipment) receiver and the Uth UE transmitter, respectively. The complex normal distribution, denoted as Cn(0,1), is followed by both the transmitter and receiver. α symbolizes the path-loss exponent, while T0 is the additive white Gaussian noise (AWGN) variance. The transmit power of the D2D transmitter and the Uth CUE (Cellular User Equipment) are given by M D and M C n respectively [28].

3.4. Communication Phase of Proposed SBD2D System Model

In the architecture shown in Figure 2, there are three communication possibilities for UEs, (i) direct communication without BS via D2D communication, (ii) communication through eNB, i.e., the cellular communication mode, and (iii) communication via the SCeNB, i.e., the small cell communication mode [29]. The D2D communication phase starts once the connection between the two devices of the smart beehive is established through the licensed/unlicensed spectrum. With this setup, the QoS is easy because the cellular spectrum can be fully managed by the BS and a good network throughput is achieved. Building on Equation (2), we considering a Rayleigh fading environment and assume that k _ n R and k _ D 2 D are exponentially distributed. In such a D2D communication case, cellular is the main source of interference signal. Hence, the data rate of link r of SBD2D is given by a version of the Shannon capacity formula below [29,30].
φ g ( r ) = i = 1 U B log 2 1 + β D g ( r )
where B denotes the bandwidth of the D2D channel g (it is expressed in Hz), r is the D2D link that uses the channel g, and φ g is the data rate of link r [30,31].

3.5. Data Throughput

The average uplink sum rate per cell (data throughput) can be computed as follows:
D T = K · 1 μ K U B log 2 1 + β D g ( r )
where DT is the data throughput and SINR is the signal-to-interference and noise ratio, K means the multiplexed users, ( 1 μ K / U ) symbolizes the data fraction per frame, and B log 2 1 + β D g ( r ) is the data rate per user [29].

3.6. Modeling Energy Consumption

In 5G D2D networks, the energy consumption depends on several aspects, including the hardware, system architecture, tasks performed by the device, such as signal processing and coding, and radio frequency (RF) used. It also depends on the number of cells and access points that are in the geographical area. Due to their propagation aspects, the network architecture and location of the antenna also play key roles in the energy consumption. Let ET be the total energy efficiency. Therefore, it is computed as follows:
ET = T P + F P + P C + S P + A
where TP means the transmitter power with amplifier inefficiency, FP means the fixed circuit power, and PC indicates the power per transceiver chain. The last variable A symbolizes the coding/decoding/backhaul [32]. We have to note that the communications between the Base Station (BS) and beekeeper equipment are made up of regular communication, while the communication between the devices in SBD2D act as relay nodes of 5G networks.

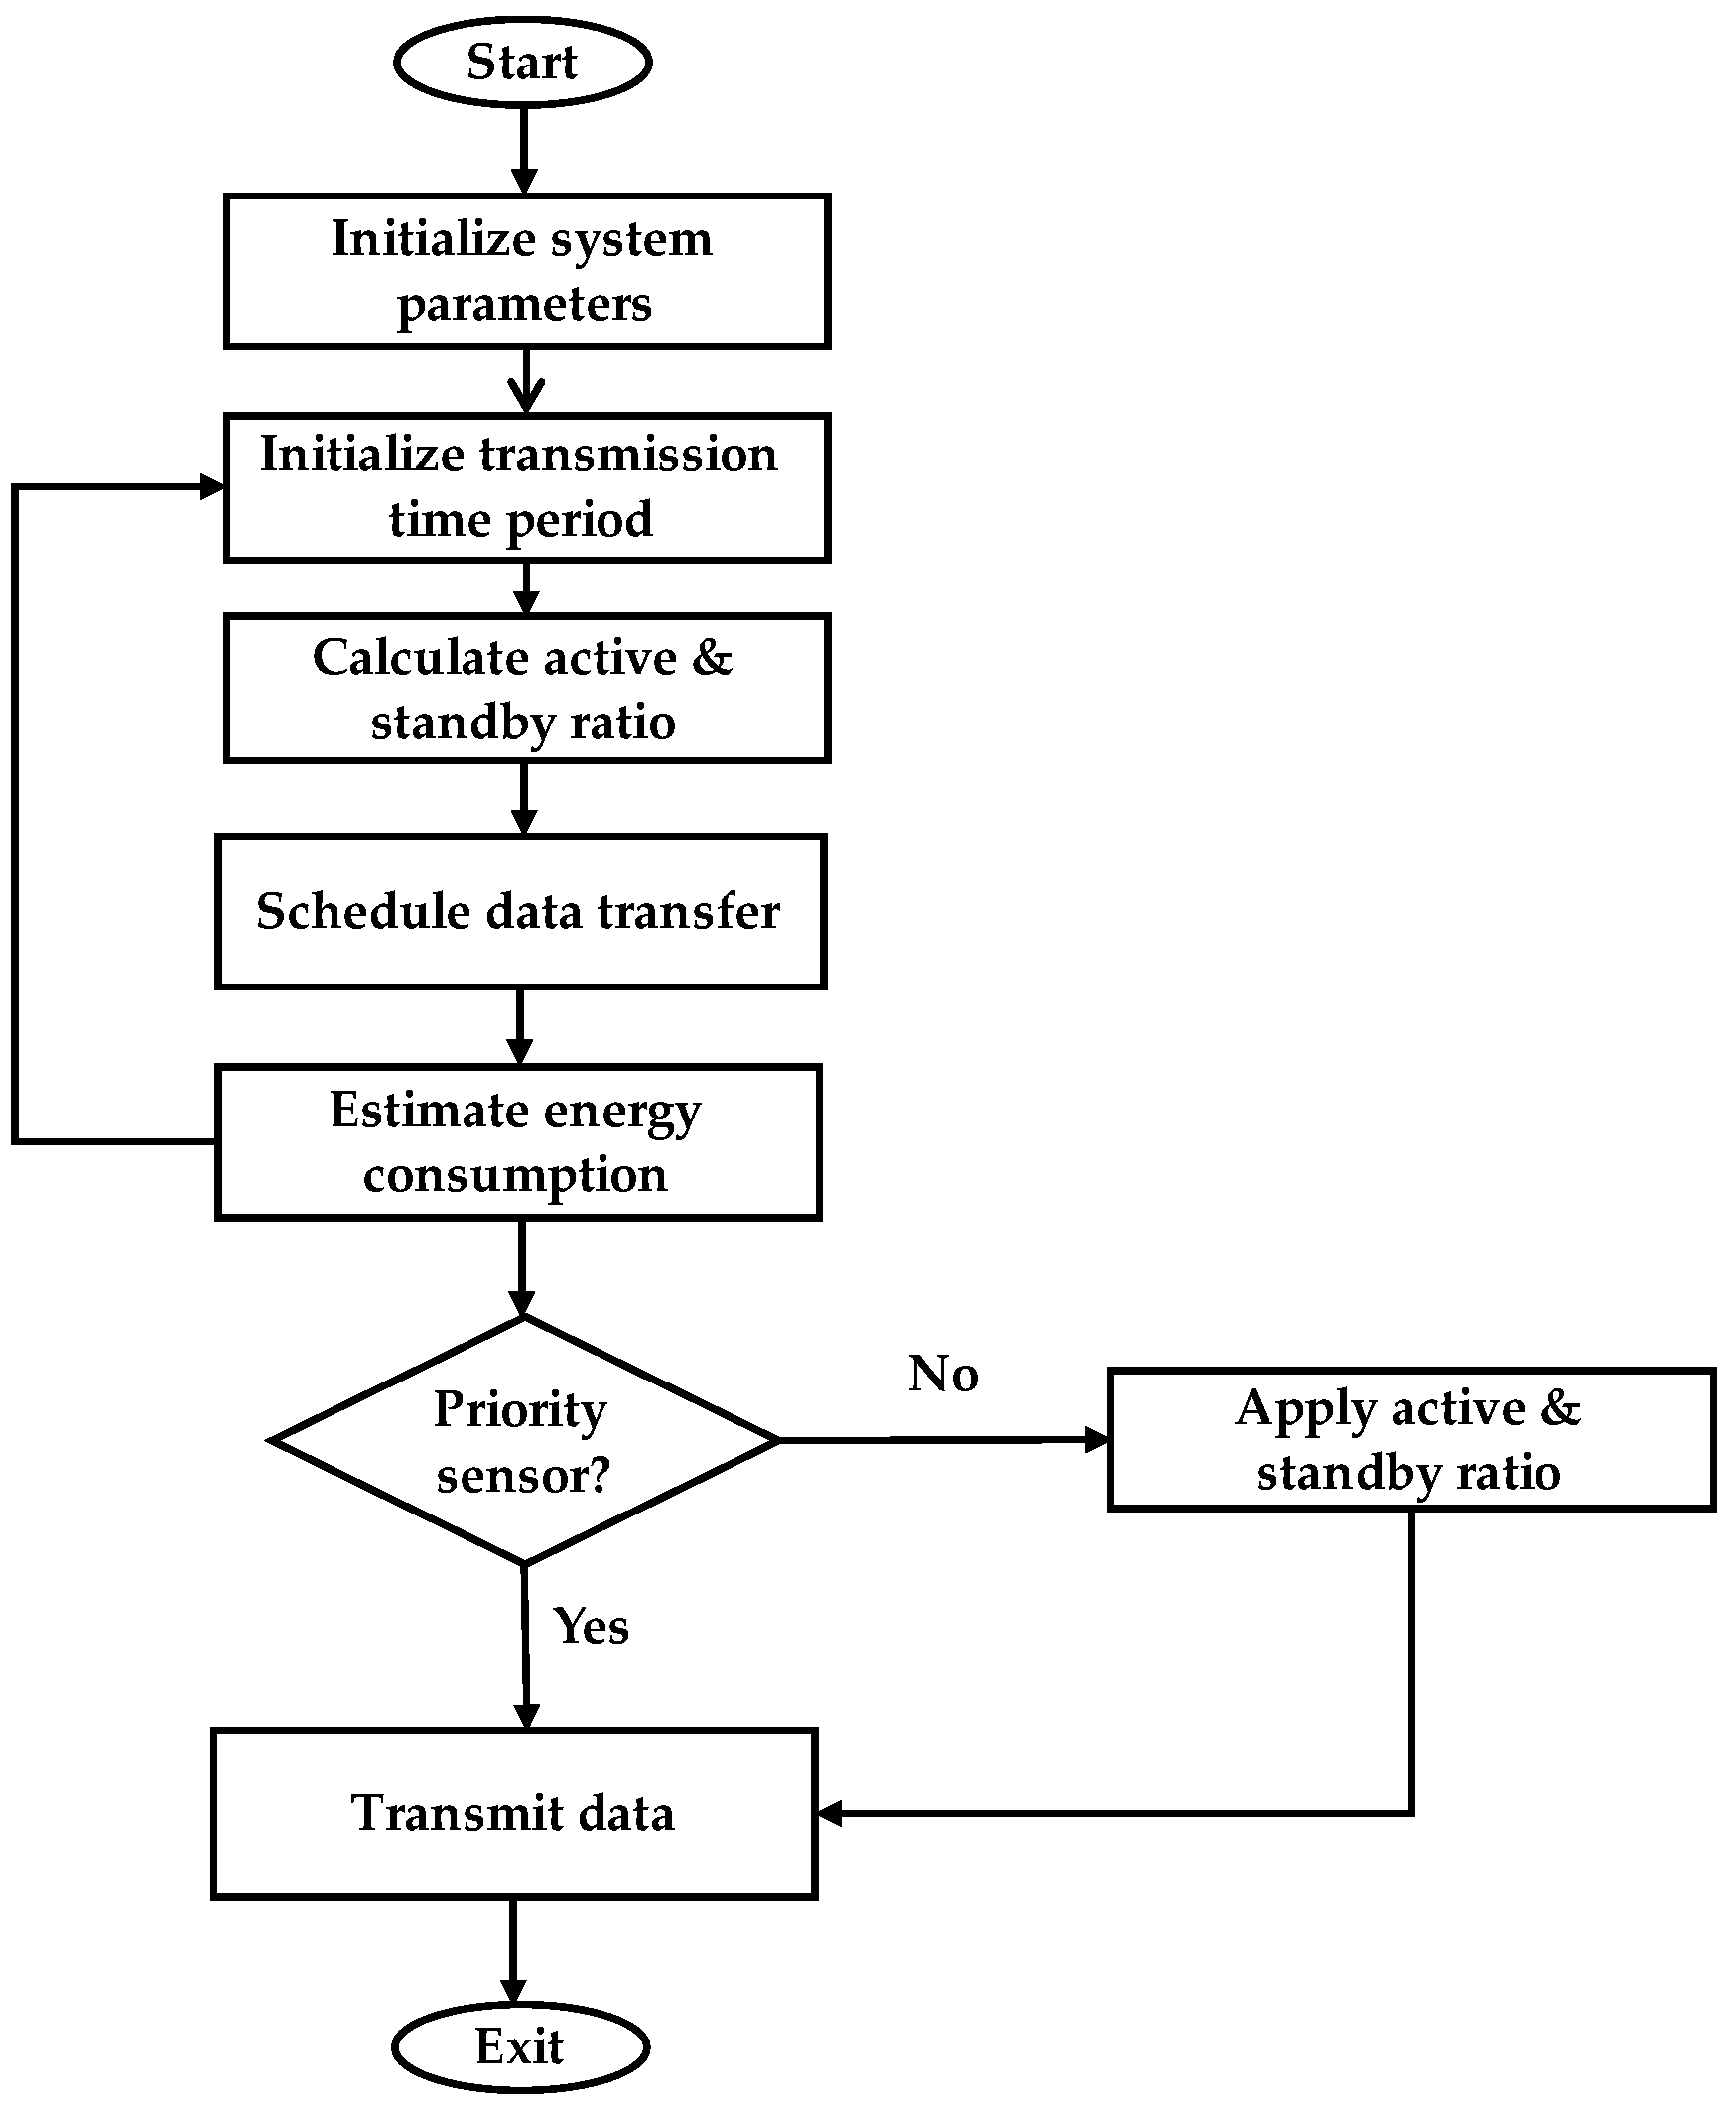
3.7. Energy Efficient Algorithm for SBD2D Based on Data Scheduling

Beekeeping is an activity mostly operated in remote areas, where the use of grid power is inaccessible and the use of batteries to power sensors is not a feasible option, because their life cycle is very short and requires frequent replacement; hence, the system becomes expensive. Therefore, the new algorithm is designed to ensure the system’s power efficiency, thereby allowing farmers to monitor their beekeeping activities every day. Figure 4 is a flowchart of the proposed model.
The methodology used to achieve energy efficiency in this case is based on the use of a 1:10 ratio for the active to standby ratio. The algorithm works by considering the number of components connected to the smart beehive sensor network. The components are assigned priority based on the importance of the parameter they monitor. Based on the priority assigned, some components will always be in active mode, whilst others are scheduled. For example, temperature and humidity are important parameters that need to be closely monitored, and as such, DHT11 is always active. Based on the measured values, DHT11, in turn, instructs the digital fan and thermoelectric heater to be ON or OFF, according to the pre-set condition. However, other sensors are scheduled in the order of a 1:10 active to standby or sleep ratio and the servo motor is always in standby mode until it receives instruction from the appropriate transducer.
Algorithm 1 further schedules data transmission. Instead of all the sensors and actuators transmitting data at once, the data transmission is performed in different iterations, i.e., five iterations. This means that some sensors and actuators are kept in active mode, while others are in standby mode for transmission. Different sensors and actuators respect the process of transmission within five iterations and a time slot of 2 s. For all iterations, there is an initialization period of 60 s, so that all the sensors and actuators would be in active mode to transmit data. However, due to the data scheduling process, each sensor or actuator would take a short time of two seconds to transmit data, while the other sensors wait for the transmission to be completed. Due to the scheduling, the data reach their destination quicker, since there is limited interference and consequently the energy efficiency is maintained. The results show that, if there are multiple transmission attempts of data from the source to the destination, the system’s energy consumption tends to be high. Furthermore, when all the sensors transmit data from the source to a gateway or cloud at the same time, there is high interference, which implies data loss, forcing the sensor to make multiple transmissions. However, in our proposed algorithm, due to scheduling the transmission, the loss of data is reduced, and consequently, QoS is guaranteed; thus, the energy efficiency will also be maintained.
Algorithm 1: Energy Efficient Scheduling-Based Data Transmission
1.  Start
2.  Initialize system parameters (n SBD2D nodes and m cellular nodes, data rate, K multiplexed users)
3.  Initialize transmission time period
4.  For transmission period ≤ 60 s do
5.  Compute SINR, β D R from Equation (1)
6.   Compute Data rate, φ g from Equation (2)
7.  Calculate active & standby ratio
8.  Schedule data transfer
9.  Estimate energy consumption ET
10. If Estimated energy 105   μ As then
11. Proceed to check priority requests
12. Else
13. Go to step 3
14. For priority requests do
15. Transmit data within a time slot of 2 s
16. For non-priority requests do
17. Send to inactive queue
18. While initialization period 60 s, do
19. Activate inactive non-priority requests to transmit
20. End For
21. End If
22. End Else
23. End For
24. End For
25. End While
26. Exit

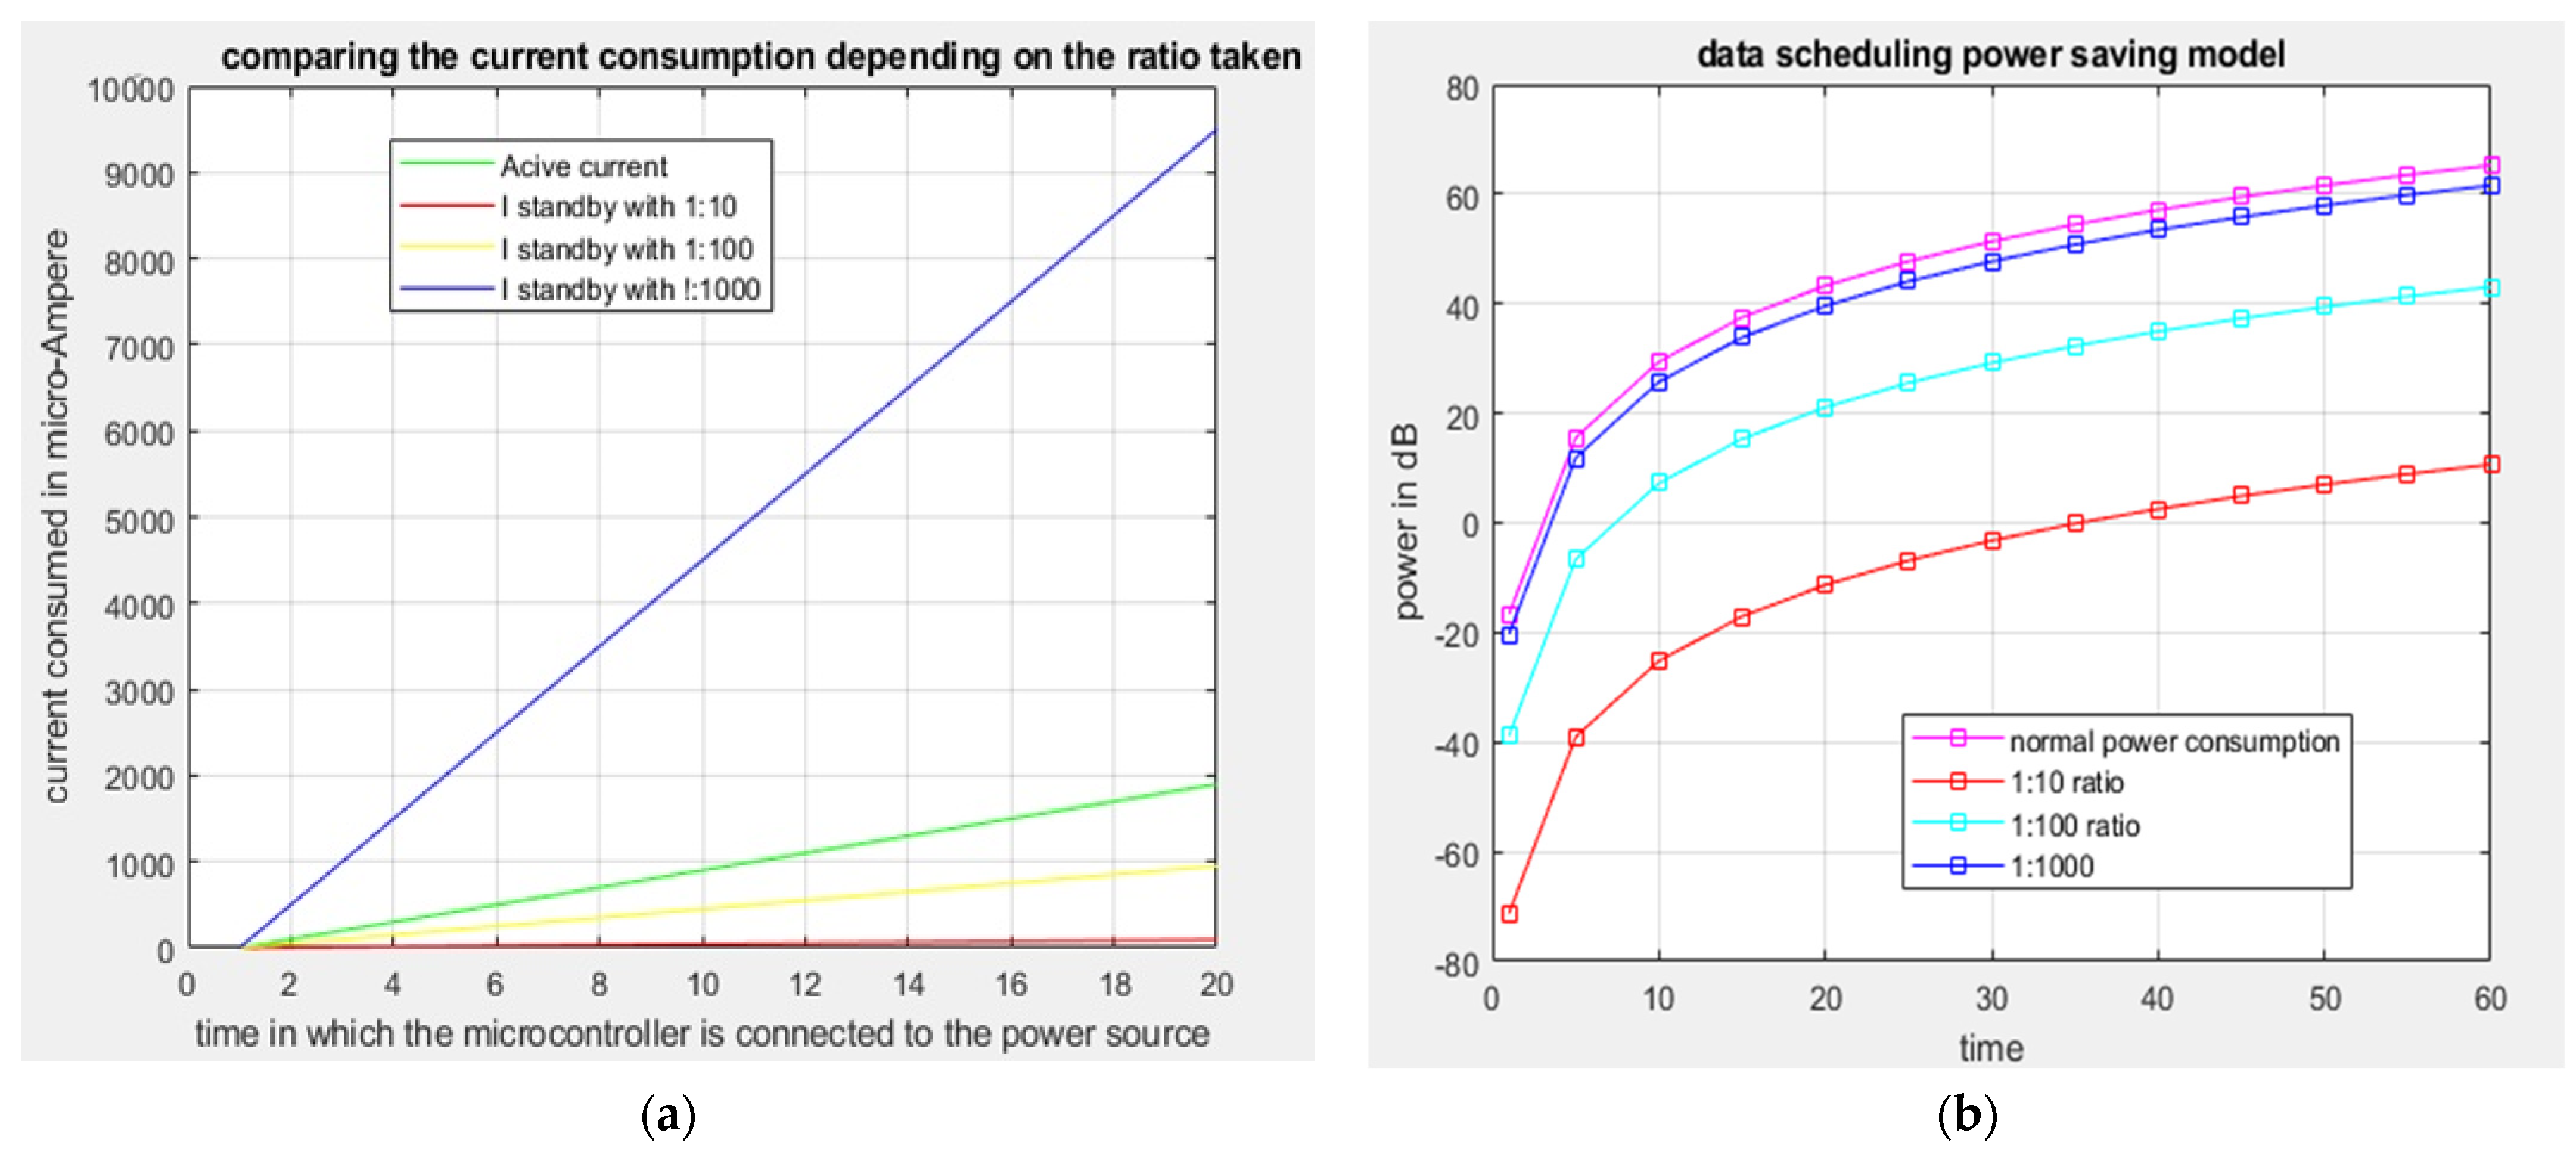
3.8. Impacts of Standby Ratio on Power Consumption

Table 2 shows that increasing the standby ratio leads to a high power consumption. To minimize this power consumption, we need to develop a mechanism that ensures that the microcontroller and sensors will operate based on the ratio of 1:10 (active to standby ratio), which means that, in a duration of ten minutes, the microcontroller is active only for one minute and on standby for nine minutes. This means that some sensors are put in standby mode until the required information is obtained to turn them ON, and then they read the data for the scheduled period.
The following system conditions and microcontroller parameters are to be considered and accounted for in the estimation of the standby current. Firstly, there is an automatic wake up on time intervals: in this condition, the microcontroller offers real-time clocks (RTC) that can run in low-power standby modes, enabling us to wake up the microcontroller automatically at specified time intervals to read the data and transmit the data to the sink node [32,33]. Secondly, there is a retention of random-access memory in standby conditions. In this second condition, the specification of the microcontroller shows that the content of random-access memory in standby mode allows the microcontrollers to wake up quickly without running a start-up code, which leads to a high consumption of valuable energy [33,34]. The third condition is interrupting capabilities—the microcontroller specification sheet shows that it often leaves certain peripherals active in standby mode, enabling the microcontroller to wake up quickly with certain events [34]. The last one is power monitoring—Brown out reset (BOR) and supply voltage supervisor (SVS) are important circuits that monitor the integrity of the microcontroller’s power source. Faults and interruptions to the microcontroller power source can impact the reliability of the operation.

3.9. System Model Based on SBD2D Data Integration

Before sending the data to the base station, this method combines and aggregates the data from several different nodes. By utilizing this method, redundant transmissions are cut down, which, in turn, helps to save energy. It removes the requirement for centralized routing, which removes an additional potential energy drain, see Figure 5. This strategy cuts down on the energy usage that is normally involved with transmitting data over several intermediate nodes. Buying out this model, we will benefit from the following:
  • Energy Efficiency: smart beekeeping systems can significantly increase their energy efficiency with the incorporation of D2D communication and data integration techniques. As opposed to conventional centralized communication techniques, the energy necessary for transferring data through intermediaries is drastically reduced when communicating directly between nodes. Data integration methods also reduce unnecessary transfers, which helps to save power.
  • Reduced Transmission Overhead: fewer transmissions are needed to send information to the base station when the data are integrated at the node level. Instead of delivering numerous separate data packets, an aggregated data packet is sent. In addition to saving energy, network optimization is also achieved.
  • Minimized Latency: D2D communication and data integration enables real-time data exchange between neighboring nodes; in this instance, nodes from one beehive to another, ensuring a low transmission latency. This immediate data transmission enables quick decisions and responses to changes in hive conditions, thereby enhancing the hive management and bee productivity

4. Results and Discussion

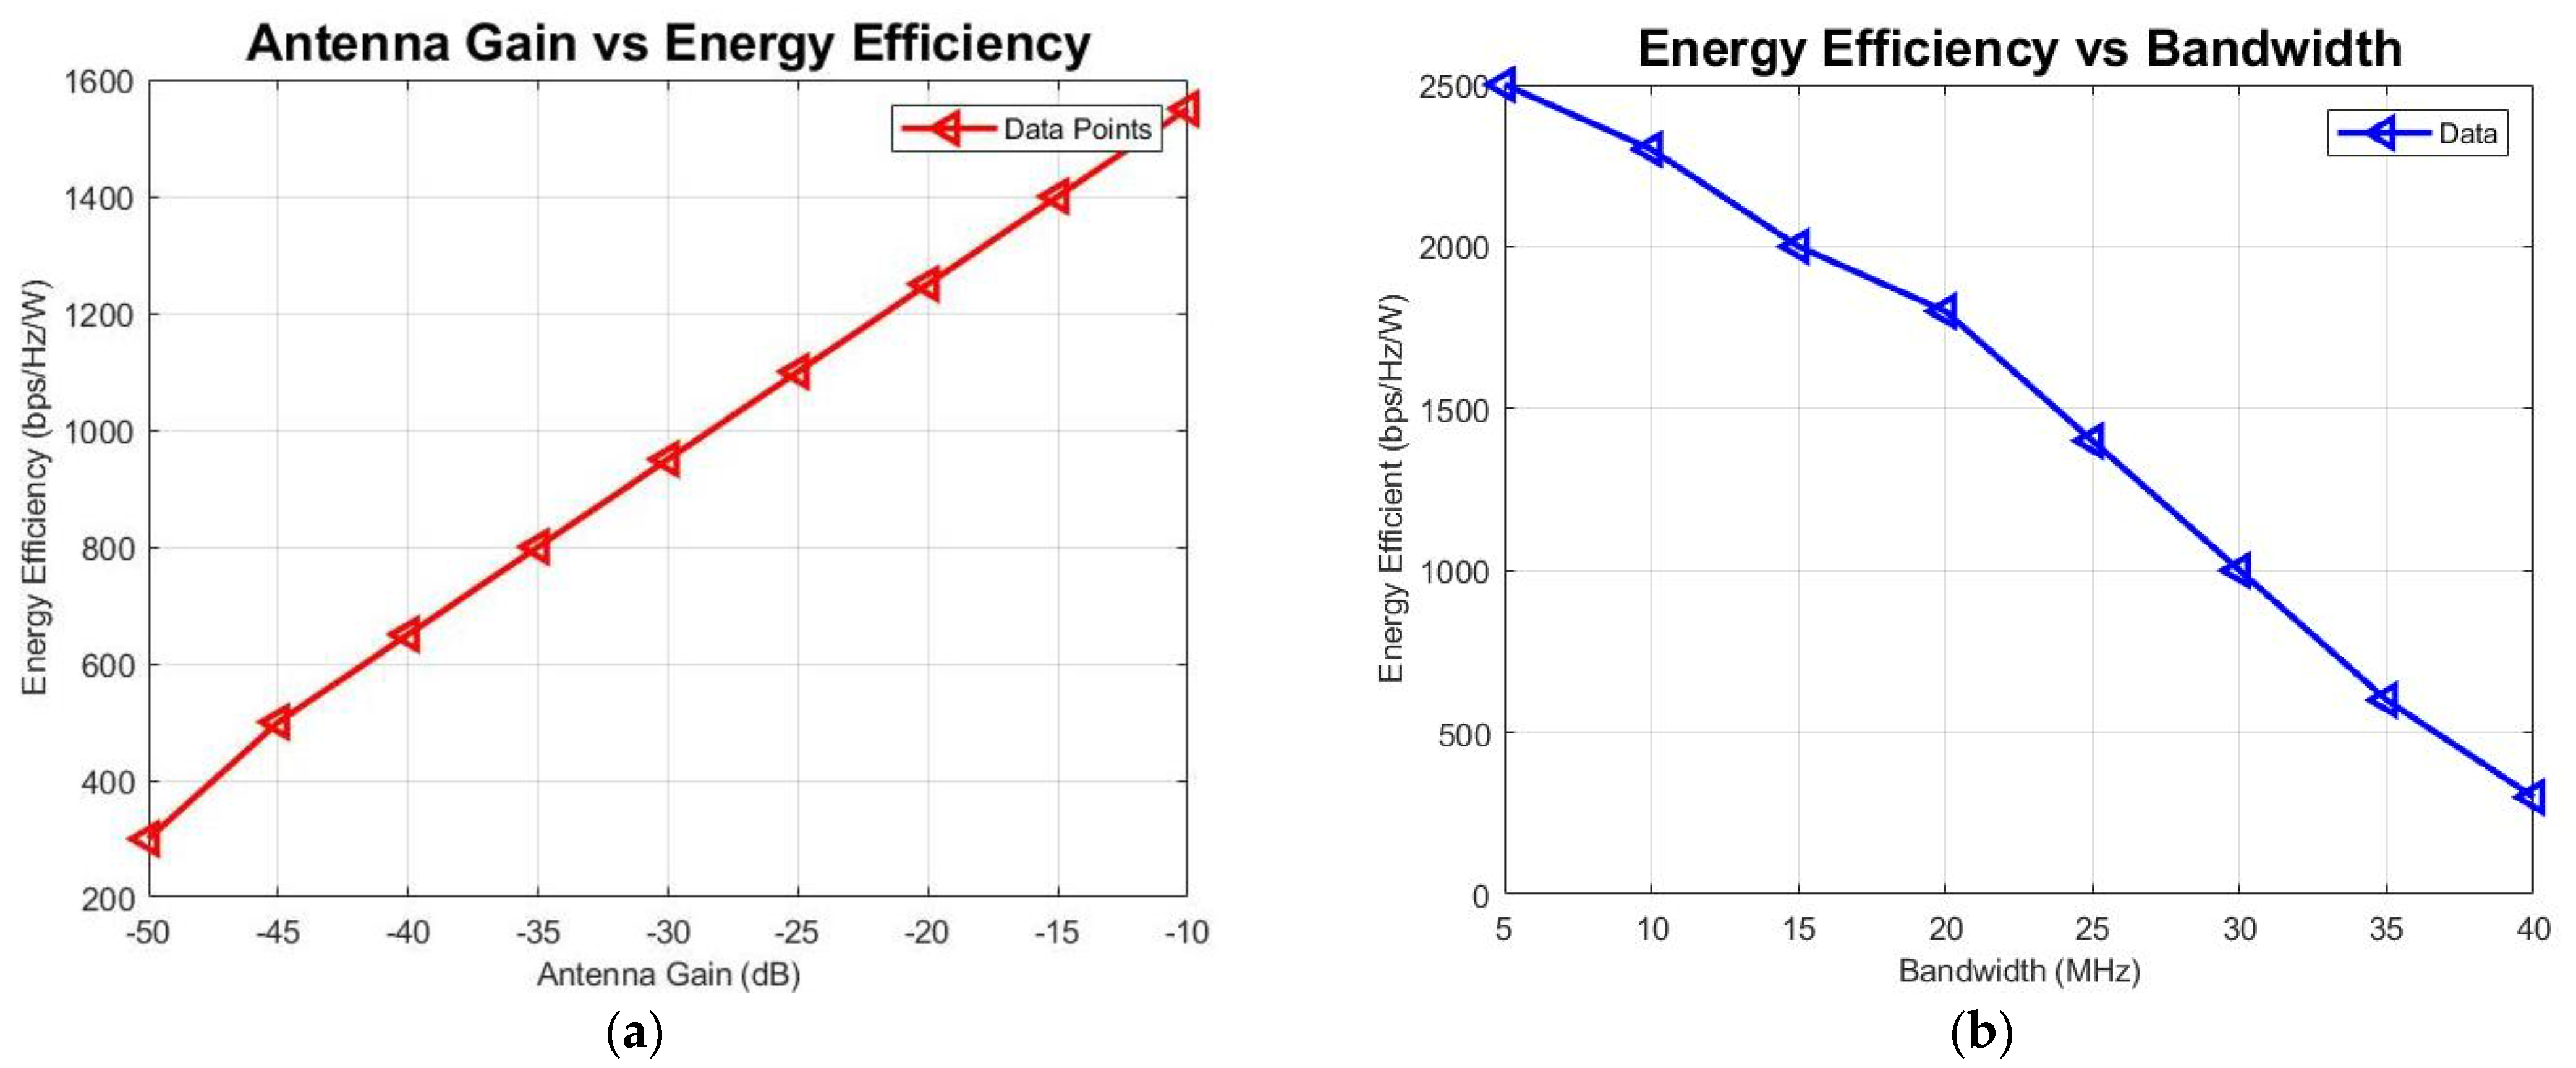
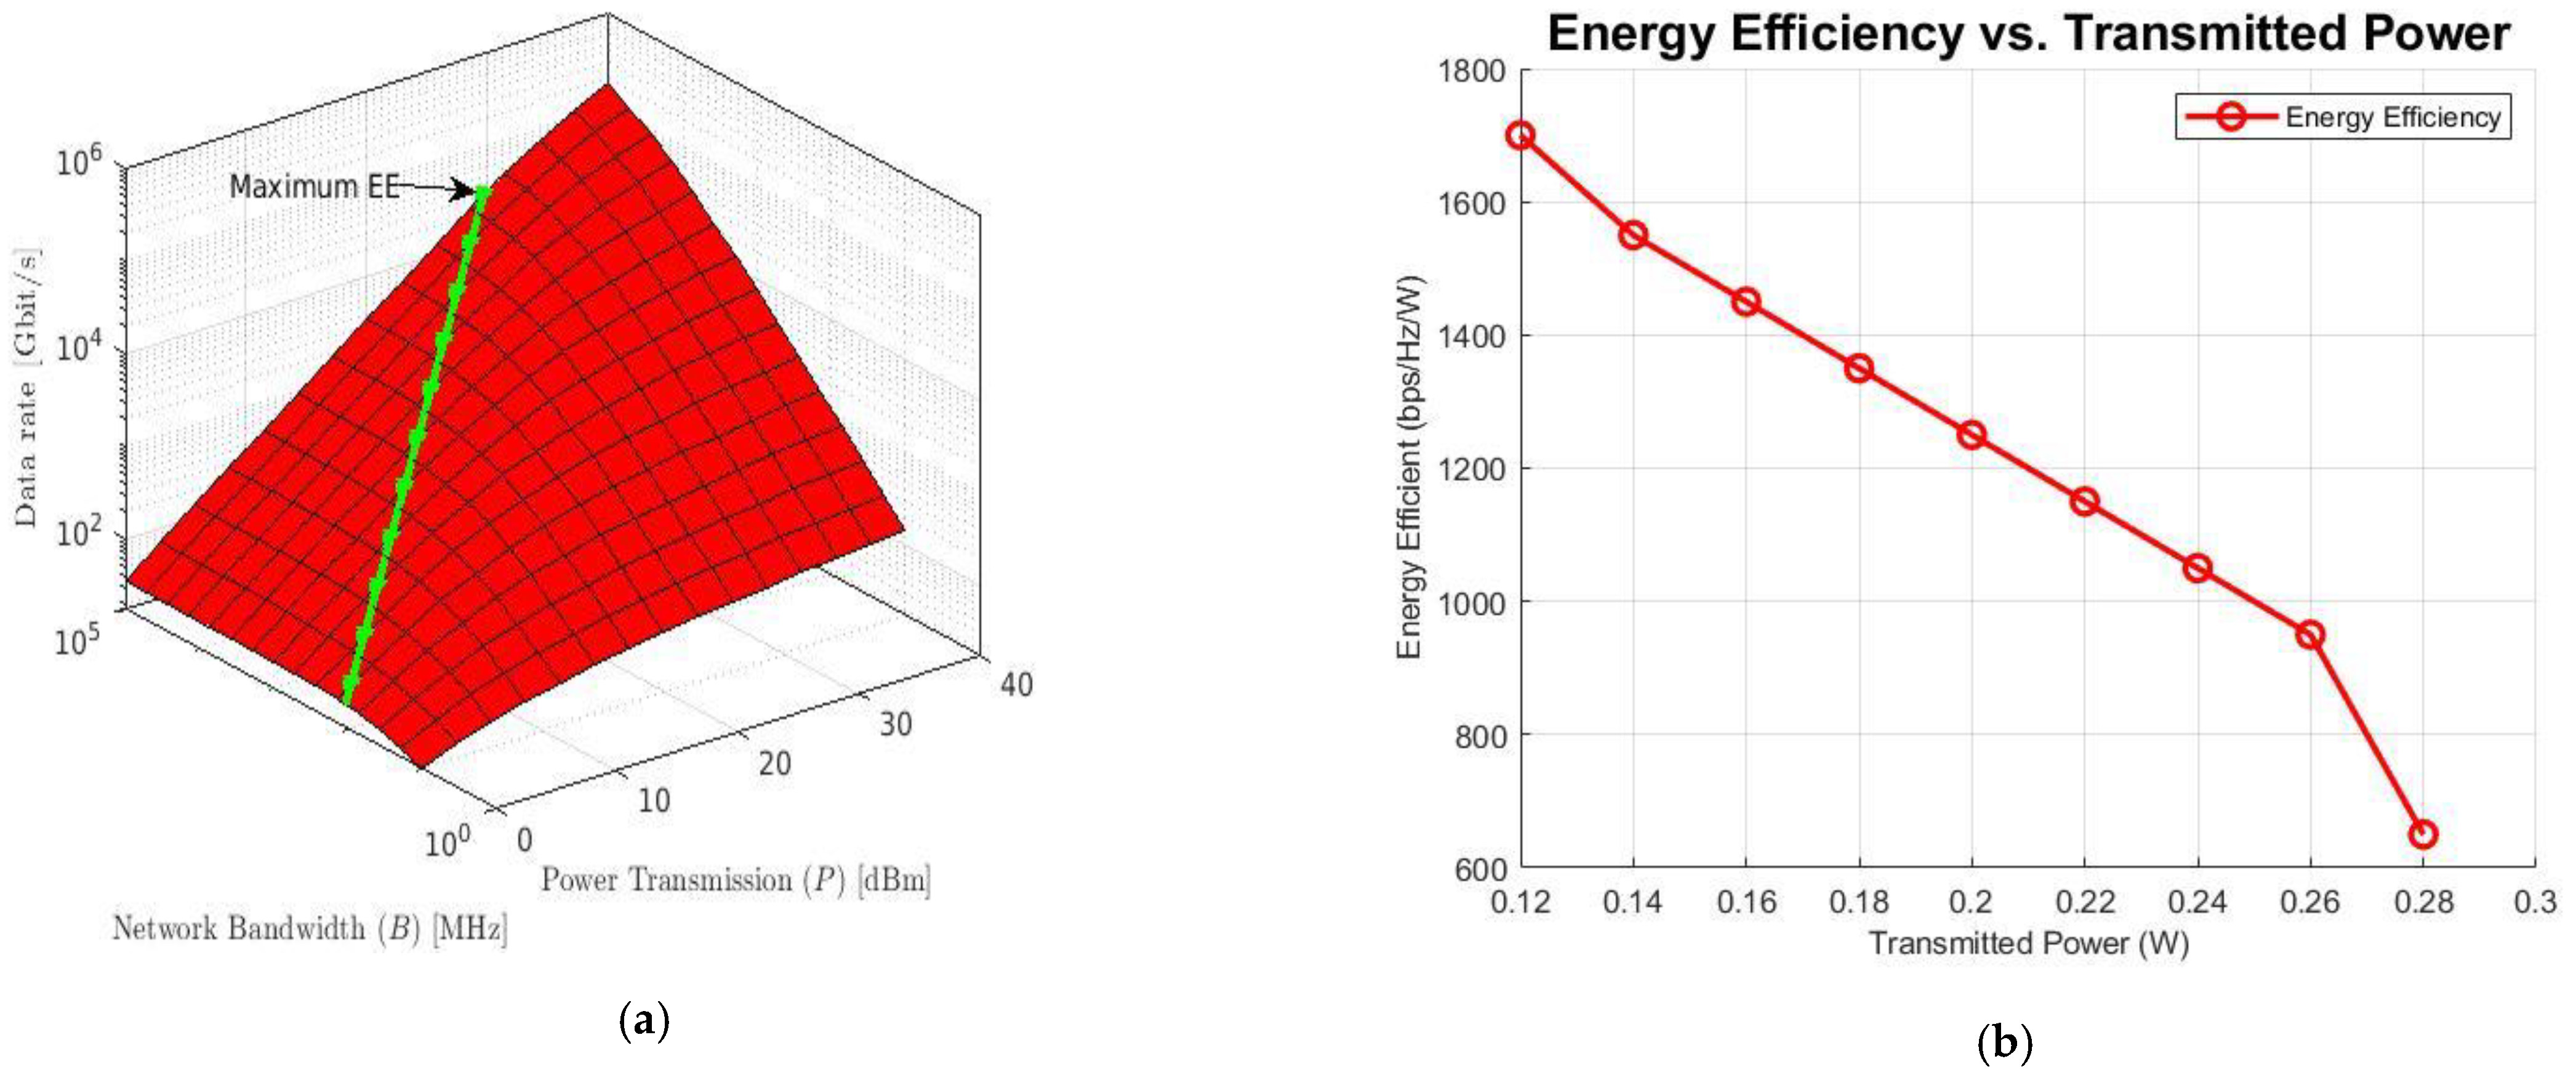
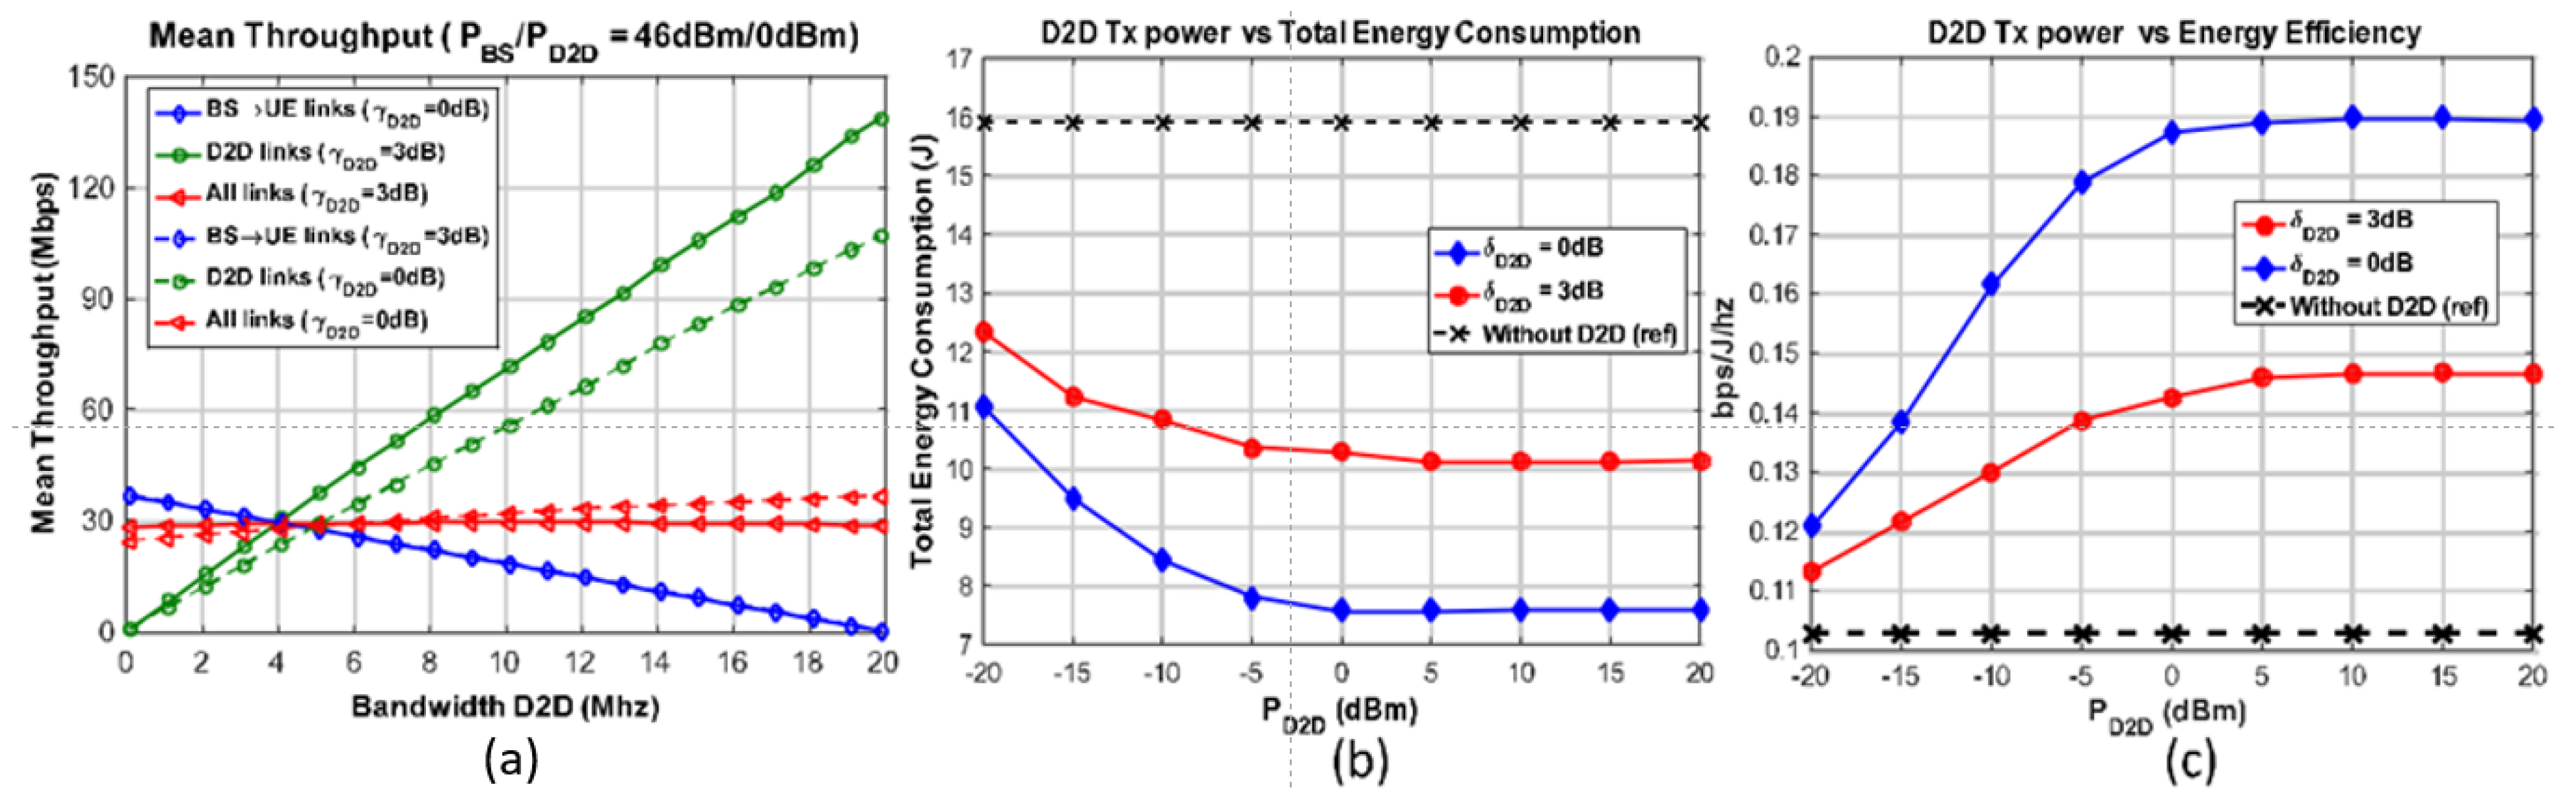
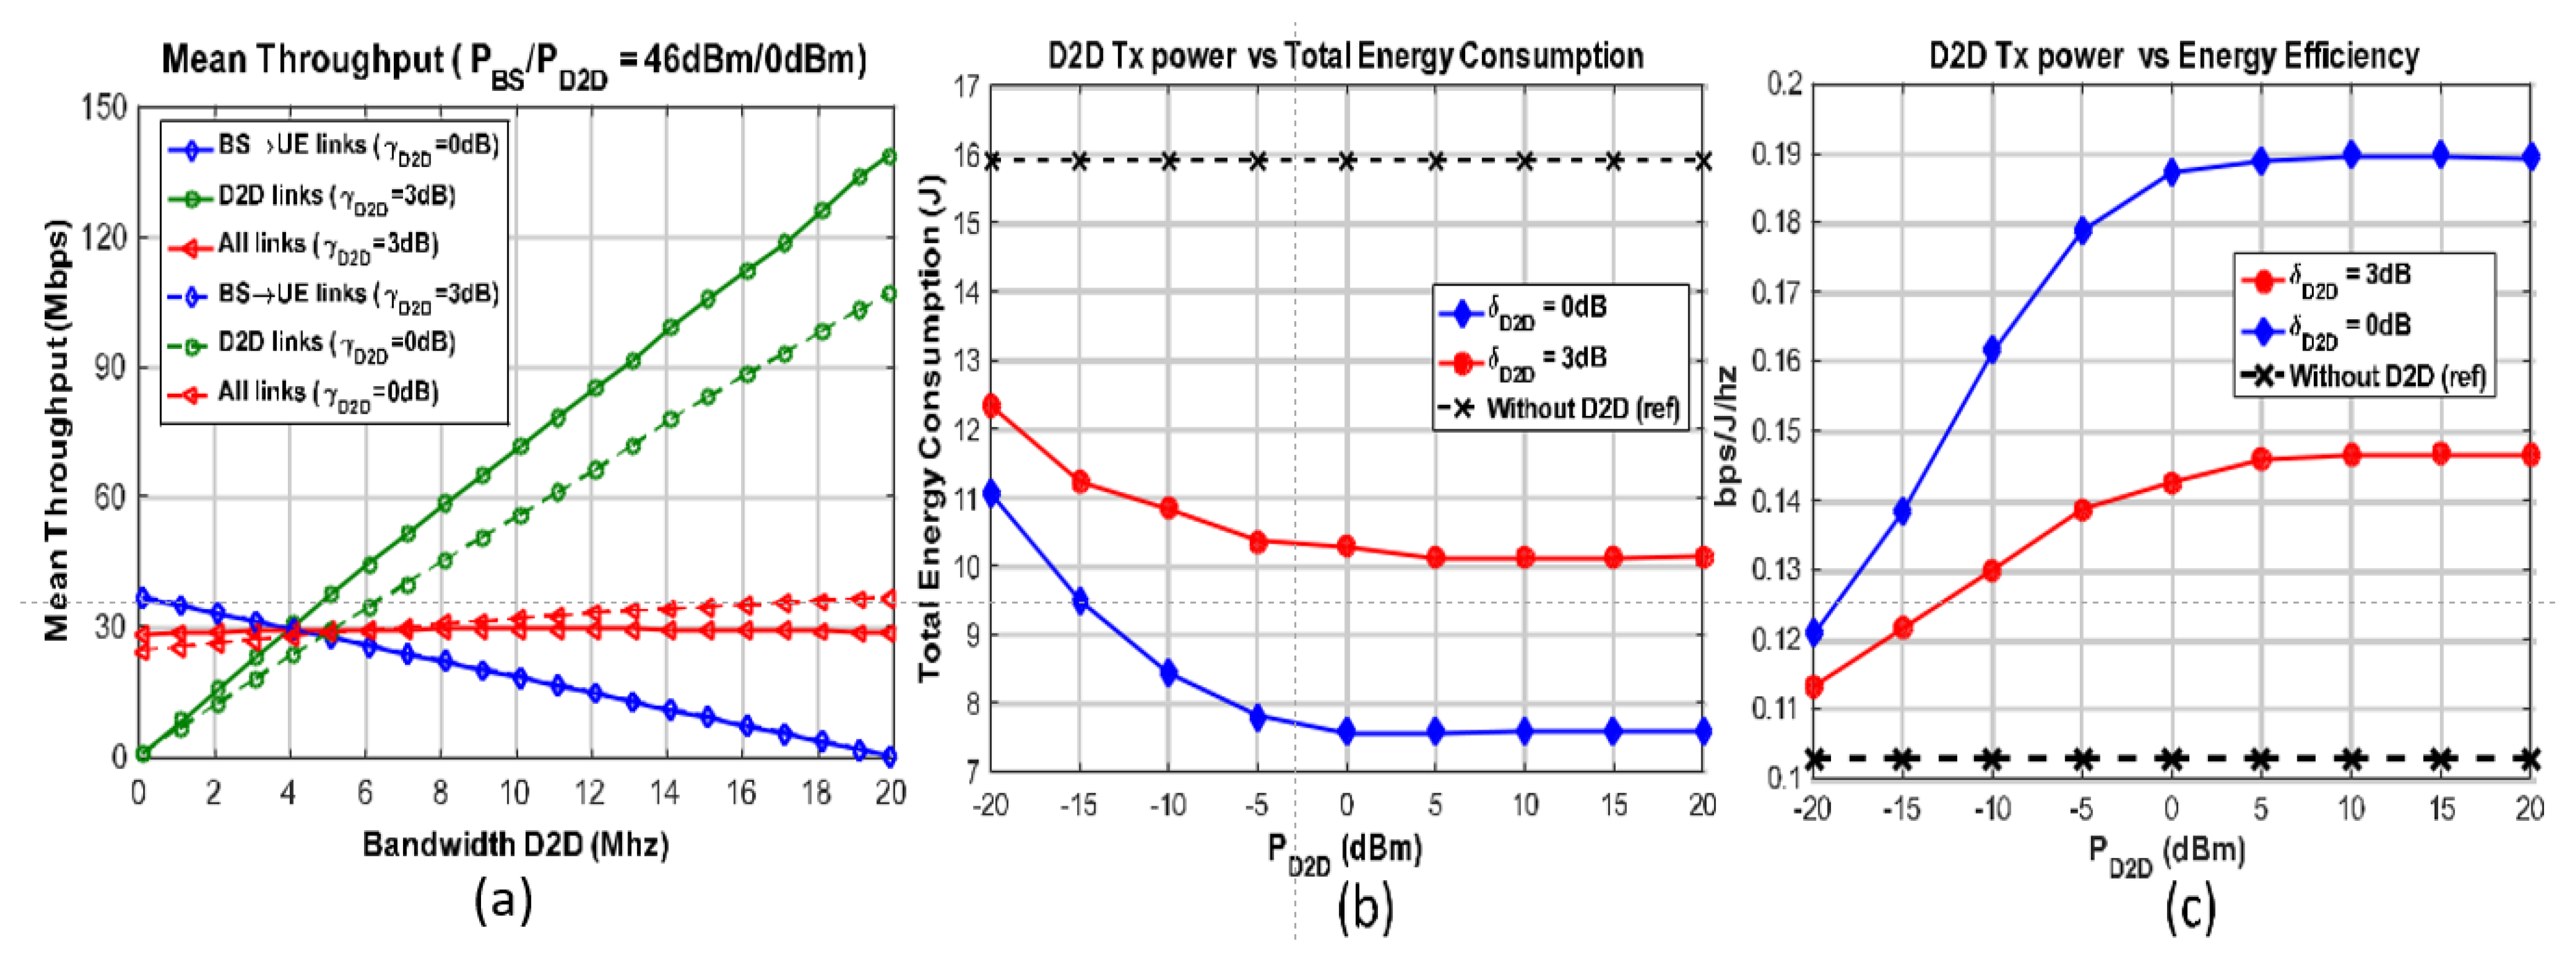
4.1. Numerical Results—SBD2D Communication Using Data Scheduling

The performance analysis of the proposed method is performed with the help of MATLAB. The SINR is the main parameter required to define the least QoS. The energy efficiency and network throughput are used to define the impact/influence of SBD2D communications. The simulation parameters are summarized in Table 3 below.
Two scenarios are considered: (i) a single-antenna system without interference between beekeepers, and (ii) multiple-antenna systems between beekeepers. For both cases, it is assumed that the communication happens over a network bandwidth of B Hz (Hertz), the power transmission is indicated as P Watt (W), and the noise power spectral density is represented as K0 W/Hz. Referring to Figure 6 below, from the first figure, it is indicated that the channel gain is the most important factor to obtain the maximum energy efficiency in a single-antenna system. In other words, the energy efficiency in 5G networks with a single antenna depends on the channel gain. The computation of the bandwidth is performed for free-space spread at 20 MHz with a path loss of 3.76 in an antenna, while the distances in practice are frequently much shorter. According to Figure 6b, to enumerate the energy efficiency in 5G networks that can be achieved, a noise power spectral density of −154 dBm/Hz is used, and also, we considered the antenna gains ɤ ranging from −50 dB to −15 dB. In this figure, the results for the energy efficiency (as indicated in Figure 6) obtained from the simulation range from 200 to 2500 bps/Hz/W. In a single-antenna system with a channel gain, the energy efficiency limits take these numbers. Considering the factor P/B, we can state that the energy efficiency becomes maximized as the P/B tends to zero, which can be reached when we consider that the power transmission P tends to zero, taking the bandwidth B tending to infinite (B → ∞) or the combination of both. As indicated in this figure, when the antenna gain becomes −45 dB, the energy efficiency becomes approximately 500 bps/Hz/W. It is shown that, as the antenna gain increases, the energy efficiency also increases. We can conclude that the maximum energy efficiency in a single antenna depends on the antenna gain.
The analysis of the previous simulation showed that, if the power (P) tends to zero (P → 0), we obtain 0 bit/s or we obtain 500 bit/s in the case of the bandwidth (B) tending to zero (B → 0). The second figure illustrates how the energy efficiency is limited, as long as bandwidth tends to zero (B → 0) when the power (P) takes the value of 20 dBm with a noise power spectral density of −154 dBm/Hz. In the figure, there are also different values of channel gain, ranging from −50 dB to −90 dB, that are considered and used to determine how quickly the limits of the energy efficiency are approached.
It is indicated in the figure that, for the case of −70 dB, the energy efficiency’s limit is already reached at 10 Hz, and this becomes more than 10 Hz when the channel gains take the value of −50 dB. We need to have 100 times more bandwidth every time the channel gain ɤ is increased by 20 dB. The energy efficiency increases with the bandwidth, but the limit and the convergence depend strongly on the channel gain ɤ, however, when the channel gain becomes −90 dB, there is an increase and decrease in the energy efficiency limit.
As indicated in Figure 7a,b, some parameters are to be considered without a loss of generality. The exact channel gain parameters configured as IG1 and IG2 are interference parameters, and α1, and α2 are the noise parameters of channels 1 and 2 between the corresponding beekeepers and base stations, respectively. Figure 7a,b represent the two near-to-near cells in the cellular network applied in the SBD2D communication energy efficiency model to improve the transmission of data in SBD2D communication. The impact of the base stations’ transmission power on the energy efficiency in smart beekeeping and the spectrum efficiency is demonstrated by the above figures. It also represents the impact of the number of antennas by the beekeepers, where two types of channel gain parameters are set to the specified values for the simplicity of illustrating the energy efficiency and spectrum efficiency changes.
The IG1 = IG2 = 0.1 and α21 = α22 = 0.1, the values of the base station transmission power are standardized from 0 to 1. According to Figure 7a, the transmission power of both base stations influences the energy efficiency. The energy efficiency non-linearly decreases when the transmission power increases. The transmission power of both the BSs has an impact on the spectrum efficiency, as illustrated in Figure 7b. The spectrum efficiency non-linearly increases if the transmission power of the base stations is increased. Additionally, the smaller the value of the transmission power, the greater the impact on the energy efficiency and spectrum efficiency. We can conclude from the figures that small cells improve the SNR (signal-to-noise ratio), because you obtain massive power for the same power transmission and an improved SNR, because you get closer to the home BS; you also get closer to the other BS. There is also an improvement in the cell-edge SINR (signal-to-interference noise ratio) and the circuit power shared.

4.2. Numerical Results—SBD2D Energy-Efficient Algorithm

The graph in Figure 8 compares the active current and standby current for different ratios. The results from the simulation show that an increase in the standby time results in the wastage of a lot of energy, as shown by the blue line in our graph. If the active-to-standby ratio is set to 1:1000, the current consumption reaches 104 μA in twenty seconds, if the active-to-standby ratio is set to 1:100, the maximum current consumption in the same time (20 s) is 103 μA, and if the active to standby ratio is set to 1:10, the current consumption reaches 102 μA in twenty seconds. This shows that an increase in the standby time leads to a high rate of current consumption. The ratio of 1:10 is selected because it seems to be the best, as, by decreasing the standby time and increasing the active time, the microcontroller will need to wake up more often, which consumes a lot of power. To optimize the power, we set the SBD2D to operate under the ratio of 1:10, taking a sample period of 60 s, according to Figure 3, as every sensor in smart beekeeping takes 2 s to active and 13 s in standby mode. The active current consumption remains the same at any level of transmission from the active to standby ratio.

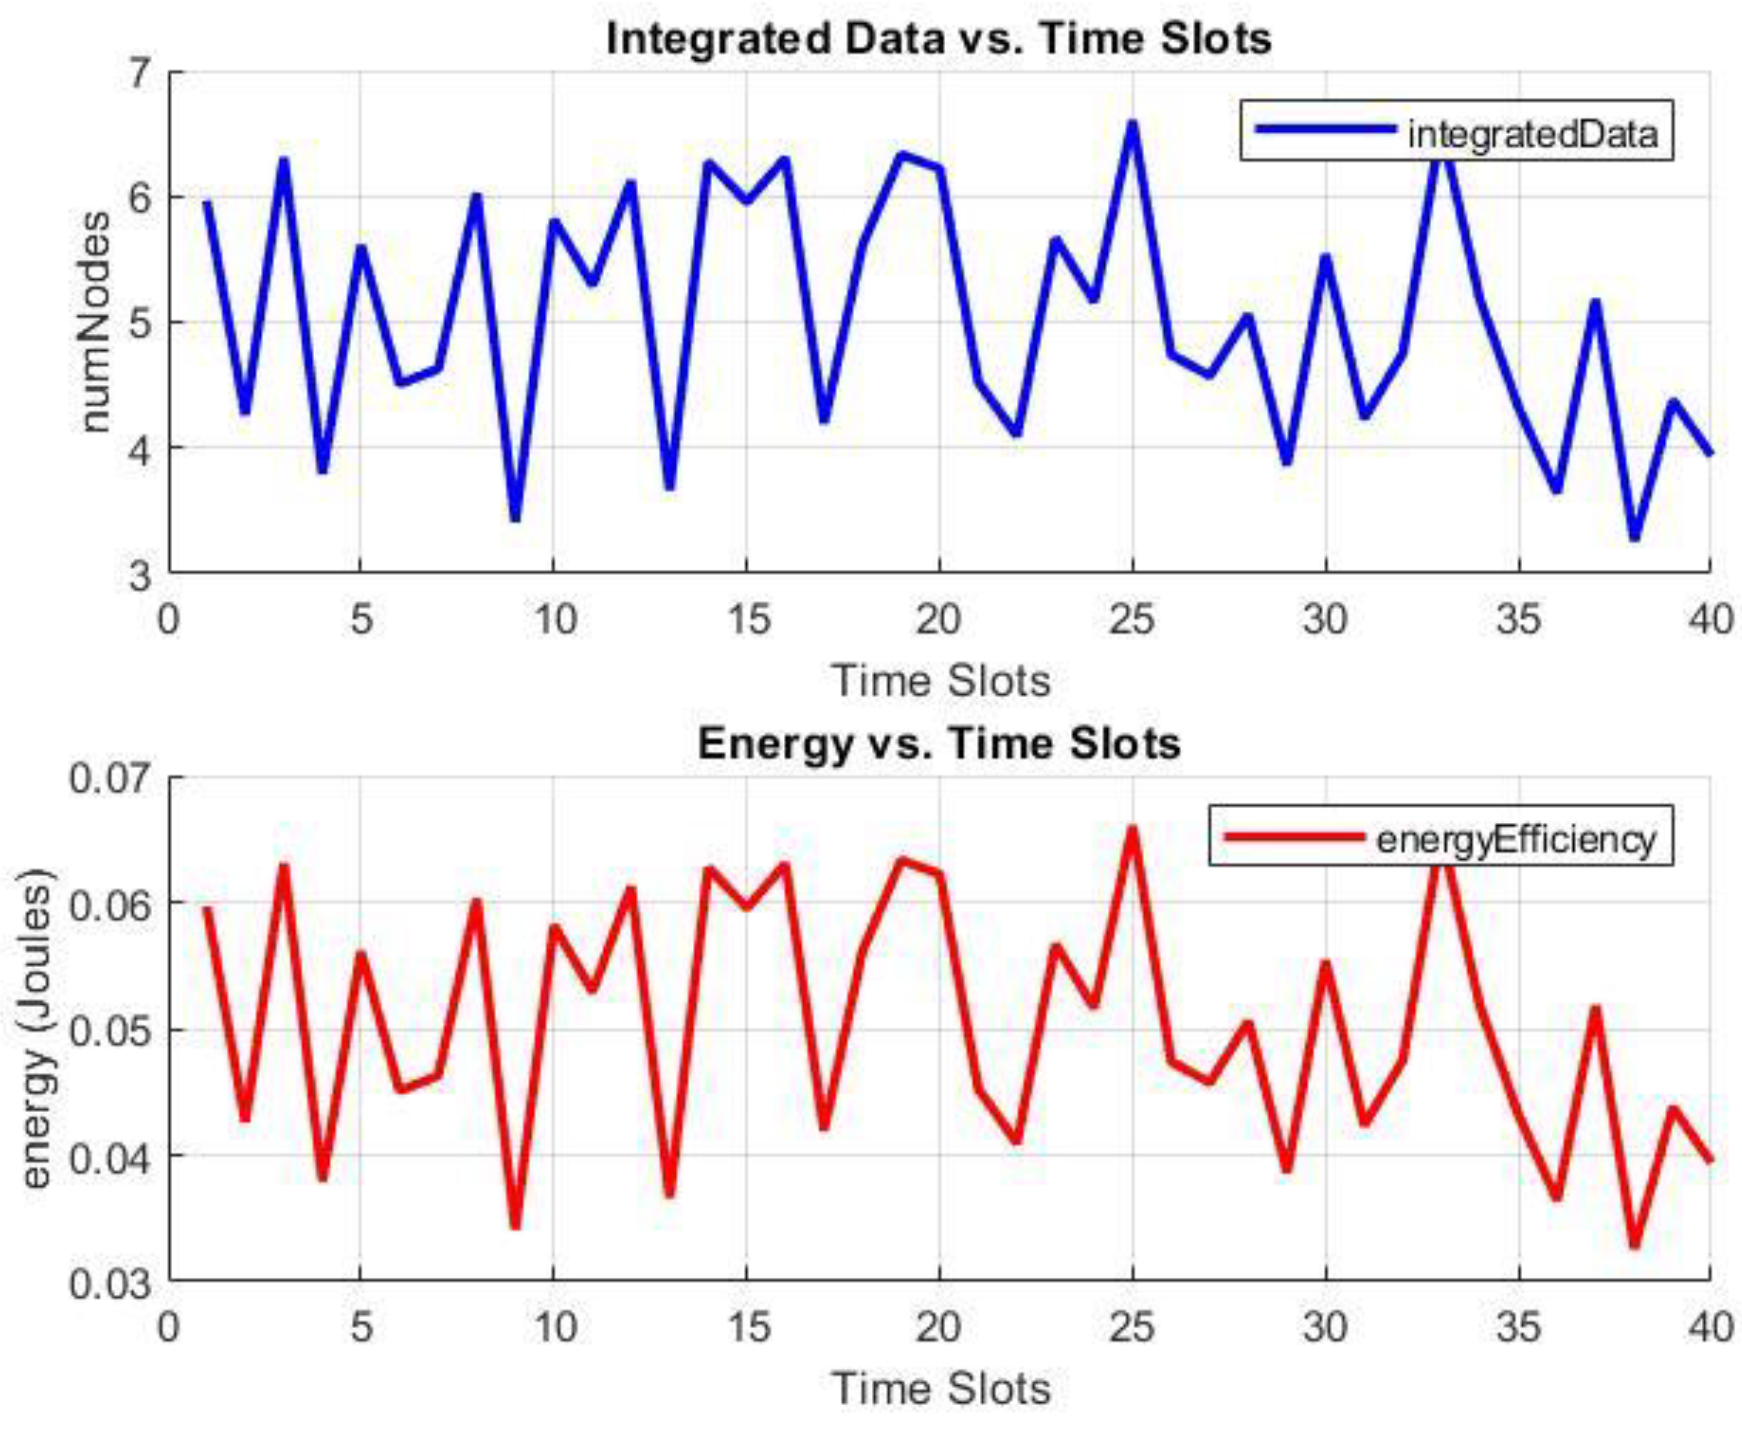
4.3. Numerical Results—SBD2D Communication Using Data Integration

The results of our proposed algorithm are displayed in Figure 9 below. According to the findings, combining SBD2D communication with a data integration technique indicates a considerable improvement in the energy efficiency throughout the process of data exchange. This is illustrated by the fact that this improvement was observed throughout the entire process. The graph indicates that, even as the nodes exchange data, the overall energy consumption does not increase significantly. This is true up until the stage where the final node integrates all of the data and sends the packet to the base station. In addition, it was discovered that the amount of energy used during the transmission of the packet to the base station does not exceed 1 joule.
It can be seen from the graphs in Figure 9 that the utilization of D2D communication and data integration is a significant contributor to the consistent low energy consumption that occurs during the exchange of data between the nodes. Employing this strategy brings about an immense decrease in the system’s total energy consumption. D2D communication eliminates the energy consumption that is involved with sending data through numerous intermediate nodes by making it possible for direct communication to take place between these nodes, without the requirement for centralized routing. Data integration techniques combine and aggregate many data points into a single packet, which is then transmitted from each node to the base station, as opposed to delivering individual data packets individually. This aggregation reduces the number of duplicated transmissions, resulting in energy savings. The low energy consistency usage during the data exchange provides strong evidence that the integration process successfully cuts down on the transmission overhead and maximizes the use of network resources.
The energy required to transmit the integrated data packet from the last node to the base station is less than 1 joule. This demonstrates that the final transmission stage also benefits from the energy efficiency gained by the D2D communication and data integration approaches. Maintaining such a low energy usage during packet transmission is a significant achievement, as it helps to reduce energy waste and promotes beekeeping as a sustainable practice. The benefits of a lower latency in D2D communication are clearly illustrated by the findings. Since data may be shared in real time across surrounding nodes, the hive can react quickly to changing conditions and make better decisions. In smart beekeeping, this aspect of D2D communication is vital, since it enables beekeepers to quickly handle any problems, improve hive management, and increase bee productivity. Since data are exchanged quickly within a short time between the nodes, the energy usage is reduced.

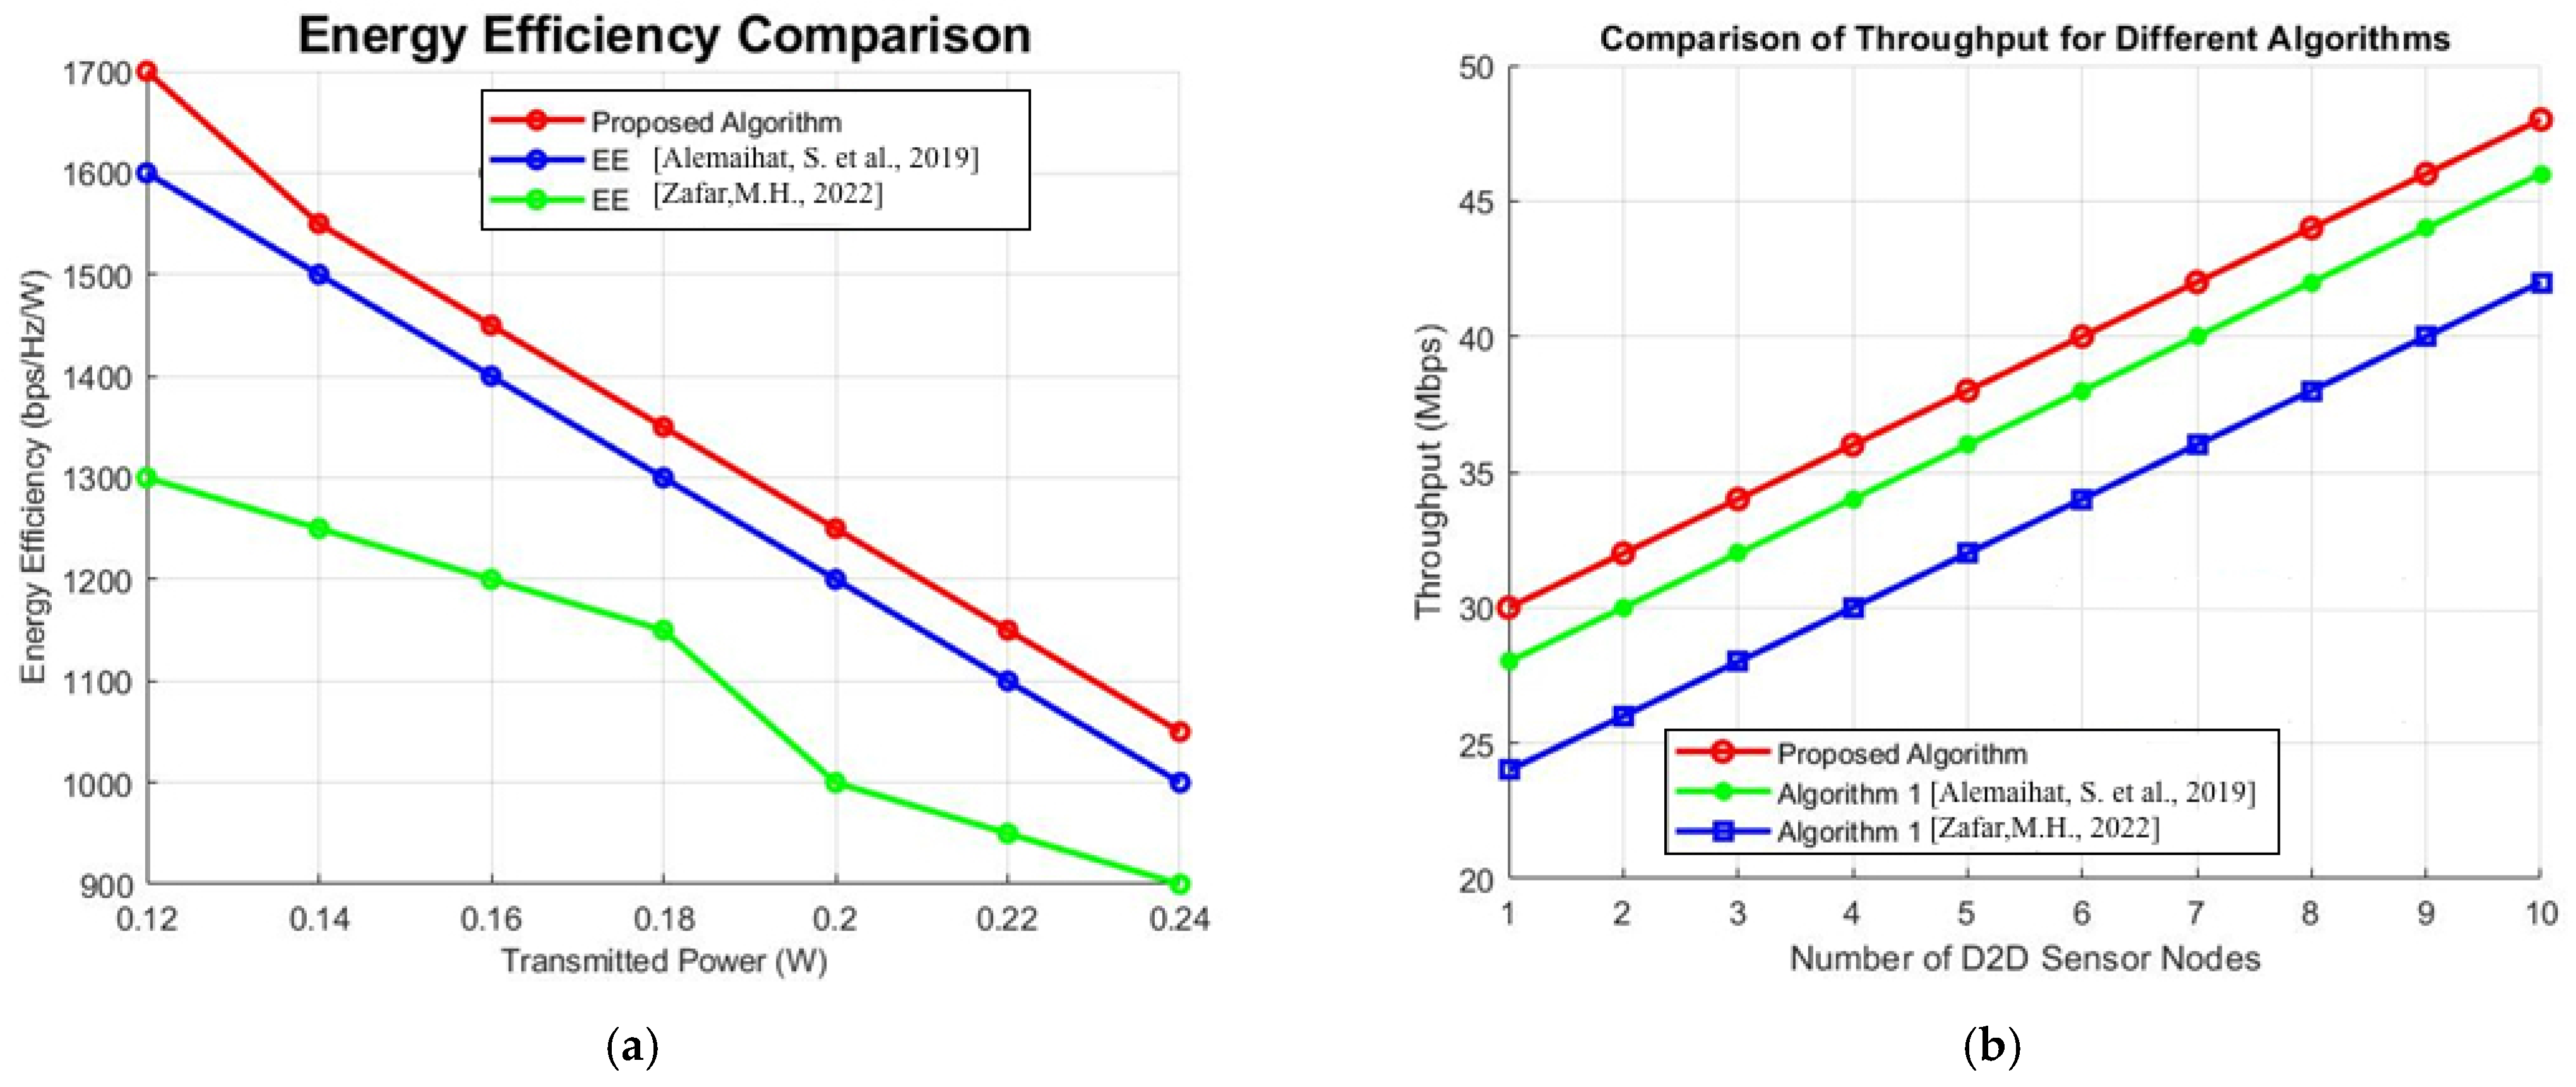
4.4. Performance Analysis of Proposed Model

In the results, CDF symbolizes the outage likelihood and performance distribution. These curves deliver information related to network behaviors such as QoS, coverage, the energy used, and performance, which can be stretched via beekeepers in the system. In the discovery phase analysis, as illustrated in Figure 10a, which indicates the proportion of SBD2D connections achieved during the discovery phase conferring to the diverse SBD2D transmitting powers, where the least SINRs necessary for an SBD2D connection are τD2D = 0 dB and 3dB, the τD2D assures a least throughput level and it is employed in the discovery phase. Therefore, the number of SBD2D connections for τD2D = 0 dB is meaningfully greater than that for τD2D = 3 dB. It can also be observed that allowing an SBD2D spreading power higher than 0 dBm does not influence the variation in the number of smart beekeeping D2D connections (when τD2D = 0 dB, the percentage is around 54%, and it is around 37% when τD2D = 3 dB).
This is a consequence of the interference that occurs between smart beekeeping devices, since they use the same frequency bandwidth. For the communication phase analysis, Figure 10b,c compare the CDFs of the throughput of the devices straightly linked to their serving base station (shown by dark curves) to the CDF, indicating the SBD2D connections (shown by colored curves). In Figure 10b, the smallest Signal Interference and Noise Ratio (SINR) necessary for a SBD2D connection is set to τD2D = 0 dB, and in Figure 10c, the τD2D is set to 3 dB. It can be seen that, in Figure 10b, regular connections outperform the SBD2D connections when the SBD2D transmitted power is less than or equal to ‒10 dBm. Furthermore, once the SBD2D diffused power is bigger than or equivalent to 0 dBm (i.e., 0 dBm, 10 dBm, and 20 dBm), the CDFs of the SBD2D connections are nearby one another. Consequently, it is sufficient to allocate a low D2D transmission power (i.e., 0 dBm) to stretch a higher level of performance.
Figure 11 compares the throughput average of the SBD2D connections, the regular connections, and the global system networks of 5G for different bandwidth sizes of the total available bandwidth (i.e., 20 MHz) allocated to the overlay SBD2D communication. In the case of an SBD2D bandwidth greater than or equal to 5 MHz, it can be observed that the global system performance, in terms of the throughput, is higher when τD2D = 0 dB. Otherwise, the case of τD2D = 3 dB has better global performances. Figure 11a presents the mean energy consumption of the overall system. It can be seen from the figure that the mean energy consumption declines once the SBD2D spreading power increases. This is because the proportion of SBD2D connections upsurges when the SBD2D transmitting power increases, and SBD2D connections consume less energy than regular communications. From the analysis and evaluations made, the best configuration of SBD2D corresponds to a transmitting power of Pd2d = 0 dBm, the smallest SINR necessary for an SBD2D linkage is τD2D = 0 dB, and a frequency bandwidth of 5 MHz is best for SBD2D communications.

Performance Comparison

Various techniques have been adopted in this work, making the proposed algorithm perform energy efficiently and with an improved throughput. As discussed above, data integration reduces latency and allows for devices to exchange data within a very short time period. Reducing the communication time leads to a reduced energy consumption of communicating nodes, thereby making the algorithm energy efficient. Data scheduling is another technique adopted in this work that makes the proposed algorithm energy efficient. In SBD2D, the algorithm sets some devices to be in active mode during transmission, while others are in standby mode. This technique reduces the interference of a signal during transmission and the data will be received on the last node to the destination side effectively and efficiently, without loss. Figure 12 shows how the proposed algorithm performs compared to existing works [11,12], in terms of energy efficiency and throughput.

5. Conclusions and Future Work

In this paper, we analyzed the energy efficiency and throughput performance of SBD2D communication based on data integration and data scheduling. Furthermore, the design and development of an energy-efficient algorithm for SBD2D communication based on data scheduling during transmission were achieved in this research. The energy savings from the data-integration-based algorithm outweighed those from the data-scheduling-based method. The algorithm has implications for the field of smart beekeeping, as techniques for energy-efficient communication and data integration can contribute to sustainable hive management practices. Reduced energy consumption not only provides environmental benefits, but also economic benefits by optimizing resource utilization. Our future work will explore the possibility of combining small cells and massive MIMO and consider some other factors (variables), such as frequency band, fading parameter, shadowing parameter, and hardware components, to enhance the performance of SBD2D communication.

Author Contributions

The ideas presented in this work are a product of collaborative efforts by the authors. Conceptu-alization was done by author E.N. in consultation with supervision team of S.K. and L.S. Method-ology, E.N.; software, E.N. validation, K.M.; writing original manuscript, E.N.; Review and editing, K.M. All authors have read and agreed to the published version of the manuscript.

Funding

This research received no external funding.

Institutional Review Board Statement

Not applicable.

Informed Consent Statement

Not applicable.

Data Availability Statement

Not applicable.

Conflicts of Interest

The authors declare no conflict of interest.

References

  1. Doppler, K.; Ribeiro, C.B.; Kneckt, J. Advances in D2D communications: Energy efficient service and device discovery radio. In Proceedings of the 2011 2nd International Conference on Wireless Communication, Vehicular Technology, Information Theory and Aerospace & Electronics Systems Technology (Wireless VITAE), Chennai, India, 28 February–3 March 2011; IEEE: Piscataway, NJ, USA, 2011. [Google Scholar]
  2. Hadyanto, D.P.; Novariana, D.S.; Wulandari, A. Device-to-device communication in 5G. In Proceedings of the International Joint Conference on Science and Engineering 2021 (IJCSE), Online, Serbia, 15–17 July 2021; Atlantis Press: Amsterdam, The Netherlands, 2021; pp. 649–654. [Google Scholar]
  3. Chai, Y.; Du, Q.; Ren, P. Partial time-frequency resource allocation for device-to-device communications underlaying cellular networks. In Proceedings of the 2013 IEEE International Conference on Communications (ICC), Budapest, Hungary, 9–13 June 2013; IEEE: Piscataway, NJ, USA, 2013. [Google Scholar]
  4. Astely, D.; Dahlman, E.; Fodor, G.; Parkvall, S.; Sachs, J. LTE Release 12 and Beyond. IEEE Commun. Mag. 2013, 51, 154–160. [Google Scholar] [CrossRef]
  5. MAlsharif, H.; Nordin, R.; Abdullah, N.F.; Kelechi, A.H. How to make key 5G wireless technologies environmentally friendly: A review. Trans. Emerg. Telecommun. Technol. 2018, 29, e3254. [Google Scholar] [CrossRef]
  6. Ericsson Mobility Report 2018. November 2018. Available online: https://www.ericsson.com/assets/local/mobility-report/documents/2018/ericsson-mobility-report-november-2018.pdf (accessed on 24 May 2020).
  7. Nagapuri, L.; Prabu, A.V.; Penchala, S.; Salah, B.; Saleem, W.; Kumar, G.S.; Aziz, A.S.A. Energy Efficient Underlaid D2D Communication for 5G Applications. Electronics 2022, 11, 2587. [Google Scholar] [CrossRef]
  8. Adachi, T.; Nakagawa, M. A study on channel usage in a cellular ad-hoc united communication system. IEICE Trans. Commun. 1998, E81-B, 1500–1507. [Google Scholar]
  9. Asadi, A.; Wang, Q.; Mancuso, V. A survey on device-to-device communication in cellular networks. IEEE Commun. Surv. Tutor. 2014, 16, 1801–1819. [Google Scholar] [CrossRef] [Green Version]
  10. Jedari, B.; Xia, F.; Ning, Z. A Survey on Human-Centric Communications in Non-Cooperative Wireless Relay Networks. IEEE Commun. Surv. Tutor. 2018, 20, 914–944. [Google Scholar] [CrossRef]
  11. Qiu, X.; Xuewen, L.; Dong, K.; Zhu, S. Energy Efficiency Analysis in Device-to-Device Communication Underlying Cellular Networks. In Proceedings of the 2013 IEEE 10th Consumer Communications and Networking Conference (CCNC), Las Vegas, NV, USA, 11–14 January 2013. [Google Scholar]
  12. Alemaishat, S.; Saraereh, O.A.; Khan, I.; Choi, B.J. An Efficient Resource Allocation Algorithm for D2D Communications Based on NOMA. IEEE Access 2019, 7, 120238–120247. [Google Scholar] [CrossRef]
  13. Zafar, M.H. An Efficient Resource Optimization Scheme for D2D Communication; Springer: Berlin/Heidelberg, Germany, 2022. [Google Scholar]
  14. Jung, M.; Hwang, K.; Choi, S. Joint Mode Selection and Power Allocation Scheme for Power-Efficient Device-to-Device (D2D) Communication. In Proceedings of the 2012 IEEE 75th Vehicular Technology Conference (VTC Spring), Yokohama, Japan, 6–9 May 2012. [Google Scholar]
  15. Yaacoub, E.; Ghazzai, H.; Alouini, M.-S.; Abu-Dayya, A. Achieving energy efficiency in LTE with joint D2D communications and green networking techniques. In Proceedings of the 2013 9th International Wireless Communications and Mobile Computing Conference (IWCMC), Sardinia, Italy, 1–5 July 2013. [Google Scholar]
  16. Doppler, K.; Rinne, M.; Wijting, C.; Ribeiro, C.B.; Hugl, K. Device-to-Device Communication as an Underlay to LTE-Advanced Networks. IEEE Commun. Mag. 2009, 47, 42–49. [Google Scholar] [CrossRef]
  17. Fodor, G.; Dahlman, E.; Mildh, G.; Parkvall, S.; Reider, N.; Miklós, G.; Turányi, Z. Design Aspects of Network Assisted Device-to-Device Communications. IEEE Commun. Mag. 2012, 50, 170–177. [Google Scholar] [CrossRef]
  18. Feng, D.; Lu, L.; Yuan-Wu, Y.; Li, G.Y.; Feng, G.; Li, S. Device-to-Device Communications Underlaying Cellular Networks. IEEE Trans. Commun. 2013, 61, 3541–3551. [Google Scholar] [CrossRef]
  19. Hussain, F.; Hassan, M.Y.; Hossen, M.S.; Choudhury, S. System capacity maximization with efficient resource allocation algorithms in D2D communication. IEEE Access 2018, 6, 32409–32424. [Google Scholar] [CrossRef]
  20. Li, J.; Lei, G.; Manogaran, G.; Mastorakis, G.; XMavromoustakis, C. D2D communication mode selection and resource optimization algorithm with optimal throughput in 5G network. IEEE Access 2019, 7, 25263–25273. [Google Scholar] [CrossRef]
  21. Höyhtyä, M.; Apilo, O.; Lasanen, M. Review of Latest Advances in 3GPP Standardization: D2D Communication in 5G Systems and Its Energy Consumption Models. Future Internet 2018, 10, 3. [Google Scholar] [CrossRef] [Green Version]
  22. Cisco Visual Networking Index: Global Mobile Data Traffic Forecast Update, 2015–2020. December 2016. Available online: www.cisco.com (accessed on 1 June 2023).
  23. Zappone, A.; Jorswieck, E. Energy efficiency in wireless networks via fractional programming theory. Found. Trends Commun. Inf. Theory 2015, 11, 185–396. [Google Scholar] [CrossRef]
  24. Ericsson White Paper. More than 50 billion connected devices. Ericsson Tech. Rep. 2011, 284, 23–3149. [Google Scholar]
  25. Andrew, J.G.; Buzzi, S.; Choi, W.; Hanly, S.V.; Lozano, A.; Soong, A.C.K.; Zhang, J.C. What will 5g be? IEEE J. Sel. Areas Commun. 2014, 32, 1065–1082. [Google Scholar] [CrossRef]
  26. Venturino, L.; Zappone, A.; Risi, C.; Buzzi, S. Energy-efficient scheduling and power allocation in downlink ofdma networks with base station coordination. IEEE Trans. Wirel. Commun. 2015, 14, 1–14. [Google Scholar] [CrossRef] [Green Version]
  27. Kamruzzaman, M.; Sarkar, N.I.; Gutierrez, J. A dynamic algorithm for interference management in D2D-enabled heterogeneous cellular networks: Modeling and analysis. Sensors 2022, 22, 1063. [Google Scholar] [CrossRef]
  28. Zappone, A.; Sanguinetti, L.; Bacci, G.; Jorswieck, E.A.; Debbah, M. Energy-efficient power control: A look at 5G wireless technologies. IEEE Trans. Signal Process. 2016, 64, 1668–1683. [Google Scholar] [CrossRef] [Green Version]
  29. Sinaie, M.; Zappone, A.; Jorswieck, E.; Azmi, P. A novel power consumption model for effective energy efficiency in wireless networks. IEEE Wirel. Commun. Lett. 2015, 5, 152–155. [Google Scholar] [CrossRef]
  30. She, C.; Yang, C.; Liu, L. Energy-efficient resource allocation for MIMO-OFDM systems serving random sources with statistical QoS requirement. IEEE Trans. Commun. 2015, 63, 4125–4141. [Google Scholar] [CrossRef]
  31. Lynch, J.P.; Loh, K.J. A summary review of wireless sensors and sensor networks for structural health monitoring. Shock. Vib. Dig. 2006, 38, 91–130. [Google Scholar] [CrossRef] [Green Version]
  32. Sazonov, E.; Janoyan, K.; Jha, R. Wireless intelligent sensor network for autonomous structural health monitoring. Smart Struct. Mater. 2004 Smart Sens. Technol. Meas. Syst. 2004, 5384, 305–315. [Google Scholar]
  33. Palma, L.; Pernini, L.; Belli, A.; Valenti, S.; Maurizi, L.; Pierleoni, P. Ipv6 WSN solution for integration and interoperation between a smart home and AAL systems. In Proceedings of the 2016 IEEE Sensors Applications Symposium (SAS), Catania, Italy, 20–22 April 2016; pp. 1–5. [Google Scholar]
  34. Yadav, S.; Narayanankutty, K.A. A Industrial Timer and Real Time Keeper. Wirel. Eng. Technol. 2011, 2, 196–203. [Google Scholar] [CrossRef]
Figure 1. SBD2D system architecture.
Algorithms 16 00367 g001
Figure 2. Proposed system model for smart beekeeping using 5G D2D communications.
Algorithms 16 00367 g002
Figure 3. Relay node transmission.
Algorithms 16 00367 g003
Figure 4. Proposed block diagram integrating data scheduling.
Algorithms 16 00367 g004
Figure 5. Shows SBD2D System model based on data integration.
Algorithms 16 00367 g005
Figure 6. Energy efficiency with Antenna/Channel propagation and energy efficiency, including circuit power.
Algorithms 16 00367 g006
Figure 7. (a) Data rate vs. power transmission. (b) Energy-efficient vs. power transmission.
Algorithms 16 00367 g007
Figure 8. Energy efficient algorithm results in smart beekeeping D2D communication.
Algorithms 16 00367 g008
Figure 9. Performance and results of SBD2D based on data integration.
Algorithms 16 00367 g009
Figure 10. (a) Ratio of SBD2D users according to diverse SBD2D conveying powers, (b) CDF of Throughput for SBD2D connections with τD2D = 0 dBm, and (c) CDF of Throughput for SBD2D connections with τD2D = 4 dBm.
Algorithms 16 00367 g010
Figure 11. (a) Mean Throughput of SBD2D vs. bandwidth for SBD2D = 0 dB–4 dB, (b) Total energy consumption vs. different SBD2D transmitting powers with Pbs = 46 dBm, and (c) Energy-Efficiency vs. different SBD2D transmitting powers for τD2D = 0 dB and 4 dB, Pbs = 46 dBm, and WD2D = 5 MHz. Black dotted curves in (b,c) represent scenarios without SBD2D communication.
Algorithms 16 00367 g011
Figure 12. (a). Energy efficiency comparison based on D2D Transmitted power. (b). Throughput comparison based on different number of D2D Sensor Node, [12,13].
Algorithms 16 00367 g012
Table 1. Notation and abbreviations.
NotationDefinition
SINRSignal to Interference and Noise to ratio
QoSQuality of Service
KD2DThe fading coefficients of the D2D link
SBD2DSmart beekeeping device-to-device communication
α Symbolizes the path-loss exponent
AWGNAdditive white Gaussian noise
ToVariance
CUECellular user equipment
DTData throughput
TPTransmitter power with amplifier inefficiency
FPFixed circuit power
PCPower per transceiver chain
AThe coding/decoding/backhaul
BBandwidth of the line
KMultiplexed users
KDRThe link between the UE (D2D User Equipment) receiver and the Uth UE transmitter
KD2DThe fading coefficients of the D2D link
UEUser equipment
BDRThe complex normal distribution
rThe D2D link that uses the channel g
φ g ( r ) Data rate
McnTransmit power of D2D Transmitter
MDTransmit power of cellular user equipment
eNBEvolved node B
SCeNBSmall cell evolved node B
Table 2. The impacts of standby ratio on power consumption [33].
Active to Standby Ratio% Time in StandbyTime active × I active (µAs)Time standby × I standby (µAs)Total Charge (µAs)% Impact of I Standby to Total Power
1:1090%10051056.54%
1:10099%1005015033%
1:100099.9%10050060083.3%
Table 3. Simulation parameters.
ParameterValue
Bandwidth (MHz)40
Area (m)4 × m
Pathloss exponent3.76
Noise over pathloss at 1 km (dBm)33
Amplifier efficiency0.39
Quality of Service requirements (Mbps)50 for at least 95% of the user
SINR Threshold (dB)3
Type of D2D channel modelFree space Propagation channel
Static power (W)10
Circuit power per active user (W)0.1
Circuit power per BS Antenna (W)0.2
Signal processing coefficient (mW)3.12
Antenna Gain (dB)G0 = 20
Noise power spectral density (dBm/Hz)−154
Receiver node (dB)7
Coding/decoding/backhaul (bit/J)1.15.10−9
Disclaimer/Publisher’s Note: The statements, opinions and data contained in all publications are solely those of the individual author(s) and contributor(s) and not of MDPI and/or the editor(s). MDPI and/or the editor(s) disclaim responsibility for any injury to people or property resulting from any ideas, methods, instructions or products referred to in the content.

