1. Introduction
Data mining is a field that focuses on discovering relevant information from data and transforming it into useful knowledge. One of its significant sub-fields, pattern mining, involves searching and enumerating significant patterns in data. In recent years, there has been a notable shift in the pattern mining community from efficiency-based approaches to methods that can extract more meaningful patterns. Unfortunately, obtaining relevant results with traditional pattern mining methods can be challenging and time consuming. There are two main issues: first, a vast number of patterns are discovered, many of which are redundant. Second, the preferences and domain experts’ background knowledge is not considered. The significance of incorporating user preferences and knowledge was initially highlighted by Silberschatz and Tuzhilin [
1]. The fundamental concept is to represent the user’s preferences using objective interestingness measures.
However, as noted in [
2], using objective quality measures has limited practical utility since interestingness is subject to the particular user and task at hand. The interestingness of a pattern is determined solely based on the data.
In recent years, there has been a growing emphasis on user-centric, interactive, and anytime pattern mining [
3,
4,
5]. This paradigm highlights the need to quickly present to the user some patterns that are likely to be interesting to them, and to obtain feedback that will influence subsequent iterations of the interactive mining process. An important aspect of this framework is the ability to learn user-specific functions for ranking patterns from feedback. Although the idea of learning user-specific ranking functions was first investigated in [
6], it has been extended in recent years by Boley et al. [
4] and Dzyuba et al. [
3,
5] in the context of interactive pattern mining. Additionally, Xuguang Bao et al. [
7] and Liang Chang et al. [
8] adapted interactive data mining for extracting interesting spatial co-location patterns. These approaches leverage standard machine learning techniques to learn weighted vectors based on selected pattern features, such as items, transactions, and length.
In [
3], a linear ranking function is learned using support vector machines (
). In [
4,
5], the authors proposed using stochastic coordinate descent (SCD) [
9] to learn a logistic function. While these methods enable the exploitation of user feedback to learn ranking functions, they also increase the computational cost of the learning task, particularly when the number of pattern–measure pairs used for ranking increases. Nonetheless, a crucial aspect of this framework is the ability to quickly present a set of patterns to the user and focus on what may be of interest using interestingness measures.
In this paper, we address the challenge of learning pattern ranking functions as a multi-criteria decision-making problem. To this end, we propose to use a weighted linear function to aggregate all the individual measures into a global ranking function. Linear functions have been widely adopted in learning to rank models because they are simple, interpretable, and efficient, yet can still effectively capture the underlying relationships between input features and relevance labels [
10,
11].
We propose a learning algorithm that is both fast and scalable, which enables us to maintain the expected weights of measures. Our approach leverages the analytical hierarchy process (AHP) [
12] and a set of user-ranked patterns to learn the weighting vector of measures. Specifically, we seek to maximize the correlation between the unknown user’s ranking function and the learned AHP-based ranking function. We previously introduced this approach in our work [
13], where we presented the initial results of the passive version of the algorithm.
This study presents a new learning algorithm that can operate in both active and passive modes, specifically designed for pattern ranking. To improve performance in active mode, a sensitivity-based heuristic is proposed to select more interesting patterns. The algorithm is explained in detail using a running example. The approach was validated on large datasets using three different user simulations in both passive and active modes. The results indicate that the proposed approach is robust and can account for user mistakes and changes in ranking criteria in interactive learning scenarios. We conducted experiments to evaluate the effectiveness and efficiency of our approach using association rule mining as a case study. We have considered the following research questions:
Can we efficiently reveal user-specific preferences over all patterns from a sample of ranked patterns with a weighted linear function? What is the required input data to make the learning algorithm more effective?
How does our new learning method based on AHP compare to the state-of-the-art method Rank-SVM, for learning user-specific ranking functions?
To what extent is our sensitivity heuristic an appropriate choice for query selection in the context of active learning?
How robust is our approach and does it keep the learning consistent when the user makes mistakes?
Our experiments on various datasets demonstrated that our approach significantly reduces the running time while accurately ranking patterns compared to state-of-the-art methods.
The paper is organized as follows: In
Section 2, we review the related work in pattern mining and ranking functions. In
Section 3, we provide some necessary preliminaries for our approach.
Section 4 formulates the problem we tackle and describes our proposed method. A running example is presented in
Section 5 to illustrate our approach. In
Section 6, we report and discuss the empirical results of our experiments. Finally, we conclude the paper in
Section 7.
2. Related Work
Iterative/user-centric pattern mining has gained significant attention in recent years, where the user is involved in the mining process to improve the mining results by providing feedback. This approach is particularly useful in domains such as medical diagnosis or fraud detection, where the user’s domain knowledge is essential.
To make this process more efficient and effective, researchers have been exploring methods to learn ranking functions that can quickly present patterns to the user based on their interests. This problem, known as object ranking, has been studied extensively in machine learning and data mining communities.
One common approach to object ranking is to learn a ranking function based on pair-wise comparisons. However, these methods can be time-consuming and expensive since they require a large number of pair-wise comparisons to learn a reliable ranking function. To address this challenge, researchers have explored alternative methods such as multi-criteria decision making. In our approach, we use the analytical hierarchy process (AHP) to learn the measures’ weighting vector, which maximizes the correlation between the user’s ranking function and the learned AHP-based ranking function. In [
6], the authors proposed a user-centric approach to mining interesting patterns based on the user’s feedback. They developed a log-linear model for itemsets that considers the user’s prior knowledge about the items and their relationships. The model was trained using
to learn a ranking function that assigns a score to each itemset. The authors also proposed a belief model that exploits belief probabilities assigned to transactions for more complex patterns. The authors demonstrated that their approach outperformed existing methods in terms of accuracy and efficiency for complex patterns where traditional methods may fail to capture the user’s preferences.
Dzyuba et al. [
3] extended the approach proposed by Xin et al. [
6] and used
for active preference learning to rank patterns. However, these methods suffer from computational inefficiencies, which limit their scalability on large datasets. In contrast, the AHP-based approach proposed in our work has a linear time complexity and can efficiently rank a large number of patterns.
In [
14], the authors proposed a user-centric generic framework (PRIIME) to learn ranking functions. To achieve this, regression techniques based on neural networks were adopted. They assigned a score to each pattern based on user feedback and trained a regression model on labeled patterns and their corresponding scores. The model predicts the score of new patterns based on their features and user feedback. The proposed method outperformed existing methods in terms of accuracy and efficiency and can effectively mine interesting patterns and provide valuable insights to the user.
In their study, Lee and colleagues [
15] investigated changes in the citation patterns of academics in response to the “evaluation environment” that emerged in academia with the rise of the World University Rankings (WURs). The authors analyzed papers published in two higher education journals across three periods: pre-WURs (1990–2003), WURs implementation (2004–2010), and adaptation to WURs (2011–2017). To compare and rank first-citation speeds across these periods, they used the non-parametric Kaplan–Meier method [
16]. In [
17], the authors investigated the factors that influence website rankings of search engine result pages, highlighting the top contributors to better rankings. The study is divided into two parts: a literature review and empirical research. The literature review identified 24 factors that affect website rankings, with the most common being backlinks, social media support, keywords in the title tag, website structure, size, loading time, domain age, and keyword density. In the empirical research, the authors analyzed the top 15 Google results for three search phrases, taking into account the factors identified in the literature review. The significance of each factor was measured using Spearman correlation. The findings revealed that the top factors contributing to higher rankings are the existence of an SSL certificate on the website, keywords in the URL, the number of backlinks, text length, and domain age. These results do not perfectly align with the literature review, suggesting a potential gap between academic understanding of SEO factors and their real-world application.
The study by Zimmer et al. [
18] investigated the impact of filter bubbles and echo chambers [
19] on the spread of fake news, and analyzed the information behavior patterns of individuals who reacted to such news. The study aimed to answer two research questions: (1) whether machines facilitate the dissemination of fake news through the automatic creation of filter bubbles, and (2) whether echo chambers of fake news are artificially created. To accomplish this, the authors used a case study approach that involved both quantitative and qualitative content analysis of online comments and replies on a blog and Reddit, and an examination of social media ranking algorithms. The findings suggest that filter bubbles exist, but users’ information behavior primarily feeds them, thus amplifying their behavioral patterns, while selective exposure to information may result in confirmation bias, other cognitive structures such as non-argumentative behavior, off-topic behavior, denial, moral outrage, meta-comments, insults, satire, and the creation of new rumors, also contribute to the various reactions to fake news. In [
7], an efficient interactive approach was proposed for users to discover their preferred co-location patterns. The approach consists of a flexible interactive framework, an ontology-based similarity measure between co-location patterns, a pattern filtering model to express user preferences, and a pruning scheme to reduce the number of outputs.
The work proposed in [
20] presents two significant contributions to the field of database management systems (DBMS). Firstly, the authors developed an ontology and methodology that describe essential features and aspects of the DBMS domain, including various paradigms, query languages, platforms, and specific contexts. This model is populated with significant individuals (actual DBMSs) by leveraging existing knowledge from DBpedia and Wikidata, which are free and open machine-processable knowledge bases. This approach improves the view of the DBMS domain and has the potential to enhance information integration and search capabilities by creating a specific knowledge graph. Secondly, the authors designed and developed two knowledge-based web applications that provide information about DBMSs according to the user’s needs and preferences. These web systems, which the paper describes, serve as examples of using semantic web technologies and the proposed knowledge model for educational and pragmatic purposes.
In [
8], the authors proposed IDMBS (interactive data mining based on support vector machine), an interactive mining system that uses SVM to discover user-preferred co-location patterns. The system includes a filtering algorithm to select patterns, which are then annotated by the user, and an SVM model to train on these patterns and discover additional user-preferred co-location patterns.
Our proposed approach tackles the problem of learning a user-specific function for ranking patterns as a multi-criteria decision-making problem using AHP. Moreover, our method remains fast when the number of patterns used for ranking increases. Our approach is novel in that it employs a multi-criteria decision-making methodology (AHP) that, to the best of our knowledge, has not been used before. Our method is capable of scaling when dealing with large datasets and is resilient to user mistakes.
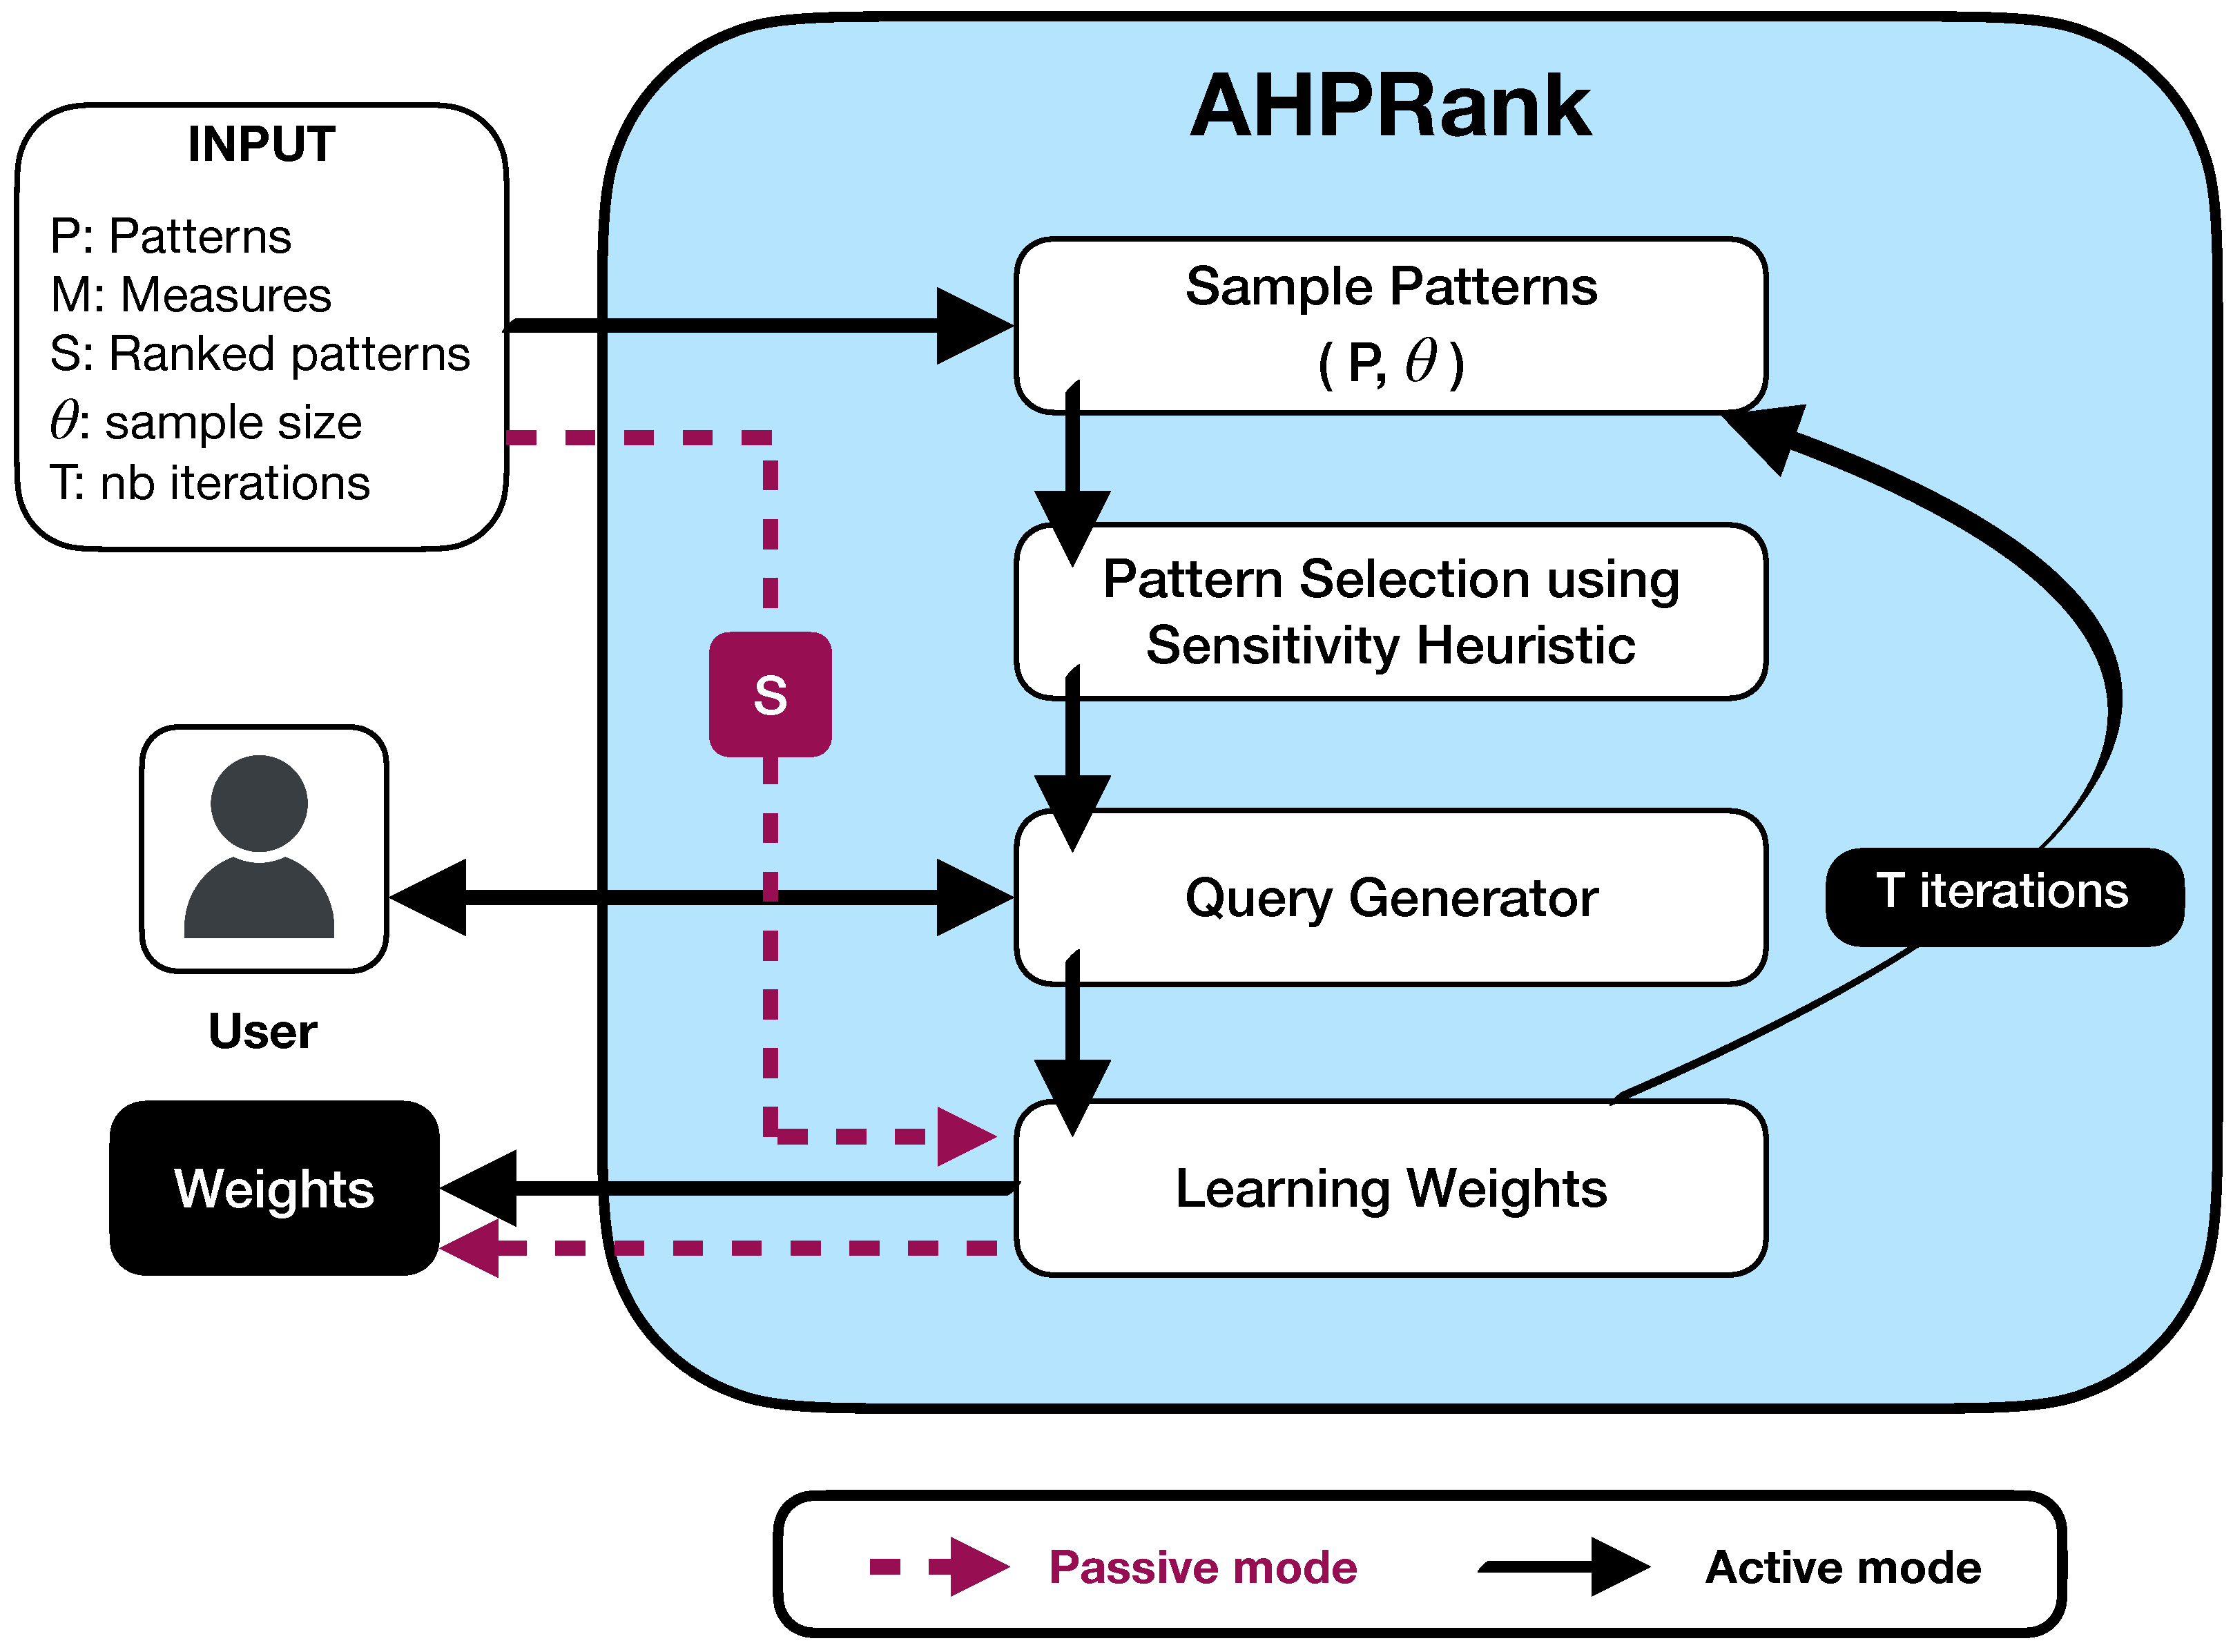
Figure 1 depicts the overall methodology of our approach. Our approach operates in passive learning mode if a user ranking already exists (i.e., S
), otherwise it runs in active mode by following the main steps. First, the sample patterns component selects a subset of patterns. Then, the pattern selection component selects the most sensitive pairs of patterns. Next, a query is generated and presented to the user to be ranked. Finally, the learning weights component computes the weights of the linear function by leveraging the user feedback. At the end of our learning process, the method provides the current weights of the linear function.
Most of the related work uses SVM-based algorithms to learn a user-specific function. According to [
21], the worst-case time complexity of the SVM algorithm varies between
and
on the number of samples
k; whereas our approach is linear on
k (see
Section 4.6).
4. AHP-Based Learning Approach for Ranking Patterns
We aim to develop a ranking function that combines a set of interestingness measures while also taking into account user-specific preferences.
4.1. Problem Statement: Learning Pattern Rankings
In this section, we demonstrate that learning a ranking function that incorporates a set of interestingness measures to approximate user-specific preferences can be formulated as a multi-criteria decision-making problem. In this context, the criteria correspond to the interestingness measures.
The objective of this task is to learn a ranking function for patterns based on a sample of ordered patterns. To accomplish this, we adopt the approach of ordered feedback, where users are asked to provide a total order over a small set of patterns based on their subjective interestingness. This approach is inspired by previous research [
32].
Let ▹ be a binary preference relation between patterns. A ranking function based on ▹, denoted by , takes as input a subset of patterns and returns as output a permutation S = of , such that and .
We aim to learn the user ranking function denoted by , which is based on the user preference relation . To achieve this, we use a set of interestingness measures and their corresponding ranking functions . The rank of pattern with respect to the interestingness measure is denoted by . Here, means that .
To frame the ranking problem as a learning problem, we need to find the weights
of a linear aggregation function over the measures from a set of ranked patterns that maximizes the correlation with the user ranking function
. Specifically, we aim to find the coefficients of the following function by solving a multi-criteria optimization problem:
Our approach leverages user feedback to perform pair-wise comparisons between measures and estimate their relative importance based on individual measure scores. The pair-wise comparison results are then aggregated into a matrix, which is used by the analytic hierarchy process (AHP) to compute the weights for each measure.
4.2. Comparing a Single Measure to a User Ranking
Let
be a user ranking of patterns. Let
be a set of interestingness measures for patterns. To evaluate how well a particular measure performs in terms of overall ranking accuracy compared to a user ranking, we use Kendall’s W concordance coefficient [
33]. For a measure
and a user ranking
S, we define
as the Kendall’s W coefficient between the ranking obtained using
and the user ranking
S, where a value of 1 indicates perfect concordance and a value of 0 indicates no concordance.
where
with
, and
.
4.3. Comparing Two Measures According to a User Ranking
Let and be two measures to be compared based on a given user ranking S. We can compute the gap to determine how much is closer to the user ranking S than . If , then is closer, otherwise, the converse is true. When considering a set of user rankings , comparing two measures and on involves estimating the measure closest to by averaging the gaps over all the user rankings in : .
4.4. Learning Weights Process
Algorithm 1 implements the learning process that computes a weight vector
w (a weight for each measure) by exploiting the pair-wise comparisons of measures. It takes as inputs a vector of pair-wise comparisons
and its corresponding index
l, a user ranking
S, and a set of measures
. The learning step is performed at line 2 where for each pair of measures, we first compute the Kendall W coefficient for each measure
i with respect to the user ranking
S (
). Then, we compute the gap between the pairs.
| Algorithm 1: .
|
 |
Algorithm 1 implements the learning process that computes a weight vector
w (a weight for each measure) by exploiting the pair-wise comparisons of measures. It takes as inputs a vector of pair comparisons
and the corresponding index
l, a user ranking
S, and a set of measures
. The function incrementally updates
by taking into account the previous
l user rankings at line 3. At line 5, the AHP matrix is constructed by scaling the
comparisons to the AHP values between
and 9. Once constructed, the criteria weight vector
w is returned in line 12 by solving the minimization problem described in line 11, using the eigenvector method (EVM) [
30].
After learning the weight vector
w, we use it to compute the score of a given pattern
by applying a weighted aggregation function:
The function is used to normalize the interestingness values of the different measures to a scale so that they can be combined using the weighted aggregation function.
4.5. AHPRank Algorithm
We propose Algorithm 2 to implement the function (Algorithm 1) to learn a weight vector in a passive/active mode. The algorithm takes as input a set of measures , a set of user-ranked patterns , and a triplet of parameters . Here, is a collection of patterns, is a sample parameter used in the query generator for active learning, and T is the maximum number of iterations used as a stopping criterion in the algorithm.
initializes the vector of pair comparisons to zero in line 1. If is called with a non-empty , it runs in passive mode by calling the function on the given user-ranked patterns (lines 3–6). This produces a weight vector w. Otherwise, it runs in active mode by submitting T queries to the user (lines 7–15). In the active mode, the user is asked to rank a subset of patterns proposed by a query generator. Our query generator is based on a heuristic that exploits the quality of the weights learned from the previous iterations. The active learning mode follows the following iterative steps:
As a first step, a subset of patterns is sampled from the global set of patterns using a random sampling approach. At line 10, the function is called, which returns a sample of patterns.
The
function is used to select a pair of patterns. This heuristic is designed to select a high-quality pair of patterns to accelerate the convergence of the learning process (see Algorithm 3 in
Section 4.5 for details).
Interacting with the user obtains feedback through a ranking query (line 12).
AHP-based learning of the user ranking function is performed by calling the function on the user-provided ranking query (line 13).
The proposed method is designed to handle large sets of patterns, which can be computationally expensive to process. To address this issue, we introduce two steps in the active learning mode. First, we randomly sample a subset of patterns from the global set , which reduces the complexity of the second step as well as introduces a diversity factor. Second, we use a sensitivity-based heuristic to select pairs of patterns that are of high-quality and diverse.
It is important to determine when to stop the learning process. Our method allows for a custom stopping criterion, but we also consider the case where a fixed number of iterations
T is used. This simulates the scenario where the user can stop at any time based on their satisfaction with the learned ranking function.
| Algorithm 2: .
|
 |
| Algorithm 3: .
|
 |
A Pattern Selection Heuristic for AHPRank
Active learning is a challenging task since each learning step needs to enhance the learned function. The selection of appropriate patterns for the user to rank is the key to incrementally improve the learning process. However, generating the ideal set of patterns is a computationally demanding task and is known to be NP-hard [
34]. To address this issue, we propose a heuristic (Algorithm 3) based on sensitivity analysis for AHP models [
35]. Our heuristic aims to select a pair of patterns that are close in terms of their overall score predicted by the learned function relative to the sum of the measure gaps:
A successful aggregation should have the property that if two patterns are close in overall predicted score, they should also be close in their measure values. Thus, the algorithm will be enforced into learning the correct preferences of the patterns when having the lowest value since the selected pair is surely close in terms of values and very distant on the values of the measures. Example 2 illustrates the selection process of the Algorithm 3.
Example 2. Suppose we have two patterns and with four interestingness measures . Let , , and let the current learned weight vector be . At this stage, and . Although and have the same overall score, their measure values differ. This pair of patterns is an interesting candidate with , where retrieving the user’s preference between them can improve the learning process and bring it closer to the user’s ranking.
4.6. Complexity Analysis
Proposition 1 (Time complexity). Algorithm 2 has a time complexity of in passive learning and in active learning when the number of interestingness measures is bounded.
Proof. Let
be a set of
n user rankings, where
k is the size of the largest ranking
and
m is a bounded number of measures in
. Once the pair-wise comparison matrix
is built, the preference vector of weights
w can be computed using various mathematical techniques, including the eigenvector-based method (EVM) [
30]. The worst-case time complexity of the EVM approach is
[
36], which is of constant time complexity
since
m is constant. The time complexity of computing the matrix at line 3 of the
function is
since Kendall’s W is in
(see Definition (
5)). The complexity of lines 2, 5, and 11 in
are, respectively,
,
, and
. Notice that in AHP, it is demonstrated in [
37] that the number of criteria is recommended to be no more than seven
. Thus, assuming
m is a small and fixed number of measures, we can set
and obtain an asymptotic quadratic complexity of
when AHP is in passive mode. In other words, the approach takes
for each ranking in the given
. When AHP is in active mode, where queries are pairs of patterns (
), the time complexity is linear on the number of queries submitted to the user, i.e.,
. □
It is important to emphasize that in practice, the set
is typically reduced to a single large ranking in passive learning mode (
and a large
k), and to a set of
n queries consisting of pairs of patterns in active learning mode (large
n and
). As a result,
can run in linear time, with a complexity that is linear in
k for passive mode and linear in
n for active mode. This low complexity makes
a fast approach for learning a user ranking function, as supported by the experimental evaluation in
Section 6.
5. Running Example
To demonstrate our approach, we utilize an initial set of patterns
, along with a user ranking
, and five interestingness measures
. The user ranking for
, rankings given by
on
, and the
results are presented in the columns of
Table 1. It is important to note that none of the measures perfectly match the user ranking (column
).
The data presented in
Table 1 is utilized by our algorithm to construct the AHP matrix and learn the weight vector
w over the set of interestingness measures
. For simplicity, we refer to the AHP algorithm in the passive mode with
. In this case, the user’s ranking order is
. AHP learns the weights by invoking
on
and computing the correlation between the user rankings of
and the rankings of the measures
. The matrix in (
8) shows the
values for each measure pair. It is worth noting that no two measures perfectly match the user ranking (column
) for the pattern set
.
To compute
, we need to calculate Kendall’s W
(resp.,
) between the ranking of
(resp.,
) and the user ranking
. The value of
is given by
, which in this case is
. After scaling the values of
to
for negatives and
for positives, we can observe from Equation (
8) that measure
is better than
with a degree of 6. The same degree of preference is observed between
and
, while
and
are indifferent.
Afterwards, the
function in
computes the AHP matrix
A using the scaled
matrix (i.e., the average correlation gap) as input:
At the end, computes the weighting vector w by solving a minimization problem. The learned weight vector is , reflecting the importance of each measure for achieving the goal of the user ranking function .
Using the AHP interestingness measure
from Equation (
6), we can rank all patterns in
provided in
Table 1.
achieves an overall ranking accuracy of 91% in this example, correctly ranking the first five patterns, the seventh, and the tenth ones.
6. Experiments
In this section, we empirically evaluate the effectiveness of our proposed pattern ranking framework . We first introduce our case study on association rules mining and the different oracles we used to simulate user-specific rankings. Next, we present the research questions we aimed to answer, the experimental protocol we followed, and the results we obtained.
6.1. Mining Associations Rules (ARs)
Our approach, , is experimentally evaluated on association rule mining, which is one of the most important and well-studied tasks in data mining. Association rules are implications of the form , where X and Y are itemsets such that and . Here, X represents the body of the rule and Y represents its head. The frequency of an itemset X in a dataset, denoted by , is the number of transactions of the dataset containing X. The frequency of a rule is the frequency of the itemset , that is, .
Various interestingness measures for association rules have been proposed, including support, confidence, interest factor, correlation, and entropy. Tan et al. [
38] conducted a study on the usefulness of existing measures in different application types and identified seven independent groups of consistent measures having similar properties, as shown in
Table 2.
To evaluate our approach, we selected one measure from each of the seven groups of consistent measures identified by Tan et al. [
38]. This gave us a set of seven measures that are independent and have similar properties. These measures are highlighted in bold in
Table 2.
6.2. User Feedback Emulators
Since it can be challenging to evaluate an interactive approach with limited user feedback, we simulated user feedback by using three different objective target ranking functions:
Rand-Emu: The user-specific ranking is equivalent to a random weighted aggregation function. For each measure , we generate a random weight such that .
Lex-Emu: The user-specific ranking follows a lexicographic order on the measures. We define a lexicographic order on as such that . Given two patterns , is preferred to if or for to .
Chi-Emu:
is a statistical measure that is a good candidate to emulate user feedback [
39], while
can be a complex function to approximate with non-trivial correlations, it is also a quality measure suggested in [
5]. We use
as the target user-specific ranking function over ARs. For an association rule
, the
value is defined as:
where
N is the number of transactions in the dataset.
6.3. Research Questions
Our evaluation seeks to address the following research questions:
RQ1: Can we determine a user’s preferences for a set of patterns based on a sample of ranked patterns? If so, how much data is needed and how long does the learning process take?
RQ2: How does our proposed AHP-based learning method compare to the SVM-based baseline for automatically learning user-specific ranking functions?
RQ3: How effective is in an active learning context? Is the sensitivity heuristic a good choice for query selection?
RQ4: How effective is in an interactive data mining context?
6.4. Experimental Protocol
6.4.1. Implementation Settings
We implemented our
approach in Java with two modes: the passive mode, denoted as
, and the active mode, denoted as
. The code is publicly available on GitHub at
. We compared our approach to the state-of-the-art SVM-based approach
[
5]. We use
to denote the passive version and
to denote the active version, following [
3]. All experiments were conducted on an Intel Core
2.4 GHz with 16 GB of RAM, with a maximum duration of one hour.
Metrics
We use three metrics to evaluate the performance of our approach:
6.5. Benchmark Datasets
We selected several datasets of realistic sizes from the FIMI repository (
fimi.uantwerpen.be/data/, accessed on 19 March 2023). These datasets have different characteristics that represent various application domains.
Table 3 reports the number of transactions (
), the number of items (
), the application domain, and the number of valid rules (
) corresponding to the initial rules mined using a standard association rules algorithm without any knowledge about the user, for each dataset. The datasets are presented in ascending order of
.
6.6. Passive Learning Results
In this section, we address the first two research questions (RQ1 and RQ2). To that end, we perform a five-fold cross-validation on each dataset, where we randomly select of the rules as training data and use the remaining for testing. This type of cross-validation allows us to evaluate the effectiveness of the approaches in learning from relatively small training sets. We report the results averaged over the five folds.
(A) Analyzing the different user feedback emulators. Table 4 presents the results of the correlation analysis between the user-specific ranking functions (
Rand-Emu,
Lex-Emu, and
Chi-Emu) and the seven interestingness measures, as well as the virtual best measure (
), which returns the best rank correlation
provided by one of the seven measures. The analysis was performed on all datasets, and the results are reported in terms of Spearman’s rank correlation coefficient
.
The results show that the correlation between a given measure and a user-specific ranking function can vary significantly depending on the dataset. For instance, the measure is highly correlated with Chi-Emu on the dataset (), but it is weakly correlated on the dataset (). Similarly, the correlation between Rand-Emu or Lex-Emu and the measures also varies significantly across the datasets. However, the approach, which selects the best measure for each dataset, achieves a high level of accuracy (with a mean of ). These results suggest that a weighted aggregation of the selected measures could lead to a good trade-off between accuracy and robustness.
(B) Comparing with . Table 5 presents the results of the k-folds cross-validation for
and
, where we report the averaged rank correlation
, recall values (
and
), and CPU time in seconds averaged over the folds. Since
can handle a training set of up to 100 K rules within an hour, we compared it with our approach with the
dataset only. We observed that
outperformed
in terms of ranking accuracy for all user feedback emulators, although
remained competitive with acceptable accuracy. The same trend was observed in terms of recall at the
and
top of the ranking (
and
). We noted that
achieved a high correlation with the user ranking functions on most datasets. However, on
, we observed a weak correlation with
Chi-Emu, while a high correlation was observed with
Rand-Emu and
Lex-Emu. This can be attributed to the fact that
Rand-Emu and
Lex-Emu are linear functions expressed with the given seven interestingness measures, which explains their high accuracy, while
Chi-Emu is a complex function that requires more extensive statistics to learn. Notably, the high accuracy of
came at the expense of longer running times. For instance, it took more than 15 min for
to learn from a training set of 100K rules, and exceeding 100K rules,
required more than one hour, while
was able to handle 7.5 M rules in less than 4 min.
In what follows, the observations and the conclusions drawn from Chi-Emu remain true for Rand-Emu and Lex-Emu. For the sake of simplicity, we only report the results on the complex function Chi-Emu.
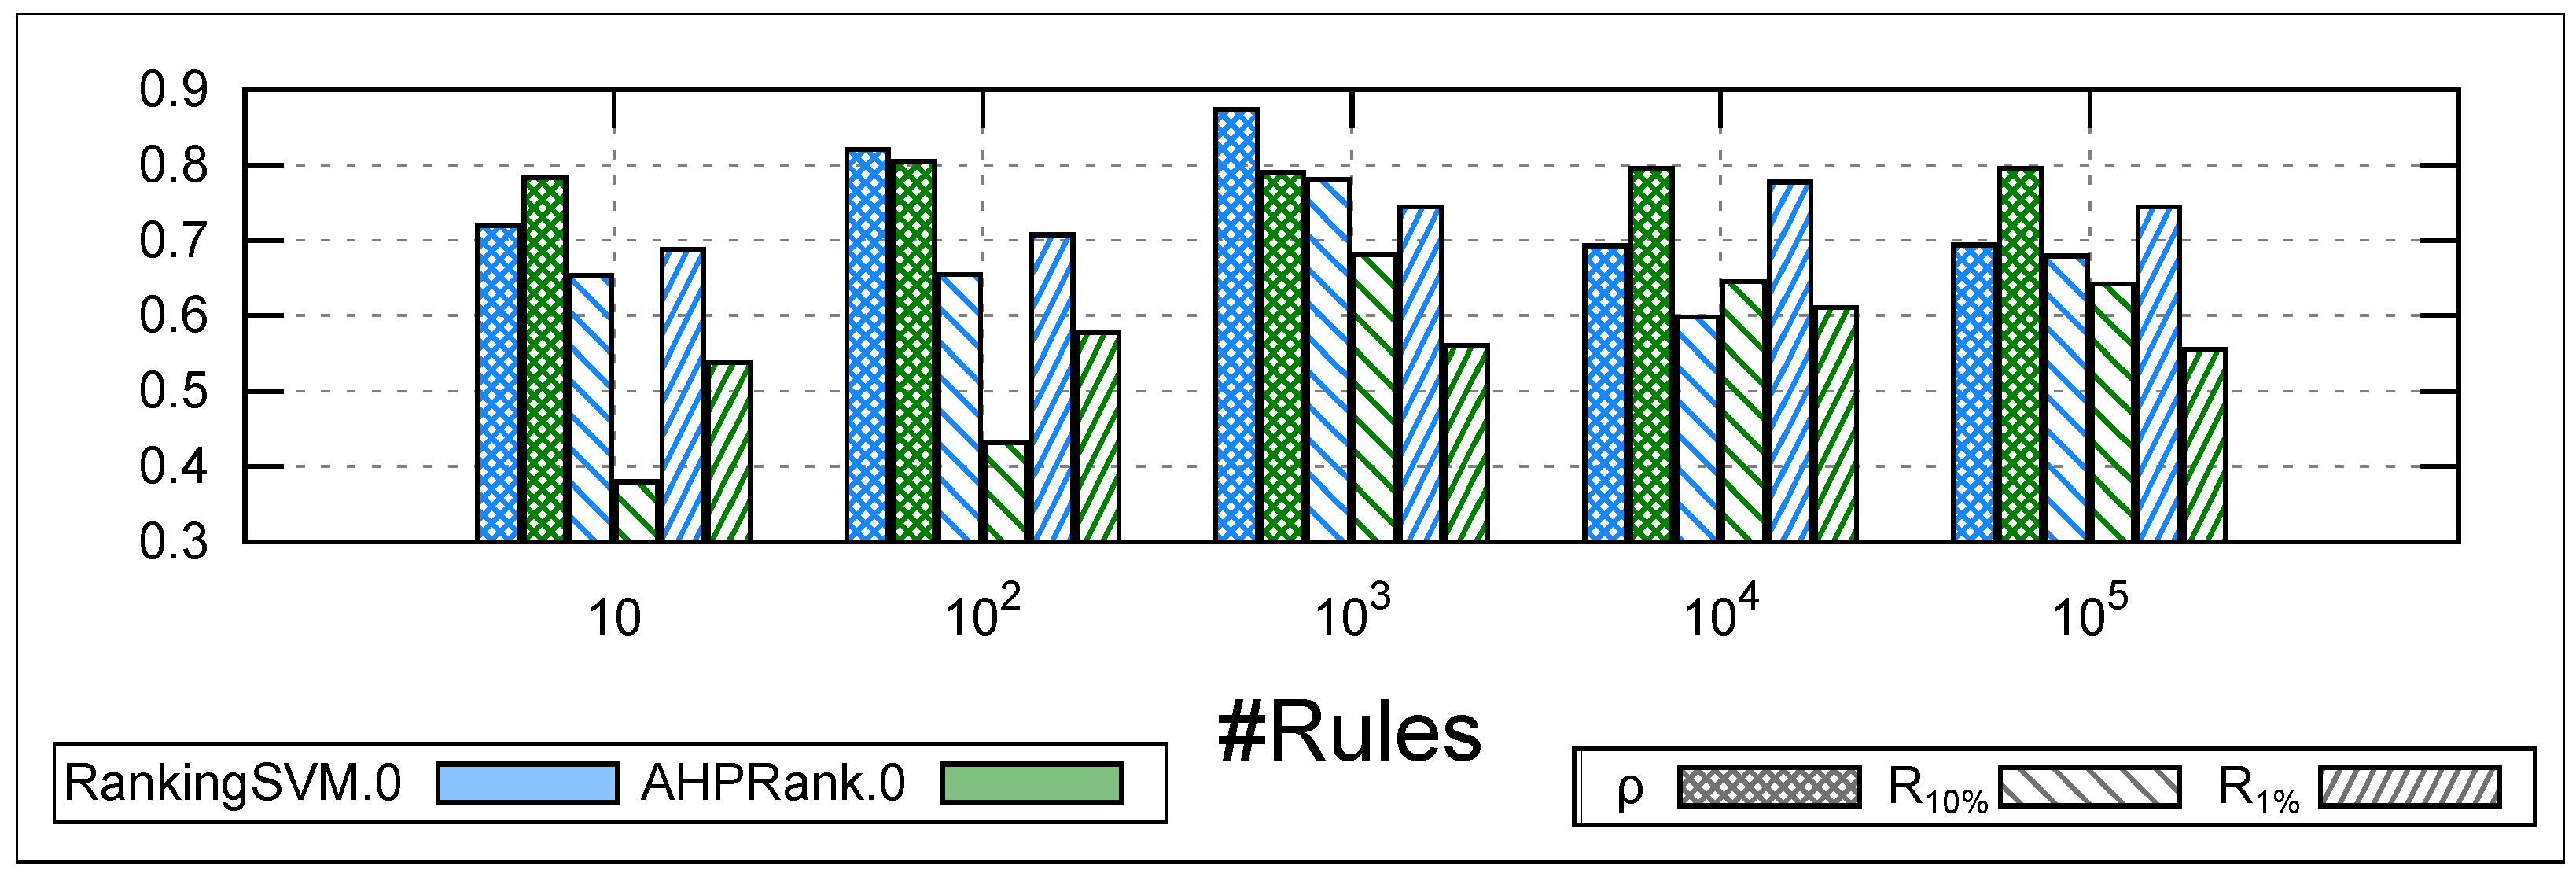
(C) Impact of varying the size of the training data on learning. It is crucial to emphasize that our proposed
approach aims to achieve a fast learning process while providing high accuracy in ranking patterns. To further support our observation on the scalability of
compared to
, we present in
Figure 2 and
Figure 3 a performance comparison by varying the size of the training data when learning the
Chi-Emu function, as similar results were obtained for
Rand-Emu and
Lex-Emu functions. For each dataset, we randomly select
rules, and we compare the two approaches for
10, 100, 1K, 10K, 100K. The results are averaged over ten runs.
Regarding the Spearman correlation
,
Figure 2 shows that the two approaches have a discrepancy of only
when the training data does not exceed 1K. However, the gap becomes significantly more substantial (exceeding
) and in favor of
when the training data contains 10K and 100K rules.
In terms of recall at and , outperforms with a gap of and at and , respectively, when the training data contains only 10 rules. However, as the size of the training data increases, the gap between the two approaches becomes narrower, with a difference of less than for , and remaining relatively constant for .
In terms of CPU time,
Figure 3 demonstrates that
can process training data of up to 100 rules in less than a second, whereas it takes more than one minute for 1K rules, 13 min for 10K rules, and over 26 min for 100K rules. In contrast,
is capable of handling training data ranging from 100 to 100K rules in a time span ranging from
to
s, while still maintaining a ranking accuracy comparable to that of
.
6.7. Active Learning Results
In this section, we aim to address research questions RQ2 and RQ3, which involve comparing the active learning versions of and . To achieve this, we employ a straightforward process that involves asking the user ranking queries on pairs of patterns (e.g., do you prefer to ?).
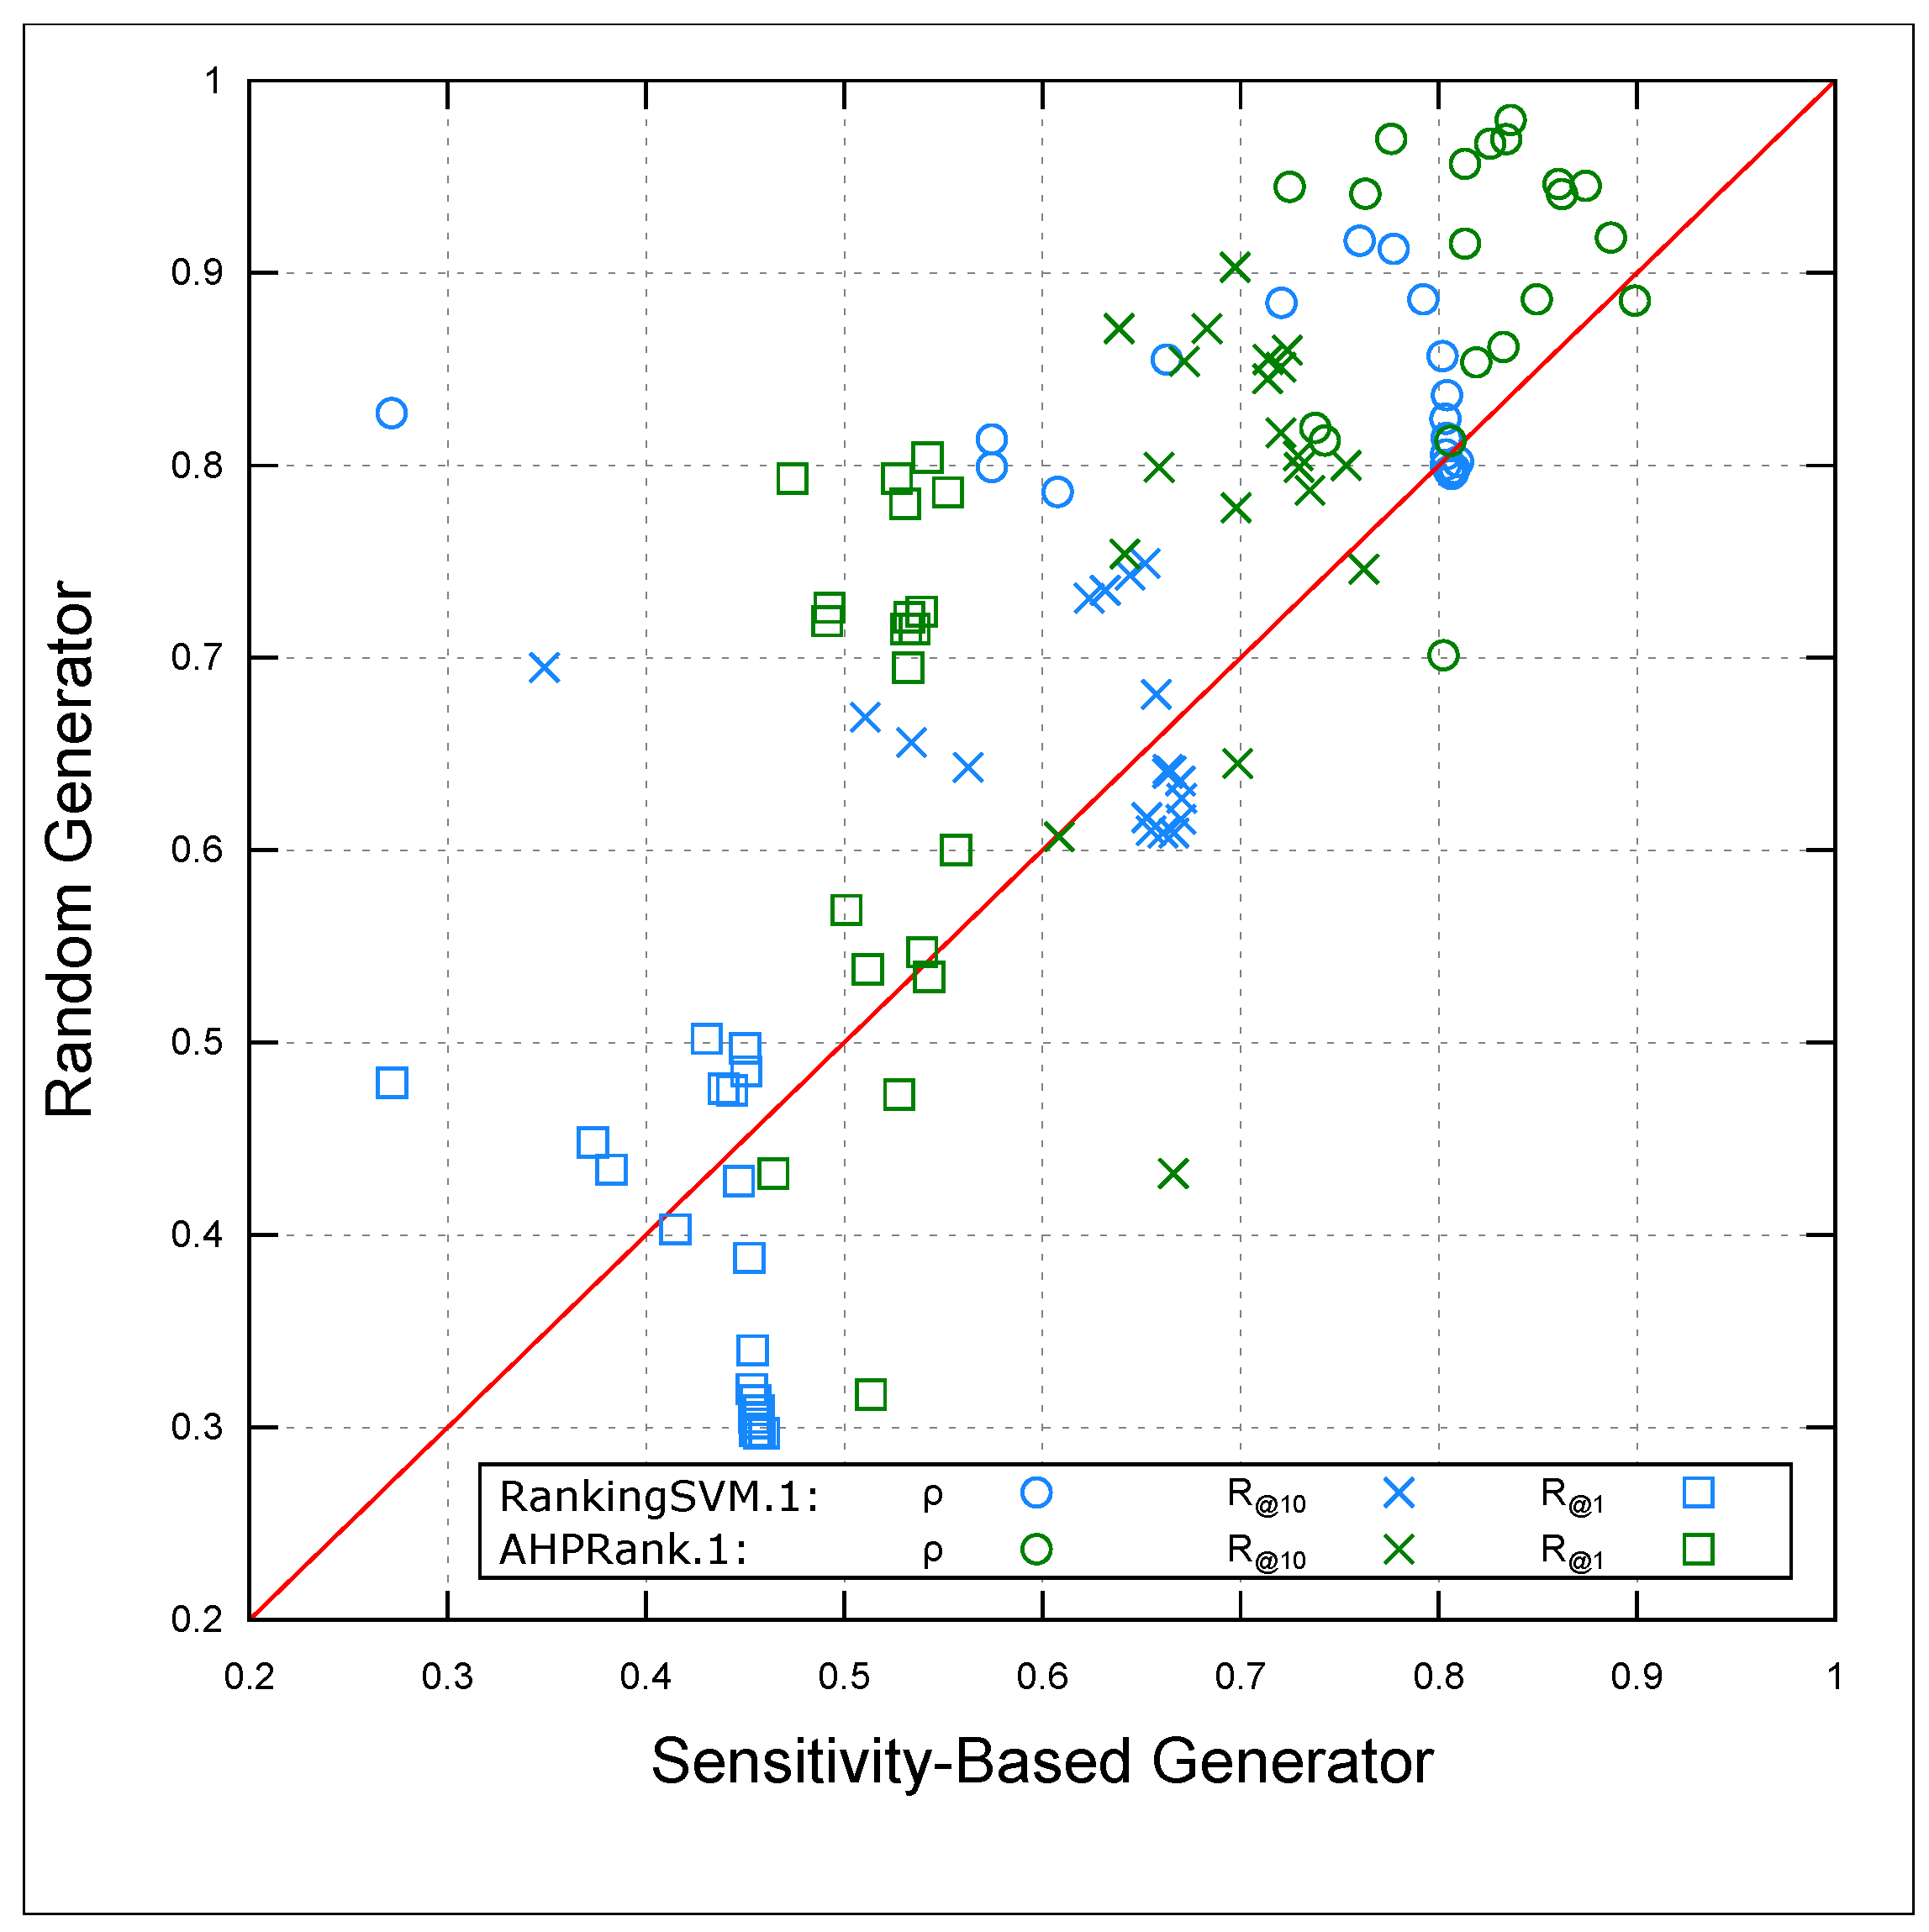
(A) Evaluating the effectiveness of our sensitivity-based heuristic. In this section, we aim to evaluate the effectiveness of our sensitivity-based generator (SBG) (see
Section 4.5) in improving the active learning process of
. To do so, we compare SBG to a random generator (RG), where RG randomly selects a pair of patterns from
and submits them to both
and
. We conduct our experiments with human-in-the-loop, setting the number of queries (i.e., iterations of Algorithm 2) to a maximum of 20 queries. We repeat the experiment 10 times and take the average result to account for the sampling step of our SBG and the randomness of the RG approach. After a few tests, we set the sample size
picked in line 10 of Algorithm 2 to
, providing a good trade-off between time selection and the accuracy of the selected pair.
Figure 4 presents a scatter plot of 20 iterations comparing the performance of
and
with both RG and SBG. We report the Spearman correlation
, recall at
, and recall at
for each iteration. The results show that the use of SBG outperforms RG, regardless of the learning algorithm, as can be observed from the scatter plot.
To support our observation on the effectiveness of SBG, we conducted a statistical test using the Wilcoxon signed-rank test. We used a one-tailed alternative hypothesis with the null hypothesis that RG is more efficient than SBG: H0: The accuracy using RG ≥ the accuracy using SBG. The alternative hypothesis H1 states that SBG outperforms RG. With this statistical test, we concluded that the use of SBG is more efficient than RG (i.e., H1 is accepted).
Table 6 reports the
p value, z-score, and confidence interval (CI) of each test. Except for the case of (
,
), we had strong evidence to reject the null hypothesis based on the
p value column. The CI column clearly shows that the use of SBG is better than RG. Consequently, we will use the SBG heuristic in
and
in the following.
(B) Comparing with . Table 7 presents a comparison between
and
on five datasets, reporting the Spearman correlation
, recall at
and
stopping criterion
T at 10, 50, and 100 queries, and the average latency time
between two queries for
(never exceeding the latency bound of 0.1 s). The findings hold for the
Rand-Emu,
Lex-Emu, and
Chi-Emu functions.
The main observation from
Table 7 is that
outperforms
. Looking at the
dataset, for example,
achieves an accuracy of
with only 10 queries, while
achieves
. At 50 queries,
achieves an accuracy of
, compared to
for
. At 100 queries,
reaches
accuracy, while
remains stable at
. In terms of recall,
discovers the most relevant patterns in the first 50K and 5K patterns (out of 500K) with accuracies of
and
over 10 queries, respectively, compared to
and
for
.
For the
dataset,
achieves high accuracy over 10 queries, which remains stable over the following 90 queries.
results are less impressive on
, particularly on the recall metric. However, the main difference is in the waiting time
, where
can keep the user waiting for more than 10 s between two queries. The same observation can be made on the other datasets, where
can be hampered by overall waiting time, even with queries of size 2. In contrast,
shows an instantaneous behavior, taking less than 0.1 s between two queries. This represents a limitation in the use of
, especially when the learning is integrated into an interactive data mining process, where a reasonable latency time for a human user is around a few seconds [
40].
6.8. Interactive Learning Results
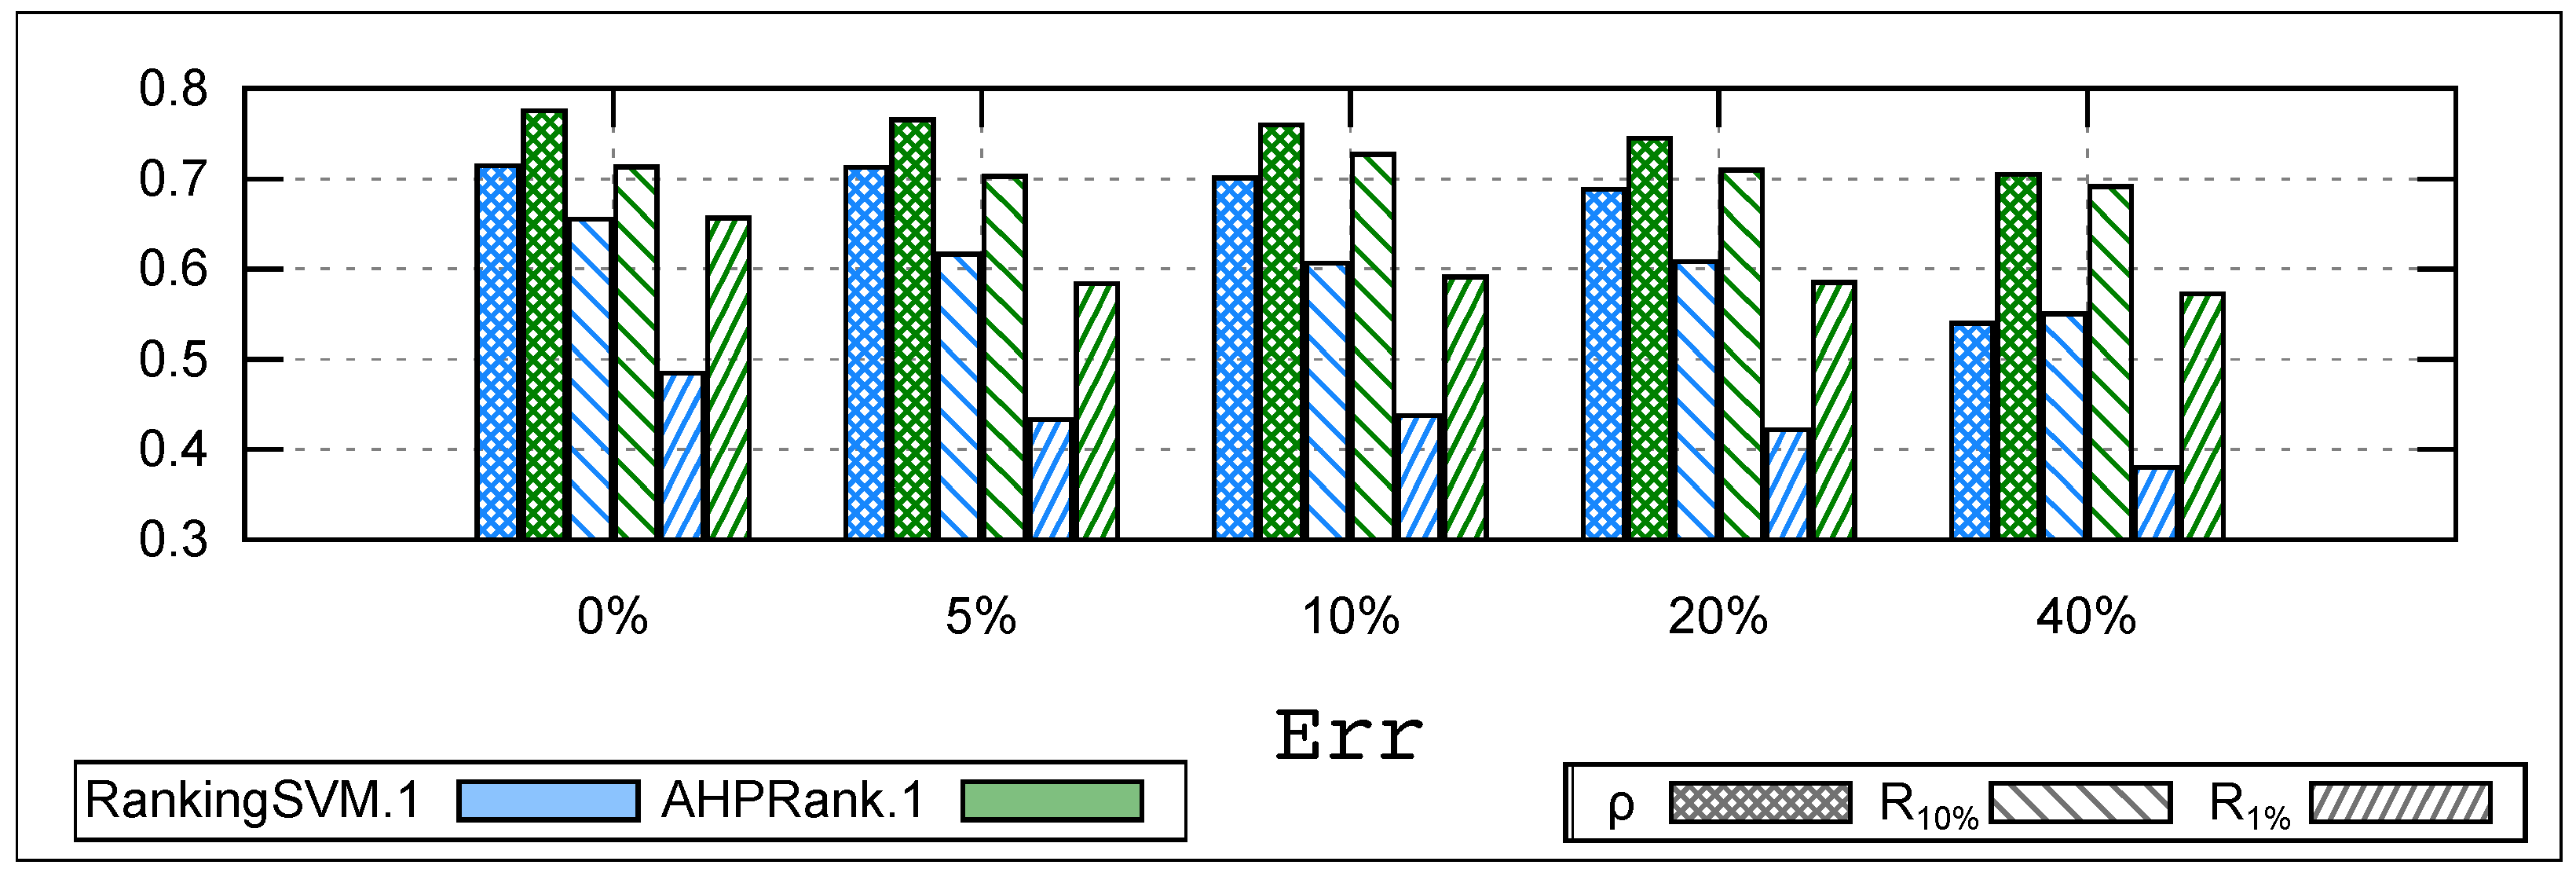
In this section, we address the last research question RQ4, and conduct two experiments to evaluate the robustness and performance of our approach in the presence of human mistakes.
Our first experiment aims to evaluate the robustness of our approach in the face of human mistakes. To simulate situations where the user feedback may be incorrect, we randomly select a set of queries and swap the user preference with a probability . Specifically, a user who prefers pattern over will mistakenly prefer over with a probability .
Figure 5 compares the performance of
and
under different levels of human error, ranging from
to
, and reports results averaged over 10 runs on the whole set of datasets using
Chi-Emu and submitting 20 queries to the user. Our results show that
is quite stable and robust even with high levels of human error, up to
(8 mistakes out of 20). The overall correlation between the learned function and the user (
) remains stable at
without mistakes and drops only to
under
. However,
is stable only up to
, and then its accuracy drops significantly, with
decreasing from
to
. In terms of recall, the decline is less than
at
and
at
under
, while
experiences a decline exceeding
at both
and
. In terms of CPU time, we observe waiting times ranging from 6 to 12 s under
, whereas our approach never exceeds
s between two queries.
These results suggest that our approach is robust and can handle user mistakes, while is less robust and can suffer from significant drops in accuracy when faced with human mistakes. Additionally, our approach provides faster query processing times, which is critical in interactive data mining scenarios where human users expect near-instantaneous feedback.
Our second experiment aims to evaluate the robustness of our approach when faced with an undecided user who begins with a set of preferences A but ends up with preferences B. Here, the initial user preferences A are biased towards the presented patterns until the user is more comfortable with preferences B.
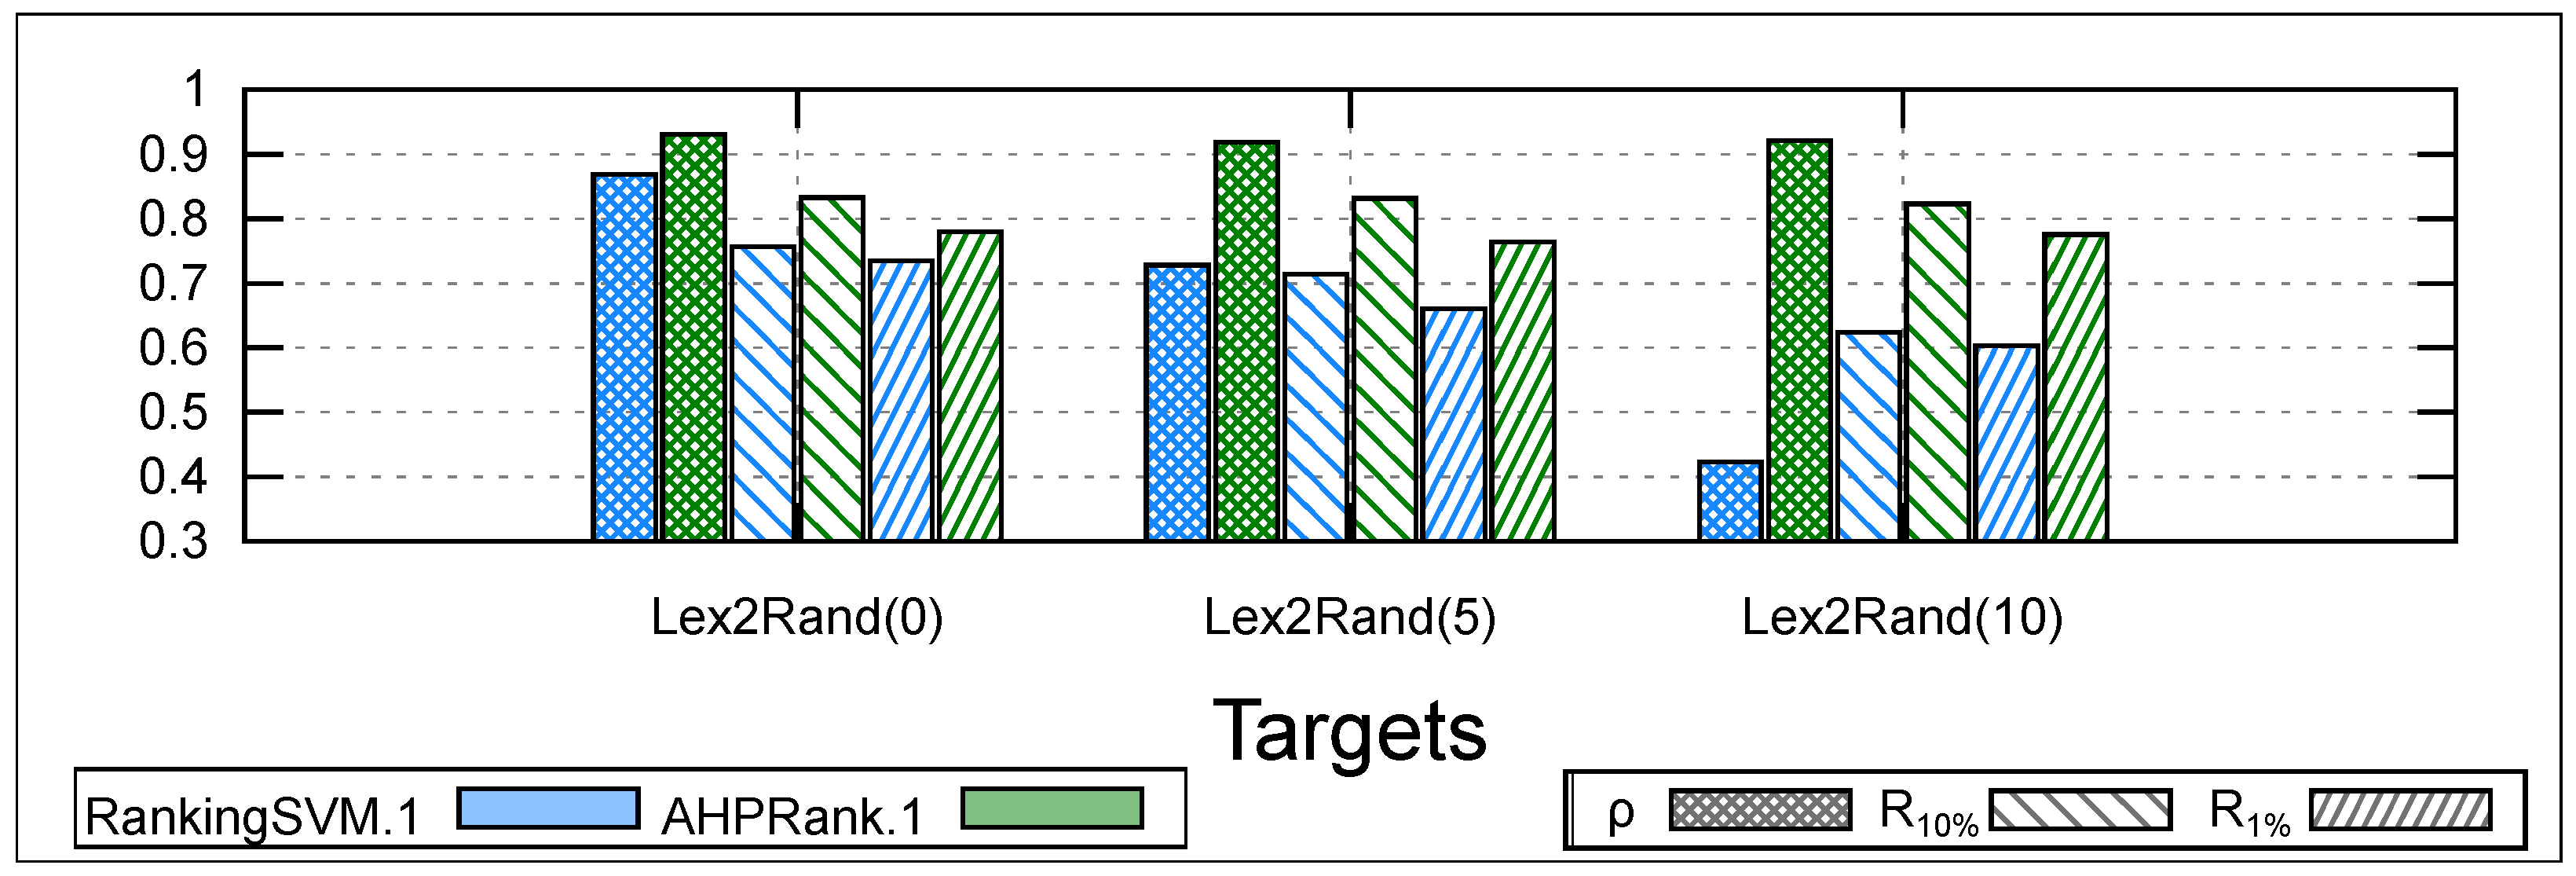
To simulate such situations where the user’s target function changes during the learning process, we conduct an experiment where we start with Lex-Emu as the target function to learn, and after x queries, we switch to Rand-Emu. This learning process takes more queries, and we refer to it as the Lex2Rand target. We choose to switch from Lex-Emu to Rand-Emu because the two functions are linear. We compare and on the Lex2Rand(x) target for a total of 20 queries, where . Note that with , Lex2Rand(0) is equivalent to Rand-Emu.
Figure 6 shows the averaged results of 10 runs on all datasets over 20 queries. The main observation that we can draw is that
is stable even when faced with a changing linear function to learn, even if the user’s preferences change halfway through the learning process (i.e., after 10 queries). However, changing the target function during the learning process can significantly impact the accuracy of
(a decline of
in terms of
). Regarding CPU time, our approach is 50 times faster than
.
7. Discussion
In this section, we review the key experimental findings from the proposed approach, as well as its limitations and potential for tackling real-world applications. Additionally, we suggest directions for future research.
7.1. Results Analysis: Pros and Cons of the Proposed Approach
According to our experimental study given in
Section 6, the results highlight that
has superior scalability compared to the state-of-the-art
in passive learning mode, particularly when the number of data points is high. Although
has a high level of accuracy, it requires more training time, which makes it impractical for an interactive learning context. In active mode, our sensitivity-based heuristic was shown to be effective in selecting informative data points, and
was shown to be more robust than
with respect to incorrect rankings.
In summary, our research findings indicate that offers an interesting trade-off between ranking accuracy and running time, making it a practical and efficient solution for various real-world applications. Its time complexity scales linearly with the training data size, and it can achieve high ranking accuracy in just a few seconds. Overall, our results suggest that is a promising approach for ranking tasks.
As with any ranking methodology, has certain limitations that should be taken into consideration for further improvements:
Expert judgment bias: relies heavily on subjective expert judgment, which can introduce bias into the ranking process.
Limited applicability: may not be applicable in all scenarios, such as cases where there are no clear criteria or when the criteria are too subjective.
Data availability: The accuracy of depends on the availability and quality of data. If the data are incomplete or inaccurate, they may affect the ranking results.
Complexity: The AHP methodology can be complex to implement and interpret, which may make it difficult to use by non-experts.
Sensitivity to input parameters: requires input parameters, such as criteria, which can be sensitive to changes and may require careful tuning for optimal performance.
7.2. Real-World Applications
The use of algorithms can provide significant benefits for companies, improving the efficiency of decision-making and recommendation processes. Here are some potential industrial applications of :
Cooperative, Connected and Automated Mobility: One potential application of in the context of autonomous vehicles is to rank the importance of different sensor inputs for decision-making. For example, cameras, lidars, and radars are commonly used in autonomous vehicles to perceive the surrounding environment. However, some sensors may be more reliable or informative than others in certain scenarios. By using , the importance of each sensor input can be determined based on the preferences of the vehicle user or the specific driving scenario. Another potential use of in the context of autonomous vehicles is to rank different driving strategies or maneuvers based on safety and efficiency. For instance, can be used to determine the optimal speed and following distance when driving in heavy traffic, or to prioritize which safety features to activate in emergency situations. Furthermore, can also be used to prioritize maintenance and repair tasks for autonomous vehicles. By considering factors such as cost, safety, and reliability, can help identify the most critical components that require immediate attention.
ChatGPT: The integration of with ChatGPT can have several benefits. Firstly, it can improve the understanding of user intent by ranking the relevance of different topics and keywords in their queries. This, in turn, can help ChatGPT generate more accurate and relevant responses. Additionally, can be used to rank the generated responses based on the user’s preferences, leading to a more personalized and satisfying experience for the user. Furthermore, the use of in ChatGPT can also assist in selecting the most appropriate response from a set of possible responses. This can be performed by ranking the responses based on various factors such as clarity, accuracy, and relevance to the user’s query. By using to rank these responses, ChatGPT can provide the most suitable response to the user. Overall, the combination of ChatGPT and can lead to a more efficient and effective conversational AI system that better understands the user’s intent and provides personalized and relevant responses. This can ultimately enhance the user’s experience and satisfaction with the AI system.
Search engines: can also be used to improve the efficiency and accuracy of search engines in real-time. By incorporating a more comprehensive and dynamic approach to measuring the relevance and importance of web pages, has the potential to enhance search engine ranking algorithms. This can lead to a better overall search experience for users, both internally and externally, by providing more relevant and informative results.
E-commerce: Online retailers can benefit from using
to improve their product recommendation systems and search results. By incorporating a more comprehensive and dynamic approach to measuring the relevance and importance of products,
can help increase the accuracy and effectiveness of these systems. This, in turn, can lead to higher conversion rates, increased sales, and enhanced customer satisfaction. Moreover, recent studies in customer relationship management [
41] have highlighted the importance of incorporating customer information to enable more effective interactions with clients.
can be used in combination with customer data to support decision-making and planning of coordinated entrepreneurial marketing strategies aimed at attracting and retaining profitable customers. For instance, by using
to rank products based on customer preferences and feedback, retailers can tailor their offerings to better meet the needs and interests of their target customers.
Content recommendation: Content recommendation is a crucial aspect of media companies and content providers as it has a direct impact on user engagement and satisfaction. By using , these companies can provide personalized content recommendations to their users based on their interests, preferences, and behaviors. This approach will not only enhance the user experience but also increase the likelihood of retaining users and increasing engagement. One of the key advantages of using for content recommendation is its ability to incorporate multiple criteria in the decision-making process, such as content type, user preferences, and viewing history. This comprehensive approach allows for more accurate and relevant recommendations, ultimately leading to improved user satisfaction. Moreover, content recommendation systems can also be enhanced by incorporating real-time feedback from users, such as user ratings and reviews, to continually improve the recommendation process. This can be achieved by incorporating the feedback into the decision-making process of the algorithm, allowing for more personalized and accurate recommendations.
Supply chain optimization: A crucial aspect for companies to reduce costs and increase efficiency. By using , companies can rank suppliers, products, or logistical options based on multiple criteria, such as cost, delivery time, reliability, and quality. This approach enables companies to make informed decisions about suppliers and products, thereby reducing risks associated with supply chain management. In addition, can also be used to optimize supply chain logistics by evaluating various transportation options, such as different routes or modes of transportation, and selecting the most efficient and cost-effective option. This can ultimately result in faster delivery times, reduced transportation costs, and improved customer satisfaction.
In a more concrete way, here are five real-life tasks where can prove to be interesting to use:
Supplier evaluation and selection: can be used to rank and select suppliers based on multiple criteria, such as quality, cost, and delivery time.
Investment portfolio management: can help portfolio managers to rank and select assets based on various factors such as return, risk, and liquidity.
Employee performance evaluation: can be used to evaluate employee performance based on multiple criteria such as productivity, teamwork, and innovation.
Product design and development: can be used to rank different design options based on factors such as customer preferences, cost, and manufacturability.
Marketing campaign optimization: can be used to rank different marketing strategies based on criteria such as target audience, reach, and cost-effectiveness.
Overall, the flexibility and scalability of the approach make it a valuable tool for decision making in many industries.
7.3. Future Research Directions
There are several potential areas for future research on . First, one could explore the use of more sophisticated machine learning techniques to further improve the ranking accuracy of . For instance, deep learning models could be trained to automatically classify the queries. This combination enables the replacement of the end-user with a module that can learn preferences from user data and respond to queries on their behalf. This can lead to more efficient and personalized user experiences. Second, there is a need to investigate the generalizability of to different types of data and ranking tasks. Future work could focus on applying to diverse domains such as healthcare, finance, and social media, and evaluating its effectiveness in each of these contexts. Third, there is an opportunity to extend to handle dynamic data, where the underlying ranking criteria may change over time. This would require developing new algorithms and techniques that can adapt to changes in the data and update the rankings in real-time. Finally, another potential area for future research is to explore the use of in conjunction with other decision-making tools and techniques, such as optimization algorithms and simulation models. This could lead to the development of more comprehensive and integrated decision-making frameworks that can support complex business processes and strategic planning.
8. Conclusions
In this paper, we proposed a novel framework called for learning pattern ranking functions using the analytic hierarchy process (AHP) multi-criteria decision-making method. Our algorithm can operate in both passive and active learning modes, allowing users to rank subsets of data points according to their preferences. We showed that the learned weights can be used to aggregate all measures into a single ranking function. The latter was demonstrated to closely match the user’s ranking preferences through experiments and statistical analysis.
We applied our framework to the association rules mining case study and compared it with state-of-the-art learning methods. Our experimental results showed that can efficiently learn the ranking function and outperform existing approaches in terms of ranking accuracy and running time. Furthermore, we showed that can help users effectively prioritize and analyze patterns, leading to better decision making.
Our proposed framework has a wide range of potential applications across various domains, including marketing in e-commerce, finance, healthcare, and social network analysis. In e-commerce, for example, can be used to recommend products to customers based on their interests, leading to more personalized and effective marketing strategies. In finance, can assist investors in making informed decisions about where to allocate their funds by ranking investments based on their risk and return profiles. In healthcare, can predict the most effective treatment for a given patient based on their individual characteristics, improving patient outcomes and reducing healthcare costs. In social network analysis, can be used to rank posts based on their relevance or importance, helping users to more easily navigate and engage with social media platforms. By leveraging the algorithm, users can benefit from more accurate and timely ranking patterns, ultimately enhancing their ability to make informed decisions based on the available data.
Future work could include exploring the use of in combination with other machine learning techniques or developing an interactive system that can learn and update user preferences over time. In summary, our proposed framework offers a practical and efficient solution for learning pattern ranking functions, which can lead to better decision making in various applications.


 ,
, 


