Abstract
Rapid guessing is an aberrant response behavior that commonly occurs in low-stakes assessments with little to no formal consequences for students. Recently, the availability of response time (RT) information in computer-based assessments has motivated researchers to develop various methods to detect rapidly guessed responses systematically. These methods often require researchers to identify an RT threshold subjectively for each item that could distinguish rapid guessing behavior from solution behavior. In this study, we propose a data-driven approach based on random search and genetic algorithm to search for the optimal RT threshold within a predefined search space. We used response data from a low-stakes math assessment administered to over 5000 students in 658 schools across the United States. As we demonstrated how to use our data-driven approach, we also compared its performance with those of the existing threshold-setting methods. The results show that the proposed method could produce viable RT thresholds for detecting rapid guessing in low-stakes assessments. Moreover, compared with the other threshold-setting methods, the proposed method yielded more liberal RT thresholds, flagging a larger number of responses. Implications for practice and directions for future research were discussed.
1. Introduction
The primary goal of educational assessments is to produce valid scores that indicate what students know and can do. When participating in an educational assessment, each student (or test taker) is expected to show effortful test-taking behavior by reading each item carefully and making a genuine attempt to find the correct answer. In practice, however, some students (referred to as “disengaged test-takers”) may not be motivated enough to provide maximal effort, especially on low-stakes assessments with minimal consequences for students, such as international large-scale assessments, national or statewide assessments, and progress monitoring and screening measures used in K-12 classrooms [1,2,3]. For students exhibiting non-effortful test-taking behavior, the resulting assessment scores become less valid, as they are likely to underestimate the students’ true proficiency levels.
To alleviate the negative impact of non-effortful test-taking on assessment results (e.g., scores estimated from the assessment), responses associated with non-effortful test-taking behaviors can be removed from response data using a post hoc approach (i.e., after the test administration rather than real-time surveillance). To date, researchers have proposed various methods to detect item responses where disengaged students fail to show effortful test-taking behavior (e.g., [4,5]). These methods often rely on the use of response times (RTs)—the total duration elapsed between when the student views a particular item (or task) and when she or he either moves to the next item after answering the current item or reaches the end of the assessment. Researchers use RTs extracted from digital or computer-based assessments to identify students who demonstrate rapid guessing behavior by spending a very short amount of time on the items. The presence of rapid guessing leads to a variety of psychometric issues, such as contaminating item response data prior to estimating item parameters and test scores, negatively impacting the validity of test scores and hampering the test development process [6].
To date, several methods have been proposed to find an RT threshold that distinguishes students who rapidly guess their answers from those who put sufficient effort into answering the items. Some of these methods include the normative threshold (NT) method [5], the cumulative proportion (CUMP) method [4], the information-based RT flagging method [7], and the mixture log-normal (MLN) method [8]. As Soland et al. [9] discussed in their recent study, each of these threshold-setting methods has some limitations that impact their accuracy in detecting rapid guessing behavior. For example, the MLN method relies on a highly restrictive assumption that the RT distribution of an item must be bimodal, where the lower mode represents rapid guessing and the upper mode indicates effortful responding. The CUMP method also depends on another restrictive assumption that the proportion-correct value for students flagged for rapid guessing must be equal to the chance rate for each item (e.g., for an item with four response options, the chance rate is ). Unlike the MLN and CUMP methods, the NT method provides a simplified solution by identifying a user-defined RT threshold (e.g., 10% of the average RT value), which may not be empirically supported in practice [10].
In the recent literature, Soland et al. [9] and Kroehne et al. [11] provided a comparison of various threshold-setting methods using real data from adaptive and non-adaptive large-scale assessments. Both studies reported that the current methods tend to yield RT thresholds that identify very different rates of rapid guessing behavior in the response data. In this study, we propose a data-driven approach based on the NT and CUMP methods that iteratively searches for the optimal RT threshold in identifying rapidly guessed responses. Specifically, we employ random search and genetic algorithm to sample a wide range of RT values and look for a suitable RT threshold that enhances the model–data fit for the item response theory (IRT) model underlying the response data. Our study is guided by the following research questions: (1) Does the proposed data-driven approach produce viable RT thresholds for detecting rapid guessing in low-stakes assessments? and (2) How consistent are the responses identified as rapid guessing across the different threshold-setting methods? Results of this study provide researchers and practitioners with empirical evidence on the utility of data-driven methods in detecting rapid guessing and advance the development of future methods focused on RT-based detection of rapid guessing in educational assessments.
2. Background
2.1. Rapid Guessing in Low-Stakes Testing
Educational assessment plays a key role in the evaluation of learning outcomes and the determination of students’ proficiency levels in diverse contexts [12]. In practice, assessments with important consequences for students (e.g., grades, graduation, certification, and awards) are often considered “high-stakes”, whereas assessments that do not heavily affect students’ grades or other educational outcomes are viewed as “low-stakes”. However, unlike its name suggests, a low-stakes assessment can also produce important insights for students and teachers, such as more timely information about if and how students are learning, where they may need development to ultimately succeed, and who requires additional support or interventions. Moreover, aggregated scores from low-stakes assessments may yield important guidance at the institutional or governmental level, such as funding allocation, strategic planning for schools, and educational reforms for countries [12]. However, it should be noted that such funding allocations, as well as strategic planning and educational reform, require careful reflection about the long-term outcomes of such incentives for schools, teachers, and students (e.g., [13]).
Regardless of whether it is a high-stakes or low-stakes assessment, students are expected to put in enough effort while taking an assessment, which in turn becomes a prerequisite for making valid interpretations of assessment scores [14]. However, due to the lack of formal or personal consequences for students, the validity of low-stakes assessments is more likely to be threatened by the presence of aberrant responses and rapid guessing as a result of low test-taking effort [15,16,17]. Rapid guessing occurs when students spend a very short amount of time on an item that would not allow them to read and understand the item content properly before making an attempt to provide an answer. The total time spent on each item (i.e., RT value) can be recorded using digital pens in paper-and-pencil assessments (e.g., [11,18]), while RT information can be automatically collected in computer-based or digital assessments. Using RT information collected from the assessment, responses below a particular RT threshold can be flagged as “rapid guessing”, while responses above the same threshold are considered “solution behavior”, yielding a binary index of rapid guessing for each valid response [12].
Research showed that the presence of rapid guessing behavior may reduce the data quality and contaminate inferences made based on the assessment results, because rapidly guessed items fail to reflect what students know or can do [19,20,21]. Ignoring rapid guesses, rather than imperfectly identifying them, is also associated with more disruptive consequences for assessment results [22]. For example, rapid guesses may distort statistical estimates (e.g., the effect of a treatment [23] and achievement gains [24]), undermine classification and prediction models, and bias psychometric properties [25]. They may also generate differential item functioning issues [26] and may trigger problems in test equating [27]. Therefore, researchers and practitioners need to identify and handle rapid guesses to obtain warranted inferences and improve data quality.
2.2. Using Response Times to Identify Rapid Guesses
To address the problem of rapid guessing in low-stakes assessments, researchers often use RTs to identify students who answer the items too quickly, based on the assumption that each student needs a certain amount of time to read the item, understand what the item is asking, and provide an answer (e.g., selecting a response option in a multiple-choice item). To date, several RT-based methods have been proposed to detect rapid guessing (e.g., [5,7,17]). Typically, these methods rely on finding or setting a threshold based on the RT distribution of each item that categorizes responses as either rapid guessing (i.e., responses below the RT threshold) or solution behavior (i.e., responses above the RT threshold) and flags rapid guesses for removal (i.e., filtering) or further analysis [4].
As there are no universally accepted rules for identifying a reasonable RT threshold, researchers implemented different criteria for the threshold-setting procedure, such as item characteristics (e.g., item difficulty), average or median RT values, and statistical characteristics of the RT distribution. For example, the visual inspection method [28,29] assumes that if there is a significant amount of rapid guessing for an item, then the item’s RT distribution should be bimodal, where the first mode represents rapid guesses and the second mode represents solution behaviors. A suitable threshold falling between the two modes can distinguish rapid guesses from the solution behavior. Despite its ease of use, this method becomes impractical when the item has a unimodal distribution, where RT values for rapid guesses and solution behavior are blended [7,11].
In this study, we propose a new approach for finding the optimal RT threshold in detecting rapid guessing by extending the two existing methods, namely the NT method [5] and the CUMP method [4]. The NT method identifies the RT threshold based on a user-defined percentage of the average RT value required to respond to an item (e.g., NT10 refers to 10% of the average RT value). The same percentage value (as seconds) is also used as the maximum value of the RT threshold. For example, if the average RT value for a given item is 50 s, then the RT threshold becomes 5 s (i.e., 10% of 50 s) based on the NT10 method. If, however, the resulting threshold was larger than 10 s, then the RT threshold would be 10 s. The same procedure can also be used with other percentage values (e.g., 15% for the NT15 method and 20% for the NT20 method). The NT method provides an easy and effective way to identify rapid guesses based on a user-defined criterion, instead of relying on visual inspection of a reasonable cut point in the RT distribution [5,9].
The CUMP method [4] sets the RT threshold by considering both the RT distribution of the item and the response accuracy among students who exhibit rapid guessing behavior. Specifically, this method assumes that students who rapidly guess the answer for a given item randomly select one of the response options, and thus the cumulative proportion-correct (i.e., response accuracy) for this group should be around the chance rate (e.g., 25% for an item with four response options). The authors in [4] argued that, as the duration spent on the item increases (i.e., transitioning to solution behavior), students’ probability of answering the item correctly should go beyond the chance rate. Therefore, when the CUMP method is used, the threshold for detecting rapid guessing becomes the RT value for which the cumulative proportion-correct for students with rapid guessing is about to exceed the chance rate [4]. The CUMP method is more advantageous over other RT-based methods used for detecting rapid guessing because it relies on a mathematical definition instead of a visual inspection of the RT distribution. Moreover, the maximum RT threshold can be set based on statistical evidence from the RT distribution and the response accuracy [4,9].
2.3. Limitations of the NT and CUMP Methods
The NT and CUMP methods share several commonalities in the identification of rapid guessing. First, both methods rely on RT as a means for detecting rapidly guessed responses. Second, both methods can be easily implemented with large-scale assessments where the RT information is available for the items. Third, unlike the other methods (e.g., visual inspection) that lack a definitive range for the RT threshold, both the NT and CUMP methods enable researchers to set the maximum RT threshold when identifying rapid guessing. The maximum RT threshold is the user-defined percentage value for the NT method and the percentage that differentiates the chance and non-chance response for the CUMP method [4,5,9]. Instead of diverging from each other, these two methods are complementary in their work, because CUMP does not work well with extremely easy or difficult items [9]. For such items, the NT method, rather than the CUMP method, can be used to identify the RT thresholds [4].
The NT and CUMP methods also have some limitations that could hamper their effectiveness in detecting rapid guessing. In the NT method, the RT threshold is often determined without empirical evidence (e.g., other quantitative metrics such as response accuracy or item-total correlation) or validation, as this method relies on the researcher’s subjective judgment to determine the optimal threshold [4,10,11]. The NT method also applies the same percentage (e.g., 15% of the average RT value) to all items in the test. However, since the items often differ in their content and psychometric characteristics (e.g., difficulty and discrimination), they may require different RT thresholds to detect rapid guessing [30,31,32]. For example, using more time with high-difficulty items may raise the chance for students to find the correct answer (i.e., taking time to think), while using more time with low-difficulty items may lower the chance to answer the items correctly (e.g., overthinking the answer or being inattentive) [33].
As explained earlier, the CUMP method is not suitable for items that are too easy or too hard, because it assumes a large discrepancy between the response accuracy values of students with solution behavior and those who rapidly guess the answer. However, this discrepancy might be small in the items with extremely high or low difficulty levels [7]. That is, if the item is very easy (or very hard), the cumulative proportion-correct, regardless of the selected RT threshold, may never get closer to the anticipated chance rate for students who exhibit rapid guessing behavior [7]. Moreover, the same assumption underlying the CUMP method may not hold in other cases where the cumulative proportion-correct for rapid guesses is below the chance rate due to various cognitive biases. For example, students who exhibit rapid guessing behavior may choose a particular response option (e.g., option C) consistently [7] or select a response option based on the quality and positions of distractors (i.e., incorrect response options) [34,35,36]. In this case, the accuracy of rapidly guessed responses may be above the chance level, especially if the rapid guessing mechanism is aligned with the answer key (e.g., the middle response options of B or C are the key for most items) [37].
To address the limitations of the NT and CUMP methods, we propose to employ a data-driven method to identify the optimal RT thresholds for detecting rapid guessing. Specifically, we use two optimization algorithms (random search and genetic algorithm) to search for the optimal RT threshold iteratively within a range of possible RT thresholds. Instead of following a one-size-fits-all approach (e.g., applying the same percentage to all items in the NT method), this method aims to detect the optimal RT threshold for each item by taking the peculiarities of an assessment into account. Furthermore, our proposed method connects the detection of rapid guessing to the psychometric model underlying the assessment based on the assumption that the presence of rapid guessing would add noise to the response data and thereby distort the measurement quality. In the following sections, we explain how the random search and genetic algorithms can be used for the RT threshold selection and then use a real-data study to demonstrate our proposed method for finding the optimal RT threshold when detecting rapid guessing in low-stakes assessments.
3. Methods
3.1. Data Source
The data for this study came from second graders (87%) and third graders (13%) in 658 schools who participated in a computer-based math assessment administered in the United States during the 2018–2019 school year (). Schools and school districts use the results of this computer-based assessment to monitor elementary students’ math growth throughout the school year, with repeated assessments administered in the fall, winter, and spring. Since the primary goal of this low-stakes assessment is to help teachers monitor how efficiently and correctly students can solve math problems, there are no direct consequences (e.g., reward or grade) for the students. The assessment consists of 40 constructed-response items focusing on basic math facts and operations (e.g., addition and subtraction). For each item, students are required to complete a mathematical operation and then enter their numerical answers within a maximum duration of 30 s per item. It should be noted that compared with multiple-choice items, constructed-response items have a lower chance rate because students cannot guess the correct answer by selecting one of the available response options. However, they can still enter a random numerical value for the sake of answering the item. Before starting the assessment, students were instructed to answer as many items as possible. Students’ responses (correct, incorrect, or not-answered) and their response times were recorded for each item. All item responses were scored dichotomously (1 = correct, 0 = incorrect or not-answered).
3.2. Data Analysis
As explained above, we used a response dataset including item responses and RT values obtained from a computer-based math assessment. We identified RT thresholds for each item using our proposed approach based on the random search and genetic algorithms and the NT method [5]. For the NT method, we used NT10 (10% of the average RT value), NT15 (15% of the average RT value), NT20 (20% of the average RT value), and NT25 (25% of the average RT value). Our preliminary analysis indicated that we did not have to set a maximum threshold (e.g., 10 s for NT10), since the maximum response time was 30 s for all items. For each method, we identified the RT thresholds for the entire assessment (i.e., 40 items) and reported various results (e.g., model fit indices, correlations between estimated scores, and percent of students with rapid guessing behavior). The data analysis was conducted using the randomsearch, GA [38,39] and mirt [40] packages in R [41]. The following section describes the details of our proposed approach with the random search and genetic algorithms.
Setting RT Thresholds with Random Search
Random search refers to a family of stochastic methods designed for global optimization problems with continuous or discrete variables [42]. Unlike grid search, which relies on an exhaustive search of a manually specified hyperparameter space, random search uses the random sampling of a sequence of points in the hyperparameter space of the targeted algorithm [43]. Pure random search begins with the identification of a sequence of independent and identically distributed points within a reasonable search space. Then, the algorithm tries to find the direction of descent or ascent by randomly selecting values within the search space while continuously evaluating the performance of the target function [44]. Multiple iterations are implemented until finding the best value for local or global minima or maxima. Compared with grid search, random search is computationally less intensive and finds an optimal solution with significantly less computational time, because it relies on function evaluations with randomly drawn values, rather than gradient or Hessian information [42,45].
In this study, the target function for finding local maxima (i.e., RT threshold for each item) is based on the log-likelihood difference between the baseline IRT model (i.e., rapid guesses are ignored) and the adjusted IRT model (i.e., rapid guesses are removed based on the RT threshold selected from the search space). For an IRT model, the log-likelihood can be expressed as
where refers to observed data points, and the IRT model refers to a logistic model that defines the probability of answering an item correctly based on a person’s ability level and a set of item parameters. For example, the two-parameter logistic (2PL) IRT model can be formulated as follows:
where is person j’s ability level on a logistic scale ranging from to , is the discrimination parameter for item i, is the difficulty parameter for item i, e is the exponential function, and refers to person j’s probability of answering item i correctly given his/her ability and the parameters of item i.
The overall fit of an IRT model can be measured based on the deviance statistic (−2 log-likelihood) [46]. Theoretically, the deviance of the IRT model reflects the discrepancy between the expected and observed responses in the items based on the target ability (). The deviance statistic increases as the observed responses deviate from the expected responses due to aberrant response behaviors (e.g., rapid guessing, item preknowledge, and cheating). Using this information, we propose to use the change in the deviance statistic as a function to be maximized. Specifically, we anticipate that the deviance difference would decrease as rapid guesses are removed from the response dataset, which can be shown as
where is the log-likelihood for the baseline IRT model including all item responses, is the log-likelihood for the adjusted IRT model excluding rapid guesses, and is the deviance difference between the two IRT models.
Our random search process begins with the estimation of the baseline IRT model (i.e., the 2PL IRT model based on the original response dataset). After saving the log-likelihood value for the baseline model, the algorithm randomly selects a particular RT threshold from the search space, including all possible RT values. In our study, we defined the search space based on the previous empirical studies using the NT method. Specifically, the search space for RT values was between 10% and 30% of the average RT value for each item based on the recommendations of Wise and Ma [5] and Soland et al. [9]. The selected RT threshold is used to remove rapid guesses from the response dataset, yielding a cleaned dataset. Next, an adjusted IRT model (i.e., the 2PL IRT model based on the cleaned response dataset) is estimated, and its log-likelihood value is extracted. The target function (see Equation (3)) computes the deviance difference and stores this value for each iteration to find the optimal RT threshold.
Although we use the deviance difference as the main criterion to look for the optimal RT threshold, we also consider the probability of correct response (i.e., cumulative proportion-correct) for rapid guessers. To achieve this, we first compute the cumulative proportion for each item at time t, denoted as CUMP(t), for students who spend less than t seconds on the item. Then, we divide the deviance difference by this CUMP(t) and look for the RT threshold that maximizes :
where the value of CUMP(t) can be fixed to 0.001 (or another small value) if the original CUMP(t) value is exactly zero, in order to avoid undefined results due to a division by zero. We use the adjusted deviance difference produced by Equation (4), rather than the original deviance difference, to determine the most optimal RT threshold. This approach allows us to combine a psychometric approach with the NT and CUMP methods.
It should be noted that the objective function defined in Equation (4) is suitable for assessment settings where the researcher does not have any priori hypothesis about the ideal value of CUMP(t) (e.g., using constructed-response items). Therefore, Equation (4) can be further revised to accommodate other types of assessment settings. For example, one can use
where is the CUMP(t) value after the log transformation. For multiple-choice items, Equation (5) could be more suitable than Equation (4), because the adjustment would be stronger within the range of and (i.e., the random guessing rate in a multiple-choice item with 4 response options), whereas the adjustment would get weaker as CUMP(t) increases beyond 0.25, which is not desirable since the rapid guessing rate is not expected to exceed the random guessing rate.
3.3. Setting RT Thresholds with Genetic Algorithm
In addition to the random search method, we also used a genetic algorithm to look for the optimal RT threshold for detecting rapid guessing. The genetic algorithm [47] is a metaheuristic optimization approach inspired by the theory of natural selection. According to natural selection, species and individuals who can adapt better to their environment have a greater chance of survival and reproduction potential, and thus, are more likely to pass their genes to future offspring. Similarly, the genetic algorithm iteratively selects the fittest solutions from a set of potential candidates to reproduce the next generation, resulting in solutions that “evolve” to become better. Given the adaptability, scalability, and simplicity of the genetic algorithm’s implementation, it has been used to solve various optimization problems in the disciplines of the physical and social sciences [48,49].
In a traditional genetic algorithm [50], each candidate solution is represented by a vector with a finite length analogous to the concept of a chromosome. All the candidate solutions (i.e., all chromosomes) collectively constitute the population. Just like a chromosome consists of a set of genes, the vector of each candidate solution is composed of a set of parameters (variables) that are encoded as a string of characters, integers, floats, or bits. Additionally, a fitness score is assigned to each chromosome (candidate solution) to assess their ability to compete. In order to find the optimal solution, the genetic algorithm employs an iterative reproduction process comprised of three key elements: selection, crossover, and mutation [51]. The term “selection” refers to the process of prioritizing candidate solutions with high fitness scores and allowing them to pass on their genes to future generations of solutions. Thus, future generations tend to have better performance than their predecessors. Crossover is the random selection of parameters from paired “parents” solutions to generate “child” solutions. Lastly, mutation aims to keep the diversity of genes and prevent early convergence by inserting random genes into offspring genes. Since the overall goal of the genetic algorithm is to maximize the fitness score of the population, the reproduction process repeats until when the fitness score converges or when the algorithm reaches the maximum number of iterations.
In this study, we use the genetic algorithm in the same way as we utilize the random search method. The algorithm starts with the estimation of the baseline model based on all item responses. Next, we define a search space that includes a population of candidate RT thresholds (i.e., 10% and 30% of the average RT value for each). We set the size of the population as 100 values randomly drawn within the range of 10% and 30% of the average RT value for each item. Using the candidate RT thresholds, we employ the genetic algorithm through an iterative reproduction process. We used the default options in the GA package [38] to determine the selection, crossover, and mutation settings. For each selected RT threshold, we compute the fitness score (i.e., adjusted deviance difference) and compare it with the fitness score of successive generations. Using this information, the algorithm runs a series of iterative reproduction phases, during which it selects the best RT thresholds, mates them, reproduces offspring RT thresholds, and inserts random genes into the offspring genes. The iteration is terminated when the maximum number of iterations is reached, which we set to 10 in this study. In the end, the algorithm reports the RT threshold at which the fitness score converges. Figure 1 illustrates how the random search and genetic algorithms can be used for finding the optimal RT threshold.
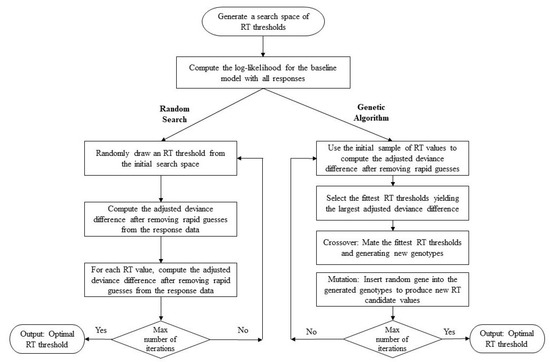
Figure 1.
The RT threshold-setting procedure using the random search and genetic algorithms.
3.4. Considering Other Optimization Criteria
The random selection and genetic algorithm approaches summarized above rely solely on the improvement in the model deviance as a result of removing rapid guesses from the response dataset. Although improving model fit may be a sufficient criterion for finding the optimal RT thresholds in most cases, one could argue that there are other important criteria that should be considered in the search process. For example, Leite et al. [52] showed that a long measurement tool (e.g., a psychological scale) could be abbreviated by selecting the best items based on any number of predetermined criteria, such as test reliability and the total test information. Although scale abbreviation is different from the search of optimal RT thresholds, the underlying optimization mechanisms are similar.
In this study, in addition to the deviance difference, we also consider test reliability as a secondary evaluation criterion in the objective function (see Equation (4)). Specifically, we propose to use empirical reliability , which can be obtained from the empirical ability distribution from a particular sample of students in the context of IRT:
where is the variance of the ability estimates for N students , and is computed by averaging the standard errors of across N students. We anticipate that removing rapid guesses can improve the empirical reliability of the assessment, since such responses add noise to the response data. If, however, valid responses are also removed from the response data, then the empirical reliability is likely to decrease as a result of having less information (i.e., fewer responses) about the students. To make the random search and genetic algorithm consider the empirical reliability, the value from each iteration can be considered as an additional metric to be maximized in Equation (4).
3.5. Evaluating the RT Thresholds
To answer our first research question about producing viable RT thresholds for detecting rapid guessing, we compared the results obtained from the random search and genetic algorithm methods with those from the baseline model based on the original response dataset (i.e., potential random guesses are ignored). To answer the second research question on the consistency of RT thresholds obtained from different threshold-setting procedures, we compared the results of the random search and genetic algorithm methods with those obtained from the NT10, NT15, NT20, and NT25 methods.
To make a model-level evaluation, we used several model fit indices such as Akaike’s Information Criterion (AIC), sample-size-adjusted BIC (SABIC), Bayesian Information Criterion (BIC), Hannan–Quinn criterion (HQ), and log-likelihood value. In this step, we also conducted a small simulation study to highlight the importance of purposeful threshold selection. For each item, we identified the largest number of flagged responses across the NT, random search, and genetic algorithm methods, removed the same number of randomly selected responses from the response dataset, and then obtained model fit indices. This procedure was repeated 500 times, and the average fit indices were reported. We anticipated that removing responses randomly (without considering RT values) would yield worse results than the threshold-setting methods, especially in terms of reliability.
To compare the results from different threshold-setting methods, we analyzed item difficulty values across the different threshold-setting methods, correlated the ability estimates obtained using different IRT models (i.e., baseline models, NT-based methods, random search, and genetic algorithm), and compared the proportion-correct scores for rapid guessers using the random search and genetic algorithms. In addition, we also evaluated the efficiency of the random search and genetic algorithms regarding the computational time required by each method to find an optimal solution for each item.
4. Results
4.1. Research Question 1: Does the Proposed Data-Driven Approach Produce Viable RT Thresholds for Detecting Rapid Guessing in Low-Stakes Assessments?
To address our first research question, we compared the results of the random search and genetic algorithms with those from the baseline model (i.e., the 2PL IRT model based on the original response dataset) in terms of item parameters and model-level statistics. As expected, both random search and genetic algorithm successfully produced an optimal RT threshold for each of the 40 items included in the assessment. Table 1 presents the average RT and proportion-correct values based on the entire sample of students for the baseline model and the adjusted models, where rapid guesses were removed based on the RT thresholds identified by random search and genetic algorithm.

Table 1.
Average RT and proportion-correct values for the entire sample of students.
The results show that the average RT values in the baseline model increased after removing the identified rapid guesses based on random search and genetic algorithm. This was an expected finding because eliminating rapid guesses for each item removed students with very short RT values and retained those who spent sufficient time to read, understand, and answer the items. The average RT values for random search and genetic algorithm were very close, suggesting that the two methods selected similar RT thresholds for the items. Unlike the average RT values, the proportion-correct values from the baseline model decreased after removing rapid guesses identified by the random search and genetic algorithm methods, with genetic algorithm generating higher proportion-correct values than random search. This was also an expected finding because rapid guesses are more likely to be incorrect than correct, which inflates item difficulty (i.e., lowering the proportion-correct values).
Figure 2 demonstrates the RT thresholds (as percentages of the average RT value) for each item. For most of the items, the two methods yielded very similar RT thresholds. Although there were a few items (e.g., items 12, 34, and 39) for which either random search or genetic algorithm yielded relatively higher RT thresholds, there was no clear pattern in the results. Both random search and genetic algorithm seemed to have identified RT thresholds within the range of 28% and 30% of the average RT values. This is an interesting finding because the RT thresholds selected by both methods were close to the 30% boundary, although the search space for the RT thresholds was set up within the range of 10% and 30% of the average RT values for the items. This finding also suggests that, compared with the NT approaches (e.g., NT10 with the 10% of the average RT value), the proposed data-driven approach with random search and genetic algorithm tends to yield more liberal RT thresholds for detecting rapid guessing, despite using both deviance difference and empirical reliability as optimization criteria. These comparisons are discussed in more detail in the next section.
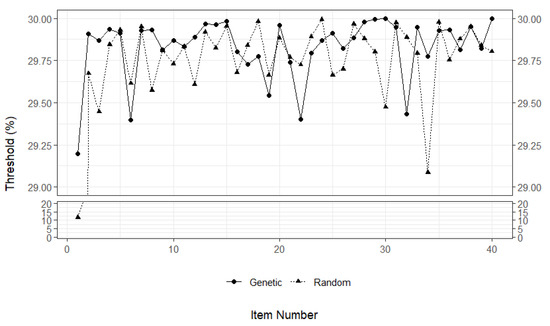
Figure 2.
RT thresholds for each threshold-setting method as percentages of the average RT values of the items.
To have a closer look at the impact of rapid guessing on the items, we also computed the average RT and proportion-correct values for each item based on the sample of students who were flagged for exhibiting rapid guessing by each optimization method (see Table 2). Overall, the average RT values for both methods were quite short (i.e., within the range of 0.224 s and 0.904 s), indicating the presence of rapid guessing response behavior among these students. The two algorithms also produced similar low proportion-correct scores for the items, except for item 1. For the majority of the items, their proportion-correct values of the rapid guesses were either 0 or very close to 0. Only 4 items out of 40 items (i.e., items 1, 6, 21, and 35) had proportion-correct values greater than 1 (i.e., 1%). For example, based on the genetic algorithm, approximately 18% of the students who, on average, spent 0.419 s on item 1 were able to answer this item correctly, whereas none of the students could answer the following three questions (i.e., items 2, 3, 4) correctly. As explained earlier, the assessment used in this study consisted of constructed-response items that required short answers (rather than selecting a response option in a multiple-choice item), and thus rapid guesses were very unlikely to be correct. In line with this information, the results presented in Table 2 indicate that random search and genetic algorithm produced viable RT thresholds to identify rapid guesses.
Table 2.
Average RT and proportion-correct values for rapid guessers.
To illustrate the adjustment in item characteristics after removing rapid guesses based on random search and genetic algorithm, we identified a particular item (item 38) from the assessment and created an item characteristic curve (ICC) plot for the baseline IRT model based on the original response dataset and the adjusted IRT models based on the response datasets where rapid guesses were eliminated by the two optimization methods. In Figure 3, the x-axis demonstrates the ability (), and the y-axis shows the probability of answering item 38 correctly. Compared with the baseline model (i.e., solid line), the adjusted models seem to produce lower item difficulty, increasing the probability of success. For example, a student with the ability level of had a 75% chance of answering the item correctly in the baseline model, whereas the same student had roughly an 80% chance of answering the item correctly in the adjusted models. This finding was not surprising because many incorrect answers associated with rapid guessing were removed before estimating the adjusted IRT models. Despite the visible change in item difficulty, the slopes of the ICCs from the baseline and adjusted IRT models showed that item discrimination remained unchanged, suggesting that removing rapid guesses did not affect how accurately the item could distinguish low-achieving and high-achieving students.
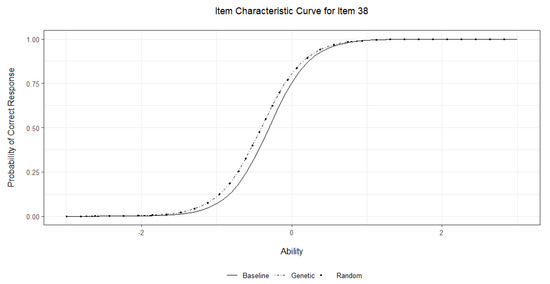
Figure 3.
Item characteristic curves for item 38 based on the item parameters obtained from the baseline and adjusted IRT models.
Finally, we also compared the performances of random search and genetic algorithm with regard to computational time (in minutes) in a computer with a 3.6 GHz, i7 processor and 16 GB RAM. Our results show that random search was a less computationally demanding and remarkably faster algorithm (computation time per item: min, min) than the genetic algorithm (computation time per item: min, min). The minimum and maximum computation times were 10.86 min and 15.01 min (range = 4.15) for random search and 82.71 min and 109.43 min (range = 26.72) for the genetic algorithm. These results are in line with our expectations because, despite using the same search space, the genetic algorithm involves multiple rounds of drawing random values until it finds the most optimal value, whereas random search takes a single random sample of values within the search space and then looks for the best solution.
4.2. Research Question 2: How Consistent Are the Responses Identified as Rapid Guessing across the Different Threshold-Setting Methods?
To answer the second research question of this study, we compared the results of random search and genetic algorithm with those from the NT10, NT15, NT20, and NT25 methods. The top part of Figure 4 shows the RT thresholds (in seconds) identified by the six threshold-setting methods for each item. For all items in the assessment, the identified RT thresholds were less than 2 s. However, the thresholds identified by random search and genetic algorithm were consistently higher than those identified by the NT methods across all items. In other words, these two optimization algorithms (i.e., random search and genetic algorithm) identified more liberal RT thresholds for detecting rapid guessing. Moreover, the RT thresholds produced by random search and genetic algorithm were very similar to each other. As recent research also suggested, the NT10 method seemed to be very conservative in finding RT thresholds, leading to the under-identification of rapid guesses (e.g., [9,53]).
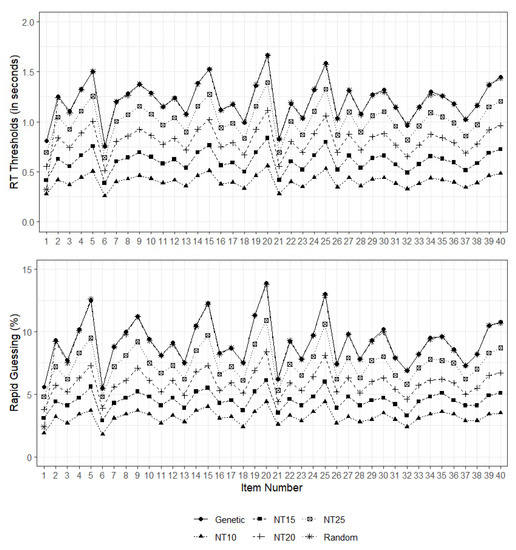
Figure 4.
RT thresholds (top) and percentage of rapid guessing cases (bottom) identified by each threshold-setting method.
The bottom part of Figure 4 shows the percentage of students who were flagged for rapidly guessing their responses in the low-stakes math assessment. Since the random search and genetic algorithm methods appeared to produce more liberal RT thresholds, it was not surprising that these two methods also flagged a higher percentage of students for exhibiting rapid guessing behavior across all items. The random search and genetic algorithms flagged 5% to 15% of the students across the items, whereas the NT methods (except for NT25) generally flagged less than 10% of the students. Given the high similarity between the RT thresholds identified by random search and genetic algorithm, the percentages of students flagged for rapid guessing were nearly identical across all items.
We also compared the threshold-setting methods at the model level. Table 3 shows a summary of model fit indices for the baseline IRT model, the adjusted IRT models (based on random search, genetic algorithm, and NT methods), and the simulation study based on the random deletion of responses. Lower values of AIC, BIC, SABIC, and HQ and higher values of log-likelihood and reliability indicate better model-data fit. The results presented in Table 3 indicate that the random search and genetic algorithms outperformed all variants of the NT method across all model evaluation metrics. Between the two optimization algorithms, the genetic algorithm was superior to random search, although the differences in their model fit indices were mostly negligible. In addition, we found a consistent and steady pattern for the NT methods. The higher RT thresholds yielded better model fit performance. Although this pattern suggests that selecting a higher RT threshold (e.g., NT30) might result in an even better model fit, using the same RT threshold across all items still remains a major limitation of the NT method. Unlike the NT method, our proposed threshold-setting method determined the optimal RT threshold for each item independently, allowing for greater flexibility for excluding noise in the response dataset (i.e., rapidly guessed responses).
Table 3.
Model–data fit indices for the threshold-setting methods.
Table 3 also shows the average model fit indices (across 500 replications) for the IRT model, in which a number of responses for each item were removed randomly, regardless of their rapid guessing status. The model fit results suggest that removing item responses randomly, instead of using RT thresholds, produced lower relative fit indices at the expense of empirical reliability. Although the random deletion of responses yielded better values for AIC, BIC, SABIC, and HQ, it decreased empirical reliability significantly, even below the reliability of the baseline model based on the original dataset. This finding has two important implications. First, identifying and removing rapid guesses purposefully based on RT values improves not only the model fit but also the overall reliability attained by a given assessment. Second, using empirical reliability (or another measure of reliability) as an additional optimization criterion in the iterative search process for RT thresholds can help maintain the psychometric quality of the assessment while identifying and removing rapid guesses effectively from the response dataset.
Our final comparison focused on the ability estimates for the sample of 5088 students from the baseline model and the adjusted models based on the threshold-setting models. Figure 5 shows a histogram of the ability estimates on the diagonal part, the Pearson’s correlation coefficient between the ability estimates obtained from different models in the upper-diagonal part, and the scatterplots of the ability estimates in the lower-diagonal part. The results show that the correlations among the ability estimates were very high (, ), suggesting that the overall ranking of the students did not change significantly after removing the rapid guessing cases based on the six threshold-setting methods. The ability estimates generated by the adjusted models with random search and genetic algorithm were perfectly and positively correlated, , . As the percentage values for the NT methods increased from 10% to 25%, the NT methods could produce ability estimates more comparable to those produced by random search and genetic algorithm. Consistent with the results of correlation coefficients, the scatter plots on the lower-diagonal part also showed that the random search and genetic algorithms had a very close alignment. Another important finding is that there was a large disparity between the ability estimates from the baseline model and those from the threshold-setting methods in the lower-ability region (i.e., ), and this was more pronounced for the random search and genetic algorithms. This finding broadly supports the work of other studies in this area linking having a lower ability and the tendency to rapidly guess the items [54].
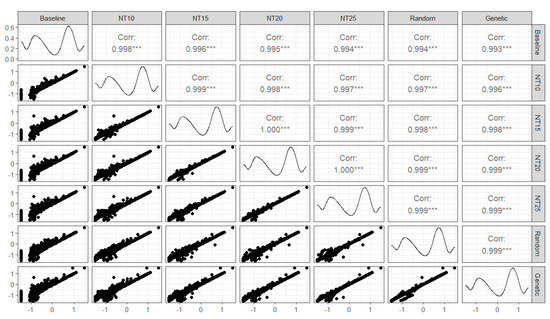
Figure 5.
Pairwise relationships between the ability estimates obtained from the IRT models.
5. Discussion
As computer-based assessments, or more broadly digital assessments, have become more prevalent over the last decade, the availability of process data (e.g., item response times) recorded by computers has motivated researchers to leverage such data to gain further insights into various aberrant response behaviors such as cheating, item preknowledge, hint abuse, and idle responding (e.g., [3,12,55,56]). In the context of low-stakes assessments with little to no formal consequences for students, rapid guessing emerges as a common type of aberrant response behavior that may jeopardize the validity of decisions and inferences made from the results of such assessments [6,9]. Researchers proposed various statistical methods to detect and eliminate rapidly guessed answers from the response data (e.g., [4,5,7]). These methods typically rely on the assumption that a particular RT threshold separates students with rapid guessing from those with solution behavior. Therefore, each method aims to identify the most accurate (or optimal) RT threshold that could help identify rapid guessing, while avoiding false negatives (i.e., flagging responses that are actually not rapid guesses) and false positives (i.e., missing responses that are truly rapid guesses).
In this study, we proposed a data-driven threshold-setting method that iteratively searches for the most optimal RT threshold for each item within a search space defined by the researcher. Our method works under the assumption that the presence of rapid guesses distorts the quality of response data, leading to weaker model–data fit and lower reliability for the psychometric model underlying the assessment (e.g., a 2PL IRT model). We combined two optimization algorithms (random search and genetic algorithm) with the existing threshold-setting methods, namely the NT method [5] and the CUMP method [4], to build a single search function. This function looks for the RT threshold that could maximize the adjusted deviance difference between the baseline model (based on the original response dataset) and the adjusted model (i.e., after rapid guesses have been removed based on the identified RT threshold). In addition to the deviance difference, the function uses empirical reliability as a secondary criterion to be maximized. To demonstrate how the proposed method works, we used real data from a low-stakes, computer-based assessment designed for measuring and monitoring elementary students’ progress in math throughout the school year. We examined if the proposed approach could produce viable RT thresholds for detecting rapid guessing in low-stakes assessments and also compared its performance with that of the NT method.
Our findings showed that the proposed approach could produce viable RT thresholds for identifying rapid guesses in the items. As we removed the responses identified as rapid guesses, the proportion-correct values for all items increased, reducing the impact of the inflation caused by incorrect responses associated with rapid guessing. A similar result was also obtained when we reviewed the item parameters from the baseline and adjusted IRT models (i.e., lower difficulty parameters after removing rapid guesses). The two optimization algorithms, random search and genetic algorithm, yielded very similar results in terms of the RT thresholds for most of the items in the assessment. However, the computational time required for the genetic algorithm was much higher than that of random search, due to having a more complex mechanism for sampling random RT values within the search space. Since the assessment consisted of constructed-response items requiring short answers rather than selecting a response option, the proportion-correct values were either zero or very close to zero for the students flagged for exhibiting rapid guessing behavior.
Furthermore, we found that our proposed threshold-setting method usually yielded more liberal RT thresholds than the NT methods. The NT methods produced smaller RT thresholds and flagged a fewer number of students for exhibiting rapid guessing (less than 10% for NT10, NT15, and NT20 and less than 15% for NT25), whereas our proposed approach produced relatively larger RT thresholds across all items and flagged a larger number of students (between 5% and 15%). At the model level, the adjusted IRT models for both our proposed method and the NT methods yielded better model–data fit than the baseline model, indicating the positive impact of removing rapid guesses on the response dataset. The genetic algorithm produced the best model–data fit indices among the six threshold-setting methods, including random search and the NT methods. The superiority of the genetic algorithm over random search was an expected finding, because random search, despite its efficiency, does not guarantee the best results, especially when the search space is large [57]. On the contrary, the genetic algorithm performs a more systematic search of the target parameter, albeit in a slower search process. Finally, the ability estimates produced by the baseline and adjusted IRT models showed that bias in ability estimation, especially for low-achieving students, was reduced when the threshold-setting methods were used for removing rapid guesses from the response dataset. This finding was in line with the previous studies that reported the positive impact of removing rapid guesses on the recovery of item and ability parameters (e.g., [58]).
In conclusion, the findings of this study suggest that our data-driven approach based on the random search and genetic algorithms can be an effective solution for detecting rapid guessing in low-stakes assessments. With our proposed method, researchers can define a reasonable “search space” for potential RT thresholds and allow the optimization algorithms to search for the most optimal threshold for each item. This could prevent researchers from making the subjective assumption that the same criterion (e.g., 10% of the average RT value as in the NT10 method) can correctly identify rapid guessing across all items (e.g., [10]). Furthermore, our proposed method enables researchers to consider the impact of rapid guessing on the psychometric model underlying the low-stakes assessment while searching for the optimal RT threshold for each item. Our findings suggest that researchers can combine data-driven approaches such as random search and genetic algorithm with psychometric theory to detect rapid guessing more accurately in low-stakes assessments, instead of simply evaluating the impact of rapid guessing on various psychometric indices such as reliability (e.g., [59]).
Limitations and Future Research
While the random search and genetic algorithm methods provide an effective solution to identify rapid guessing in low-stakes assessments, some limitations should be recognized. First, the dataset utilized in this study did not contain a “ground truth’ regarding which responses were truly rapidly guessed and which ones were valid attempts, because such a ground truth would be very hard to generate (e.g., using teacher observations or self-reports) in practice. Therefore, the methods presented in this study for detecting rapid guesses should be considered “exploratory” rather than “confirmatory” to promote informed decision making, instead of advocating for empirical interventions targeting rapid guessing. Second, given that the random search and genetic algorithms offer optimized RT thresholds informed by the data themselves, they require a large dataset (e.g., ) to obtain a stable threshold for each item. Future studies can evaluate the performance of the random search and genetic algorithms for detecting rapid guessing in relatively smaller datasets. Third, the search function utilized in this study considers each item separately to find the local maxima (i.e., maximum deviance difference). Future research may benefit from considering all items simultaneously to find the maxima at both the local (i.e., individual items) and global level (i.e., the whole test). Fourth, although the genetic algorithm performed the best among all the methods, it is the most computationally intensive method, requiring longer times to optimize the threshold selection. This also means that, in assessments with larger item banks, the genetic algorithm may not be an efficient approach for looking for the RT threshold for identifying rapid guessing. This may imply that researchers and practitioners may opt for random search, which is an efficient and yet reliable method for finding the RT threshold for detecting rapid guessing. Finally, our search function for finding the RT threshold was based on two criteria (i.e., the deviance difference between the baseline and the adjusted IRT models and empirical reliability). Future research may benefit from involving other criteria based on process data (e.g., actions or clickstream data) in the prediction of rapid guessing on static or interactive test items using predictive models [60].
Author Contributions
Conceptualization, O.B.; methodology, O.B., G.G. and T.W.; software, O.B. and G.G.; validation, O.B. and G.G.; formal analysis, O.B. and G.G.; investigation, O.B.; writing—original draft preparation, O.B., G.G., T.W. and B.T.; writing—review and editing, O.B., G.G., T.W. and B.T.; visualization, G.G.; supervision, O.B. All authors have read and agreed to the published version of the manuscript.
Funding
This research received no external funding.
Institutional Review Board Statement
Not applicable.
Informed Consent Statement
Not applicable.
Data Availability Statement
The data analyzed in this study are subject to copyright. Therefore, they cannot be discussed or shared by the researchers in any form or format.
Conflicts of Interest
The authors declare no conflict of interest.
Abbreviations
The following abbreviations are used in this manuscript:
| AIC | Akaike’s Information Criterion |
| BIC | Bayesian Information Criterion |
| CUMP | Cumulative proportion method |
| HQ | Hannan–Quinn criterion |
| ICC | Item characteristic curve |
| IRT | Item response theory |
| MLN | Mixture log-normal method |
| NT | Normative threshold method |
| RT | Response time |
| SABIC | Sample-size-adjusted BIC |
| 2PL | Two-parameter logistic model |
References
- Jensen, N.; Rice, A.; Soland, J. The influence of rapidly guessed item responses on teacher value-added estimates: Implications for policy and practice. Educ. Eval. Policy Anal. 2018, 40, 267–284. [Google Scholar] [CrossRef]
- Goldhammer, F.; Naumann, J.; Stelter, A.; Tóth, K.; Rölke, H.; Klieme, E. The time on task effect in reading and problem solving is moderated by task difficulty and skill: Insights from a computer-based large-scale assessment. J. Educ. Psychol. 2014, 106, 608–626. [Google Scholar] [CrossRef]
- Gorgun, G.; Bulut, O. A polytomous scoring approach to handle not-reached items in low-stakes assessments. Educ. Psychol. Meas. 2021, 81, 847–871. [Google Scholar] [CrossRef]
- Guo, H.; Rios, J.A.; Haberman, S.; Liu, O.L.; Wang, J.; Paek, I. A new procedure for detection of students’ rapid guessing responses using response time. Appl. Meas. Educ. 2016, 29, 173–183. [Google Scholar] [CrossRef]
- Wise, S.L.; Ma, L. Setting response time thresholds for a cat item pool: The normative threshold method. In Proceedings of the Annual Meeting of the National Council on Measurement in Education, Vancouver, BC, Canada, 13–17 April 2012; pp. 163–183. [Google Scholar]
- Wise, S.L.; Gao, L. A general approach to measuring test-taking effort on computer-based tests. Appl. Meas. Educ. 2017, 30, 343–354. [Google Scholar] [CrossRef]
- Wise, S.L. An information-based approach to identifying rapid-guessing thresholds. Appl. Meas. Educ. 2019, 32, 325–336. [Google Scholar] [CrossRef]
- Rios, J.A.; Guo, H. Can culture be a salient predictor of test-taking engagement? An analysis of differential noneffortful responding on an international college-level assessment of critical thinking. Appl. Meas. Educ. 2020, 33, 263–279. [Google Scholar] [CrossRef]
- Soland, J.; Kuhfeld, M.; Rios, J. Comparing different response time threshold setting methods to detect low effort on a large-scale assessment. Large-Scale Assessments Educ. 2021, 9, 8. [Google Scholar] [CrossRef]
- Rios, J.A.; Deng, J. Does the choice of response time threshold procedure substantially affect inferences concerning the identification and exclusion of rapid guessing responses? A meta-analysis. Large-Scale Assessments Educ. 2021, 9, 18. [Google Scholar] [CrossRef]
- Kroehne, U.; Deribo, T.; Goldhammer, F. Rapid guessing rates across administration mode and test setting. Psychol. Test Assess. Model. 2020, 62, 147–177. [Google Scholar]
- Lindner, M.A.; Lüdtke, O.; Nagy, G. The onset of rapid-guessing behavior over the course of testing time: A matter of motivation and cognitive resources. Front. Psychol. 2019, 10, 1533. [Google Scholar] [CrossRef] [PubMed]
- Koretz, D.M. Limitations in the use of achievement tests as measures of educators’ productivity. J. Hum. Resour. 2002, 37, 752–777. [Google Scholar] [CrossRef]
- AERA; APA; NCME. Chapter 1: Validity. In Standards for Educational and Psychological Testing; American Educational Research Association: Washington, DC, USA, 2014; pp. 11–31. [Google Scholar]
- Finn, B. Measuring motivation in low-stakes assessments. ETS Res. Rep. Ser. 2015, 2015, 1–17. [Google Scholar] [CrossRef]
- Setzer, J.C.; Wise, S.L.; van den Heuvel, J.R.; Ling, G. An investigation of examinee test-taking effort on a large-scale assessment. Appl. Meas. Educ. 2013, 26, 34–49. [Google Scholar] [CrossRef]
- Wise, S.L.; DeMars, C.E. Low examinee effort in low-stakes assessment: Problems and potential solutions. Educ. Assess. 2005, 10, 1–17. [Google Scholar] [CrossRef]
- Kroehne, U.; Hahnel, C.; Goldhammer, F. Invariance of the response processes between gender and modes in an assessment of reading. Front. Appl. Math. Stat. 2019, 5, 2. [Google Scholar] [CrossRef]
- Swerdzewski, P.J.; Harmes, J.C.; Finney, S.J. Two approaches for identifying low-motivated students in a low-stakes assessment context. Appl. Meas. Educ. 2011, 24, 162–188. [Google Scholar] [CrossRef]
- Wise, S.L.; Kong, X. Response time effort: A new measure of examinee motivation in computer-based tests. Appl. Meas. Educ. 2005, 18, 163–183. [Google Scholar] [CrossRef]
- Nagy, G.; Ulitzsch, E.; Lindner, M.A. The role of rapid guessing and test-taking persistence in modelling test-taking engagement. J. Comput. Assist. Learn. 2022. [Google Scholar] [CrossRef]
- Rios, J.A. Assessing the accuracy of parameter estimates in the presence of rapid guessing misclassifications. Educ. Psychol. Meas. 2022, 82, 122–150. [Google Scholar] [CrossRef]
- Osborne, J.W.; Blanchard, M.R. Random responding from participants is a threat to the validity of social science research results. Front. Psychol. 2011, 1, 220. [Google Scholar] [CrossRef] [PubMed]
- Wise, S.L.; DeMars, C.E. Examinee noneffort and the validity of program assessment results. Educ. Assess. 2010, 15, 27–41. [Google Scholar] [CrossRef]
- Rios, J.A.; Deng, J.; Ihlenfeldt, S.D. To What Degree Does Rapid Guessing Distort Aggregated Test Scores? A Meta-analytic Investigation. Educ. Assess. 2022, 27, 356–373. [Google Scholar] [CrossRef]
- Rios, J.A. Is differential noneffortful responding associated with type I error in measurement invariance testing? Educ. Psychol. Meas. 2021, 81, 957–979. [Google Scholar] [CrossRef] [PubMed]
- Deng, J.; Rios, J.A. Investigating the Effect of Differential Rapid Guessing on Population Invariance in Equating. Appl. Psychol. Meas. 2022, 46, 589–604. [Google Scholar] [CrossRef]
- Schnipke, D.L. Assessing Speededness in Computer-Based Tests Using Item Response Times; The Johns Hopkins University: Baltimore, MD, USA, 1996. [Google Scholar]
- Wise, S.L. An investigation of the differential effort received by items on a low-stakes computer-based test. Appl. Meas. Educ. 2006, 19, 95–114. [Google Scholar] [CrossRef]
- Hadiana, D.; Hayat, B.; Tola, B. A new method for setting response-time threshold to detect test takers’ rapid guessing behavior. In International Conference on Educational Assessment and Policy (ICEAP 2020); Atlantis Press: Amsterdam, The Netherlands, 2021. [Google Scholar] [CrossRef]
- Kong, X.J.; Wise, S.L.; Bhola, D.S. Setting the response time threshold parameter to differentiate solution behavior from rapid-guessing behavior. Educ. Psychol. Meas. 2007, 67, 606–619. [Google Scholar] [CrossRef]
- De Ayala, R.J. The Theory and Practice of Item Response Theory; Methodology in the Social Sciences; Guilford Press: New York, NY, USA, 2009. [Google Scholar]
- Bolsinova, M.; de Boeck, P.; Tijmstra, J. Modelling conditional dependence between response time and accuracy. Psychometrika 2017, 82, 1126–1148. [Google Scholar] [CrossRef]
- Gierl, M.J.; Bulut, O.; Guo, Q.; Zhang, X. Developing, Analyzing, and Using Distractors for Multiple-Choice Tests in Education: A Comprehensive Review. Rev. Educ. Res. 2017, 87, 1082–1116. [Google Scholar] [CrossRef]
- Shin, J.; Bulut, O.; Gierl, M.J. The Effect of the Most-Attractive-Distractor Location on Multiple-Choice Item Difficulty. J. Exp. Educ. 2020, 88, 643–659. [Google Scholar] [CrossRef]
- Tellinghuisen, J.; Sulikowski, M.M. Does the answer order matter on multiple-choice exams? J. Chem. Educ. 2008, 85, 572. [Google Scholar] [CrossRef]
- Lee, Y.H.; Jia, Y. Using response time to investigate students’ test-taking behaviors in a NAEP computer-based study. Large-Scale Assess. Educ. 2014, 2, 1–24. [Google Scholar] [CrossRef]
- Scrucca, L. GA: A Package for Genetic Algorithms in R. J. Stat. Softw. 2013, 53, 1–37. [Google Scholar] [CrossRef]
- Richter, J. Randomsearch: Random Search for Expensive Functions. 2022. Available online: https://jakob-r.de/randomsearch/index.html (accessed on 5 February 2023).
- Chalmers, P. Mirt: Multidimensional Item Response Theory. 2022. Available online: https://cran.r-project.org/web/packages/mirt/mirt.pdf (accessed on 5 February 2023).
- R Core Team. R: A Language and Environment for Statistical Computing; R Foundation for Statistical Computing: Vienna, Austria, 2021. [Google Scholar]
- Zabinsky, Z.B. . Random Search Algorithms; Department of Industrial and Systems Engineering, University of Washington: Seattle, WA, USA, 2009. [Google Scholar]
- Romeijn, H.E. Random Search Methods. In Encyclopedia of Optimization; Floudas, C.A., Pardalos, P.M., Eds.; Springer: Boston, MA, USA, 2009; pp. 3245–3251. [Google Scholar] [CrossRef]
- Ramasubramanian, K.; Singh, A. Machine Learning Using R: With Time Series and Industry-Based Use Cases in R; Springer Science+Business Media: Berlin/Heidelberg, Germany, 2018. [Google Scholar]
- Bergstra, J.; Bengio, Y. Random search for hyper-parameter optimization. J. Mach. Learn. Res. 2012, 13, 281–305. [Google Scholar]
- Osteen, P. An introduction to using multidimensional item response theory to assess latent factor structures. J. Soc. Soc. Work Res. 2010, 1, 66–82. [Google Scholar] [CrossRef]
- Holland, J.H. Genetic algorithms. Sci. Am. 1992, 267, 66–73. [Google Scholar] [CrossRef]
- Popa, R. Genetic Algorithms in Applications; IntechOpen: Rijeka, Crotia, 2012. [Google Scholar]
- Katoch, S.; Chauhan, S.S.; Kumar, V. A review on genetic algorithm: Past, present, and future. Multimed. Tools Appl. 2021, 80, 8091–8126. [Google Scholar] [CrossRef]
- Mitchell, M. An Introduction to Genetic Algorithms; MIT Press: Cambridge, MA, USA, 1998. [Google Scholar]
- Goldberg, D.E.; Korb, B.; Deb, K. Messy genetic algorithms: Motivation, analysis, and first results. Complex Syst. 1989, 3, 493–530. [Google Scholar]
- Leite, W.L.; Huang, I.C.; Marcoulides, G.A. Item selection for the development of short forms of scales using an ant colony optimization algorithm. Multivar. Behav. Res. 2008, 43, 411–431. [Google Scholar] [CrossRef] [PubMed]
- Wise, S.L.; Kuhfeld, M.R. Using retest data to evaluate and improve effort-moderated scoring. J. Educ. Meas. 2021, 58, 130–149. [Google Scholar] [CrossRef]
- Deribo, T.; Kroehne, U.; Goldhammer, F. Model-Based Treatment of Rapid Guessing. J. Educ. Meas. 2021, 58, 281–303. [Google Scholar] [CrossRef]
- Gorgun, G.; Bulut, O. Considering Disengaged Responses in Bayesian and Deep Knowledge Tracing. In Proceedings of the Artificial Intelligence in Education, Posters and Late Breaking Results, Workshops and Tutorials, Industry and Innovation Tracks, Practitioners’ and Doctoral Consortium, Durham, UK, 27–31 July 2022; Rodrigo, M.M., Matsuda, N., Cristea, A.I., Dimitrova, V., Eds.; Springer International Publishing: Cham, Switzerland, 2022; pp. 591–594. [Google Scholar] [CrossRef]
- Toton, S.L.; Maynes, D.D. Detecting Examinees With Pre-knowledge in Experimental Data Using Conditional Scaling of Response Times. Front. Educ. 2019, 4. [Google Scholar] [CrossRef]
- Liashchynskyi, P.; Liashchynskyi, P. Grid search, random search, genetic algorithm: A big comparison for NAS. arXiv 2019, arXiv:1912.06059. [Google Scholar]
- Wise, S.L.; DeMars, C.E. An application of item response time: The effort-moderated IRT model. J. Educ. Meas. 2006, 43, 19–38. [Google Scholar] [CrossRef]
- Rios, J.A.; Deng, J. Quantifying the distorting effect of rapid guessing on estimates of coefficient alpha. Appl. Psychol. Meas. 2022, 46, 40–52. [Google Scholar] [CrossRef]
- Ulitzsch, E.; Ulitzsch, V.; He, Q.; Lüdtke, O. A machine learning-based procedure for leveraging clickstream data to investigate early predictability of failure on interactive tasks. Behav. Res. Methods 2022, 1–21. [Google Scholar] [CrossRef]
Disclaimer/Publisher’s Note: The statements, opinions and data contained in all publications are solely those of the individual author(s) and contributor(s) and not of MDPI and/or the editor(s). MDPI and/or the editor(s) disclaim responsibility for any injury to people or property resulting from any ideas, methods, instructions or products referred to in the content. |
© 2023 by the authors. Licensee MDPI, Basel, Switzerland. This article is an open access article distributed under the terms and conditions of the Creative Commons Attribution (CC BY) license (https://creativecommons.org/licenses/by/4.0/).