Article

Transfer Learning Approach for Human Activity Recognition Based on Continuous Wavelet Transform

by
Olena Pavliuk
1,2,
Myroslav Mishchuk
2 and
Christine Strauss
3,*
1
Department of Distributed Systems and Informatic Devices, Silesian University of Technology, 44-100 Gliwice, Poland
2
Department of Automated Control Systems, Lviv Polytechnic National University, 79000 Lviv, Ukraine
3
Faculty of Business, Economics and Statistics, University of Vienna, Oskar Morgenstern Platz 1, 1090 Vienna, Austria
*
Author to whom correspondence should be addressed.
Algorithms 2023, 16(2), 77; https://doi.org/10.3390/a16020077
Submission received: 4 January 2023 / Revised: 16 January 2023 / Accepted: 30 January 2023 / Published: 1 February 2023
(This article belongs to the Special Issue Artificial Intelligence Algorithms for Healthcare)

Abstract

:
Over the last few years, human activity recognition (HAR) has drawn increasing interest from the scientific community. This attention is mainly attributable to the proliferation of wearable sensors and the expanding role of HAR in such fields as healthcare, sports, and human activity monitoring. Convolutional neural networks (CNN) are becoming a popular approach for addressing HAR problems. However, this method requires extensive training datasets to perform adequately on new data. This paper proposes a novel deep learning model pre-trained on scalograms generated using the continuous wavelet transform (CWT). Nine popular CNN architectures and different CWT configurations were considered to select the best performing combination, resulting in the training and evaluation of more than 300 deep learning models. On the source KU-HAR dataset, the selected model achieved classification accuracy and an F1 score of 97.48% and 97.52%, respectively, which outperformed contemporary state-of-the-art works where this dataset was employed. On the target UCI-HAPT dataset, the proposed model resulted in a maximum accuracy and F1-score increase of 0.21% and 0.33%, respectively, on the whole UCI-HAPT dataset and of 2.82% and 2.89%, respectively, on the UCI-HAPT subset. It was concluded that the usage of the proposed model, particularly with frozen layers, results in improved performance, faster training, and smoother gradient descent on small HAR datasets. However, the use of the pre-trained model on sufficiently large datasets may lead to negative transfer and accuracy degradation.

1. Introduction

Human activity recognition (HAR) is used nowadays in a variety of human-centric applications, including elderly care and digital medicine, intelligent buildings, abnormal activity monitoring, seizure detection, and fall prevention [1,2,3]. In general, HAR research can be divided into two categories: HAR that uses visual recognition, and HAR that uses wearable sensors [4]. While both methods are rapidly advancing, sensor-based HAR has a number of advantages [5,6,7]. Firstly, HAR applications often require complete location coverage, which may be either impossible or impractical using the camera-based approach. Secondly, vision-based HAR is plagued by privacy and ethics concerns, as cameras are typically perceived as recording devices and frequently imply constant surveillance. Hence, the focus of this work is on the sensor-based HAR approach.
HAR based on wearable sensors can be considered a classic multi-variable time-series classification problem involving the extraction of discriminative features from 1D signals to recognize activities using a classifier [8]. There are currently a number of approaches to the construction of sensor-based HAR models. The traditional feature-based approach implies the consequent execution of the following steps: signal preprocessing and noise removal (1), manual feature extraction and feature selection (2), and the use of machine learning (ML) algorithms to perform activity classification (3) [9,10]. This approach has shown promising results in many publications [11,12,13,14,15]; however, it has certain drawbacks. Firstly, statistical signal characteristics (i.e., shallow features) are frequently insufficient to recognize complex, multi-step activities and transient states. Second, it necessitates a high level of expertise from the researchers and an individualized approach to each dataset. Moreover, extracting compelling features becomes exceedingly complicated as the number of sensors increases.
Convolutional neural networks (CNN) have established the most recent state-of-the-art in speech and image recognition [16]. Nonetheless, CNN has found application in HAR problems as a powerful feature extraction mechanism and classifier. Due to the ability of CNN to automatically extract and select features, they can acquire high-level signal characteristics and often produce better results than models built using the traditional approach [17,18,19,20]. However, the peculiarity of this method is that it requires large training datasets to produce adequate results on new data; otherwise, it is prone to underfitting and overfitting problems. Several methods are available to mitigate this problem, including data augmentation and regularization [21,22]. Transfer learning (TL) is another promising technique in which a model trained on a more extensive and general source dataset is then fine-tuned on a target dataset [23].
Currently, there are numerous pre-trained models available for visual object recognition [24,25]. However, the goal of this research is the development of a pre-trained deep CNN model specifically for the HAR classification problem. To accomplish this, an analysis of the impact of various CWT configurations on the performance of popular CNN architectures was conducted, followed by an evaluation of the best-performing model on a target dataset with varying numbers of frozen layers to determine how it performs on new data. Hence, the main contributions of this study can be summarized as follows:
  • A novel deep-learning model pre-trained on CWT-generated scalograms was proposed, which is targeted specifically for sensor-based HAR classification problems. The suggested model outperformed the majority of state-of-the-art studies where the KU-HAR dataset was employed;
  • It was experimentally established that the usage of the proposed pre-trained model, especially with layer freezing, results in a more stable gradient descent, faster training, and improved performance on small datasets;
  • The impact of different CWT configurations on the performance of well-known neural network architectures was analyzed, which resulted in 60 combinations and over 300 models being trained and evaluated;
  • The potential of the CNN/CWT-based approach for addressing wearable sensor-based HAR classification problems was demonstrated, and the directions for future works employing the scalogram-based pre-training technique were proposed.
The paper is structured as follows: Section 2 reviews contemporary state-of-the-art studies and approaches in the sensor-based HAR domain and outlines the research gaps in this field. In Section 3, we explain the workflow of this study and describe the datasets, methods, and techniques employed. In Section 4, we provide the results obtained from the experiments. Section 5 includes analyses and discussions of the acquired results and their implications. Finally, Section 6 outlines the conclusion and proposes directions for future work employing the scalogram-based pre-training approach in the wearable-based HAR domain.

2. Related Works

Various classification algorithms, such as logistic regression (LR), support vector machine (SVM), K-nearest neighbors (KNN), random forest (RF), and XGBoost, have been used to classify activities using features extracted from HAR datasets. For example, the authors of [26] used manual feature extraction with the LR, SVM, and KNN classifiers and reached the maximum accuracy of 83.9%, 88.9%, and 95.3%, respectively, while recognizing seven activities of daily living (ADL). In [15,27], the KNN algorithm was declared the optimal method for classifying sensor-based HAR features due to its high accuracy and low statistical error rate. However, like other models constructed using the traditional approach, it was unable to effectively distinguish similar activities. In recent works that employ manual feature engineering, the XGBoost classifier [11,28,29,30] and classifier stacking [31,32] are gaining popularity due to their high efficacy.
With the proliferation and development of neural networks, deep learning (DL) methods began supplanting traditional methods for addressing HAR problems. In [17,18,19,20], the authors used CNN for sensor-based HAR activity classification tasks and obtained superior results compared to state-of-the-art models built using the traditional approach. The authors of [19] compared the performance of 1D and 2D sequential CNN models for HAR signal classification, concluding that 2D CNNs produce better results, outperforming traditionally constructed models. In [33], the authors used various DL models, including CNNs, recurrent neural networks (RNNs), and long short-term memory (LSTM), to classify activities based on smartphone accelerometer signals and determined that LSTM is the model with the best overall performance.
With the proliferation of HAR problems, various DL models that were constructed specifically for HAR classification tasks emerged. In [34], the authors proposed the InnoHAR model based on the combination of an Inception neural network (INN) and an RNN. The iSPLInception [35] was inspired by Google’s Inception-ResNet architecture and achieved high predictive accuracy while requiring fewer device resources to address signal-based HAR problems. In the most recent research, hybrid models based on LSTM and bi-directional LSTM (BiLSTM) [36,37,38,39] are gaining popularity for human activity classification due to their ability to effectively extract spatial and temporal characteristics.
The main challenges faced by DL-based models are the need for extensive training datasets, intra-class variations and similarity issues, and imbalanced training datasets. Thus, training DL models on small datasets typically results in overfitting or underfitting problems that result in poor performance on new data. Transfer learning (TL) is a promising solution to the problems mentioned. Currently, several papers propose pre-trained models specifically for the sensor-based HAR classification problem. The authors of [40] proposed a knowledge transfer approach called SA-GAN, which employs the generative adversarial network (GAN) to perform cross-subject TL. This method outperformed other state-of-the-art works in 66% of experiments; in the other 25%, it came in second. Another approach was used in [41]. The authors measured the data distribution distance between the source and target subjects using the Wasserstein distance metric and then employed the DeepTransHHAR model for feature extraction and activity recognition. The authors of [42] present a stratified TL framework for source domain selection and activity transfer based on stratified distance and capture of the local attribute of the domains.
In the HAR domain, there are methods besides TL for mitigating the overfitting and underfitting issues. In [43,44], the authors used self-supervised learning techniques that utilize unlabeled data collected from wearable sensors, which resulted in an auspicious increase in classification performance. However, despite not requiring large labelled datasets, this approach is not applicable to small HAR datasets because it still requires an extensive quantity of recorded sensor signals.
The continuous wavelet transform (CWT) is a promising technique for improving the accuracy of CNN for signal classification. The notable feature of CWT is that it allows the conversion of the 1D signal recognition problem into the image classification problem, which has undergone significant development in recent years [45]. In biomedical signal processing, CWT is commonly used in EEG signal classification [46,47,48,49] and is regarded as a proven tool for improving the accuracy of CNN models. Considering the wearable sensor-based HAR domain, the CWT was used in [50,51,52], which resulted in a promising performance increase.
Even though CWT is not a new tool in signal processing, and the combination of CWT and CNN is widely used for EEG signal classification, no studies have yet investigated the effect of transform parameters on neural network performance. Moreover, there are currently no studies in the wearable sensor HAR domain comparing the performance of different CNN architectures when classifying CWT-generated scalograms. Therefore, the focus of this study is on analyzing the effect of CWT configurations on the performance of well-known network architectures. On the basis of the results of the performed analysis, we propose a DL model pre-trained on CWT-generated scalograms, which will make it possible to train a deep CNN on relatively small HAR datasets by transferring knowledge from a larger and more general source dataset. The proposed model was then evaluated on a target dataset with varying numbers of frozen layers to determine its performance on new data.

3. Materials and Methods

In this study, we adhered to the following workflow: first, time-domain samples containing six-channel sensor readings were preprocessed using the CWT. Transform configurations with different mother wavelets and scale values were considered, resulting in the generation of eight scalogram sets. This operation was performed on both the source KU-HAR dataset and the target UCI-HAPT dataset. In addition, the UCI-HAPT dataset was preliminary preprocessed so that the sample size was identical to that of the KU-HAR dataset.
Second, the generated scalograms were used to evaluate nine popular CNN architectures, yielding 72 possible combinations. In this study, the following network architectures were considered: DenseNet121, DenseNet169, DenseNet201, ResNet50, ResNet101, ResNet152, Xception, InceptionV3, and InceptionResNetV2. The mentioned architectures were selected because they are among the most popular [53], with proven performance and ready-to-use implementations in most ML and AI software packages. It is important to note that the Xception, InceptionV3, and InceptionResNetV2 architectures have constraints on the input sample shape; therefore, scalograms with scale values less than 128 could not be utilized, resulting in a total of 60 feasible combinations tested. Each combination was tried five times to avoid the problem of suboptimal local minima, resulting in the training and evaluation of over 300 models. From the evaluated models, the best-performing combination of the network architecture and CWT parameters was then chosen. Classification accuracy was chosen as the criterion for model selection, as we consider all classes equally important for classification and it is the most intuitive metric for selecting a model from a group of comparable models. For the selected model, we provide other commonly used metrics, such as precision, recall, AUC, and F1-score.
Third, the selected pre-trained model was evaluated with different numbers of frozen layers on the scalograms generated from the target UCI-HAPT dataset. The whole UCI-HAPT dataset and its subset were used to determine how the selected model performs on the target datasets of various sizes. The obtained results were then compared to the non-pre-trained control model with the same network architecture and input shape.
During the model selection and model testing, 70% of the respective datasets were randomly selected for training and 30% for testing. For validation, 10% of the training subsets were used. We used the Adam optimizer with the initial learning rate set to 1 10 3 and the categorical cross-entropy loss function. Additionally, the callback that decreases the learning rate when the loss function stops improving (i.e., ReduceLROnPlateau) was employed. During model pre-training, the number of epochs was set to 50. During fine-tuning and testing, this number was set to 100 for most models; however, it was increased to 120 for some models because of observed underfitting.

3.1. Employed Datasets

In this study, two state-of-the-art time-domain HAR datasets were employed. The Khulna University Human Activity Recognition (KU-HAR) dataset [54,55] was chosen as the source dataset and was used for model selection and pre-training. The University of California Irvine Human Activities and Postural Transitions (UCI-HAPT) dataset [12,56] was chosen as the target dataset and was used for testing and fine-tuning the selected model.

3.1.1. KU-HAR Dataset

The KU-HAR dataset [54] was utilized for model selection and pre-training. It was released in 2021 and includes 20,750 non-overlapping time-domain samples from 18 classes, namely: stand, sit, talk-sit, talk-stand, stand-sit, lay, lay-stand, pick, jump, push-up, sit-up, walk, walk backwards, walk-circle, run, stair-up, stair-down, and table tennis. The sensor signals were collected from 90 volunteers aged 18 to 34 using a waist-attached smartphone and contain raw signals from a triaxial accelerometer and gyroscope. Each sample lasts 3 s and consists of six channels collected at a sampling rate of 100 Hz using a smartphone.
During data acquisition, the gravitational acceleration was discarded, and neither denoising nor filtering was performed. KU-HAR is regarded as a realistic dataset, as it is an unbalanced dataset with no overlap between the samples and no denoising operations performed.

3.1.2. UCI-HAPT Dataset

The UCI-HAPT dataset [12] was used as a benchmark for the selected pre-trained model. It was published in 2014 and is an expanded version of the University of California Irvine Human Activity Recognition (UCI-HAR) dataset [57], supplemented with postural transitions. A waist-mounted smartphone with a triaxial accelerometer and gyroscope at the sampling rate of 50 Hz was used to collect the data from 30 volunteers aged 19–48. UCI-HAPT contains data for 12 activities, namely: walking, walking upstairs, walking downstairs, sitting, standing, laying, stand-to-sit, sit-to-stand, sit-to-lie, lie-to-sit, stand-to-lie, and lie-to-stand, 6 of which do not belong to the KU-HAR dataset.
The dataset contains 10,929 samples of 561-feature vectors with time and frequency domain variables, as well as unsampled 6-channel sensor readings. The median and low-pass Butterworth filters were utilized to perform signal denoising. In this study, we did not use the supplied feature vectors, but manually obtained the time-domain samples from the row sensor readings.
One of the requirements of TL is that the sample shape of the source and target datasets must be identical. To fulfil this requirement, we preprocessed the UCI-HAPT dataset with the following procedures: first, the sampling rate of the raw sensor readings was increased from 50 to 100 Hz by inserting the average value between two adjacent points. Second, we extracted the time-domain samples using a non-overlapping 3-s windowing technique, yielding 4847 six-channel time-domain samples.
To evaluate the performance of the selected model on target datasets of varying sizes, we utilized the entire preprocessed UCI-HAPT dataset and its subset, which contained 30% of randomly selected samples, totaling 1652. Figure 1 illustrates the class distributions of the whole preprocessed UCI-HAPT dataset and its subset.
As can be seen from Figure 1, the preprocessed UCI-HAPT dataset and its subset are imbalanced. Because the sensor readings in the UCI-HAPT dataset were denoised using low-pass Butterworth and median filters and the sampling rate was artificially doubled, it can be stated that the UCI-HAPT target dataset has significant differences in terms of signal representation from the source KU-HAR dataset. This implies that if the selected pre-trained model performs positive knowledge transfer to the UCI-HAPT target dataset, it would be reasonable to use the proposed model for other time-domain data with similar distinctions. It would be beneficial, for example, for cross-position activity recognition problems where the sensor readings are gathered from different body parts.

3.2. Scalogram Generation

The continuous wavelet transform (CWT) of a function x t can be defined by the following integral:
X ω a , b = 1 a 1 / 2 + x t ψ ¯ t b a d t ,
where ψ t is called a mother wavelet, which is a continuous function in both the time and frequency domains; a is called a scale value, a > 0 ,   a + ; and b is called a translational value, b . The operation of the complex conjugate is represented by an overline.
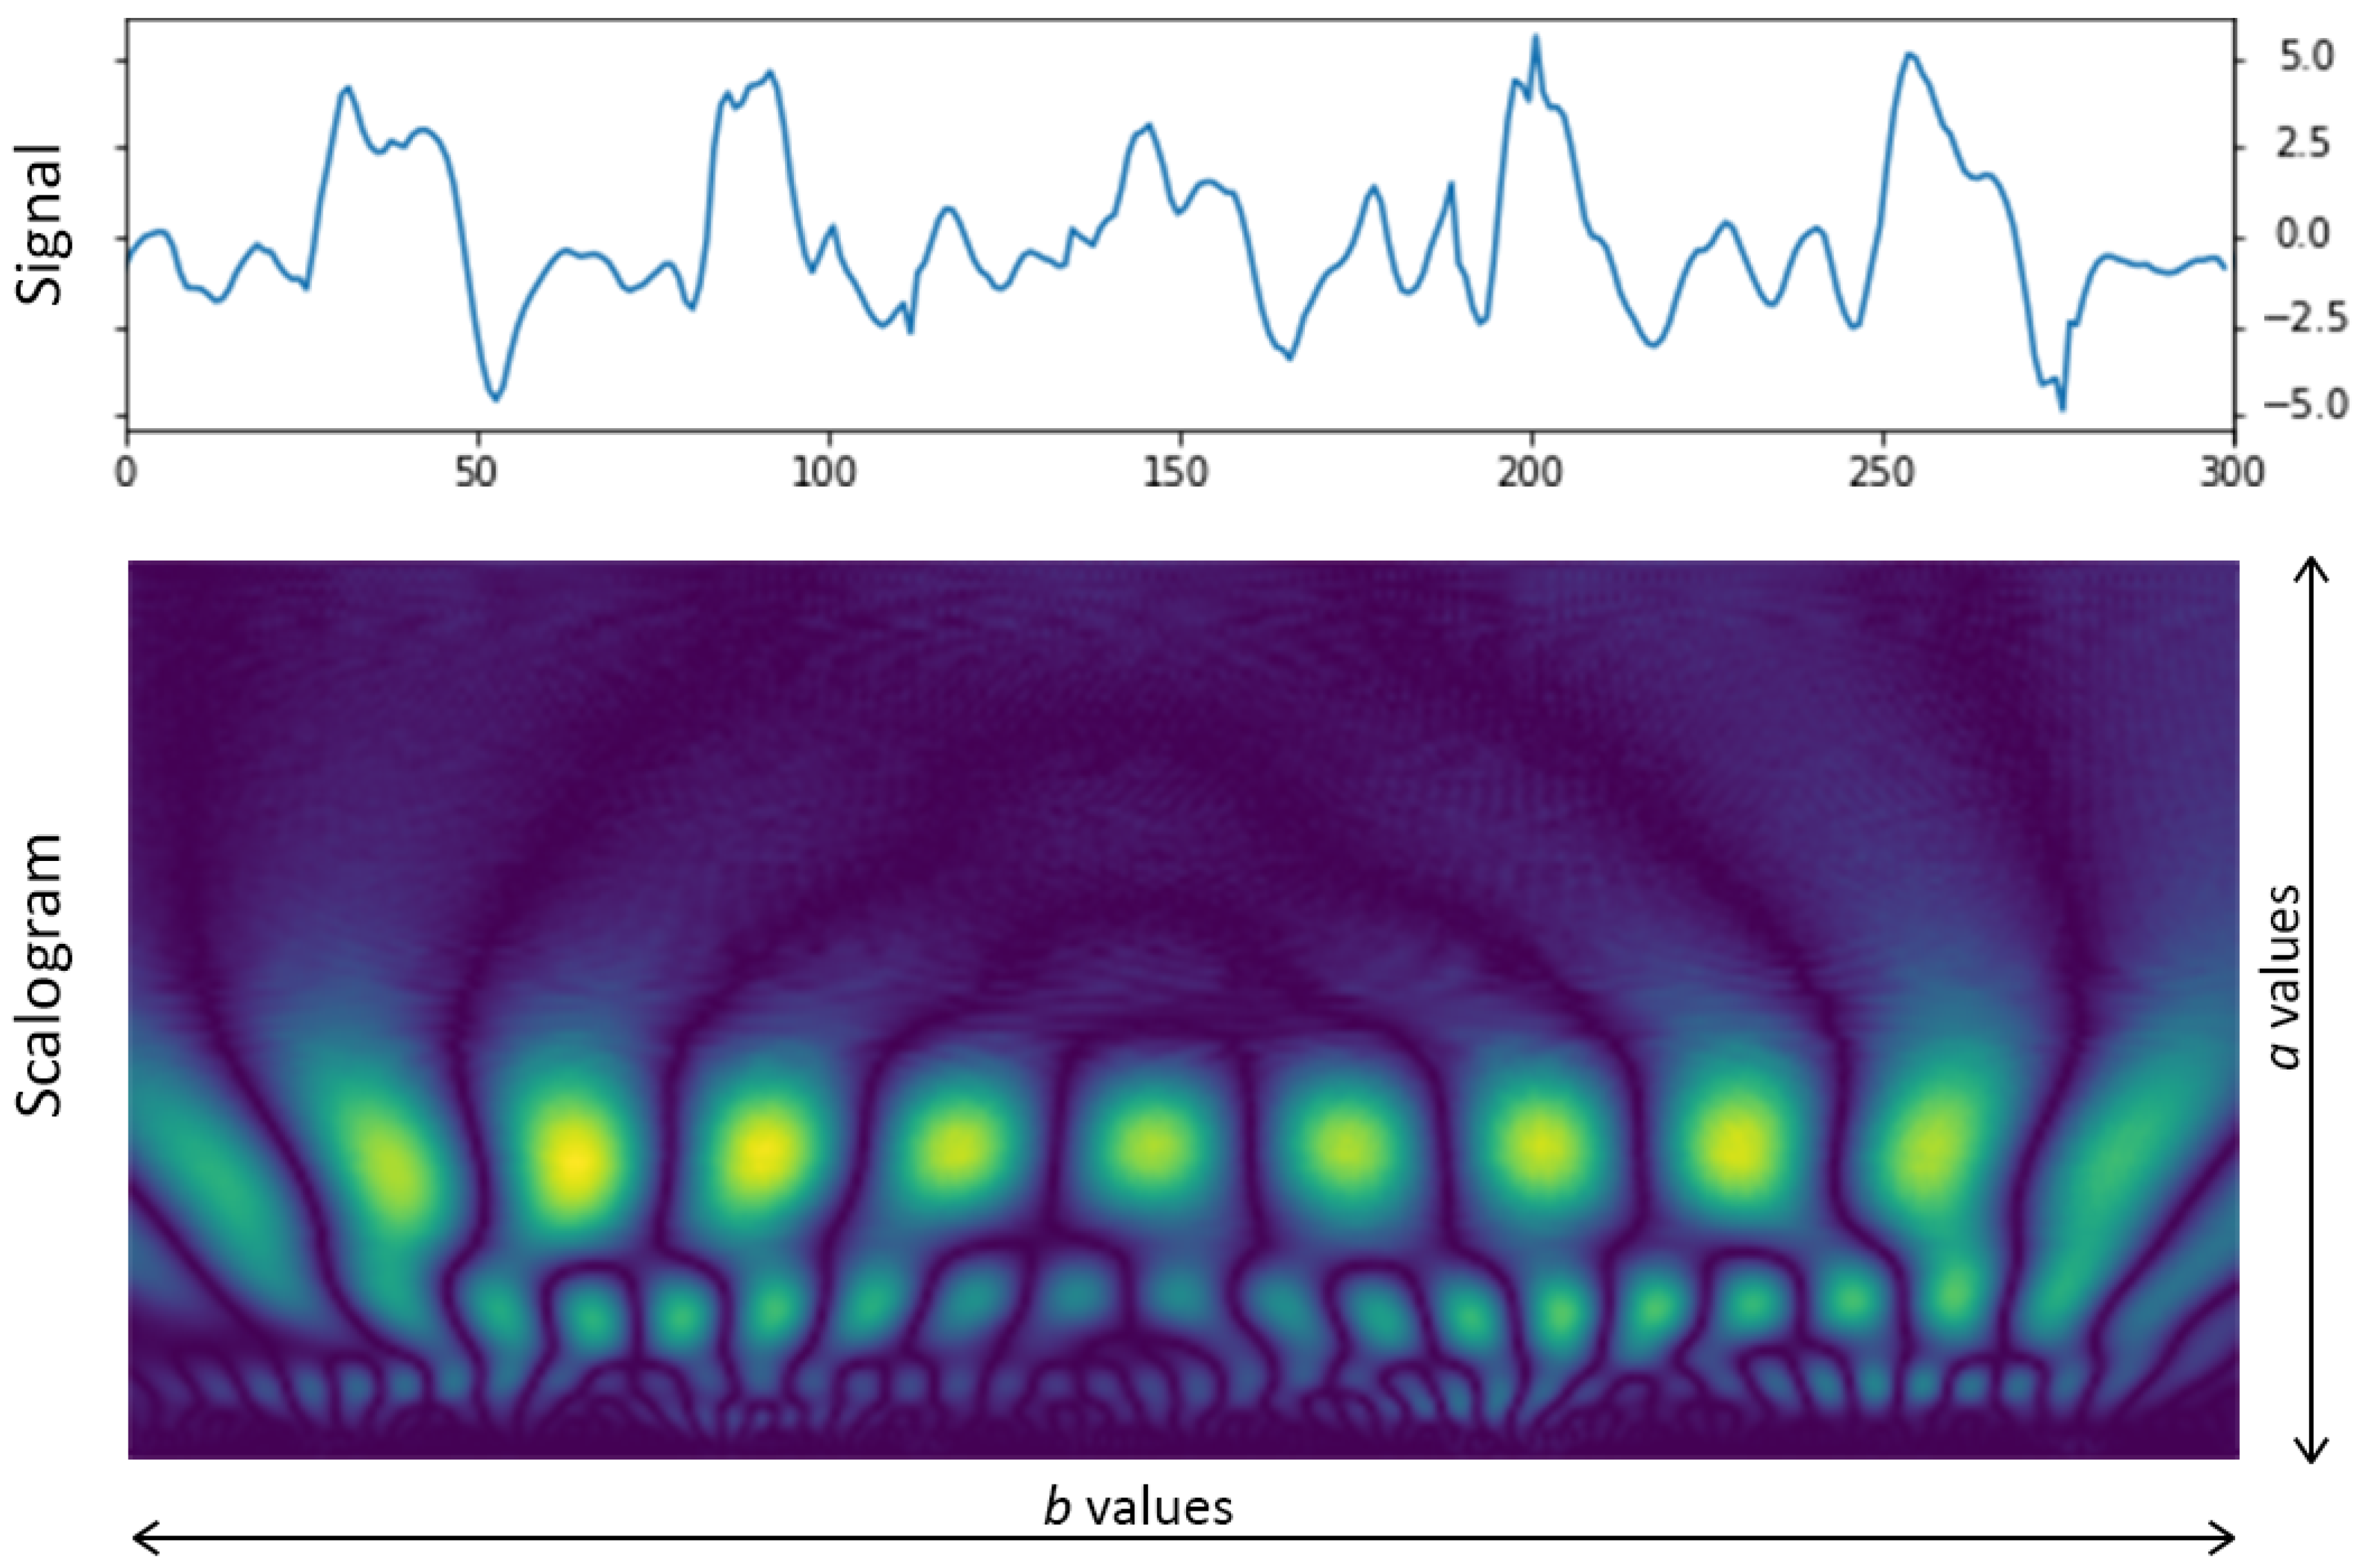
The results of the CWT can be represented as a heat map, also known as a scalogram, by placing the a -values along the y-axis, the b -values along the x-axis, and the intensity of each point determined by (1). Figure 2 demonstrates a transformed accelerometer x-axis signal from the KU-HAR dataset. The parameters of the illustrated transform are the Morlet mother wavelet and scale values from 0 to 128.
The CWT has a number of advantages over Fourier-related transforms, which are commonly used in HAR problems for feature extraction. First, it provides a more accurate representation of signals with sharp spikes and breaks, which are typical in wearable sensor signals and are often important characteristics for activity classification. Second, CWT overcomes the issue of the nonstationary nature of the signals by simultaneously representing temporal and local spectral information. Consequently, it is reasonable to employ the wavelet transform in HAR-related problems as a powerful technique for frequency and time domain feature extraction.
To improve the models’ accuracy and mitigate the overfitting and underfitting problems that frequently arise during pre-training and fine-tuning, we used various scalogram sets generated using CWT. The parameters considered for the CWT are the scale values ranging from 0 to 32, 64, 128, and 256 using Mexican hat and Morlet mother wavelets. Thus, the performance of the models was evaluated using eight CWT configurations.

3.3. Knowledge Transfer and Model Testing

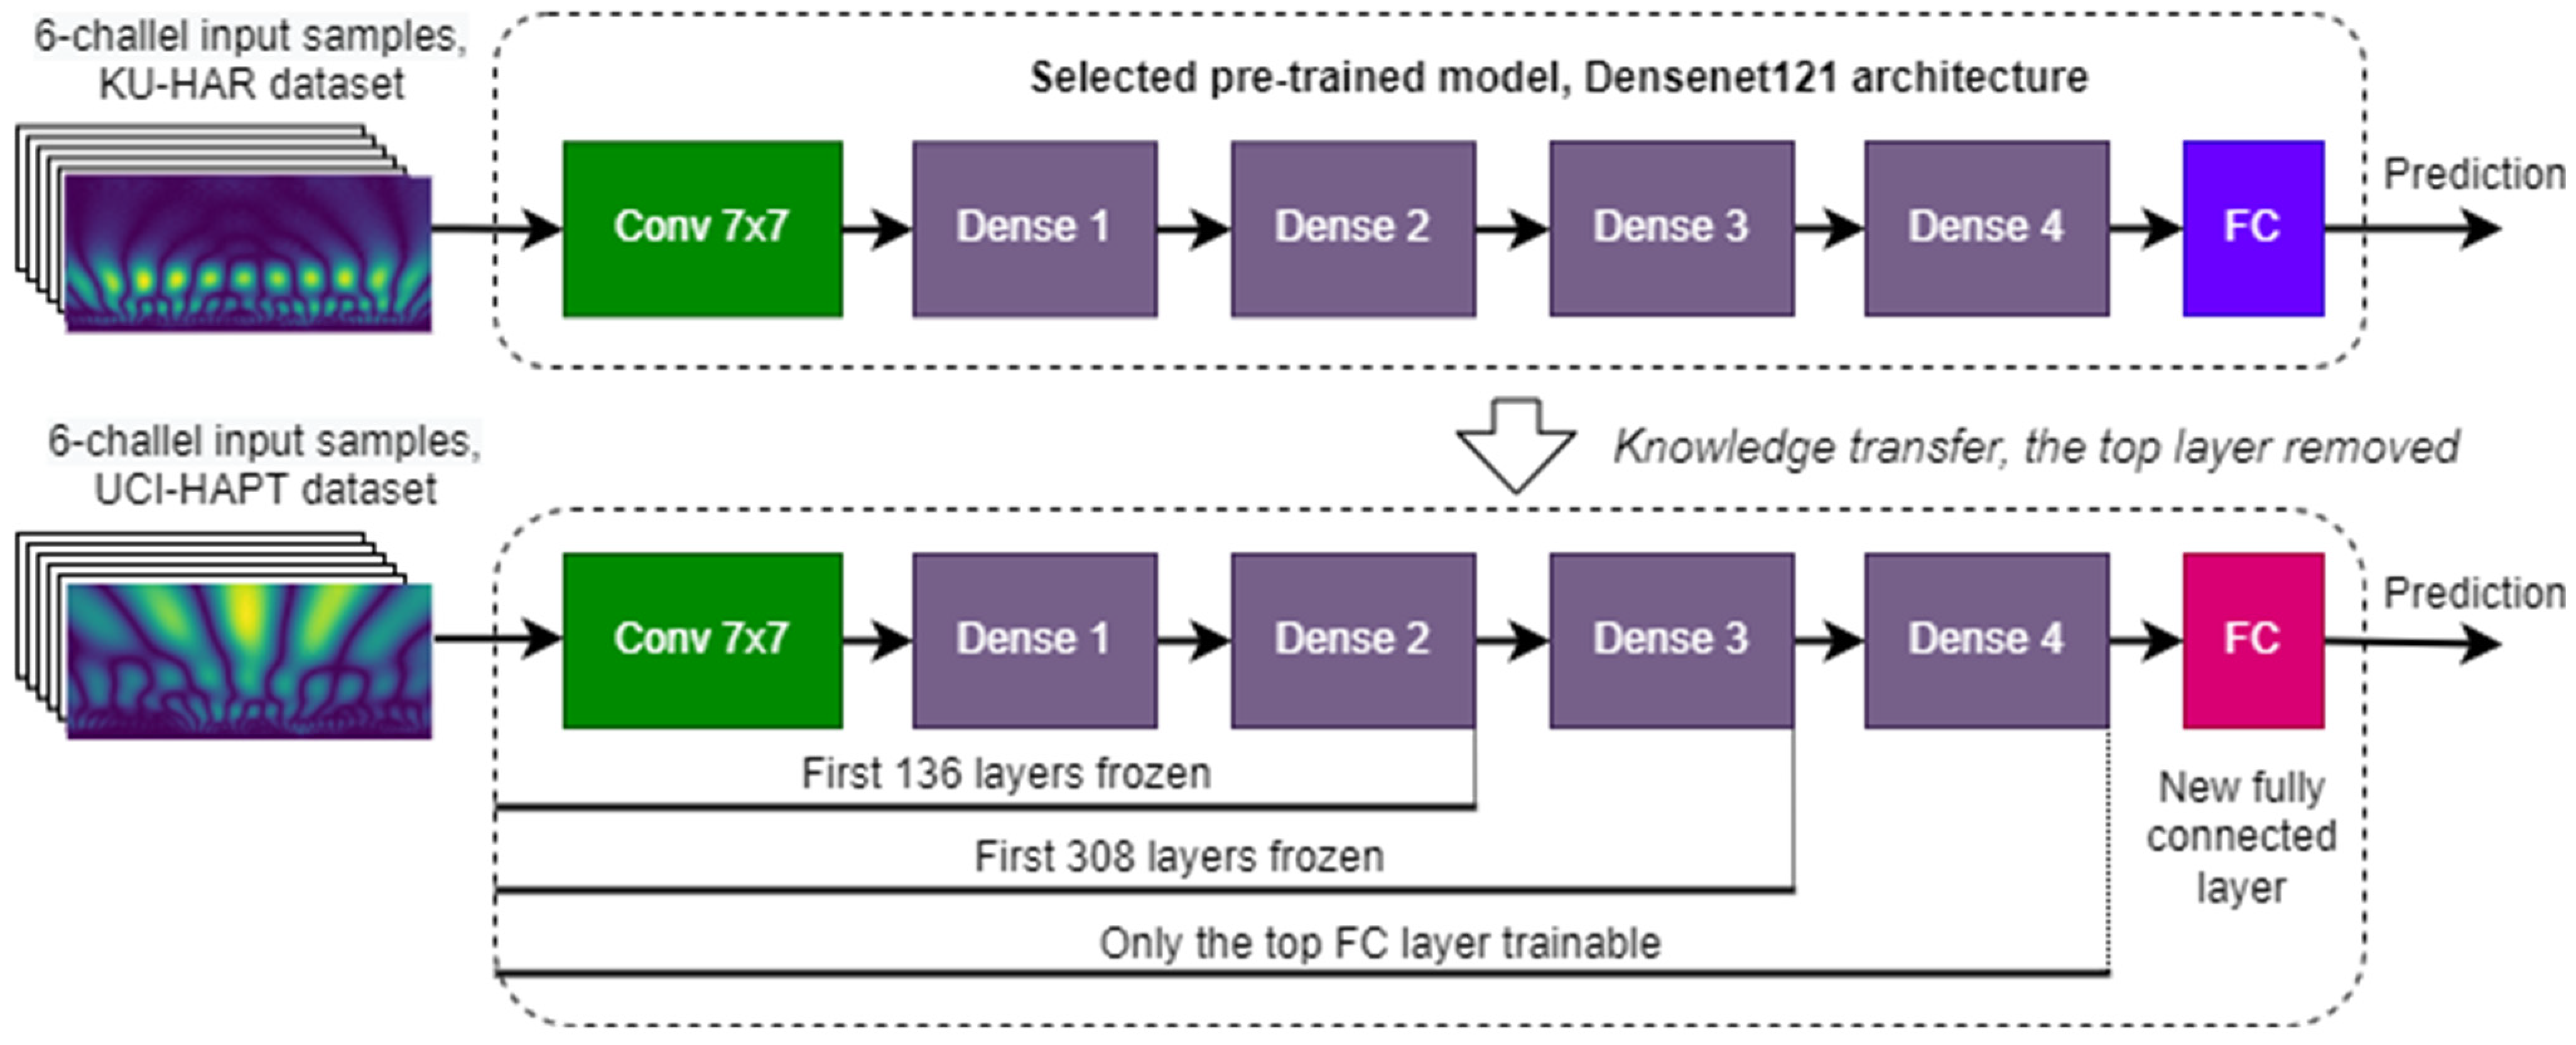
The TL was performed according to the following workflow: first, the top fully connected (FC) layer of the selected pre-trained model was removed and replaced with a new one. The number of neurons in the new FC layer corresponds to the number of classes in the target dataset (12 in the UCI-HAPT dataset), and the weights were set using the Glorot uniform initializer. Second, the performance of the model was evaluated by fine-tuning it on the preprocessed UCI-HAPT dataset and its subset with varying numbers of frozen layers.
Layer freezing is a commonly employed technique in TL for overcoming the overfitting problem. The number of layers to freeze typically depends on how similar the source and target datasets are. If the datasets are comparable, it may be sufficient to freeze all the network layers except the top FC layer. Therefore, more layers of the pre-trained network must be trainable during fine-tuning as the diversity of the datasets increases.
In this work, the number of frozen layers was picked in accordance with the architecture of the chosen model. As discussed in the later sections, the selected model has the DenseNet121 architecture, which consists of a conv block, four dense blocks, and an FC layer. Hence, the following configurations were considered: only the top FC layer is trainable; the first 308 layers are frozen (conv, dense 1, dense 2, and dense 3 blocks); the first 136 layers are frozen (conv, dense 1, dense 2 blocks); and all the layers are trainable. The described methodology is illustrated in Figure 3.

4. Results

This section outlines the experimental outcomes obtained using the methods described in the preceding section. First, we describe the results of the model selection procedure and the classification results of the selected model on the KU-HAR source dataset. Second, the selected pre-trained model is evaluated using scalograms generated from the preprocessed UCI-HAPT target dataset and its subset. The performance of the model was assessed with various numbers of frozen layers to estimate how their presence impacts the classification results for diverse target dataset sizes.

4.1. Model Selection Results

We evaluated nine network architectures using eight scalogram sets generated from the KU-HAR dataset. To avoid the suboptimal local minima problem, each of the 60 possible combinations was attempted five times, resulting in the training of 300 models. Table 1 contains the highest classification accuracy achieved in five attempts for each combination.
As can be observed, the combination of the DenseNet121 architecture, Morlet mother wavelet, and the scale value ranging from 0 to 256 achieved the highest classification accuracy of 97.48%. Hence, this model will be considered the selected one. Table 2 contains metrics of the classification performed using the selected model.
It can be observed that the F1-score, unaffected by dataset imbalance, is relatively close to the accuracy value, indicating the reliability of the classification results of the proposed model. Given that the KU-HAR is a realistic dataset (i.e., an unbalanced dataset with no denoising performed), we consider the performance of the proposed model to be rather promising. Figure 4 is a box plot depicting the classification accuracy results of five tries for each tested combination.
As shown in Figure 4, the dispersion of accuracy values highly depends on the architecture and CWT configuration chosen. Nevertheless, it is observable that the ResNet101 and ResNet150 are more prone to accuracy scattering. For instance, the difference between the highest and lowest accuracy achieved in five tries for the ResNet101 architecture and the Morlet 32 CWT configuration is 1.88%. At the same time, the accuracy “window” for the selected model is only 0.18%, which indicates the stability and dependability of the proposed combination.
Considering the selected model architecture, the DenseNet (Densely Connected Convolutional Network) was proposed in [58]. Within a dense block, each layer is connected to every other layer in a feed-forward manner that encourages feature reuse, mitigates the vanishing gradient problem, reduces the number of parameters, and enhances feature propagation. DenseNets are frequently used for magnetic resonance imaging (MRI) analysis [59,60], radiology image classification [61,62], and cancer image detection [63]; however, few studies have employed DenseNet-based models in the sensor-based HAR domain [64,65]. Furthermore, in these works, the models were trained on 1D input data, which may have hindered the model’s performance, given that the DenseNet architecture was designed for image classification. In this study, the DenseNet121 architecture, which is DenseNet with 121 trainable layers, yielded the best results when trained on the Morlet-256 configurations, outperforming the ResNet and InceptionNet-based models, which indicates the potential of the DenseNet-based models to address the HAR problems and perform the 2D transformed signals classification.
Considering the CWT configuration, using a scalogram set with the Morlet wavelet and the scale values from 0 to 256 resulted in the best model performance, indicating that the usage of the Morlet wavelet may represent the wearable sensors’ signals more accurately than the commonly used Mexican hat. However, it was observed that the Morlet wavelet requires a broader scale value range to represent low-frequency signal characteristics than the Mexican Hat wavelet, whose classification results are not significantly affected by a change in the scale value range.
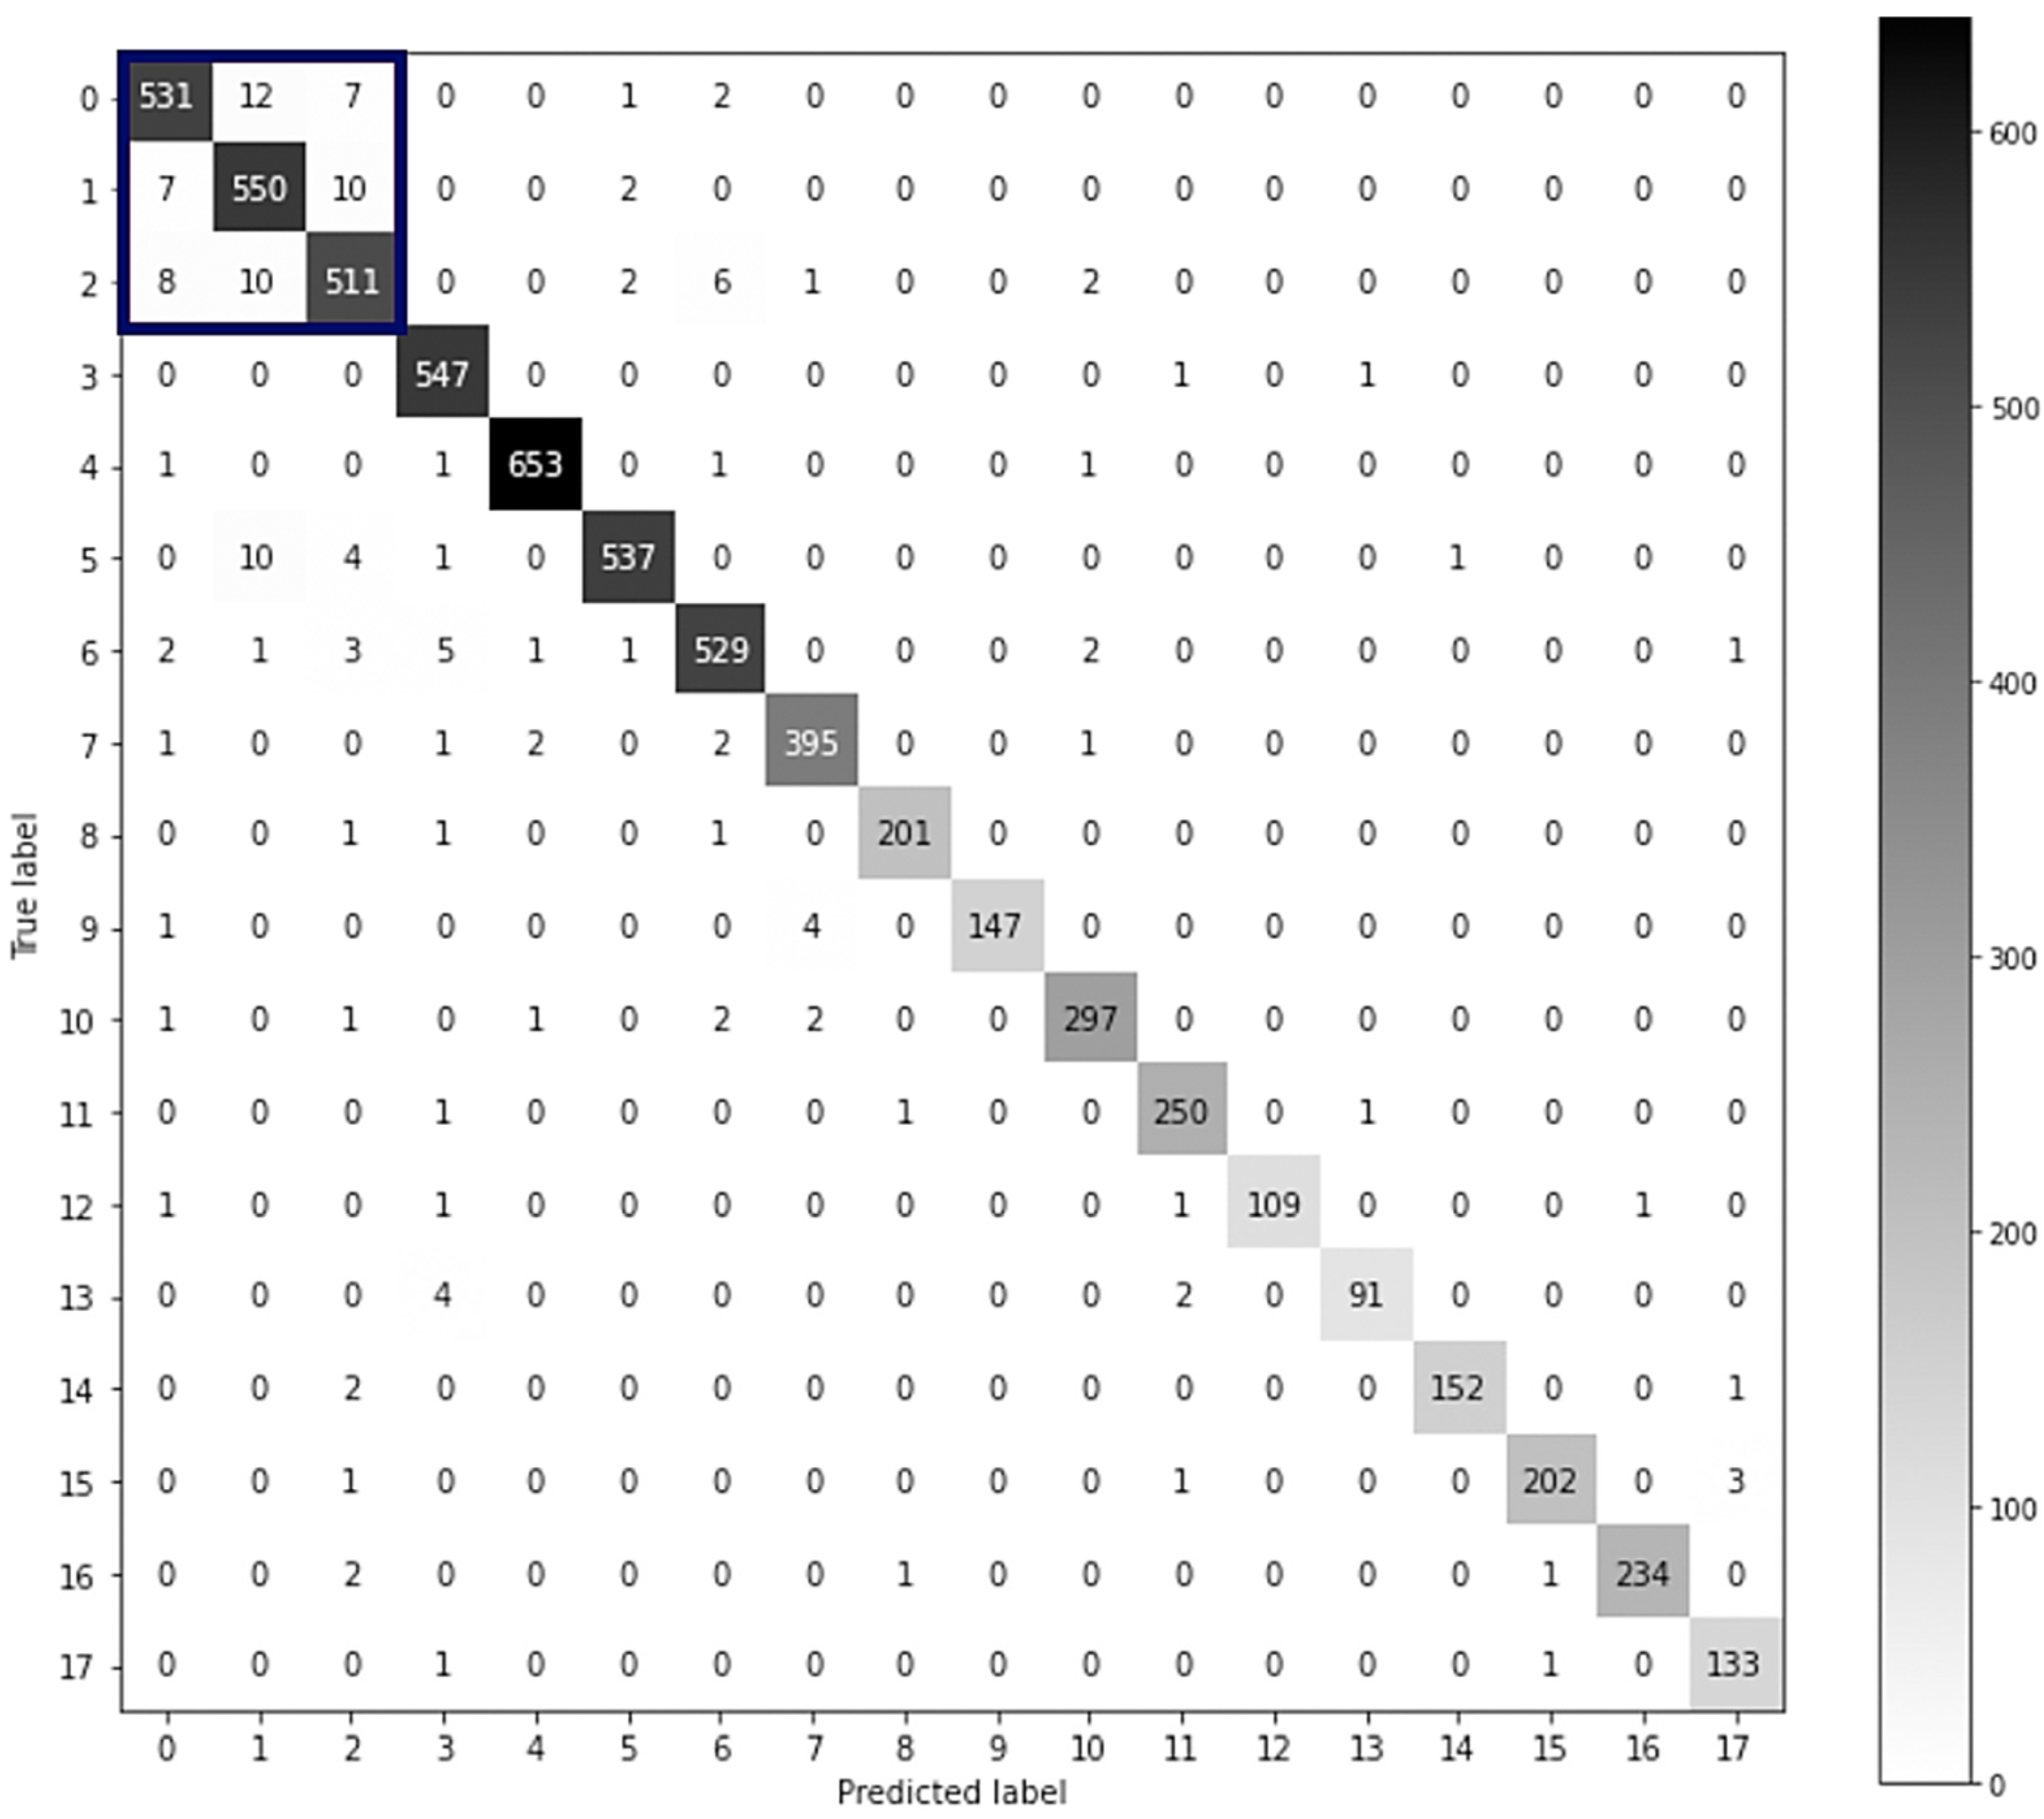
Figure 5 depicts the confusion matrix of the classification conducted using the selected model.
As seen in Figure 5, the cluster of classification errors consists of the classes stand, sit, and talk-sit. All of these classes represent static activities, which are difficult to differentiate. Therefore, the construction of HAR classification models that consider such static activities separately is a promising area for future research and can significantly improve classification accuracy.

4.2. Model Testing Results

The whole UCI-HAPT dataset and its subset were used for assessing the performance of the selected pre-trained model. The subset consists of 30% of randomly selected samples from the preprocessed UCI-HAPT dataset. Configurations with various numbers of frozen layers were considered, namely, only the top layer trainable, the first 308 layers frozen, the first 136 layers frozen, and all layers trainable. Table 3 compares the best classification results achieved in five attempts obtained by the pre-trained and non-pre-trained models.
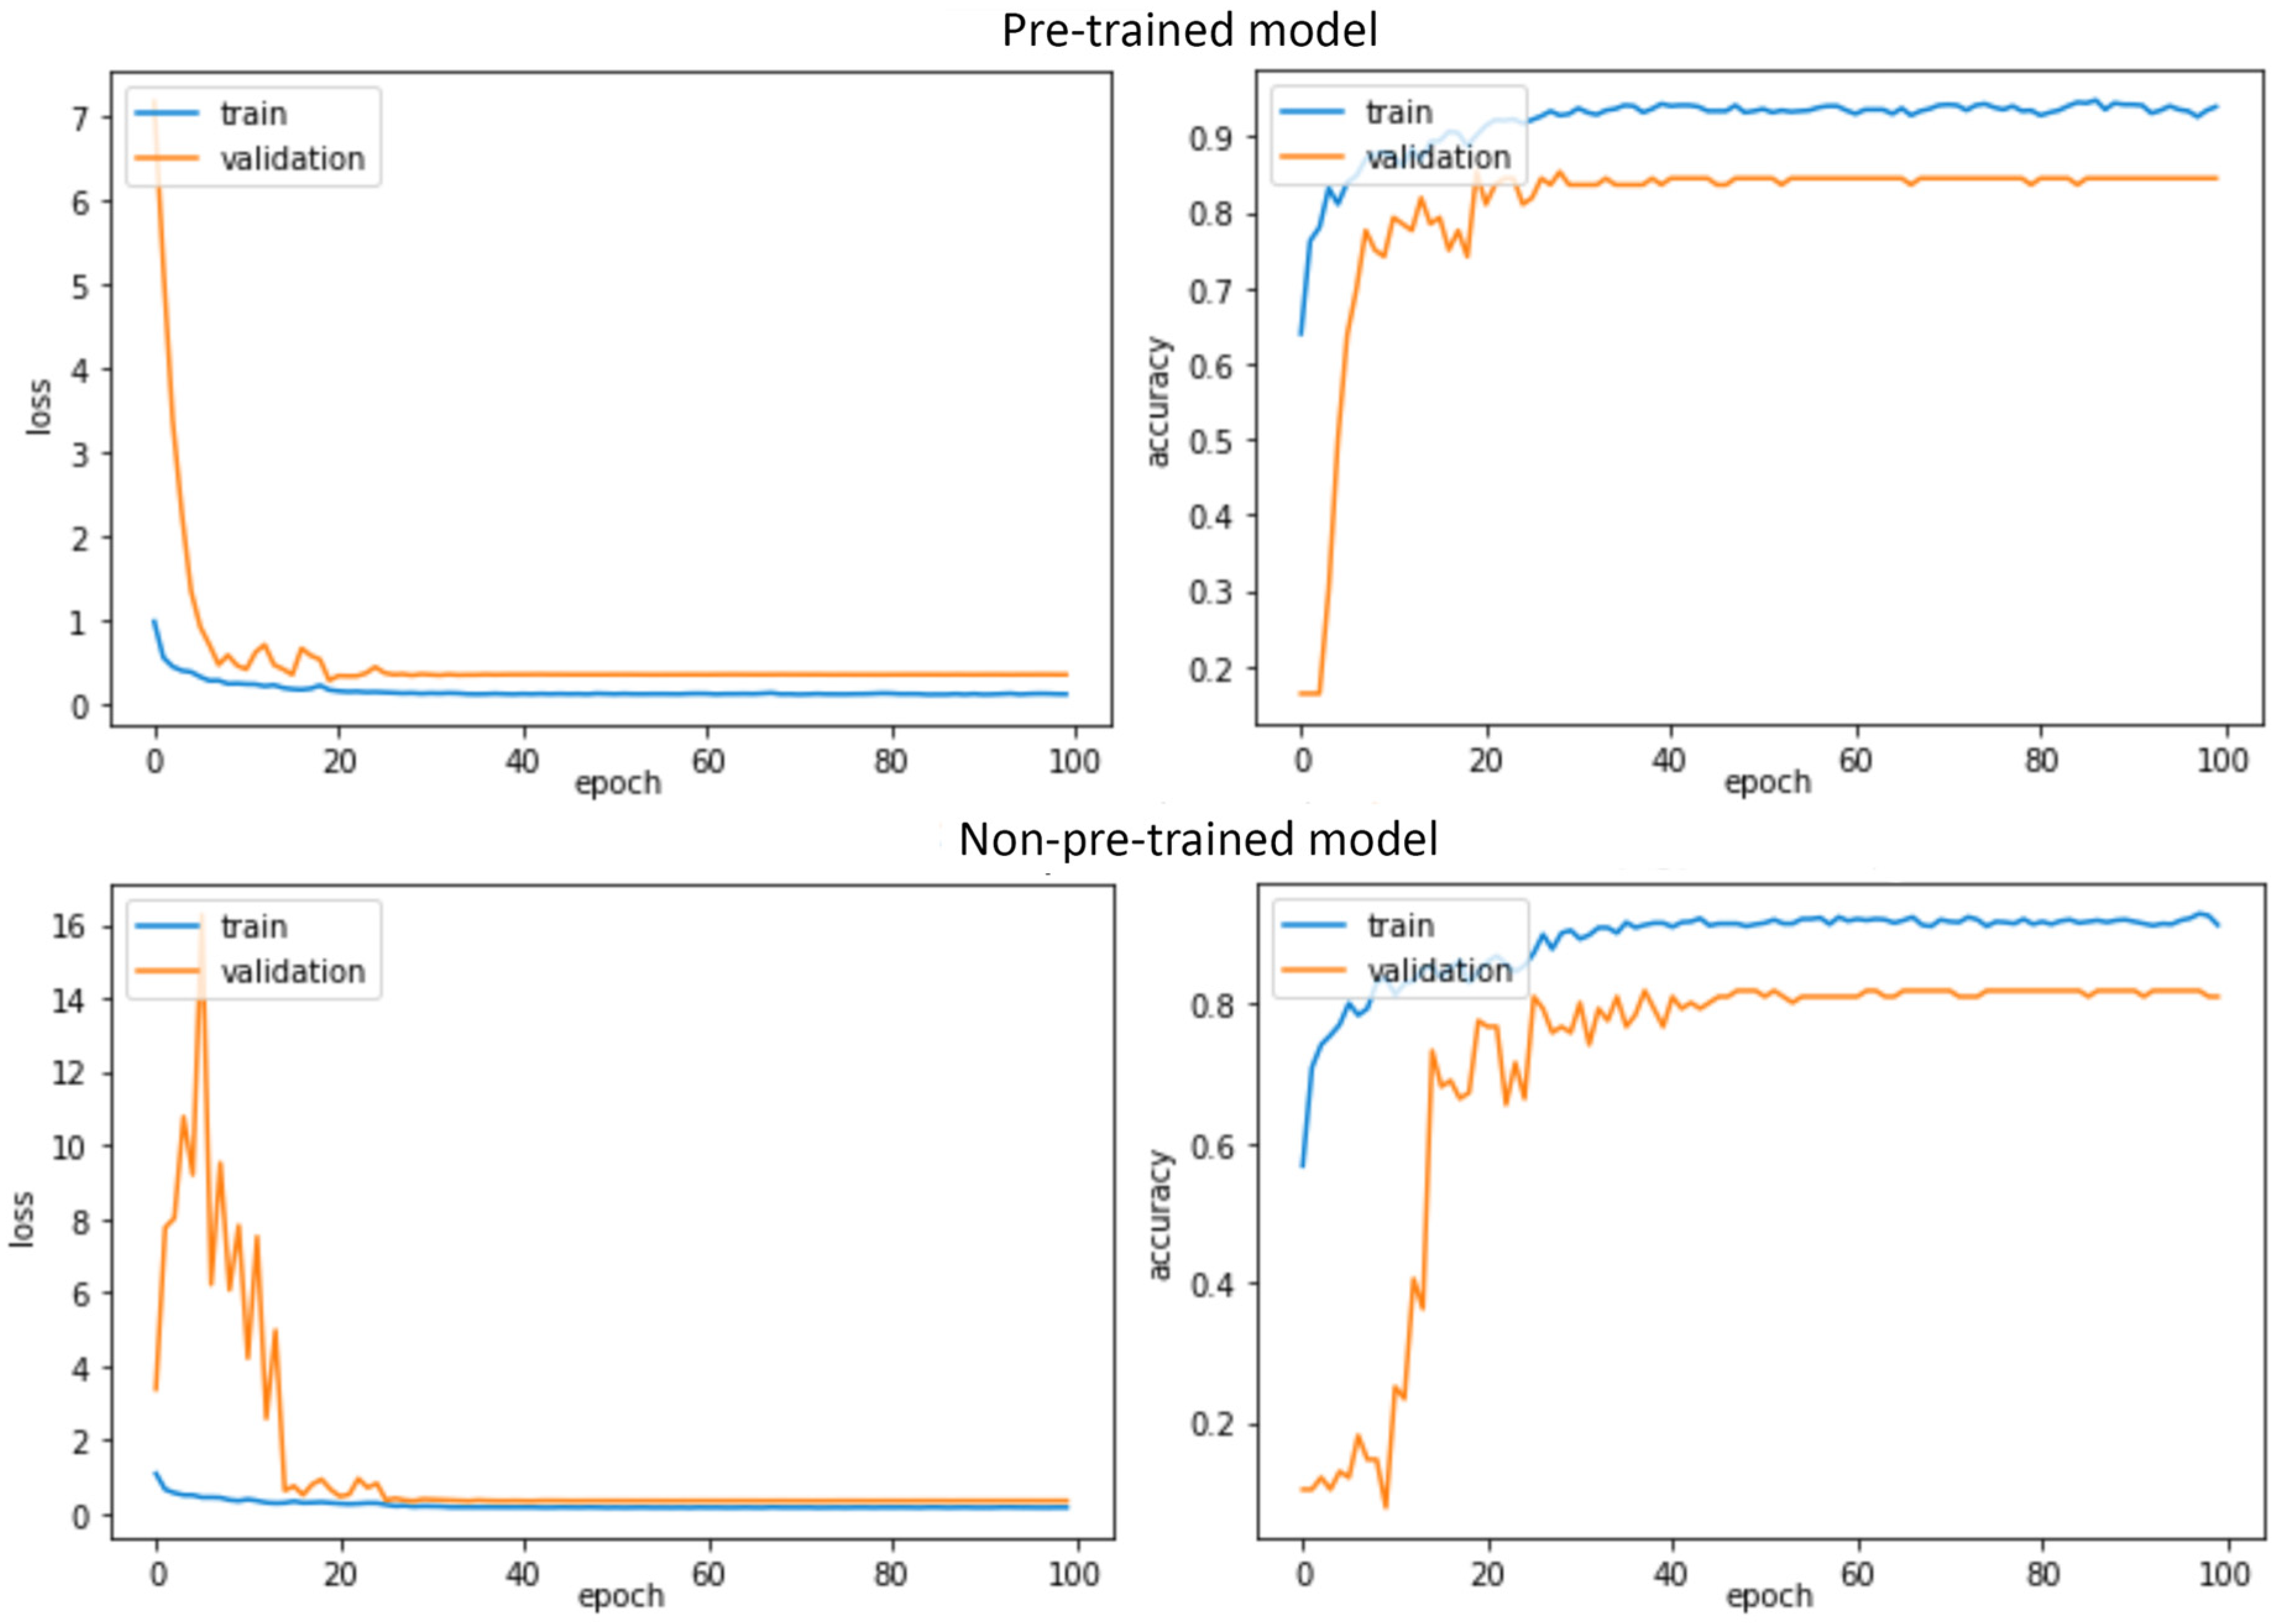
As seen in Table 3, model pre-training led to superior classification accuracy in both the preprocessed UCI-HAPT dataset and its subset. Concerning the whole target dataset, the usage of the pre-trained model led to a maximal accuracy and F1 increase of 0.21% and 0.33% using 308 layers of freezing, respectively. For other configurations, however, pre-training resulted in a decreased performance. This indicates that the preprocessed UCI-HAPT dataset is sufficiently large to potentially degrade the performance of the pre-trained model and result in a negative transfer. Concerning the UCI-HAPT subset, all pre-trained models, with the exception of the one with the only top trainable, produced superior results compared to the control model. Usage of the pre-trained model with 136 frozen layers led to the highest performance increases of 2.82% and 2.89% for classification accuracy and F1, respectively. Figure 6 illustrates the typical progress of the accuracy and loss metrics during the training of the raw DenceNet121 and the pre-trained models.
It can be seen in Figure 6 that the process of gradient descent of the pre-trained model is more stable compared to the non-pre-trained model, which can be observed in the advancement of the validation loss value. In Figure 6, for instance, the non-pre-trained model reaches the “stable point” after approximately 50 epochs. At the same time, about 30 epochs are enough for the pre-trained model. As a result, the usage of the proposed model results in faster learning compared to the control model.

5. Discussion

Figure 7 represents the classification results obtained during the model selection (Table 1) in the form of a radar chart. The configurations of CWT are notated as <Mother wavelet> <maximal scale value> (for example, “Morlet 32”).
Observably, most models trained on the CWT configuration with the Morlet wavelet and the scale value from 0 to 256 performed better than models trained on other CWT configurations. The exceptions are models with the InceptionResNetV2 and Xception architectures, which produced the best results when trained using the Morlet 128 and Mexican Hat 128 configurations, respectively.
The lowest results were produced by models trained on the Morlet 32 configuration, indicating that scale values from 0 to 32 are insufficient for the Morlet-based CWT to represent low-frequency signal characteristics. Therefore, the Morlet wavelet with the scale value from 0 to 256 can be regarded as the optimal CWT configuration for wearable-based signal classification using DL models. Regarding the network architecture, in addition to the DenseNet121, models with the DenseNet169, DenseNet201, and Xception architectures also produced high results. In contrast, the InceptionV3, InceptionResNetV2, and ResNet-based architectures seem unsuitable for the classification of CWT-transformed wearable sensor signals.
Table 4 compares the results obtained with the KU-HAR dataset in recent state-of-the-art works. As can be noticed, the proposed pre-trained model outperformed the majority of state-of-the-art studies that employed the KU-HAR dataset. This fact verifies the effectiveness of the selected model and the potential of the strategy of employing CWT-generated scalograms together with CNNs to address wearable sensor-based HAR classification problems.
In [66], the authors used the “vector point of three axes” and “absolute distance” feature selection techniques on the KU-HAR dataset, which significantly reduced the dimension of the input sample. Then, the RF classifier was utilized, resulting in maximal accuracy and F1 values of 89.5% and 80.67%, respectively. Using the proposed dimension reduction techniques resulted in faster learning, but the classification accuracy decreased significantly compared to the original dataset. In [54], the authors aimed to demonstrate the classification capabilities of the proposed KU-HAR dataset. Utilizing the fast Fourier transform (FFT) for feature extraction and the RF algorithm for classification resulted in the recall, precision, and F1 values of 84.7%, 90.7%, and 87.7%, respectively, as well as more explicit clustering on the t-SNE graph. The authors of [41] used an adaptive DL model with a convolutional layer and gated recurrent unit (GRU). The KU-HAR and HHAR datasets were investigated using the inter-domain activity analysis with the Wasserstein metric criteria for the “activity representatives” and “activity followers” selections. On the KU-HAR dataset, this method yielded an average F1-score of 94.25%; the average classification accuracy was not provided. In [11], the authors used the RF, Gradient Boost, XGBoost, CatBoost, and LightBoost algorithms for the KU–HAR dataset activity classification. The wavelet package transform was used for feature extraction, and the genetic algorithm was used for feature selection. The best results were achieved using the LightBoost classifier and the Haar mother wavelet, yielding accuracy, precision, recall, and an F1 score of 89.98%, 89.96%, 89.98%, and 89.67%, respectively. The authors of [19] employed a sequential deep learning model with 2D convolutional layers. Circular shifting was used to transform the 1D input samples from the KU-HAR dataset into a 2D matrix, which resulted in promising accuracy and the F1 score of 96.67% and 96.41%, respectively. Finally, in this study, the selected CWT-based model with the DenseNet121 architecture, Morlet wavelet, and the scale value from 0 to 256 achieved the highest classification accuracy and an F1 score of 97.48% and 97.52%, respectively.
Despite its performance, the proposed approach has certain limitations related to computational resources. First, the generation of scalograms using CWT is more computationally expensive and requires significantly more memory than the usage of 1D time domain signals, which is especially problematic when pre-training or fine-tuning on massive datasets. Nevertheless, the proposed model is intended for fine-tuning on relatively small datasets, so it should not be a major concern. Secondly, due to memory and computational resource constraints, the deep 2D CNN may be too computationally expensive for use in embedded systems and intelligent wearable devices, such as smartphones, smartwatches, and fitness bracelets. Nevertheless, cloud computing and distributed computing can significantly mitigate the aforementioned problems.
Summarizing the information discussed in this section, it can be claimed that the usage of the proposed pre-trained model, especially with layer freezing, results in a more stable gradient descent, faster training, and improved performance on small datasets. However, the usage of the pre-trained model with datasets of medium and large sizes may result in an accuracy decrease and, therefore, a negative transfer.
In this study, a general case of research was conducted. The proposed methods and models can be used, for example, to recognize repetitive movements of production personnel in enterprises. Therefore, it is anticipated that future research will expand the recognition of personnel movements, such as component assembly while seated, collaborative robot assembly operations while standing, and personnel position changes.

6. Conclusions and Future Work

In this study, we propose a novel pre-trained model targeted specifically for sensor-based HAR problems. To perform the model selection, nine popular CNN architectures were tested using eight CWT-generated scalogram sets. As a result, 60 possible combinations and over 300 models were trained and evaluated. We performed the analysis of the impact of CWT parameters, such as mother wavelet and scale values, on the performance of network architectures.
It was determined that the model with the DenseNet121 architecture, Morlet mother wavelet, and scale values ranging from 0 to 256 produced the best results on the target KU-HAR dataset. The classification accuracy and F1 score of the selected model reached 97.48% and 97.52%, respectively, outperforming the majority of state-of-the-art works employing this dataset.
The selected model was tested using the UCI-HAPT dataset and its subset to determine its performance on target datasets of varying sizes and with substantial differences from the source dataset. Usage of the proposed model resulted in a maximal accuracy and F1 score increase of 0.21% and 0.33%, respectively, on the entire UCI-HAPT dataset and 2.82% and 2.89%, respectively, on the subset compared to the non-pre-trained models.
It was concluded that the usage of the proposed model, especially with layer freezing, results in a more stable gradient descent, faster training, and improved performance on small datasets. However, the usage of the pre-trained model with datasets of medium and large sizes may result in an accuracy decrease and, therefore, a negative transfer.
In the upcoming studies, we intend to design and analyze heterogeneous pre-trained models using the gated recurrent unit (GRU) or long short-term memory (LSTM) layers. Additionally, the construction of models with the separated handling of static activities is promising, which may significantly increase the performance on sensor-based HAR data.

Author Contributions

Conceptualization, O.P.; methodology, M.M.; software, M.M.; validation, C.S.; formal analysis, M.M.; investigation, C.S.; resources, M.M.; data curation, O.P.; writing—original draft preparation, M.M.; writing—review and editing, O.P.; visualization, M.M.; supervision, O.P.; project administration, C.S.; funding acquisition, O.P. All authors have read and agreed to the published version of the manuscript.

Funding

This research was funded by the Polish–Ukrainian grant “Automated Guided Vehicles integrated with Collaborative Robots—energy consumption models for logistics tasks planning”, grant number 02/110/ZZB22/1022.

Data Availability Statement

All used datasets are publicly available and can be accessed using the provided references.

Acknowledgments

Open Access Funding by the University of Vienna.

Conflicts of Interest

The authors declare no conflict of interest.

References

  1. Subasi, A.; Radhwan, M.; Kurdi, R.; Khateeb, K. IoT Based Mobile Healthcare System for Human Activity Recognition. In Proceedings of the 2018 15th Learning and Technology Conference (L&T), Jeddah, Saudi Arabia, 25–26 February 2018; pp. 29–34. [Google Scholar] [CrossRef]
  2. Chen, K.-Y.; Harniss, M.; Patel, S.; Johnson, K. Implementing Technology-Based Embedded Assessment in the Home and Community Life of Individuals Aging with Disabilities: A Participatory Research and Development Study. Disabil. Rehabil. Assist. Technol. 2014, 9, 112–120. [Google Scholar] [CrossRef] [PubMed]
  3. Kulsoom, F.; Narejo, S.; Mehmood, Z.; Chaudhry, H.N.; Butt, A.; Bashir, A.K. A Review of Machine Learning-Based Human Activity Recognition for Diverse Applications. Neural Comput. Appl. 2022, 34, 18289–18324. [Google Scholar] [CrossRef]
  4. Chen, L.; Hoey, J.; Nugent, C.D.; Cook, D.J.; Yu, Z. Sensor-Based Activity Recognition. IEEE Trans. Syst. Man Cybern. Part C 2012, 42, 790–808. [Google Scholar] [CrossRef]
  5. Minh Dang, L.; Min, K.; Wang, H.; Piran, M.J.; Lee, C.H.; Moon, H. Sensor-Based and Vision-Based Human Activity Recognition: A Comprehensive Survey. Pattern Recognit. 2020, 108, 107561. [Google Scholar] [CrossRef]
  6. Lee, J.; Kim, D.; Ryoo, H.-Y.; Shin, B.-S. Sustainable Wearables: Wearable Technology for Enhancing the Quality of Human Life. Sustainability 2016, 8, 466. [Google Scholar] [CrossRef]
  7. Yilmaz, A.; Javed, O.; Shah, M. Object Tracking: A Survey. ACM Comput. Surv. 2006, 38, 13-es. [Google Scholar] [CrossRef]
  8. Plötz, T.; Hammerla, N.Y.; Olivier, P. Feature Learning for Activity Recognition in Ubiquitous Computing. In Proceedings of the IJCAI 2011-22nd International Joint Conference on Artificial Intelligence, Barcelona, Catalonia, Spain, 16–22 July 2011; pp. 1729–1734. [Google Scholar] [CrossRef]
  9. Li, F.; Shirahama, K.; Nisar, M.A.; Köping, L.; Grzegorzek, M. Comparison of Feature Learning Methods for Human Activity Recognition Using Wearable Sensors. Sensors 2018, 18, 679. [Google Scholar] [CrossRef]
  10. Shoaib, M.; Bosch, S.; Incel, O.D.; Scholten, H.; Havinga, P.J.M. A Survey of Online Activity Recognition Using Mobile Phones. Sensors 2015, 15, 2059–2085. [Google Scholar] [CrossRef]
  11. Abid, M.H.; Nahid, A.-A.; Islam, M.R.; Parvez Mahmud, M.A. Human Activity Recognition Based on Wavelet-Based Features along with Feature Prioritization. In Proceedings of the 2021 IEEE 6th International Conference on Computing, Communication and Automation (ICCCA), Arad, Romania, 17–19 December 2021; pp. 933–939. [Google Scholar] [CrossRef]
  12. Reyes-Ortiz, J.-L.; Oneto, L.; Ghio, A.; Samá, A.; Anguita, D.; Parra, X. Human activity recognition on smartphones with awareness of basic activities and postural transitions. In Proceedings of the Artificial Neural Networks and Machine Learning–ICANN 2014, Hamburg, Germany, 15–19 September 2014; pp. 177–184. [Google Scholar] [CrossRef]
  13. Hsu, Y.-L.; Lin, S.-L.; Chou, P.-H.; Lai, H.-C.; Chang, H.-C.; Yang, S.-C. Application of Nonparametric Weighted Feature Extraction for an Inertial-Signal-Based Human Activity Recognition System. In Proceedings of the 2017 International Conference on Applied System Innovation (ICASI), Sapporo, Japan, 13–17 May 2017; pp. 1718–1720. [Google Scholar] [CrossRef]
  14. Nematallah, H.; Rajan, S.; Cretu, A.-M. Logistic Model Tree for Human Activity Recognition Using Smartphone-Based Inertial Sensors. In Proceedings of the 2019 IEEE SENSORS, Montreal, QC, Canada, 27–30 October 2019; pp. 1–4. [Google Scholar] [CrossRef]
  15. Wu, W.; Dasgupta, S.; Ramirez, E.E.; Peterson, C.; Norman, G.J. Classification Accuracies of Physical Activities Using Smartphone Motion Sensors. J. Med. Internet Res. 2012, 14, e130. [Google Scholar] [CrossRef]
  16. Gu, J.; Wang, Z.; Kuen, J.; Ma, L.; Shahroudy, A.; Shuai, B.; Liu, T.; Wang, X.; Wang, G.; Cai, J.; et al. Recent Advances in Convolutional Neural Networks. Pattern Recognit. 2018, 77, 354–377. [Google Scholar] [CrossRef]
  17. Moya Rueda, F.; Grzeszick, R.; Fink, G.A.; Feldhorst, S.; ten Hompel, M. Convolutional Neural Networks for Human Activity Recognition Using Body-Worn Sensors. Informatics 2018, 5, 26. [Google Scholar] [CrossRef]
  18. Demrozi, F.; Pravadelli, G.; Bihorac, A.; Rashidi, P. Human Activity Recognition Using Inertial, Physiological and Environmental Sensors: A Comprehensive Survey. IEEE Access 2020, 8, 210816–210836. [Google Scholar] [CrossRef] [PubMed]
  19. Sikder, N.; Ahad, M.A.R.; Nahid, A.-A. Human Action Recognition Based on a Sequential Deep Learning Model. In Proceedings of the 2021 Joint 10th International Conference on Informatics, Electronics & Vision (ICIEV) and 2021 5th International Conference on Imaging, Vision & Pattern Recognition (icIVPR), Kitakyushu, Japan, 16–20 August 2021; pp. 1–7. [Google Scholar] [CrossRef]
  20. Mahmud, T.; Sazzad Sayyed, A.Q.M.; Fattah, S.A.; Kung, S.-Y. A Novel Multi-Stage Training Approach for Human Activity Recognition from Multimodal Wearable Sensor Data Using Deep Neural Network. IEEE Sens. J. 2021, 21, 1715–1726. [Google Scholar] [CrossRef]
  21. Shorten, C.; Khoshgoftaar, T.M. A Survey on Image Data Augmentation for Deep Learning. J. Big Data 2019, 6, 60. [Google Scholar] [CrossRef]
  22. Moradi, R.; Berangi, R.; Minaei, B. A Survey of Regularization Strategies for Deep Models. Artif. Intell. Rev. 2020, 53, 3947–3986. [Google Scholar] [CrossRef]
  23. Ribani, R.; Marengoni, M. A Survey of Transfer Learning for Convolutional Neural Networks. In Proceedings of the 2019 32nd SIBGRAPI Conference on Graphics, Patterns and Images Tutorials (SIBGRAPI-T), Rio de Janeiro, Brazil, 28–31 October 2019; pp. 47–57. [Google Scholar] [CrossRef]
  24. He, K.; Girshick, R.; Dollar, P. Rethinking ImageNet Pre-Training. In Proceedings of the 2019 IEEE/CVF International Conference on Computer Vision (ICCV), Seoul, Republic of Korea, 27 October–2 November 2019; pp. 4917–4926. [Google Scholar] [CrossRef]
  25. Windrim, L.; Melkumyan, A.; Murphy, R.J.; Chlingaryan, A.; Ramakrishnan, R. Pretraining for Hyperspectral Convolutional Neural Network Classification. IEEE Trans. Geosci. Remote Sens. 2018, 56, 2798–2810. [Google Scholar] [CrossRef]
  26. Fang, L.; Yishui, S.; Wei, C. Up and down Buses Activity Recognition Using Smartphone Accelerometer. In Proceedings of the 2016 IEEE Information Technology, Networking, Electronic and Automation Control Conference, Chongqing, China, 20–22 May 2016; pp. 761–765. [Google Scholar] [CrossRef]
  27. Mandong, A.-M.; Munir, U. Smartphone Based Activity Recognition Using K-Nearest Neighbor Algorithm. In Proceedings of the International Conference on Engineering Technologies, Bangkok, Thailand, 22–23 November 2018; pp. 37–40. [Google Scholar]
  28. Zhang, W.; Zhao, X.; Li, Z. A Comprehensive Study of Smartphone-Based Indoor Activity Recognition via Xgboost. IEEE Access 2019, 7, 80027–80042. [Google Scholar] [CrossRef]
  29. Gusain, K.; Gupta, A.; Popli, B. Transition-Aware Human Activity Recognition Using EXtreme Gradient Boosted Decision Trees. In Proceedings of the Advanced Computing and Communication Technologies, Panipat, India, 17–18 February 2018; pp. 41–49. [Google Scholar] [CrossRef]
  30. Li, K.; Habre, R.; Deng, H.; Urman, R.; Morrison, J.; Gilliland, F.D.; Ambite, J.L.; Stripelis, D.; Chiang, Y.-Y.; Lin, Y.; et al. Applying Multivariate Segmentation Methods to Human Activity Recognition From Wearable Sensors’ Data. JMIR mHealth uHealth 2019, 7, e11201. [Google Scholar] [CrossRef]
  31. Bayat, A.; Pomplun, M.; Tran, D.A. A Study on Human Activity Recognition Using Accelerometer Data from Smartphones. Procedia Comput. Sci. 2014, 34, 450–457. [Google Scholar] [CrossRef] [Green Version]
  32. Rustam, F.; Reshi, A.A.; Ashraf, I.; Mehmood, A.; Ullah, S.; Khan, D.M.; Choi, G.S. Sensor-Based Human Activity Recognition Using Deep Stacked Multilayered Perceptron Model. IEEE Access 2020, 8, 218898–218910. [Google Scholar] [CrossRef]
  33. Kumar, P.; Suresh, S. Deep Learning Models for Recognizing the Simple Human Activities Using Smartphone Accelerometer Sensor. IETE J. Res. 2021, 1–11. [Google Scholar] [CrossRef]
  34. Xu, C.; Chai, D.; He, J.; Zhang, X.; Duan, S. InnoHAR: A Deep Neural Network for Complex Human Activity Recognition. IEEE Access 2019, 7, 9893–9902. [Google Scholar] [CrossRef]
  35. Ronald, M.; Poulose, A.; Han, D.S. ISPLInception: An Inception-ResNet Deep Learning Architecture for Human Activity Recognition. IEEE Access 2021, 9, 68985–69001. [Google Scholar] [CrossRef]
  36. Li, Y.; Wang, L. Human Activity Recognition Based on Residual Network and BiLSTM. Sensors 2022, 22, 635. [Google Scholar] [CrossRef]
  37. Luwe, Y.J.; Lee, C.P.; Lim, K.M. Wearable Sensor-Based Human Activity Recognition with Hybrid Deep Learning Model. Informatics 2022, 9, 56. [Google Scholar] [CrossRef]
  38. Khan, I.U.; Afzal, S.; Lee, J.W. Human Activity Recognition via Hybrid Deep Learning Based Model. Sensors 2022, 22, 323. [Google Scholar] [CrossRef]
  39. Hayat, A.; Morgado-Dias, F.; Bhuyan, B.P.; Tomar, R. Human Activity Recognition for Elderly People Using Machine and Deep Learning Approaches. Information 2022, 13, 275. [Google Scholar] [CrossRef]
  40. Soleimani, E.; Nazerfard, E. Cross-Subject Transfer Learning in Human Activity Recognition Systems Using Generative Adversarial Networks. Neurocomputing 2021, 426, 26–34. [Google Scholar] [CrossRef]
  41. Kumar, P.; Suresh, S. DeepTransHHAR: Inter-Subjects Heterogeneous Activity Recognition Approach in the Non-Identical Environment Using Wearable Sensors. Natl. Acad. Sci. Lett. 2022, 45, 317–323. [Google Scholar] [CrossRef]
  42. Chen, Y.; Wang, J.; Huang, M.; Yu, H. Cross-Position Activity Recognition with Stratified Transfer Learning. Pervasive Mob. Comput. 2019, 57, 1–13. [Google Scholar] [CrossRef]
  43. Jain, Y.; Tang, C.I.; Min, C.; Kawsar, F.; Mathur, A. ColloSSL: Collaborative Self-Supervised Learning for Human Activity Recognition. Proc. ACM Interact. Mob. Wearable Ubiquitous Technol. 2022, 6, 1–28. [Google Scholar] [CrossRef]
  44. Saeed, A.; Ozcelebi, T.; Lukkien, J. Multi-Task Self-Supervised Learning for Human Activity Detection. Proc. ACM Interact. Mob. Wearable Ubiquitous Technol. 2019, 3, 1–30. [Google Scholar] [CrossRef]
  45. Russakovsky, O.; Deng, J.; Su, H.; Krause, J.; Satheesh, S.; Ma, S.; Huang, Z.; Karpathy, A.; Khosla, A.; Bernstein, M.; et al. ImageNet Large Scale Visual Recognition Challenge. Int. J. Comput. Vis. 2015, 115, 211–252. [Google Scholar] [CrossRef]
  46. Ieracitano, C.; Mammone, N.; Hussain, A.; Morabito, F.C. A Novel Multi-Modal Machine Learning Based Approach for Automatic Classification of EEG Recordings in Dementia. Neural Netw. 2020, 123, 176–190. [Google Scholar] [CrossRef] [PubMed]
  47. Jadhav, P.; Mukhopadhyay, S. Automated Sleep Stage Scoring Using Time-Frequency Spectra Convolution Neural Network. IEEE Trans. Instrum. Meas. 2022, 71, 1–9. [Google Scholar] [CrossRef]
  48. Butt, F.S.; la Blunda, L.; Wagner, M.F.; Schäfer, J.; Medina-Bulo, I.; Gómez-Ullate, D. Fall Detection from Electrocardiogram (ECG) Signals and Classification by Deep Transfer Learning. Information 2021, 12, 63. [Google Scholar] [CrossRef]
  49. Jalal, L.; Peer, A. Emotion Recognition from Physiological Signals Using Continuous Wavelet Transform and Deep Learning. In Proceedings of the HCI International 2022-Late Breaking Papers. Multimodality in Advanced Interaction Environments, Virtual Event, 26 June–1 July 2022; pp. 88–99. [Google Scholar] [CrossRef]
  50. Ali, G.Q.; Al-Libawy, H. Time-Series Deep-Learning Classifier for Human Activity Recognition Based On Smartphone Built-in Sensors. J. Phys. Conf. Ser. 2021, 1973, 012127. [Google Scholar] [CrossRef]
  51. Izonin, I.; Tkachenko, R.; Holoven, R.; Shavarskyi, M.; Bukin, S.; Shevchuk, I. Multistage SVR-RBF-Based Model for Heart Rate Prediction of Individuals. In Proceedings of the International Conference of Artificial Intelligence, Medical Engineering, Wuhan, China, 19–21 August 2022; pp. 211–220. [Google Scholar] [CrossRef]
  52. Sarkar, A.; Hossain, S.K.S.; Sarkar, R. Human Activity Recognition from Sensor Data Using Spatial Attention-Aided CNN with Genetic Algorithm. Available online: https://doi.org/10.1007/s00521-022-07911-0 (accessed on 20 January 2023).
  53. Alzubaidi, L.; Zhang, J.; Humaidi, A.J.; Al-Dujaili, A.; Duan, Y.; Al-Shamma, O.; Santamaría, J.; Fadhel, M.A.; Al-Amidie, M.; Farhan, L. Review of Deep Learning: Concepts, CNN Architectures, Challenges, Applications, Future Directions. J. Big Data 2021, 8, 53. [Google Scholar] [CrossRef]
  54. Sikder, N.; Nahid, A.-A. KU-HAR: An Open Dataset for Heterogeneous Human Activity Recognition. Pattern Recognit. Lett. 2021, 146, 46–54. [Google Scholar] [CrossRef]
  55. Nahid, A.-A.; Sikder, N.; Rafi, I. KU-HAR: An Open Dataset for Human Activity Recognition. Mendeley Data 2021. Available online: https://data.mendeley.com/datasets/45f952y38r/5 (accessed on 28 December 2022). [CrossRef]
  56. Jorge, L.; Ortiz, R.; Oneto, L.; SamÃ, A.; Parra, X.; Anguita, D. Smartphone-Based Recognition of Human Activities and Postural Transitions Data Set. Available online: http://archive.ics.uci.edu/ml/datasets/smartphone-based+recognition+of+human+activities+and+postural+transitions (accessed on 28 December 2022).
  57. Anguita, D.; Ghio, A.; Oneto, L.; Parra, X.; Reyes-Ortiz, J.L. A Public Domain Dataset for Human Activity Recognition Using Smartphones. In Proceedings of the 21th European Symposium on Artificial Neural Networks, Computational Intelligence and Machine Learning, Bruges, Belgium, 24–26 April 2013; pp. 437–442. [Google Scholar]
  58. Huang, G.; Liu, Z.; Weinberger, K.Q.; van der Maaten, L. Densely Connected Convolutional Networks. arXiv 2016. [Google Scholar] [CrossRef]
  59. Ruiz, J.; Mahmud, M.; Modasshir, M.; Shamim Kaiser, M. 3D DenseNet Ensemble in 4-Way Classification of Alzheimer’s Disease. In Proceedings of the Brain Informatics: 13th International Conference, BI 2020, Padua, Italy, 19 September 2020; pp. 85–96. [Google Scholar] [CrossRef]
  60. Zhou, Y.; Li, Z.; Zhu, H.; Chen, C.; Gao, M.; Xu, K.; Xu, J. Holistic Brain Tumor Screening and Classification Based on DenseNet and Recurrent Neural Network. In Proceedings of the Brainlesion: Glioma, Multiple Sclerosis, Stroke and Traumatic Brain Injuries, Granada, Spain, 16 September 2018; pp. 208–217. [Google Scholar] [CrossRef]
  61. Varshni, D.; Thakral, K.; Agarwal, L.; Nijhawan, R.; Mittal, A. Pneumonia Detection Using CNN Based Feature Extraction. In Proceedings of the 2019 IEEE International Conference on Electrical, Computer and Communication Technologies (ICECCT), Coimbatore, India, 20–22 February 2019; pp. 1–7. [Google Scholar] [CrossRef]
  62. Guo, W.; Xu, Z.; Zhang, H. Interstitial Lung Disease Classification Using Improved DenseNet. Multimed. Tools Appl. 2019, 78, 30615–30626. [Google Scholar] [CrossRef]
  63. Riasatian, A.; Babaie, M.; Maleki, D.; Kalra, S.; Valipour, M.; Hemati, S.; Zaveri, M.; Safarpoor, A.; Shafiei, S.; Afshari, M.; et al. Fine-Tuning and Training of Densenet for Histopathology Image Representation Using TCGA Diagnostic Slides. Med. Image Anal. 2021, 70, 102032. [Google Scholar] [CrossRef] [PubMed]
  64. Imran, H.A.; Latif, U. HHARNet: Taking Inspiration from Inception and Dense Networks for Human Activity Recognition Using Inertial Sensors. In Proceedings of the 2020 IEEE 17th International Conference on Smart Communities: Improving Quality of Life Using ICT, IoT and AI (HONET), Charlotte, NC, USA, 14–16 December 2020; pp. 24–27. [Google Scholar] [CrossRef]
  65. Irawan, A.; Putra, A.M.; Ramadhan, H. A DenseNet Model for Joint Activity Recognition and Indoor Localization. In Proceedings of the 2022 IEEE International Conference on Industry 4.0, Artificial Intelligence, and Communications Technology (IAICT), Bali, Indonesia, 28–30 July 2022; pp. 61–65. [Google Scholar] [CrossRef]
  66. Abid, M.H.; Nahid, A.-A. Two Unorthodox Aspects in Handcrafted-Feature Extraction for Human Activity Recognition Datasets. In Proceedings of the 2021 International Conference on Electronics, Communications and Information Technology (ICECIT), Khulna, Bangladesh, 14–16 September 2021; pp. 1–4. [Google Scholar] [CrossRef]
Figure 1. Class distributions of the whole preprocessed UCI-HAPT dataset (outer circle) and its subset (inner circle).
Algorithms 16 00077 g001
Figure 2. An example of a transformed accelerometer signal.
Algorithms 16 00077 g002
Figure 3. The employed transfer learning methodology.
Algorithms 16 00077 g003
Figure 4. The classification accuracy results of five tries for each tested combination.
Algorithms 16 00077 g004
Figure 5. The confusion matrix of the KU-HAR dataset classification using the selected model.
Algorithms 16 00077 g005
Figure 6. The typical progress of the accuracy and loss metrics during the training.
Algorithms 16 00077 g006
Figure 7. A radar chart with the classification results obtained during the model selection.
Algorithms 16 00077 g007
Table 1. The highest accuracy achieved in 5 attempts for each combination (in percentages).
Mother WaveletMex. Hat
32
Mex. Hat
64
Mex. Hat
128
Mex. Hat
256
Morlet
32
Morlet
64
Morlet
128
Morlet
256
Scale Value
ResNet5096.2195.7996.0696.2794.0695.4796.1596.71
ResNet10195.8496.1396.3296.3194.4695.7996.1596.90
ResNet15295.7896.1196.4596.6392.7795.1896.2496.63
Xception--97.3397.29--96.9397.16
InceptionV3--95.8195.49--96.3496.40
InceptionResNetV2--95.8195.58--96.4896.32
DenseNet12197.2796.9697.1197.2495.8196.8296.8797.48
DenseNet16997.1696.9597.0497.0395.5296.6896.8497.41
DenseNet20197.0396.7797.0096.8595.6696.8596.8597.24
Table 2. Metrics of the classification performed using the selected model.
Accuracy (%)Precision (%)Recall (%)AUC (%)F1-Score (%)
97.4897.6297.4199.6097.52
Table 3. Performance comparison of pre-trained and non-pre-trained models during fine-tuning.
ModelUCI-HAPTUCI-HAPT Subset
Accuracy (%)F1-Score (%)Accuracy (%)F1-Score (%)
Not pre-trained DenseNet12192.2392.1986.2986.38
Pre-trained DenseNet121, only top layer trainable80.0077.9975.6064.08
Pre-trained DenseNet121, first 308 layers frozen92.4492.5286.9087.11
Pre-trained DenseNet121, first 136 layers frozen92.2392.2489.1189.27
Pre-trained DenseNet121, all layers trainable91.8991.9288.3188.26
Table 4. Comparison of the results obtained with the KU-HAR dataset in previous studies.
StudyAccuracy (%)F1-Score (%)
[66]89.580.67
[54]89.6787.59
[41]-94.25
[11]94.7694.73
[19]96.6796.41
Proposed97.4897.52
Disclaimer/Publisher’s Note: The statements, opinions and data contained in all publications are solely those of the individual author(s) and contributor(s) and not of MDPI and/or the editor(s). MDPI and/or the editor(s) disclaim responsibility for any injury to people or property resulting from any ideas, methods, instructions or products referred to in the content.