Abstract
The beginning of this decade brought utter international chaos with the COVID-19 pandemic and the Russia-Ukraine war (RUW). The ongoing war has been building pressure across the globe. People have been showcasing their opinions through different communication media, of which social media is the prime source. Consequently, it is important to analyze people’s emotions toward the RUW. This paper therefore aims to provide the framework for automatically classifying the distinct societal emotions on Twitter, utilizing the amalgamation of Emotion Robustly Optimized Bidirectional Encoder Representations from the Transformers Pre-training Approach (Emoroberta) and machine-learning (ML) techniques. This combination shows the originality of our proposed framework, i.e., Russia-Ukraine War emotions (RUemo), in the context of the RUW. We have utilized the Twitter dataset related to the RUW available on Kaggle.com. The RUemo framework can extract the 27 distinct emotions of Twitter users that are further classified by ML techniques. We have achieved 95% of testing accuracy for multilayer perceptron and logistic regression ML techniques for the multiclass emotion classification task. Our key finding indicates that:First, 81% of Twitter users in the survey show a neutral position toward RUW; second, there is evidence of social bots posting RUW-related tweets; third, other than Russia and Ukraine, users mentioned countries such as Slovakia and the USA; and fourth, the Twitter accounts of the Ukraine President and the US President are also mentioned by Twitter users. Overall, the majority of tweets describe the RUW in key terms related more to Ukraine than to Russia.
1. Introduction
The ongoing Russia-Ukraine War (RUW) has become one of the biggest armed conflicts since 1945 in the Europe continent. On 24 February 2022, Russia started marching on the lands of Ukraine to invade and begin the war by attacking major cities such as Chernihiv, Berdyansk, Odesa, Sumy, and Kyiv. The war has shocked the entire globe in many ways, for example, Ref.[1] the global inflation rate has increased by 3% and the world’s gross domestic product (GDP) growth reduced by 1.44%, and the USA alone saw its GDP fall by 1.28% since the war began [1].
Studies such as [2,3,4] gave two major reasons for this war; first, Ukrainian willingness to join the North Atlantic Treaty Organization (NATO). Second, NATO’s enlargement into eastern Europe. NATO is a group of 30 countries in a security alliance and, according to [5], “NATO’s fundamental goal is to safeguard the Allies’ freedom and security by political and military means”. Therefore, Ukraine’s prospective intentions and NATO’s foreseen expansion for European security turned this political clash into an armed battle.
The RUW is not only affecting eastern Europe but also damaging living standards in the whole world [6]. Despite receiving aid from NATO, Ukraine is still in a volatile and unpredictable situation [7]. According to the aforementioned statistics and rationales, it is essential to understand societal emotions. Such emotional expressions in the form of text are helpful to form attitudinal insights [8]. Nowadays, major countries are using both territory and information on social media as part of the war effort. Such social media information dispersion usually turns into information warfare between citizens and politicians of countries participating in the war [9].
1.1. Tracing Russia-Ukraine Relations
For decades there has been antagonism between Ukraine and Russia but in the recent past, the turmoil has flared up belligerently [10]. The year 1991 was revolutionary as with the expiry of the Soviet Union, Ukraine proclaimed its national independence on 24 August 1991 [11]. In 2014, under controversial fraudulent circumstances, the fourth president of Ukraine (Viktor Yanukovych, known as a supporter of Russia) was removed from his post due to the enormous demonstrations and peaceful protests known as Euromaidan which turned into a ferocious Revolution of Dignity. The sudden outburst of public demonstration was the reaction to the denial by President Yanukovych to sign a treaty (i.e., EU association agreement) with the European Union (EU) which could have boosted free trade and closer social and economic ties of Ukraine with the EU [12].
With the intrusion of Russia, the pro-Russian separatists in Ukraine’s Donbas region proclaimed the Donetsk People’s Republic (DPR) and the Luhansk People’s Republic (LPR) as independent states, which escalated the unrest in Donbas region [13]. In an attempt to alleviate the hostile environment and the broken ceasefires in the Donbas region, various reformed Minsk agreements were signed in 2014 but for the status quo, all attempts were in vain [11]. However, sustaining harmony in the Donbas region was one of the concerns and agendas of the current Ukrainian president Volodymyr Zelenskyy who was elected in 2019 [14]. the increased cooperation and aid to Ukraine from the NATO showcased Ukraine as anti-Russian. For self-protection, Russia started assembling its military nearby to Ukraine’s borders at the start of 2021, and the advance of Russian troops to attack Ukraine started on 24 February 2022, which was condemned as a heinous move by the EU, NATO, and worldwide [10,15].
1.2. Objective
Presently, one of the foremost sources of information are the social networking platforms such as Twitter, Facebook, etc. Twitter surpasses other sites and is a more prevalent source among people to express their emotions and opinions over a specific issue [16]. Moreover, for the utilization of pivotal information, it is paramount to obtain organized information from the plethora of unorganized information available on social networks. To improvise accuracy in visualizing the scattered structured information all over the social network, natural language processing (NLP) is utilized. To gather data about numerous matters, connections, or events, the NLP assesses natural language text [17]. Furthermore, transfer learning (TL) is a recent development that is spreading across the realm of artificial intelligence tasks. When creating a new model, TL entails using a pre-trained model [18]. Through the use of TL, professionals were able to significantly speed up the result’s convergence and improve model training performance on the intended job. An existing study [19] indicates that TL works well with short text microblogs data such as tweets. Thus, the overarching aim of this study is to provide an automated framework, Russia-Ukraine War emotions (RUemo), for extracting and classifying 27 distinct emotions from Twitter posts related to war, utilizing the amalgamation of NLP, TL, and ML.
1.3. Gist of the Proposed Framework
Our proposed framework utilized the Emotion Robustly Optimized Bidirectional Encoder Representations from Transformers (BERT) Pre-training Approach (Emoroberta) [20] technique to extract the emotions from the RUW tweets. Emoroberta is an amalgamation of the NLP’s state-of-the-art Roberta technique [21] and GoEmotions [22]. Both of these techniques relied on the popular BERT model developed by Google [23]. Studies such as [22] have found that ROBERTA had outperformed the BERT model and became the leading pre-trained model to utilize for text classification tasks [24]. Moreover, in opposition to existing emotion detection techniques proposed by [25], which classify the text into six emotion categories (joy, anger, fear, sadness, disgust, and surprise), Emoroberta classifies the text into 28 emotion categories (admiration, amusement, anger, annoyance, approval, caring, confusion, curiosity, desire, disappointment, disapproval, disgust, embarrassment, excitement, fear, gratitude, grief, joy, love, nervousness, optimism, pride, realization, relief, remorse, sadness, surprise + neutral) [20,22,26]. Furthermore, according to [27,28], a framework is a set of different components that fosters the process to resolve a problem. Our proposed way of extracting and classifying societal emotions comprises many interleaved components (i.e., data collection and preprocessing, Emoroberta, labeling, feature extraction, classification, and evaluations) that together work to fulfill the objective of this work. Thus, we are addressing our approach as a framework.
Due to the growing availability of electronic documents from many sources, supervised ML research is becoming more and more important [29]. Numerous issues may be resolved with supervised ML [30]. ML has several advantages for text classification tasks such as efficacy, interdomain data insight transfer, and cost savings on expert labor [31]. ML techniques are required because of the growth of data-related tasks such as text classification, where the quantity of unlabeled samples frequently outweighs the number of labeled samples [32]. Specifically, supervised ML techniques need to be labeled datasets to train efficiently [33]. Such techniques therefore rely on the labeled data that is usually not available. Mostly unlabeled datasets are available that requires further manual labeling through expert services like Amazon Mechanical Turk. This makes data labeling tasks costly and time extensive [34]. Our proposed framework demonstrates the automated way of labeling the unlabeled data for the ML model’s training.
1.4. Novelty and Contributions
Existing literature such as [35,36,37,38,39] focused on the specific domain of study to assess the impact of the RUW on the energy, gas (crude oil), food, healthcare, and stock markets, respectively, whereas our work highlights the generalized societal emotions and views of the RUW. Moreover, by complementing prior studies such as [40,41] we have chosen Twitter for this study to provide an automatic emotion classification framework by combining, NLP, TL, and ML altogether. Thus, this work demonstrates the novel approach of combining multiple above-mentioned state-of-the-art concepts (NLP, ML, and TL).
The contributions of this work in the area of the RUW and social media analysis are four-fold:
- The proposed approach extends the sparse literature on the RUW by providing insights into societal emotions. This helps government officials and war analysts to understand the public overview of the war which further fosters action to draft appropriate guidelines and regulations related to the RUW.
- Practically, the proposed framework can be utilized to automatize similar text classification-related tasks such as online spam and misinformation detection.
- Noticeably, the research community is facing the challenge of a paucity of labeled datasets for the classification task and supervised ML task. The proposed framework has the potential to label any textual document-based data in terms of providing 27 distinct emotion categories for the classification task.
- Methodologically, this work emphasizes using byte-level BPE encoding and Emoroberta for extracting the emotions from the text to further classify. This will open the doors for existing researchers to implement state-of-the-art revolutionary encoding and emotion analysis techniques.
2. Literature Review
The RUW is an ongoing conflict and volatile in nature. Every day, new insights proliferate on the internet and social media. Despite being a well-aware global concern, the research on the RUW is limited in scope. Availability of data could be the reason hindering progress of research on the RUW, especially in the context of social media. Therefore, this literature review highlights the three dimensions of research related to the RUW: First, Russia and Ukraine’s relationship, tracing back the roots of the RUW; second, the global impact of the RUW on distinct societal needs such as gas, energy, food, and healthcare; third, people’s opinions related to the RUW on Twitter.
2.1. RUW and Global Impact
COVID-19 and the RUW have had impacts worldwide. The RUW has increased global energy prices and exacerbated issues with energy security, and the pandemic brought sharp variations in energy demand, shocks to the oil price, interruptions in energy supply chains, and difficulties with energy investments. In [35], the authors implied that global politics is concentrated on the short-term, ostensibly speedier remedies, such as preserving the status quo of the energy sector in the post-pandemic era to stabilize the economy and seek out new fossil fuel supply lines for strengthening energy security after the war rather than focus on climate-friendly, low carbon energy alternatives. A policy solution had been provided in the work to address these issues and develop resilient and sustainable energy systems, which are primarily supported by energy services.
The agricultural sector is of the utmost significance for overall food security; thus, it is crucial to comprehend how the epidemic and the conflict have affected many aspects of agriculture, particularly land usage. Given the dearth of recent data from the major statistical databases, in [42] the authors primarily took into account the insights emphasized in the literature on the ramifications of the most recent shocks in terms of agricultural aspects. The research demonstrated that the pandemic had less of an influence on land use modifications than the Russia-Ukraine crisis, which encouraged adjustments in farmers’ and policymakers’ choices to address restrictions in agrifood chains. However, the effects of the battle on land usage were not thoroughly investigated.
The COVID-19 pandemic’s impact on crude oil prices had barely begun to diminish when the RUW brought forth a fresh problem. In [36], a novel application was created that incorporated these two worldwide influences to forecast changes in crude oil prices. This study, unlike most others, made use of a dataset with information gathered over a period of 22 years and seven distinct characteristics, such as the opening and closing prices of crude oil and the greatest and lowest prices recorded for any given day. ML methods (such as support vector machines, linear regression, and rain forests), as well as deep-learning algorithms, were used in this study to forecast the price of crude oil (long short-term memory and bidirectional long short-term memory). Finally, the outcomes of deep-learning and ML algorithms were compared.
The RUW has several detrimental socioeconomic effects that are currently being felt worldwide and might get worse, especially for global food security, as it is a confrontation between two significant agricultural powers. Food prices were already soaring due to supply chain disruptions brought on by the COVID-19 epidemic, high global demand, and subpar harvests in some nations, but the simultaneous occurrence of the RUW caused a deterioration in the world’s food markets. Therefore, the purpose of [37] was to examine the direct and indirect effects of the RUW on world food security. The report emphasized how the conflict has immediate and extensive cascading effects on global food security resulting in the ceasing of exports from Ukraine, manpower shortages due to enlistment and population relocation, constraining access to fertilizers, and the ambiguous status of future crops.
Understanding the health of Ukrainian residents is crucial in light of the rapid migration of several million migrants and war refugees from Ukraine into other European nations. In [38], the authors identified the major health issues by analyzing the nationwide general hospital morbidity data for Ukrainian residents who resided in Poland from 2014 to June 2022. At this time, diseases associated with pregnancy, childbirth, and puerperium were the most frequently reported primary causes of hospitalizations for adult women. In contrast, diseases associated with injury, poisoning, and other consequences of external causes were the most frequently reported primary causes of hospitalizations for adult men and infectious diseases were the impacting factor for children. The results could have an influence on how newly arriving migrants and war refugees in the target European nations were served by healthcare policies and services.
The dispute between Russia and Ukraine has had repercussions around the globe. Major commodity markets (oil, gas, platinum, gold, and silver) have seen significant changes in supply and price. The purpose of [39] was to assess how the Russian invasion issue has affected the dynamic interconnectedness of five commodities, the G7, and the BRIC (leading stock) markets. The author used the time-varying parameter vector autoregressive (TVP-VAR) technique, which captured how spillovers are formed by distinct crisis times and discovered that all commodities and markets were extremely interconnected (G7 and BRIC). The results demonstrated that during this invasion crisis, the stock markets of the United States, Canada, China, and Brazil, as well as gold and silver (commodities), received shocks from the other commodities and markets. These policy choices may provide decision-makers, commodity and stock investors, institutional investors, bankers, and international organizations with better decision options.
2.2. Social Media Analysis
People invest a lot of time in various online tasks due to the growing popularity of social media, and a significant portion of the data they submit are in the form of text messages [43]. Thus, it is important to understand the social media analysis literature base, in general, to further understand the RUW-related social media analysis knowledge base in existing studies. Recently, various studies have emerged in the realm of social media analysis for distinct purposes such as privacy awareness [43], online political debating (e.g., Brexit) [44], and crises in Afghanistan [45]. Moreover, for social media analysis, existing studies such as [46,47] have used ML and deep-learning techniques.
In [47], the text and user comments in Kazakhstani media were analyzed. Convolutional and recurrent neural networks were used in ML methods for sentiment categorization (CNN and RNN). After the categorization, a review of the collected findings was conducted in comparison. The public’s thoughts and feelings on a range of topics, such as current conditions in countries embroiled in conflict, might be gleaned via microblogging websites and social media platforms. Twitter in particular contains a sizable volume of geotagged tweets, which enabled the study of attitudes over time and geography. Using text mining and LDA (Latent Dirichlet Allocation), the study by [45] analyzed the volume and sentiment of two datasets gathered across various time periods related to the Afghanistan crises.
Furthermore, it has been observed that existing literature also considered social media data privacy concerns. To provide consumers complete control over their data when engaging in online activities, the authors of [43] presented a unique solution based on ML and language-embedding techniques. They have developed a prototype Google Chrome plugin for this strategy, called Knoxly. The tool has undergone preliminary experimental research to evaluate its accuracy in identifying sensitive information and its usefulness in terms of its influence on user experience. Thus, by complementing the aforementioned studies we have adopted the ML techniques in this article.
2.3. The RUW and Twitter
Twitter has been the focus of scholarly assessments that have examined it as a tool for information dissemination and communication in a variety of sectors, particularly with respect to political and social concerns, authoritarian leaders’ use of it, during election campaigns, and in relation to the COVID-19 epidemic [40]. Additionally, multiple studies have demonstrated how social networks are essential for galvanizing individuals around a common cause during times of crisis and war [48].
In [40] authors used a social listening analysis on Twitter to evaluate the sentiments and emotions of the public surrounding green energy. The focus was on a critical duration that started at the same time as the Ukrainian-Russian crisis in 2022, which surely had an impact on global energy policies everywhere. In the interval before and after the battle began, texts that mentioned “green energy” were searched. Then, authors conducted a dimensionality reduction analysis, a semantic analysis of the most frequently occurring terms, a comparison study of sentiments and emotions in both periods, and an examination of the variance of tweets compared to retweets. The analysis’s findings indicated that societal sentiment toward a transition to green energy had shifted as a result of the dispute. Additionally, it was discovered that after the disagreement started, green energy tweeters began to experience unpleasant emotions and sentiments. However, as the war, which was closely related to energy, had forced all nations to urge a quick switch to greener energy sources, the emotion of confidence had also grown. Last but not least, it was observed that of the two latent variables for public view found, pessimism persisted as optimism bifurcated into optimism and expectancy.
The invasion of Ukraine by Russia increased fears of a third world war across the world. Throughout the conflict, news spread quickly around the world on social media platforms including Facebook, Twitter, Instagram, and others. These forums were used to garner support and disseminate information about the conflict as well as a variety of viewpoints with various emotions and perspectives. The ability of such information to influence public conduct must therefore be critically examined. Given this, in [41] the author’s objective was to examine such dynamic attitudes by doing exploratory data analysis using a variety of visualizations, utilizing tweets collected from 31 December 2021 to 3 March 2022.
The analysis concentrating on tweets based on the crisis between Russia and Ukraine had been done by [49]. The authors amalgamated sentiment analysis and network analysis techniques to generate a number of significant understandings about the dispute conversation. The focus was on identifying the key players in the discussion as well as hashtags or user groups that support either side of the argument. The results indicated that the majority of users favored Ukraine and that the most prominent accounts were those of influential political figures, significant organizations, or media sources that frequently covered the crisis. Similar to this, the majority of pertinent hashtags were mostly used in pro-Ukraine tweets, however several of them also occurred in tweets that favored Russia. All the groupings indicated support for Ukraine to some extent, except for a small number of blatantly pro-Russian communities.
Prior studies, such as [35,36,38], have concentrated on a particular area for their research work to analyze the RUW impacts on the energy, gas (crude oil), food, healthcare, and stock markets, respectively. Thus, to fill a gap, we found a generalized way of analyzing societal emotions and opinions for the RUW. Closely related studies such as [40,41] have extracted people’s opinions on Twitter utilizing sentiment analysis, exploratory analysis, and network analysis, respectively. In this way, we have overcome the problem of scope limitation for studying people’s various emotions. Whereas our work extracts the 27 distinct emotions of people from their tweets using state-of-the-art Emoroberta and further classifying them utilizing ML techniques. Moreover, by harmonizing prior studies we have used Twitter to provide an automatic emotion classification framework by combining, NLP, TL, and ML altogether.
3. Methodology
Figure 1 depicts the overview of our proposed RUemo—RUW emotion classification framework. We conducted our approach in two phases where in phase one we extracted the 27 distinct emotions from the unstructured RUW tweets. The result of phase one would be the emotions associated with each tweet as a label. Such labeled tweet data were passed as input to phase 2 in which we performed the emotion classification task through supervised ML techniques. In phase 2, we extracted the term frequency—inverse document frequency (Tf-idf) features from the tweets to further input the various ML techniques. We also performed the parameter tuning to get the optimum set of parameter values for utilized ML techniques (Naïve Bayes, Decision Tree, Random Forest, Multilayer Perceptron, Adaboost, Support Vector Machine, Logistic Regression, k-nearest neighbor) to get higher prediction accuracies. Furthermore, we used various evaluation measures (Accuracy, Recall, Precision, and F1 measure) to assess the emotion classification task and to pick the best-performing ML techniques.
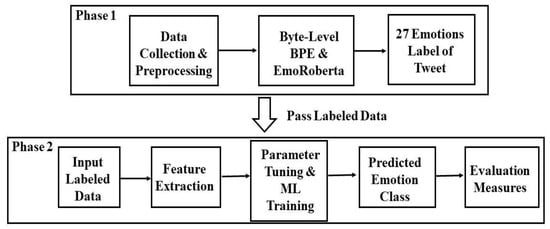
Figure 1.
RUemo—RUW emotions classification framework’s high-level view.
Furthermore, our framework was grounded in the concept of multi-view learning [50,51] and TL [52], wherein multi-view learning is a rising area of ML that considers learning from different perspectives to enhance the generalization performance. Data fusion or data integration from several features (e.g., various emotion classes, BBPE feature, tf-idf feature, etc.) are other terms for multiview learning. The following section describes the interleaved components of the framework. Basically, multiview learning consists of early integration (i.e., combining all features altogether as a data sample), intermediate (i.e., extracting the features for each emotion category and then combining all features as sample data) and late integration (i.e., training the ML models for all feature sets for emotion classes and then supply the outputs (best-trained model, parameters, and batch size) and mechanisms. Due to the fact that each ML classifier is individually fitted on a training dataset, this late integration technique has the benefit of being readily applied in parallel, thus we have used the late integration. TL tries to improve the performance of ML techniques on intended domains by transferring the knowledge found in various but related problem areas. By doing this, the reliance on a significant amount of target-domain data may be lessened for creating target learners. TL has become a well-liked and promising field in ML because of the numerous application possibilities [52]. In our formwork we used Emoroberta which is already trained on GoEmotion datasets to extract the various emotions; thus we are able to utilize its learned knowledge of extracting a wide variety of emotion classes. Hence, multiview and TL are apt mechanisms to create the foundation of our proposed RUemo framework.
3.1. Data Collection and Preprocessing
We have collected the data from the publicly available platform Kaggle.com [53] (https://www.kaggle.com/datasets/kumari2000/ukraine-russia-war-twitter-dataset-2022 accessed on 13 December 2022). The data were originally collected through Trackmyhashtag.com utilizing various hashtags such as #ukrainerussiawar, #ukrainewar, #ukraine, and #standwithukraine. They were collected during the middle of the RUW, i.e., August 2022. In total, the data have 50,000 multilingual tweet posts wherein 36,819 tweets are in the English language. We have used only English-language tweets for this work. Among the English language tweets, 36,424 are from non-verified user accounts and 395 belong to verified accounts. The data have the following variables—Tweet Id (identification number for each tweet to uniquely identify), Tweet URL (a URL address to the page where the tweet was posted), Tweet Posted Time (the timestamp when the tweets were posted), Tweet Content (the tweet text posted by users), Tweet Type (whether the tweets are posted as tweet or retweet or reply type), Client (the medium from which the tweets were posted such as iPhone, android, etc.), Retweets Received (number of retweets received by a tweet), Likes Received (the number of likes received by the tweet), Tweet Location (the location from where the tweet was posted; this is generally found empty in data), Tweet Language (this indicates the language of the tweet post such as English, Hindi, Russian), User Id (the id of a twitter user), Name (a screen name/ display name of the Twitter user), Username (actual user name of the Twitter user generally used for logins), User Bio (a short personal description of an account holder), Verified or Non-Verified (whether the account received a verification blue tick badge or not), Profile URL (a URL to go to the user’s profile page), User Followers (the number of people who are following a user), User Following (the number of users followed by an account holder), User Account Creation Date (the date when the account was created by a user or age of an account).
For the data preprocessing: First, we have used only those variables that are in the scope of this study. Thus, we have used tweet content, retweets received, likes received, client, tweet type, user followers, and user following. The remaining variables have been removed (the above mentioned are all variables). Second, we have removed the emojis from the tweet content because our focus is solely on using textual data. Third, we have removed white spaces, and stop words (e.g., you, your, he, she, they, themselves, etc.) because unnecessary spaces and stop words usually will not help ML models to learn any new insights. Moreover, we have removed special characters (^, $, *, ~, etc. except @ and #). The @ and # are helpful for ML models to learn about user mentions and trending hashtags. Fourth, we have also removed any numerical, character-numerical, and mathematical symbols except punctuation such as exclamation marks (!) and question marks (?) because these marks are helpful to extract emotions. At last, we have performed the lower casing (i.e., making all words of the tweet in lower letters) and padding (i.e., making all sentences of a tweet of equal length by adding extra digits) considering different writing styles and lengths of the tweets.
3.2. Byte-Level Byte Pair Encoding (BBPE)
With the help of more processing power, data, and improved algorithms, natural language processing—the study of how to properly handle natural text by computers—has lately made significant strides. It is the core of various application cases, including machine translation, conversational bots, and opinion mining, among others. Various ML models can combine with NLP techniques and perform well for distinct tasks such as text classification [18].
Currently, advanced natural language translation models are constructed on top of character-based vocabularies, such as words, subwords, or characters. Byte pair encoding (BPE) is one of the character-based encoding mechanisms that works on frequent character occurrences (i.e., characters that occurs the most in the text) and merging (merging the frequently occurred characters to represent as one character). However, BPE won’t work efficiently for character-rich languages like Japanese and Chinese. Therefore, more advanced models such as the Roberta uses byte-level BPE (BBPE), where the text is represented at the byte level and uses the vocabulary of 256 bytes [54,55].
Studies such as [54] have observed that BBPE is better than BPE. BBPE has advantages such as, it takes less computational power and can work efficiently on almost all languages for tokenization. Thus, to utilize the above-mentioned advantages of BBPE we have used Roberta-based Emoroberta model for the emotion detection task. Moreover, BBPE is essential to learn the contextual meaning of known (i.e., the words that are in the text vocabulary and that the ML model is aware of) and unknown (i.e., the words that are not in the text vocabulary and that the ML model can eliminate or miss to learn) words in the text data to further detect the emotions.
3.3. Emotion Extraction through Emoroberta
Predicting an emotion from a text is called emotion analysis (EA) from the text. The growth of Web 2.0 has been a driving force behind the expansion of emotion analysis techniques. Social media’s ubiquity has made it common for individuals to express their feelings online. Thus, a wide variety of textual data is available to apply different natural language processing algorithms [56].Due to considering microblogging tweets as a bag of words and sentences, existing ML and lexicon-based techniques are unable to attain the desired results because they usually miss the essence of informative text ordering and structure [57]. Whereas Emoroberta which is a combination of Roberta [21] and GoEmotion [22] has the capability to not only understand the text structure and order but consume the informative symbols as well. Roberta is the enhanced version of the BERT language model and has achieved great results for training on larger batches and sequences of text. Thus it is the best among all other transformers models such as BERT [20,21]. Roberta is trained on large mini-batches, full data sequences without next-sentence prediction loss (NSP loss), dynamic masking, and Byte-level byte pair encoding. Wherein, large mini-batches mean- increased text data batch sizes of the training to enhance the accuracy. Dynamic masking means—generating the masking patterns each time inputting the text sequence for the training while using a large corpus [21]. All of these advantages are incorporated in the Emoroberta which is a part of our framework. With comments pulled from well-known Reddit.com, the GoEmotions [22], was created, which is the largest manually labeled dataset of fifty-eight thousand carefully chosen comments, classified into 27 emotion categories or Neutral. GoEmotion’s extensive list of positive, negative, and ambiguous emotion categories, in contrast to Ekman’s taxonomy’s single positive emotion (joy), makes it appropriate for contextual interpretation tasks that need a deft comprehension of emotion presentation. The Emoroberta-tuned parameters are Learning rate 5 × 10⁻⁵, Epochs 10, Max Seq Length 50, Batch Size 16, Warmup Proportion 0.1, Epsilon 1 × 10⁻⁸ [20].
3.4. Label Encoding and Feature Extraction
The extracted emotions are in the form of text as categorical values thus further requiring the label encoding wherein each textual (emotion) category is assigned a numeric value that can be used as distinct classes during the classification task. Following are the numeric codes we have assigned to each emotion category—admiration = 1, anger = 2, annoyance = 3, approval = 4, amusement = 5, caring = 6, confusion = 7, curiosity = 8, disappointment = 9, disapproval = 10, disgust = 11, desire = 12, embarrassment = 13, excitement = 14, fear = 15, gratitude = 16, grief = 17, joy = 18, love = 19, neutral = 20, nervousness = 21, optimism = 22, pride = 23, realization = 24, remorse = 25, sadness = 26, surprise =27. We did not find any tweet related to relief, so we did not perform encoding for it. Moreover, to train the ML models on the text data it is required to vectorize (assigning numerical values to words and letters), hence, we have used (Tf-idf) [58] as a feature extractor to transform the text into the sparse matrix of numerical values. In tf-idf, the tf represents the “number of times a word appears in a document divided by the total number of words in that document [59] and idf represents the logarithm of the number of the documents in the corpus divided by the number of documents where the specific term appears [59]”.
3.5. ML Classifiers
Text classification generally bifurcates (divides into categories) textual data according to previously known information; it is a supervised learning approach. By integrating the features and extracting patterns common to each category from the training data, each testing instance’s category is determined. Two steps make up the classification process. To assess the model’s performance and accuracy, a classification ML technique is performed on the training dataset first, and the trained ML model is then verified against a labeled test dataset [60].
Naïve Bayes (NB) technique is straightforward and has its root in Bayes theorem’s conditional probability (i.e., the occurrence of an event A depends upon the occurrence of another event B). This method uses a probability table as the model, which is updated using training data. When looking up the category (label) probabilities to forecast label values (e.g., sadness, anger, etc.), one must consult the “probability table,” which is based on its variable values. The fundamental presumption is conditional independence, which is why it is referred as “naive”. The benefits of NB include easy implementation, good performance, requiring a small training set, handling the number of independent variables (predictors) and data points, being capable of multi-category classification problems, and making probabilistic predictions [61]. We have used two variants of NB: multinominal NB, and Gaussian NB.
SVM [62] is capable of handling classification tasks. The decision boundary for this approach is the hyperplane (subspace in coordinate geometry), which must be determined. A decision boundary is required to divide a collection of objects into their many classes. If the items cannot be separated linearly, kernels—complex mathematical functions, must be used to separate the objects that belong to various classes. The goal of SVM is to accurately predict the classes using data points from the training set. SVM is advantageous to handle both unstructured (text) and structured data, and it has less likelihood of overfitting. With large data, it can scale up and usually provide the optimum results [61].
A decision tree [63] (DT) is a rule-based approach to estimating the values of the category (labels) in the classification task. This works on the mechanism of tree formation including root, leaf (where the final categories are assigned), and internal node connecting through branches. Generally, DT classifies the data points by arranging them according to the values of the variable from the root to a few leaf nodes. Branches of DT indicate the potential value for variables, nodes represent the choices (yes/no, true/false), and then the tree descends along the path that corresponds to the value of the resultant category [64]. Moreover, random forest [65] (RF) is based on the mechanism of ensemble learning that incorporates the implementation of various decision tree models to predict the outcome. Since RF uses many DTs under the hood, it is a powerful classification technique that guarantees optimum results.
Logistic Regression [66] (LogReg) is used for the classification task and is often confused with the regression technique due to its name. This work on the mechanism of predicting the likelihood that an event will occur or not (in terms of 0 and 1). For instance, determining whether a tweet has sad emotions or happy emotions. The following benefits of logistic regression include ease of regularization, computational efficiency, and simple implementation. This can take a variable’s value without feature scaling. The majority of the time, this method is employed to resolve issues of industrial scope. Because the result of logistic regression is a probability score, additional multicollinearity and minor data noise have little impact on the result [61].
K-nearest neighbor [67] (KNN) is known as a lazy learning technique that is non-parametric (has no prior assumptions for data). KNN is quite beneficial for real-time datasets. A lazy technique does not require any training data points to generate models. The testing phase utilized all training data. K is the number of nearest neighbors, which serves as the main decision element in KNN. Assume emotion ‘E1′ is the variable for which the label must be predicted. The k points that are closest to E1 are found first, and points are then categorized based on the votes of their k neighbors. Each item casts a vote for the category they belong to, and the prediction belongs to the category with the most votes. Distance measurements such as the Euclidean distance, Hamming distance, Manhattan distance, and Minkowski distance can be used to calculate the distance between two locations in order to discover the nearest similar spots. The basic steps of KNN are as follows: Measure the distance, locate the nearest neighbors, and choose labels (sad or happy, or neutral) [68].
To address a specific ML task, many models, such as classifiers, are deliberately developed and merged in an ensemble learning process. The main purpose of ensemble learning is to enhance a model’s performance or lessen the possibility of making a poor model choice [69]. Many ML models altogether train during ensemble learning to address a common classification task. Ensemble learning techniques such as adaptive boosting (AdaBoost) [70] attempt to reduce bias, and variance, or improve predictions as opposed to other ML techniques that rely on singular mathematical computation from the training data. AdaBoost employs an iterative process to improve poor classifiers by learning from their errors [64].
The multilayer perceptron (MLP) [71] is a multilayer feedforward neural network in which data values pass through the hidden layers in a linear fashion from the input nodes to the output nodes. Each neuronal link has its own weight (randomly assigned values to help get desired output). The activation function (a mathematical equation for calculating output) of perceptron (nodes) in the same layer is identical. The well-known MLP learning algorithm is a backpropagation, which is an extension of the Least Mean Squared rule, among many other algorithms. Backpropagation is the process of spreading mistakes from layer to layer, starting with the output layer and moving backward, to fix weights [72].
3.6. Evaluation Measures
Measuring and evaluating the performance of a trained ML model is crucial to assess the predicted results. This is important to establish the validity and reliability of the ML models. Thus, we incorporated four measure evaluation measures known as accuracy, precision, recall, and F1-score. Following are the equations (i.e., 1 to 4) that represent the mathematical formulation of mentioned measures. Where TP is the number of True Positives—the number of positive RUW tweets that were correctly predicted in the right emotion class, TN is the number of True Negatives—the number of negative RUW tweets that were correctly predicted in the right emotion class. FP is the number of False Positives—the number of negative RUW tweets that were incorrectly predicted as positive RUW emotion class. FN is the number of False Negatives, i.e., the number of positive RUW tweets that are incorrectly predicted as negative RUW tweets. Overall, accuracy is responsible for assessing the ML model’s performance. Precision is responsible for measuring the relevancy of the generated prediction results. A recall is responsible for measuring the correctly classified RUW tweets and the F1-Score is a weighted combination of recall and precision scores [73]
4. Results and Discussion
In order to implement both phases of an experiment to demonstrate the proposed framework we have incorporated the Google Cloud service that is Collab, which provides a high computational environment to accelerate the training of hardware-intensive tasks such as emotion detection and classification. Specifically, we have selected the standard NVIDIA T4 Tensor Core GPU. Furthermore, to get the optimum classification results we have used the grid search-based cross-validation (i.e., a technique to find the optimum value set of all the parameters of the ML models; such parameters are important to help the ML model to predict accurate classes).
4.1. Phase 1
During phase one of our proposed approach, we extracted the emotions to further label the RUW tweets for supplying to phase 2 for the classification task. Following Table 1 shows the distinctive analysis based on the collected dataset. We have found that war and Ukraine-related hashtags are trending more than Russia-related hashtags. #fake is also trending (see Table 1), which indicates the probability of fake or misinformation proliferations on Twitter related to war which is a sign of an information war between Russia and Ukraine. During the analysis of user mentions (denoted by @ on Twitter posts), we found that tweets were mentioning political leaders such as Ukrainian president Volodymyr Oleksandrovych Zelenskyy (@zelenskyyua) and the US president’s office (@potus). This indicates the societal attention on western nations’ ties with Ukraine. However, there can be many reasons to lead the mention of political agencies such as replying to any specific tweet, grabbing the attention of politicians, etc.

Table 1.
Distinct analysis of collected RUW tweets.
Furthermore, the Twitter website followed by android and iPhone is a major communication medium for posting RUW-related tweets. However, there is a presence of social bot tweets as well that needs to be observed for any misconduct on Twitter such as spreading fake news, abusive content, or provocative posts. To analyze the societal engagement of RUW-related posts, we have observed that approximately on average each tweet received 2 likes with a maximum of 16,987 likes and 5764 retweets. The data have user tweets that have a maximum of 14,515,730 followers and a user account that is following a maximum of 1,434,649 other users. This indicates the tweet’s reach among Twitter audiences. Figure 2 shows the most liked and retweeted posts in the collected data, where the tweet content highlights the spread of misinformation related to military personnel. This finding ties in with the Table 1 hashtag analysis (see #fake). Figure 3 indicates the tweet lengths that show a maximum of tweets are under the 100 letters limit and as a maximum a few tweets have been posted with the full 280 letters limit of Twitter. However, we have removed the URLs and stop words that may have shrilled the tweet length.
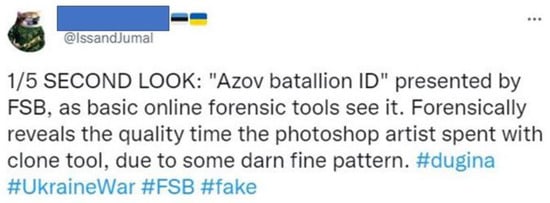
Figure 2.
The most liked and retweeted post on Twitter among all collected tweets.
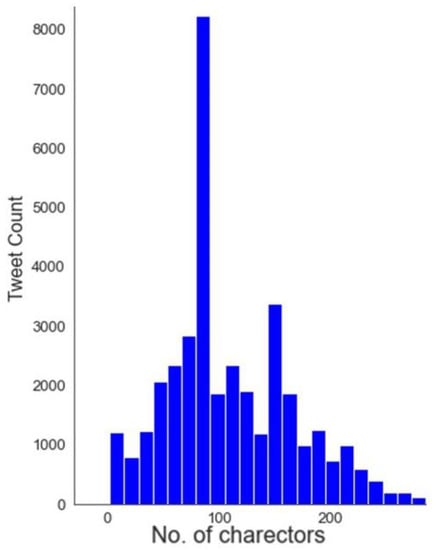
Figure 3.
Distribution of the tweet length—number of characters in the tweets.
Figure 4 indicates the distribution of the tweet types among the collected data. Approximately 67% of tweets belong to the retweet category (a tweet that is posted multiple times by many people) whereas original tweets and replies to original tweets are 26% and 7% respectively. This indicates high societal participation to proliferate RUW-related tweets.
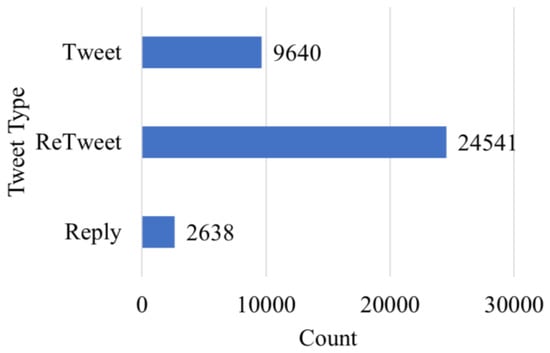
Figure 4.
Distribution of tweets according to tweet type:original tweet, retweet, and reply tweet.
Figure 5 shows the word cloud for top buzzwords during the RUW tweet posts. The word cloud is very helpful to gain insights into a specific subject matter such as the RUW with a clearer vision from a different angle. In the word cloud, bigger words indicate a high frequency of appearance that does not mean that small-sized words are not useful. For example, if we look at Figure 5 more closely, we can observe that despite having a war between Ukraine and Russia, countries such as Slovakia, Lithuania, and the USA (see at top of the word cloud in small size) are also a topic of discussion. This finding ties in with the aforementioned Table 1 finding where tweets mentioned the US President’s Twitter account (@potus). Overall, the word cloud indicates the high frequencies of Ukraine-related tweets. There is a high mention of Russia’s defeat as well (see the word Russia losses). Thus, societal attention is more on Ukraine than on Russia.
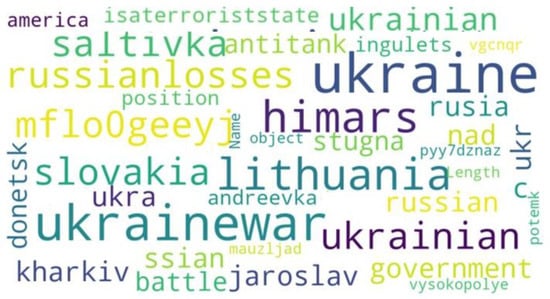
Figure 5.
Word cloud of most buzzed words among the collected RUW tweets.
Figure 6 shows that among the collected tweets, we were able to extract all 27 emotions except the relief emotion which make sense considering the war situations. This indicates the potential of the Emoroberta-based framework to extract various emotions successfully. Despite the societal focus on Ukraine than Russia as shown by the above analysis of the RUW tweet content, surprisingly, approx. 81% of tweets’ stance is neutral and 3% of tweets indicate approval emotions with 3% of optimism. Moreover, 2.5% of tweets indicate the curiosity emotion with approximately 1.5% of gratitude, 1.5% of admiration, and 1% each of caring, joy, and confusion. Rest emotions such as amusement, anger, annoyance, desire, disappointment, disapproval, disgust, fear, embarrassment, excitement, grief, love, nervousness, pride, realization, remorse, sadness, and surprise, covers 4.5% of tweets. Here, we can sense that the data collection period may have played an important role in this result because the data were collected during the mid-war (in Aug 2022) when people may have had more clarity of the conflict reasons. Moreover, large populated countries like India which has high numbers of Twitter users and showed a neutral instance for the war [74,75,76], may have to lead the Twitter conversations.
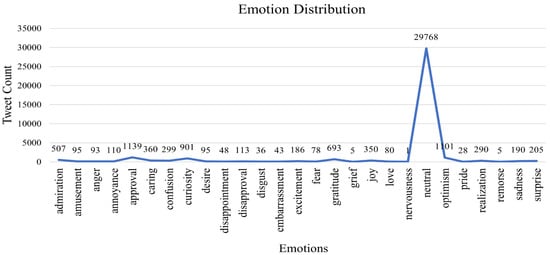
Figure 6.
Distribution of 27 emotions according to the number of tweet count after emotion extraction from Emoroberta.
For a clearer view and to showcase the potential of our Emoroberta-based framework’s competency we have shown the example tweets with their associated emotions in Table 2. By looking and reading at the tweet in Table 2 one can observe the accurately labeled emotions. We have used an asterisk sign (i.e., **) wherever necessary to hide abusive context. Moreover, these tweets are already present on Twitter in real-time. We did not perform any spelling corrections because this will ruin the originality of the tweet posts. Therefore, in Table 2 we can observe the usage of misspelled words (e.g., ruzzia instead Russia) as a metaphor or to spare oneself from any social content-related issues such as banning or suspension. However, such misspelled words can portray the meaning of the word and its context.
Table 2.
Examples of tweets according to their extracted emotions.
The final output of phase 1 is a labeled data set combining tweet content and emotion that further supply phase 2 for the classification task.
4.2. Phase 2
The proposed framework’s phase 2 focuses on the classification of emotions through supervised ML techniques. We have used various ML techniques to compare their performance with each other to pick the best one. To have a fair comparison among the adopted ML techniques we have tuned the parameter of ML techniques through five-fold grid search cross-validation. Wherein grid-based search cross-validation considers all parameter combinations to select the best set among them. During cross-validation, the collection of data is divided into k folds (groups) that are roughly similar in size. The estimator (ML model) then trains on the remaining k-1 folds using the first fold as a validation set. Following are the tuned parameters for all ML techniques—SVM and LogReg {regularization parameter C = 0.01}, KNN {number of neighbor K = 3}, RF {number of trees = 100}, DT {max_depth = 50}, MLP {learning rate = 0.001, batch size = 32, hidden layer size = 2}, AdaBoost {number of the base estimator or n_estimator = 50}, and NBs {versmoothing = 0.4 and alpha = 0.7}. Table 3 shows the various ML model evaluation measures, wherein MLP outperformed all other ML techniques based on the high accuracy and recall scores, 95% each. However, logistic regression is closely competent to MLP but neural network-based techniques like MLP have the potential to train on large datasets than the traditional ML technique such as logistic regression as demonstrated by [77] as well.
Table 3.
Evaluation metrics scores for all ML techniques.
Moreover, as the ML technique’s accuracy is an indicator of the successful classification of all emotion classes, this also provides us an overview of the unsuccessful prediction of emotion classes. In other words, the wrong or unsuccessful prediction rate of our optimum ML technique (i.e., MLP) is 5%. This means that in general 5% of test data were predicted or classified to the wrong emotion classes (e.g., a tweet that belongs to happy emotion was classified to sad category). Similarly, the logistic regression technique has classified 5% of tweets into wrong categories. The potential way to get optimum 100% accuracies would be to accommodate more similar data with further parameter fine-tuning (as we did).
5. Conclusions
In our work, we collected RUW related tweets and extracted societal emotions to showcase the neutral outlook of the public towards the RUW. The foremost reason for the neutrality could be the energy resource dependence of the majority of countries on the resource provider, Russia. Moreover, largely populated countries (such as India) preserving their neutral stand on the RUW can be the parallel cause of emotional neutrality. Furthermore, from the experiments performed, it was evident that our classification framework RUemo highlighted promising results, and the neural network-based MLP outperformed other traditional models.
Although this research has explored a wide range of emotions for RUW context but it linguistically has limited scope. We have used English language-based tweets, whereas with the RUW impacting the entire globe, analyzing multilingual tweets is essential. This work performed the emotion analysis but further theme-based tweet analysis is needed. Another limitation of this work lies in the scope of method variability. Other emotion analysis techniques such as Text2Emotion can also be used to extract the limited emotion classes that can be compared with this research’s proposed framework. Thus, for future purposes, there is a need for a large dataset related to the RUW to gain more insights. More specifically, time-variant data are required to assess prewar, mid-war, and postwar societal outcry. However, this work highlighted the mid-war insights to gain societal attitudes during the war-like crises. Moreover, for emotion classification tasks, further deep-learning-based techniques need to be explored. Multilingual tweet emotional analysis is also required to gain more insights.
This paper extends the scant RUW literature by revealing the feelings of the general public. This can further facilitate the development of suitable RUW-related norms and regulations by assisting government officials and war analysts in comprehending the general public’s perception of the conflict. Practically, the suggested framework may be used to automate activities connected to text classification, such as the identification of online spam and false information. Any textual document-based data might be labeled using the suggested framework, which offers 27 different emotion classes for the classification process. In terms of methodology, this effort will make it possible for current researchers to use cutting-edge encoding and emotion analysis tools.
Author Contributions
Conceptualization, P.V. and G.V.; methodology, P.V. and G.D.; formal analysis, P.V., G.V. and G.D.; investigation, P.V. and G.V.; resources, P.V.; data curation, P.V. and G.V.; writing—original draft preparation, P.V. and G.V.; writing—review and editing, P.V., G.V. and G.D.; visualization, P.V. and G.V.; supervision, P.V. and G.D.; project administration, P.V.; All authors have read and agreed to the published version of the manuscript.
Funding
This research received no external funding.
Data Availability Statement
Publicly available datasets were analyzed in this study. These data can be found here: [53].
Acknowledgments
The support from the Department of Computer Information Systems, College of Business Administration, Texas A&M University-Central Texas, is highly appreciated as it made this work publishable by providing resources.
Conflicts of Interest
The authors declare no conflict of interest.
References
- Statistia GDP Growth Forecast Change Due to Ukraine War by Country 2022—Statista. Available online: https://www.statista.com/statistics/1321519/gdp-growth-forecast-change-due-to-ukraine-war-by-country/ (accessed on 13 December 2022).
- Wolff, A.T. The Future of NATO Enlargement after the Ukraine Crisis. Int. Aff. 2015, 91, 1103–1121. [Google Scholar] [CrossRef]
- Donaldson, R.H. The Role of NATO Enlargement in the Ukraine Crisis. Sov. Post-Soviet Rev. 2017, 44, 32–52. [Google Scholar] [CrossRef]
- Klotz, M. Russia and the Ukrainian Crisis: A Multiperspective Analysis of Russian Behaviour, by Taking into Account NATO’s and the EU’s Enlargement. Croat. Int. Relat. Rev. 2017, 23, 259–287. [Google Scholar] [CrossRef]
- Usmission About NATO—U.S. Mission to the North Atlantic Treaty Organization. Available online: https://nato.usmission.gov/about-nato/ (accessed on 13 December 2022).
- Cebotari, S.; Guctu, I. The Russia-Ukraine War. Causes of Emergence. Relat. Int. Plus 2022, 21, 89–96. [Google Scholar] [CrossRef]
- Kusa, I. Russia-Ukraine War. Policy Perspect. 2022, 19, 7–12. [Google Scholar] [CrossRef]
- Romanyshyn, M. Rule-Based Sentiment Analysis of Ukrainian Reviews. Int. J. Artif. Intell. Appl. 2013, 4, 103. [Google Scholar] [CrossRef]
- Park, C.Y.; Mendelsohn, J.; Field, A.; Tsvetkov, Y. VoynaSlov: A Data Set of Russian Social Media Activity during the 2022 Ukraine-Russia War. arXiv 2022, arXiv:2205.12382. [Google Scholar]
- Chen, E.; Ferrara, E. Tweets in time of conflict: A public dataset tracking the twitter discourse on the war between Ukraine and Russia. arXiv 2022, arXiv:2203.07488. Available online: https://github.com/echen102/ukraine-russia (accessed on 18 May 2022).
- Sullivan, B. Russia’s at War with Ukraine. Here’s How We Got Here 2022. Available online: https://www.npr.org/2022/02/12/1080205477/history-ukraine-russia (accessed on 14 December 2022).
- Kahn, J. Who Is Viktor Yanukovych? The Man Putin Wants to Place Back in Power in Ukraine—Fortune. Available online: https://fortune.com/2022/03/02/viktor-yanukovych-yanukovich-putin-put-back-in-power-ukraine-russia/ (accessed on 16 December 2022).
- Reuters Timeline: The Events Leading up to Russia’s Invasion of Ukraine—Reuters. Available online: https://www.reuters.com/world/europe/events-leading-up-russias-invasion-ukraine-2022-02-28/ (accessed on 16 December 2022).
- Pereira, I.; Reevell, P. What to Know about Ukrainian President Volodymyr Zelenskyy—ABC News. Available online: https://abcnews.go.com/International/ukrainian-president-volodymyr-zelenskyy/story?id=83085078 (accessed on 16 December 2022).
- McGee, L.; Princewill, N. World Leaders Respond to Ukraine Invasion, as Fresh Sanctions Await Russia—CNN. Available online: https://www.cnn.com/2022/02/24/europe/global-response-to-russia-ukraine-intl/index.html (accessed on 16 December 2022).
- Hasan, M.R.; Maliha, M.; Arifuzzaman, M. Sentiment Analysis with NLP on Twitter Data. In Proceedings of the 2019 International Conference on Computer, Communication, Chemical, Materials and Electronic Engineering (IC4ME2), Rajshahi, Bangladesh, 11–12 July 2019; pp. 1–4. [Google Scholar]
- Virmani, C.; Pillai, A.; Juneja, D. Extracting Information from Social Network Using Nlp. Int. J. Comput. Intell. Res. 2017, 13, 621–630. [Google Scholar]
- Malte, A.; Ratadiya, P. Evolution of Transfer Learning in Natural Language Processing. arXiv 2019, arXiv:1910.07370. [Google Scholar]
- Wiedemann, G.; Ruppert, E.; Jindal, R.; Biemann, C. Transfer Learning from Lda to Bilstm-Cnn for Offensive Language Detection in Twitter. arXiv 2018, arXiv:1811.02906. [Google Scholar]
- Kamath, R.; Ghoshal, A.; Eswaran, S.; Honnavalli, P.B. Emoroberta: An Enhanced Emotion Detection Model Using Roberta. In Proceedings of the IEEE International Conference on Electronics, Computing and Communication Technologies, Bangalore, India, 8–10 July 2022. [Google Scholar]
- Liu, Y.; Ott, M.; Goyal, N.; Du, J.; Joshi, M.; Chen, D.; Levy, O.; Lewis, M.; Zettlemoyer, L.; Stoyanov, V. Roberta: A Robustly Optimized Bert Pretraining Approach. arXiv 2019, arXiv:1907.11692. [Google Scholar]
- Demszky, D.; Movshovitz-Attias, D.; Ko, J.; Cowen, A.; Nemade, G.; Ravi, S. GoEmotions: A Dataset of Fine-Grained Emotions. In Proceedings of the 58th Annual Meeting of the Association for Computational Linguistics, Online, 5–10 July 2020; pp. 4040–4054. [Google Scholar]
- Devlin, J.; Chang, M.-W.; Lee, K.; Toutanova, K. Bert: Pre-Training of Deep Bidirectional Transformers for Language Understanding. arXiv 2018, arXiv:1810.04805. [Google Scholar]
- Alkaabi, N.; Zaki, N.; Ismail, H.; Khan, M. Detecting Emotions behind the Screen. AI 2022, 3, 948–960. [Google Scholar] [CrossRef]
- Ekman, P. Are There Basic Emotions? Psychol. Rev. 1992, 99, 550–553. [Google Scholar] [CrossRef]
- Hugging Face Arpanghoshal/EmoRoBERTa Hugging Face. Available online: https://huggingface.co/arpanghoshal/EmoRoBERTa (accessed on 13 December 2022).
- Vaishnavi, V.K. Design Science Research Methods and Patterns: Innovating Information and Communication Technology; Auerbach Publications: Boca Raton, FL, USA, 2007. [Google Scholar]
- Carey, J.; Carlson, B. Introduction to Developing Object-Oriented Frameworks; Addison-Wesley: Boston, MA, USA, 2002. [Google Scholar]
- Kadhim, A.I. Survey on Supervised Machine Learning Techniques for Automatic Text Classification. Artif. Intell. Rev. 2019, 52, 273–292. [Google Scholar] [CrossRef]
- Rathje, J.; Katila, R.; Reineke, P. Making the Most of Supervised Machine Learning in Strategy. Available online: https://mackinstitute.wharton.upenn.edu/wp-content/uploads/2022/03/Katila-Riitta-Reineke-Phil-and-Rathje-Jason_Making-the-Most-of-Supervised-Machine-Learning-in-Strategy.pdf (accessed on 13 December 2022).
- Sebastiani, F. Machine Learning in Automated Text Categorization. ACM Comput. Surv. 2002, 34, 1–47. [Google Scholar] [CrossRef]
- Driessens, K.; Reutemann, P.; Pfahringer, B.; Leschi, C. Using Weighted Nearest Neighbor to Benefit from Unlabeled Data. In Proceedings of the Pacific-Asia Conference on Knowledge Discovery and Data Mining, Long Beach, CA, USA, 6–10 August 2006; pp. 60–69. [Google Scholar]
- Hong, J.; Cho, S.-B. Incremental Support Vector Machine for Unlabeled Data Classification. In Proceedings of the 9th International Conference on Neural Information Processing, ICONIP’02, Singapore, 18–22 November 2002; Volume 3, pp. 1403–1407. [Google Scholar]
- Vittaut, J.-N.; Amini, M.-R.; Gallinari, P. Learning Classification with Both Labeled and Unlabeled Data. In Proceedings of the European Conference on Machine Learning, Helsinki, Finland, 19–23 August 2002; pp. 468–479. [Google Scholar]
- Zakeri, B.; Paulavets, K.; Barreto-Gomez, L.; Echeverri, L.G.; Pachauri, S.; Boza-Kiss, B.; Zimm, C.; Rogelj, J.; Creutzig, F.; Ürge-Vorsatz, D.; et al. Pandemic, War, and Global Energy Transitions. Energies 2022, 15, 6114. [Google Scholar] [CrossRef]
- Jahanshahi, H.; Uzun, S.; Kaçar, S.; Yao, Q.; Alassafi, M.O. Artificial Intelligence-Based Prediction of Crude Oil Prices Using Multiple Features under the Effect of Russia--Ukraine War and COVID-19 Pandemic. Mathematics 2022, 10, 4361. [Google Scholar] [CrossRef]
- Ben Hassen, T.; El Bilali, H. Impacts of the Russia-Ukraine War on Global Food Security: Towards More Sustainable and Resilient Food Systems? Foods 2022, 11, 2301. [Google Scholar] [CrossRef]
- Lewtak, K.; Kanecki, K.; Tyszko, P.; Goryński, P.; Kosińska, I.; Poznańska, A.; Rząd, M.; Nitsch-Osuch, A. Hospitalizations of Ukrainian Migrants and Refugees in Poland in the Time of the Russia-Ukraine Conflict. Int. J. Environ. Res. Public Health 2022, 19, 13350. [Google Scholar] [CrossRef] [PubMed]
- Alam, M.K.; Tabash, M.I.; Billah, M.; Kumar, S.; Anagreh, S. The Impacts of the Russia—Ukraine Invasion on Global Markets and Commodities: A Dynamic Connectedness among G7 and BRIC Markets. J. Risk Financ. Manag. 2022, 15, 352. [Google Scholar] [CrossRef]
- Ibar-Alonso, R.; Quiroga-Garcia, R.; Arenas-Parra, M.; Quiroga-García, R.; Arenas-Parra, M. Opinion Mining of Green Energy Sentiment: A Russia-Ukraine Conflict Analysis. Mathematics 2022, 10, 2532. [Google Scholar] [CrossRef]
- Agarwal, N.S.; Punn, N.S.; Sonbhadra, S.K. Exploring Public Opinion Dynamics on the Verge of World War III Using Russia-Ukraine War-Tweets Dataset; KDD-UC: Washington, DC, USA, 2022. [Google Scholar]
- Martinho, V.J.P.D. Impacts of the COVID-19 Pandemic and the Russia–Ukraine Conflict on Land Use across the World. Land 2022, 11, 1614. [Google Scholar] [CrossRef]
- Guarino, A.; Malandrino, D.; Zaccagnino, R. An Automatic Mechanism to Provide Privacy Awareness and Control over Unwittingly Dissemination of Online Private Information. Comput. Netw. 2022, 202, 108614. [Google Scholar] [CrossRef]
- del Gobbo, E.; Fontanella, S.; Sarra, A.; Fontanella, L. Emerging Topics in Brexit Debate on Twitter Around the Deadlines. Soc. Indic. Res. 2021, 156, 669–688. [Google Scholar] [CrossRef]
- Lee, E.; Rustam, F.; Ashraf, I.; Washington, P.B.; Narra, M.; Shafique, R. Inquest of Current Situation in Afghanistan Under Taliban Rule Using Sentiment Analysis and Volume Analysis. IEEE Access 2022, 10, 10333–10348. [Google Scholar] [CrossRef]
- Cosimato, A.; De Prisco, R.; Guarino, A.; Malandrino, D.; Lettieri, N.; Sorrentino, G.; Zaccagnino, R. The Conundrum of Success in Music: Playing It or Talking About It? IEEE Access 2019, 7, 123289–123298. [Google Scholar] [CrossRef]
- Karyukin, V.; Zhumabekova, A.; Yessenzhanova, S. Machine Learning and Neural Network Methodologies of Analyzing Social Media. In Proceedings of the 6th International Conference on Engineering & MIS 2020, Almaty, Kazakhstan, 14–16 September 2020; Association for Computing Machinery: New York, NY, USA, 2020. [Google Scholar]
- Nganji, J.T.; Cockburn, L. Use of Twitter in the Cameroon Anglophone Crisis. Behav. Inf. Technol. 2020, 39, 267–287. [Google Scholar] [CrossRef]
- Džubur, B.; Trojer, Ž.; Zrimšek, U. Semantic Analysis of Russo-Ukrainian War Tweet Networks; SCORES: Ljubljana, Slovenia, 2022. [Google Scholar]
- Guarino, A.; Lettieri, N.; Malandrino, D.; Zaccagnino, R.; Capo, C. Adam or Eve? Automatic Users’ Gender Classification via Gestures Analysis on Touch Devices. Neural Comput. Appl. 2022, 34, 18473–18495. [Google Scholar] [CrossRef]
- Dong, X.L.; Rekatsinas, T. Data Integration and Machine Learning: A Natural Synergy. In Proceedings of the 2018 International Conference on Management of Data, Houston, TX, USA, 10–15 June 2018; Association for Computing Machinery: New York, NY, USA, 2018; pp. 1645–1650. [Google Scholar]
- Zhuang, F.; Qi, Z.; Duan, K.; Xi, D.; Zhu, Y.; Zhu, H.; Xiong, H.; He, Q. A Comprehensive Survey on Transfer Learning. Proc. IEEE 2021, 109, 43–76. [Google Scholar] [CrossRef]
- Kaggle Ukraine Russia War Twitter Dataset 2022—Kaggle. Available online: https://www.kaggle.com/datasets/kumari2000/ukraine-russia-war-twitter-dataset-2022 (accessed on 13 December 2022).
- Wang, C.; Cho, K.; Gu, J. Neural Machine Translation with Byte-Level Subwords. In Proceedings of the AAAI Conference on Artificial Intelligence, New York, NY, USA, 7–12 February 2020; Volume 34, pp. 9154–9160. [Google Scholar]
- Hugging Face Summary of the Tokenizers. Available online: https://huggingface.co/docs/transformers/tokenizer_summary (accessed on 16 December 2022).
- Tripathi, V.; Joshi, A.; Bhattacharyya, P. Emotion Analysis from Text: A Survey. Cent. Indian Lang. Technol. Surv. 2016, 11, 66–69. [Google Scholar]
- Wen, S.; Wan, X. Emotion Classification in Microblog Texts Using Class Sequential Rules. In Proceedings of the AAAI Conference on Artificial Intelligence, New York, NY, USA, 7–12 February 2014; Volume 28. [Google Scholar]
- Joachims, T. A Probabilistic Analysis of the Rocchio Algorithm with TFIDF for Text Categorization; Defense Technical Information Center: Fort Belvoir, VA, USA, 1996. [Google Scholar]
- Abbasi, N. What Is TF-IDF? Available online: https://www.educative.io/answers/what-is-tf-idf (accessed on 16 December 2022).
- Singh, A.; Thakur, N.; Sharma, A. A Review of Supervised Machine Learning Algorithms. In Proceedings of the 2016 3rd International Conference on Computing for Sustainable Global Development (INDIACom), New Delhi, India, 16–18 March 2016; pp. 1310–1315. [Google Scholar]
- Ray, S. A Quick Review of Machine Learning Algorithms. In Proceedings of the 2019 International Conference on Machine Learning, Big Data, Cloud and Parallel Computing (COMITCon), Faridabad, India, 14–16 February 2019; pp. 35–39. [Google Scholar]
- Boser, B.E.; Guyon, I.M.; Vapnik, V.N. A training algorithm for optimal margin classifiers. In Proceedings of the fifth annual workshop on Computational learning theory; Association for Computing Machinery: New York, NY, USA, 1992; pp. 144–152. [Google Scholar]
- Belson, W.A. Matching and Prediction on the Principle of Biological Classification. J. R. Stat. Soc. Ser. C Appl. Stat. 1959, 8, 65–75. [Google Scholar] [CrossRef]
- Alzubi, J.; Nayyar, A.; Kumar, A. Machine Learning from Theory to Algorithms: An Overview. Proc. J. Phys. Conf. Ser. 2018, 1142, 12012. [Google Scholar] [CrossRef]
- Breiman, L. Random Forests. Mach. Learn. 2001, 45, 5–32. [Google Scholar] [CrossRef]
- Berkson, J. Why I Prefer Logits to Probits. Biometrics 1951, 7, 327–339. [Google Scholar] [CrossRef]
- Fix, E.; Hodges, J.L., Jr. Discriminatory Analysis-Nonparametric Discrimination: Small Sample Performance; California Univ Berkeley: Berkeley, CA, USA, 1952. [Google Scholar]
- Navlani, A.; Naviani, A. KNN Classification Tutorial Using Sklearn Python—DataCamp. Available online: https://www.datacamp.com/tutorial/k-nearest-neighbor-classification-scikit-learn (accessed on 13 December 2022).
- Mahesh, B. Machine Learning Algorithms—A Review. Int. J. Sci. Res. (IJSR) 2020, 9, 381–386. [Google Scholar]
- Freund, Y.; Schapire, R.E. Experiments with a New Boosting Algorithm. In Icml; Citeseer: Princeton, NJ, USA, 1996; Volume 96, pp. 148–156. [Google Scholar]
- Rosenblatt, F. Principles of Neurodynamics. Perceptrons and the Theory of Brain Mechanisms; Cornell Aeronautical Lab Inc.: Buffalo NY, USA, 1961. [Google Scholar]
- Taud, H.; Mas, J.F. Multilayer Perceptron (MLP). In Geomatic Approaches for Modeling Land Change Scenarios; Springer: Berlin/Heidelberg, Germany, 2018; pp. 451–455. [Google Scholar]
- Powers, D.M. Evaluation: From Precision, Recall and f-Measure to Roc, Informedness, Markedness and Correlation. Int. J. Mach. Learn. Technol. 2011, 2, 37–63. [Google Scholar]
- Jash, A. Why India’s Neutral Stance in the Russia-Ukraine War Works, Politics News—ThinkChina. Available online: https://www.thinkchina.sg/why-indias-neutral-stance-russia-ukraine-war-works (accessed on 16 December 2022).
- Swaran, S. Why India Chose a Path of “proactive Neutrality” on Ukraine. Available online: https://theconversation.com/why-india-chose-a-path-of-proactive-neutrality-on-ukraine-182403 (accessed on 16 December 2022).
- NPR. In Russia’s War on Ukraine, India Has Remained Neutral. Will It Stay That Way? NPR. Available online: https://www.npr.org/2022/04/01/1090192863/in-russias-war-on-ukraine-india-has-remained-neutral-will-it-stay-that-way (accessed on 16 December 2022).
- Li, C.; Zhi, X.; Ma, J.; Cui, Z.; Zhu, Z.; Zhang, C.; Hu, L. Performance Comparison between Logistic Regression, Decision Trees, and Multilayer Perceptron in Predicting Peripheral Neuropathy in Type 2 Diabetes Mellitus. Chin. Med. J. 2012, 125, 851–857. [Google Scholar]
Disclaimer/Publisher’s Note: The statements, opinions and data contained in all publications are solely those of the individual author(s) and contributor(s) and not of MDPI and/or the editor(s). MDPI and/or the editor(s) disclaim responsibility for any injury to people or property resulting from any ideas, methods, instructions or products referred to in the content. |
© 2023 by the authors. Licensee MDPI, Basel, Switzerland. This article is an open access article distributed under the terms and conditions of the Creative Commons Attribution (CC BY) license (https://creativecommons.org/licenses/by/4.0/).