
A Systematic Approach for Developing a Robust Artwork Recognition Framework Using Smartphone Cameras


Abstract
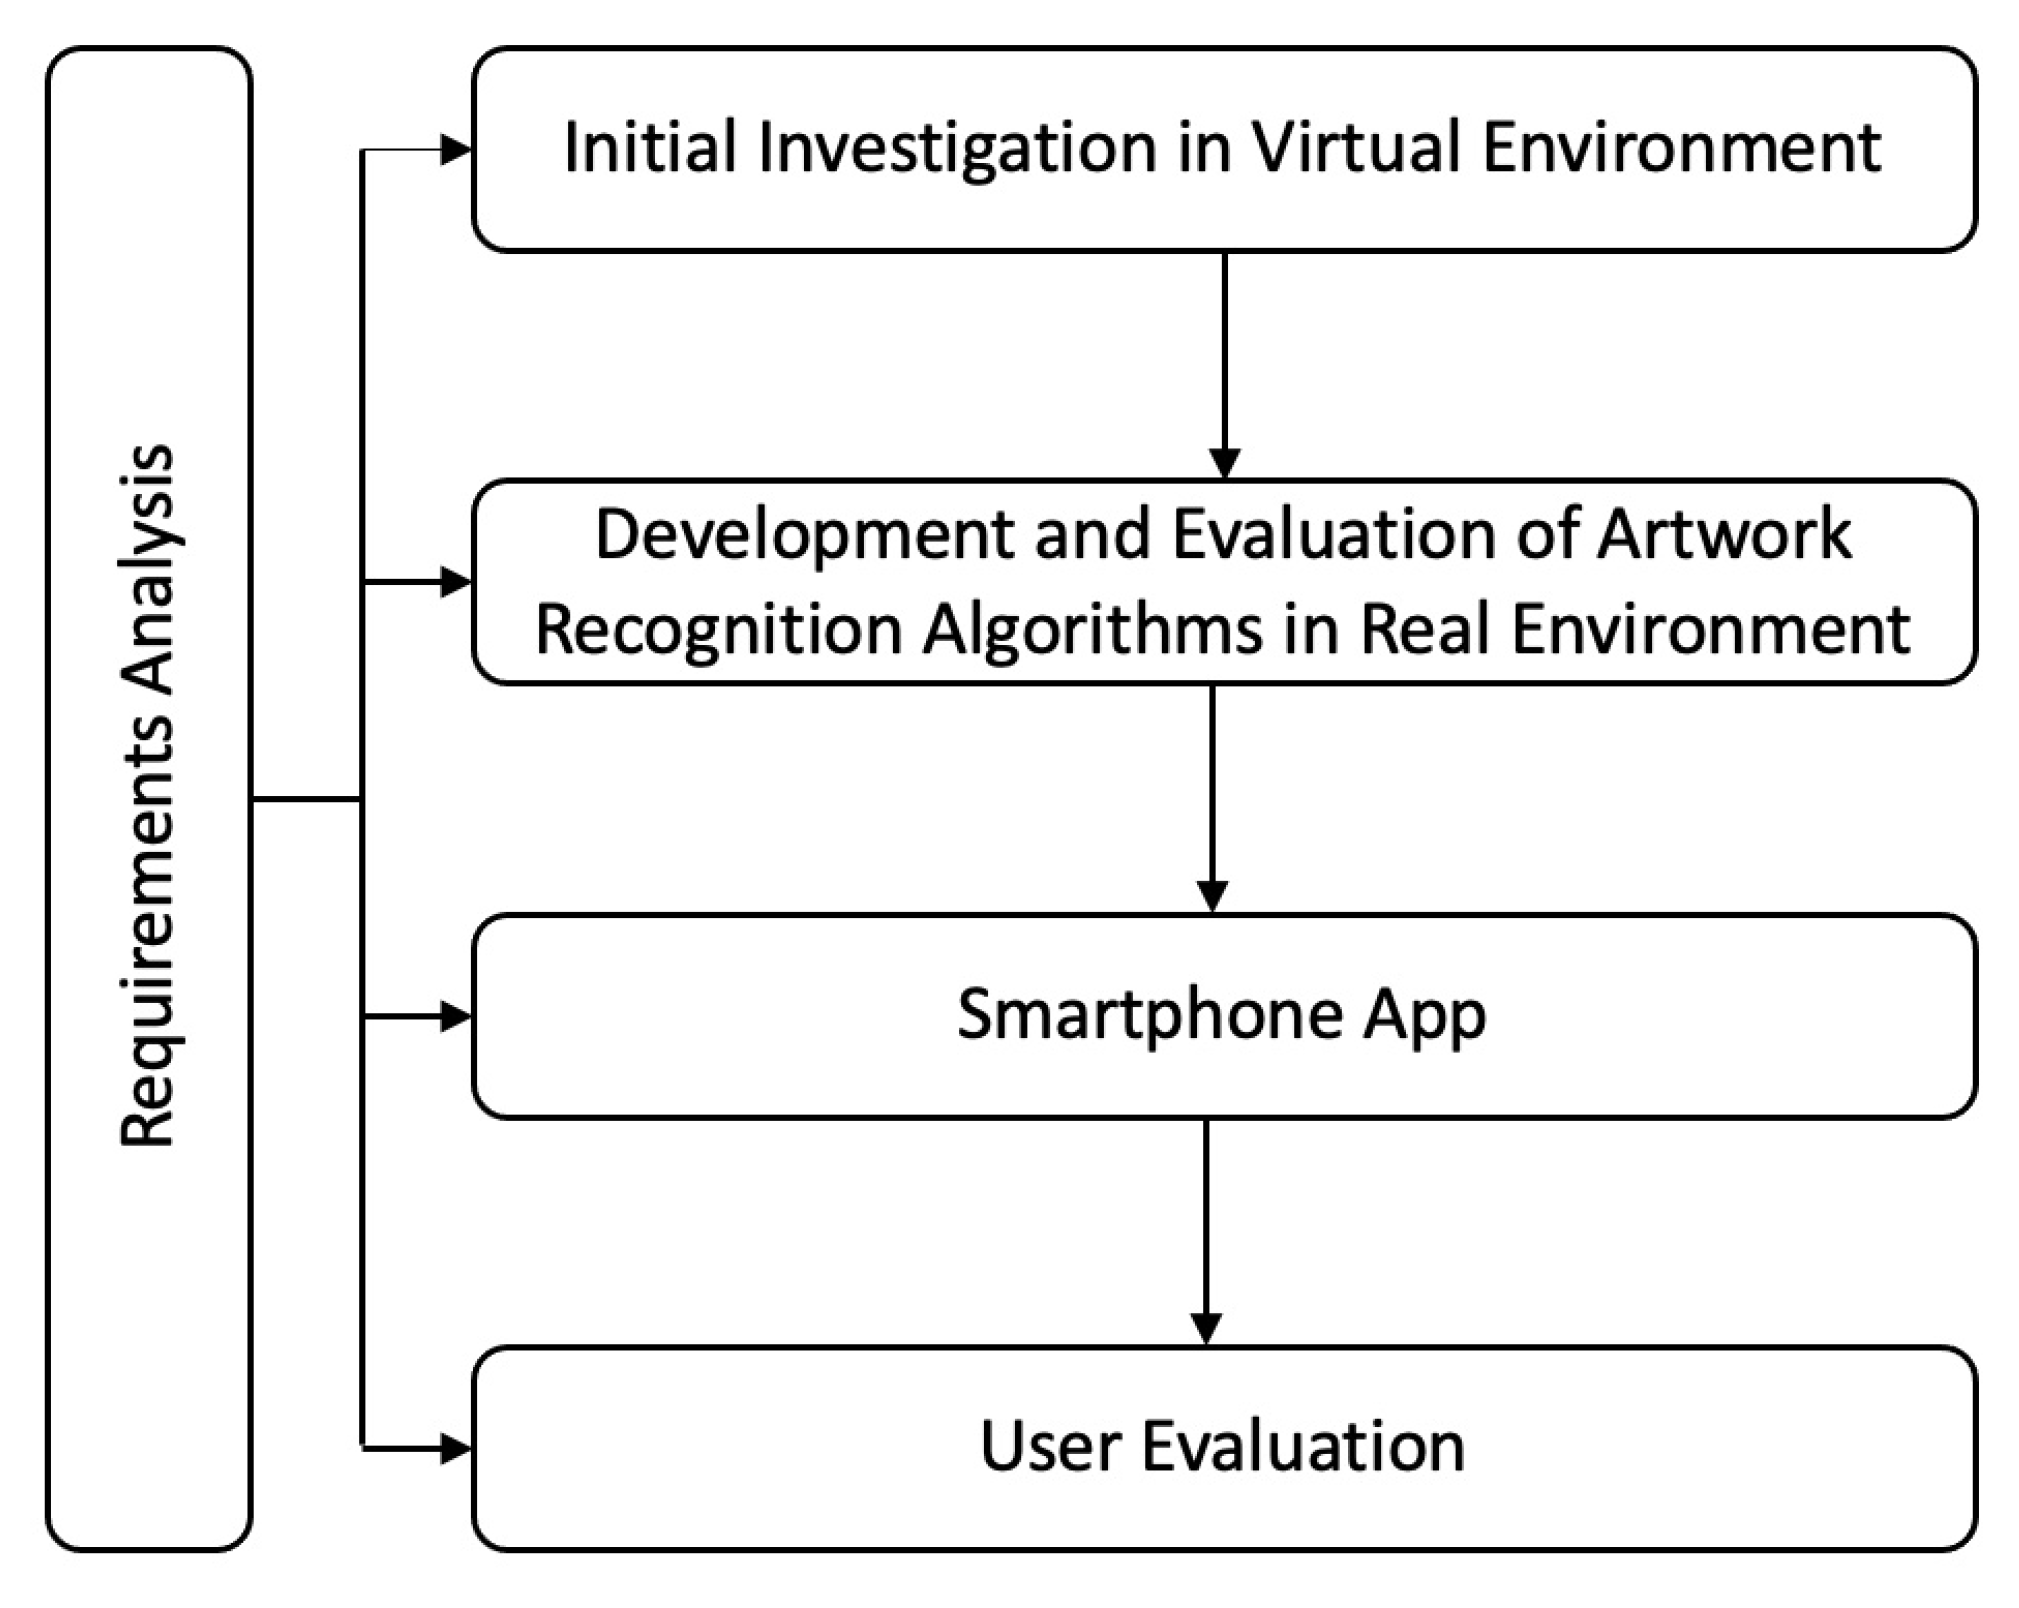
:1. Introduction
2. Literature Review
3. Preliminary Investigations in a Virtual Environment
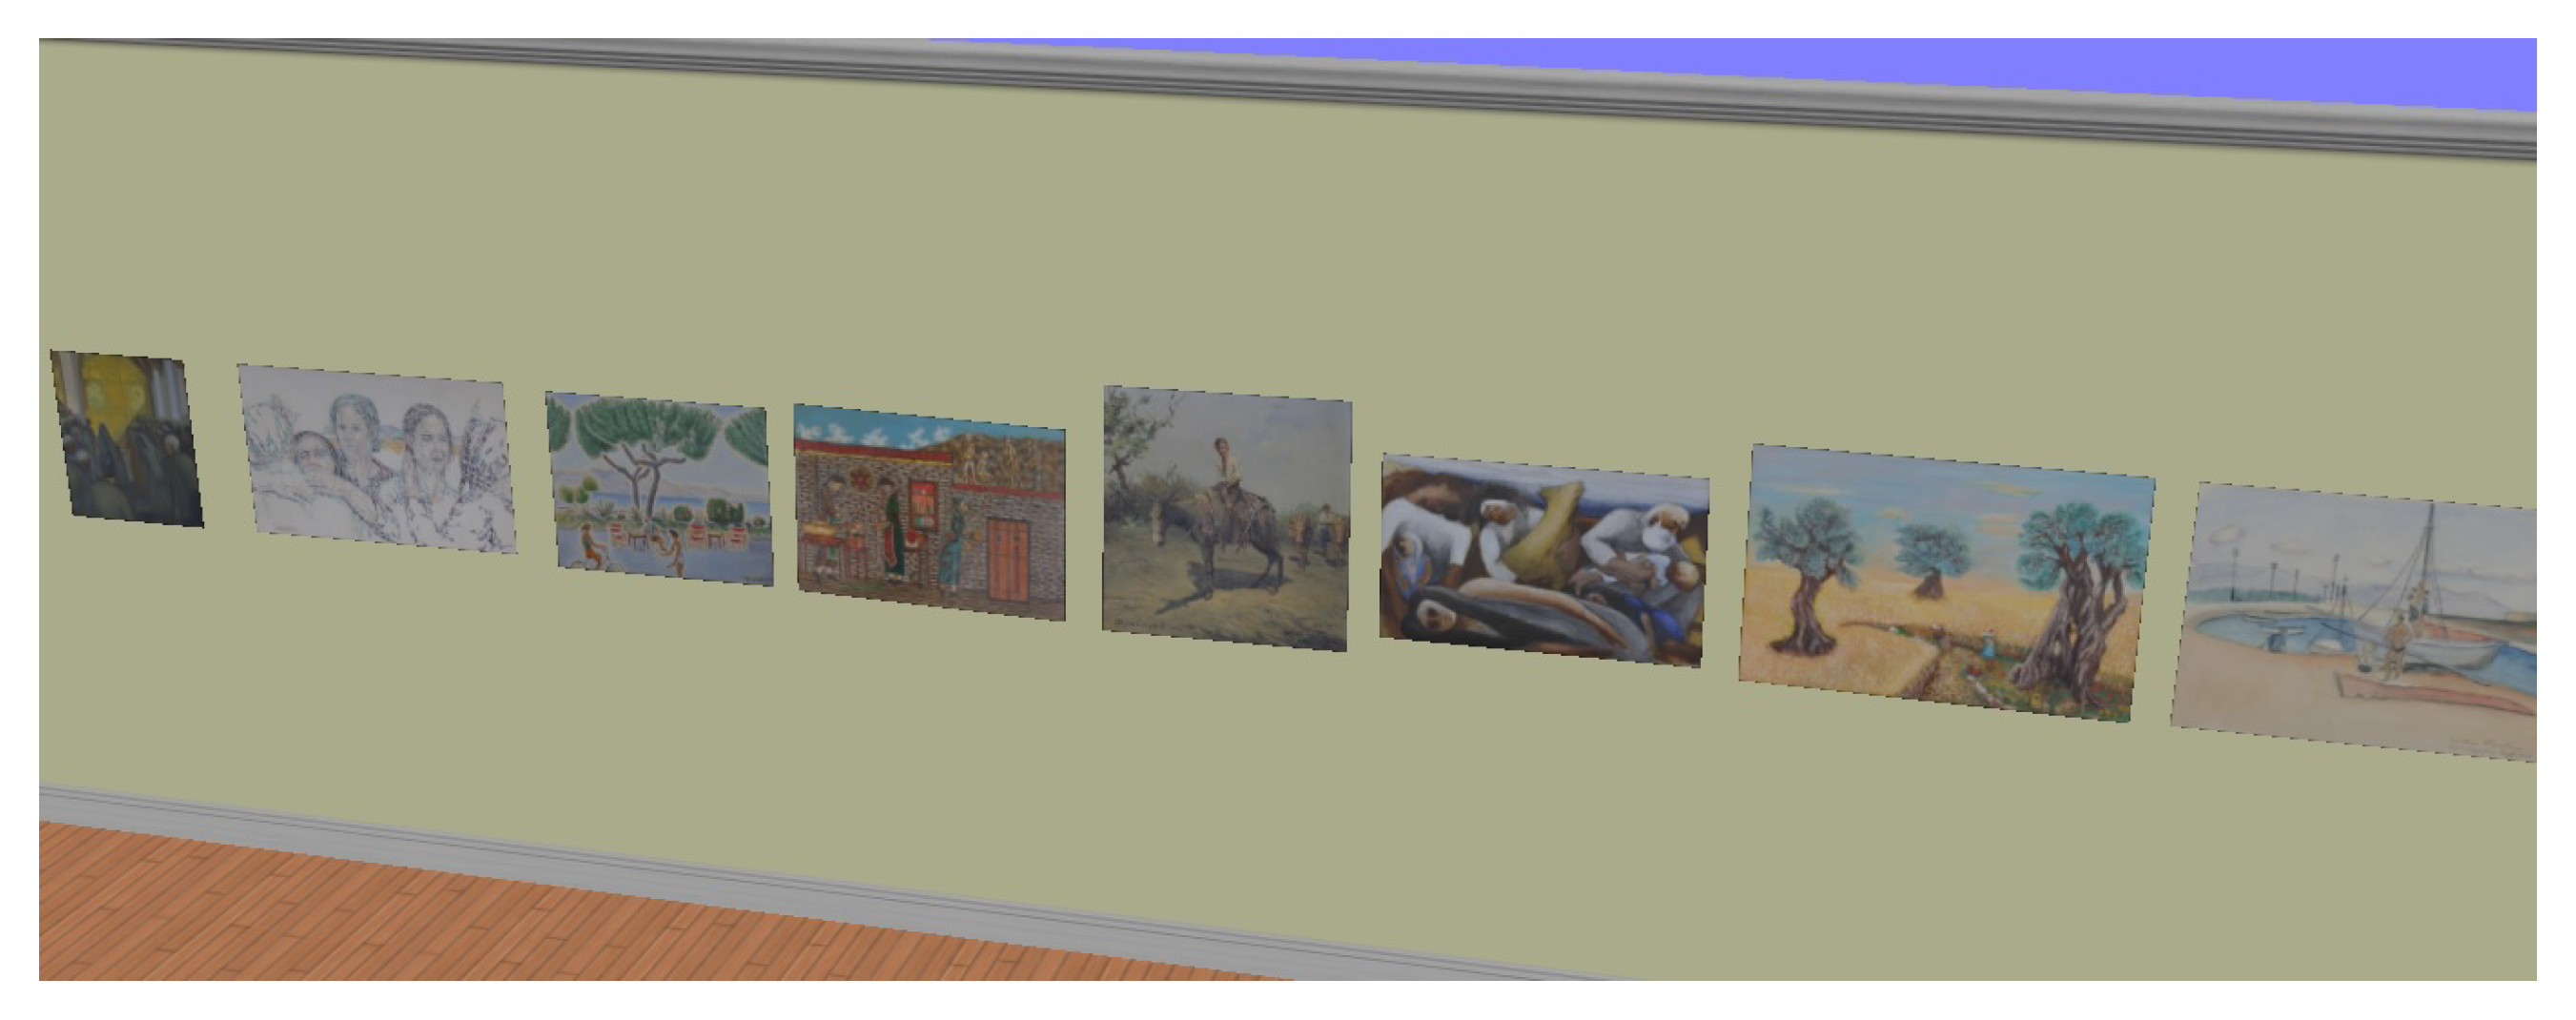
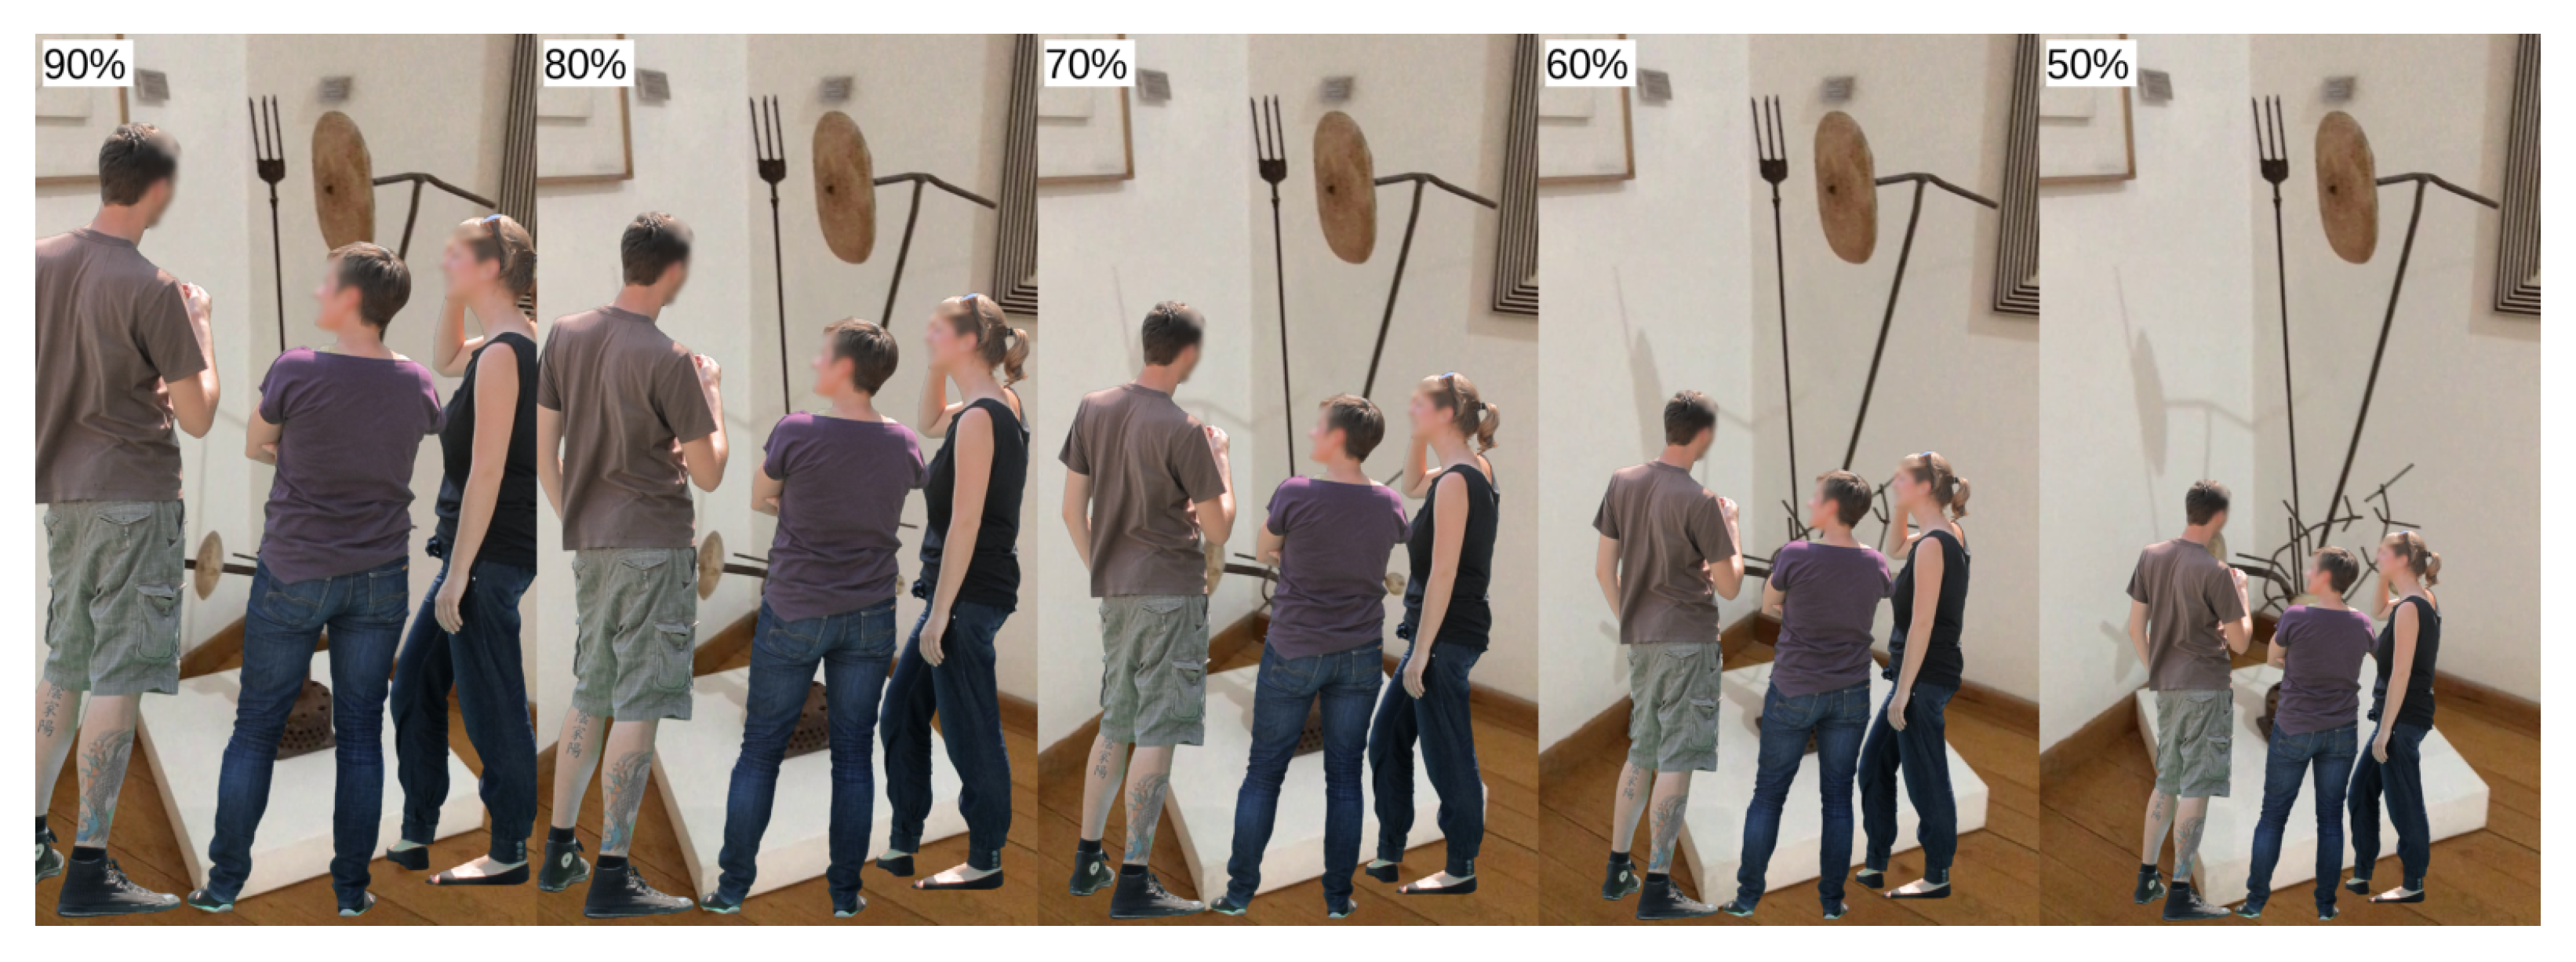
3.1. Virtual Environment
3.2. Paintings Classification
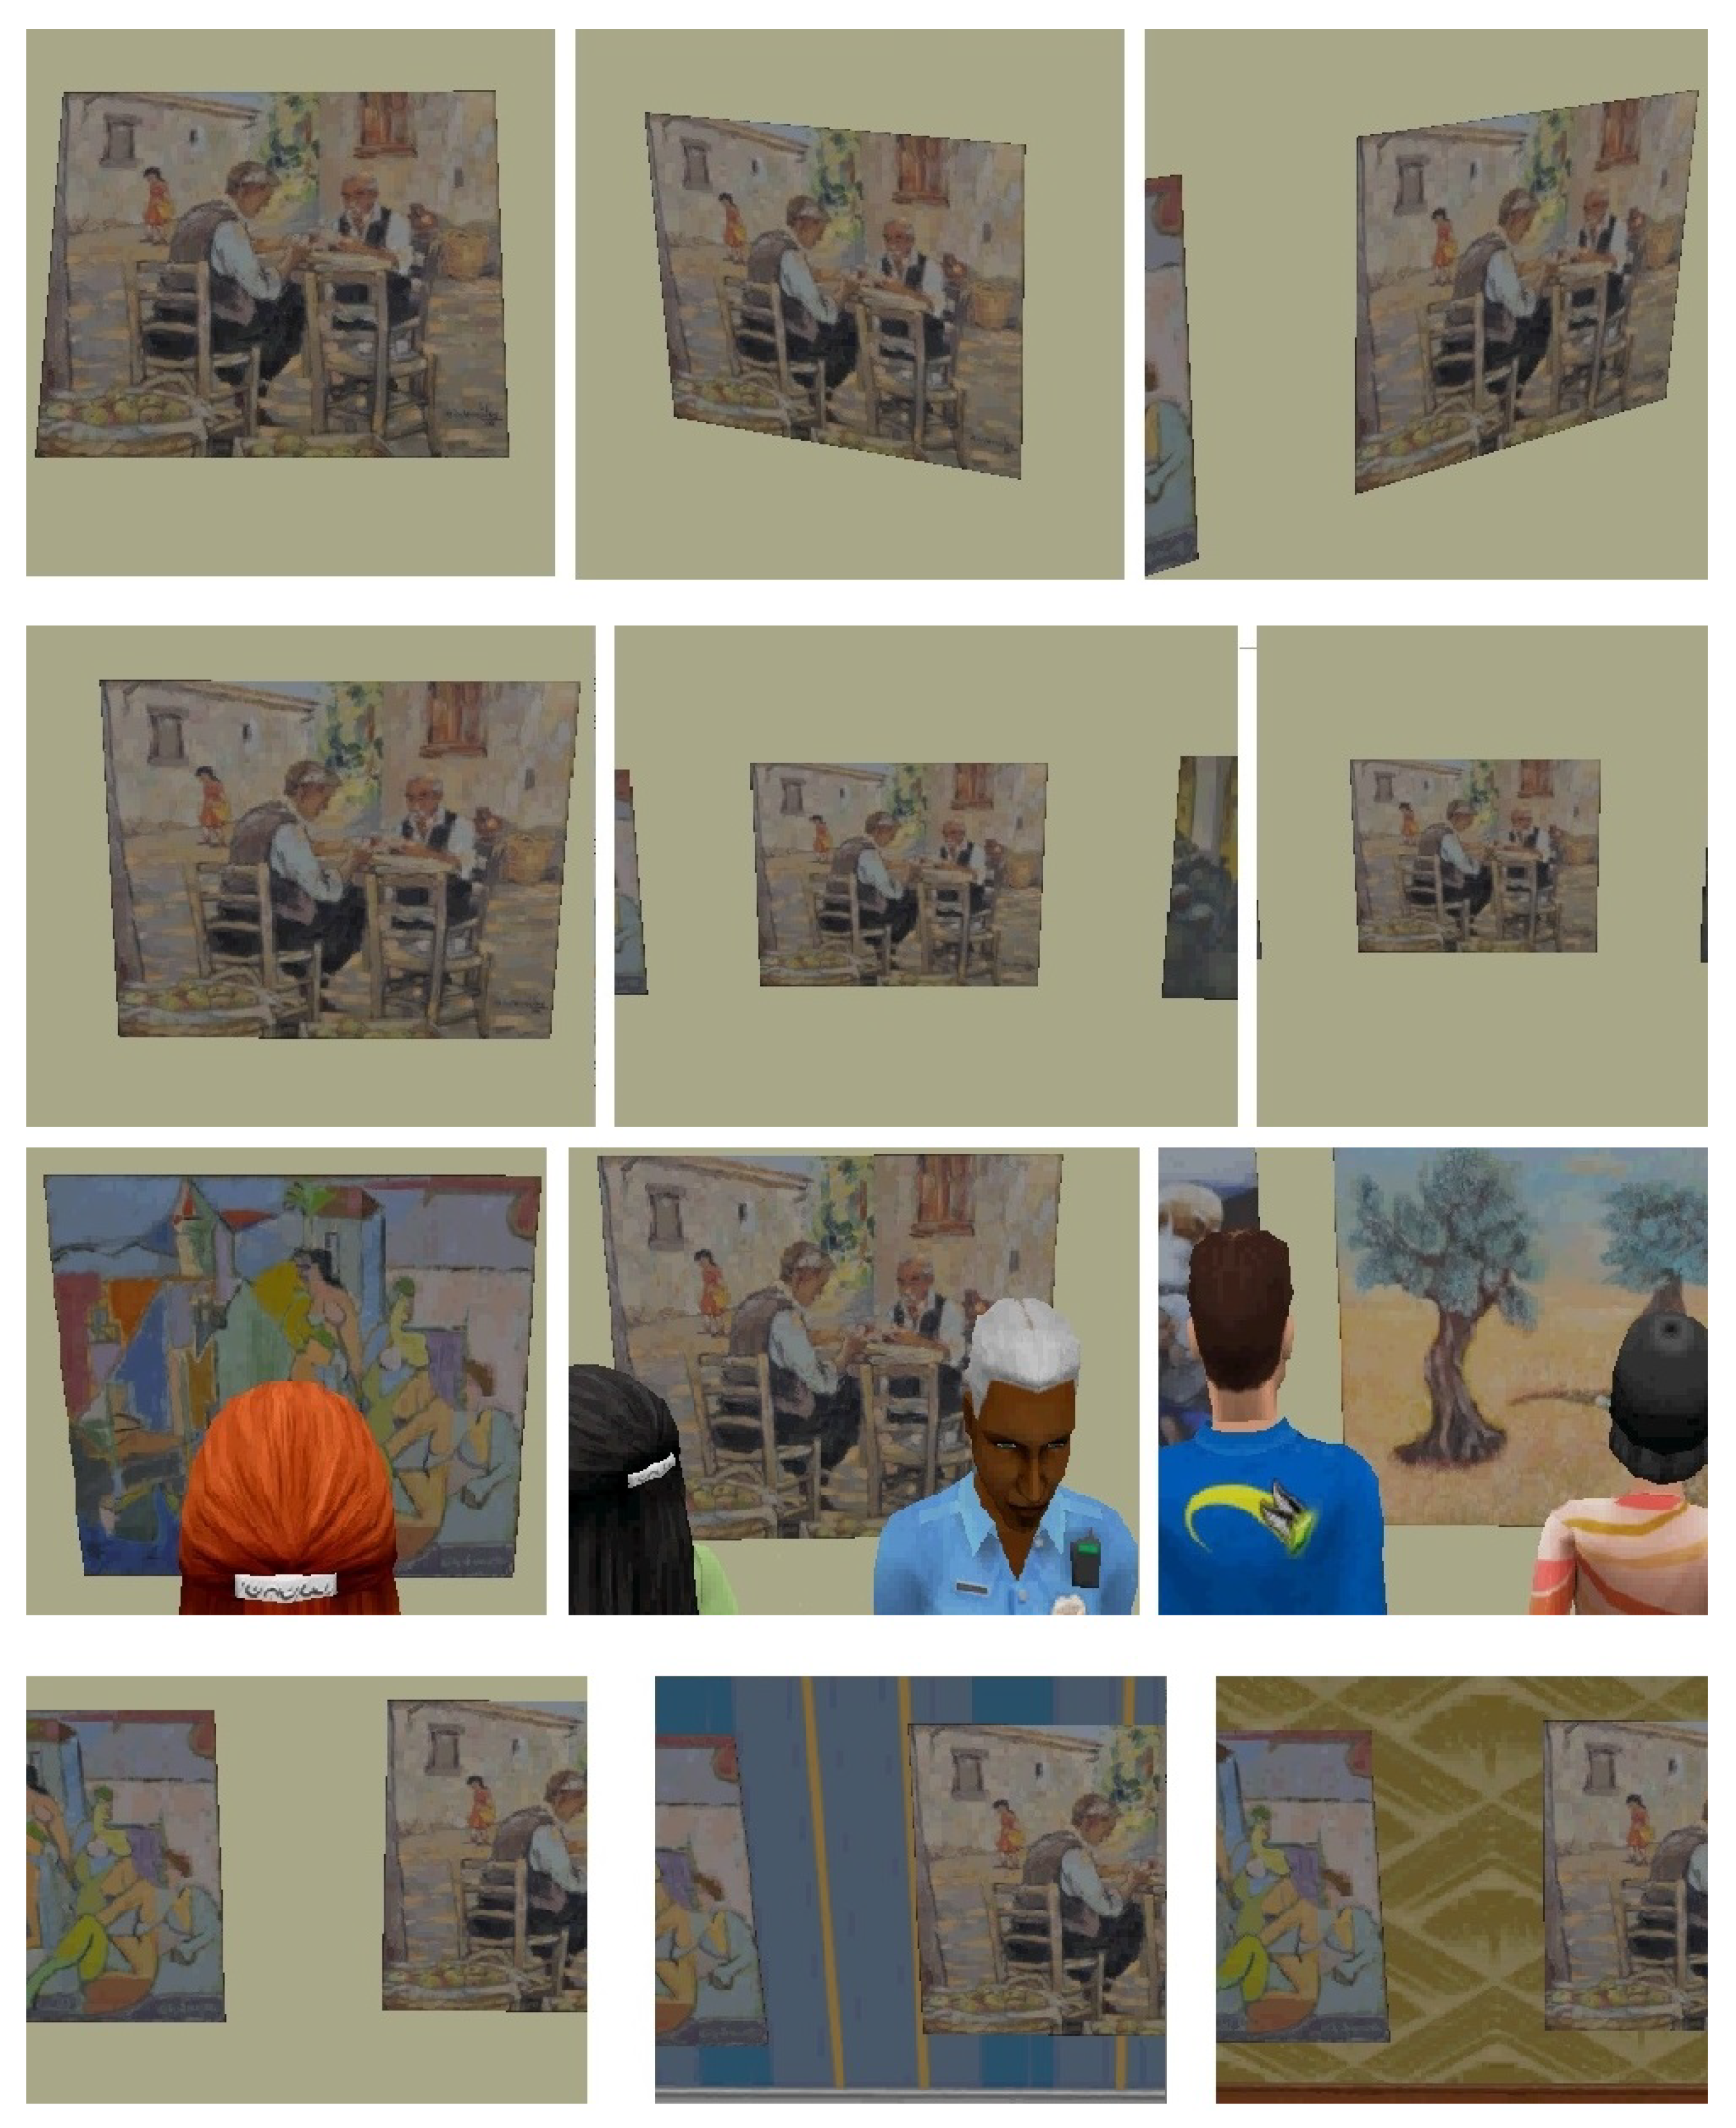
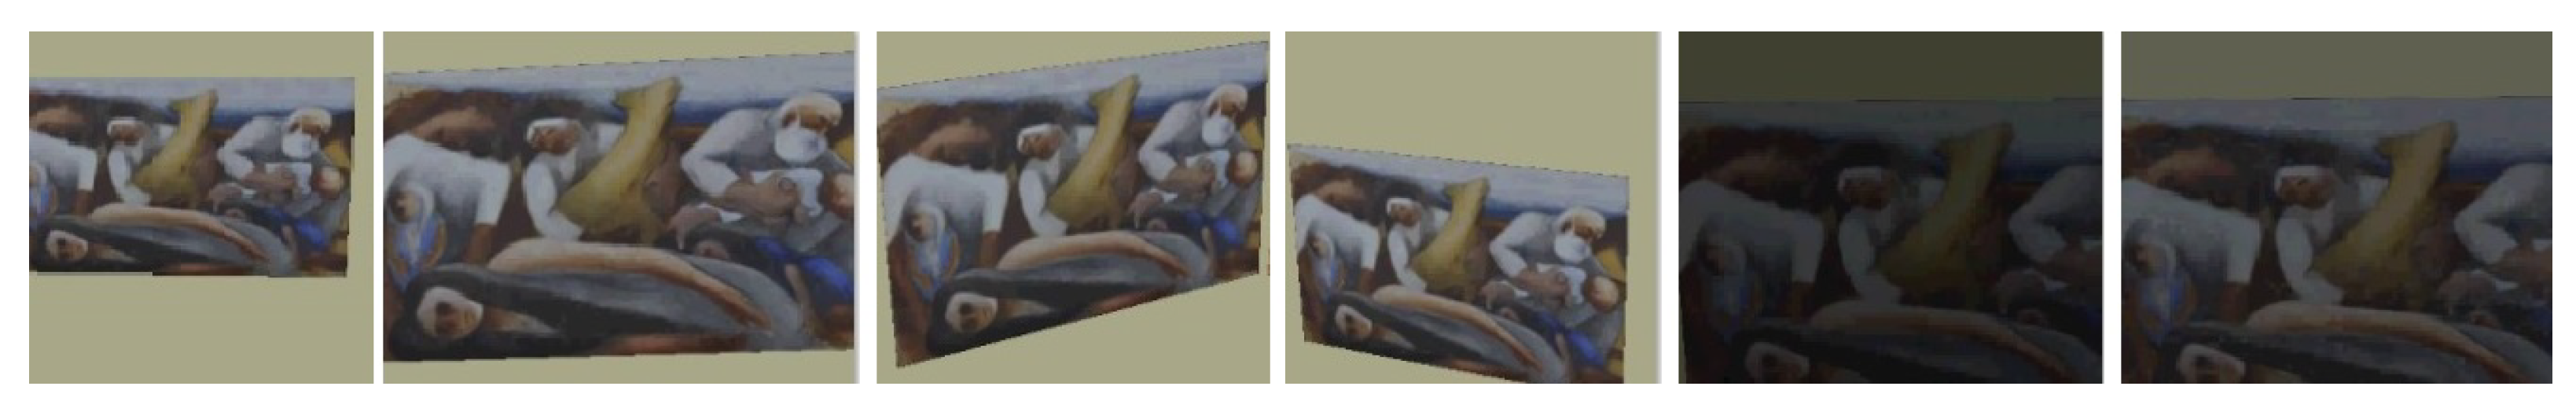
3.3. Experimental Evaluation
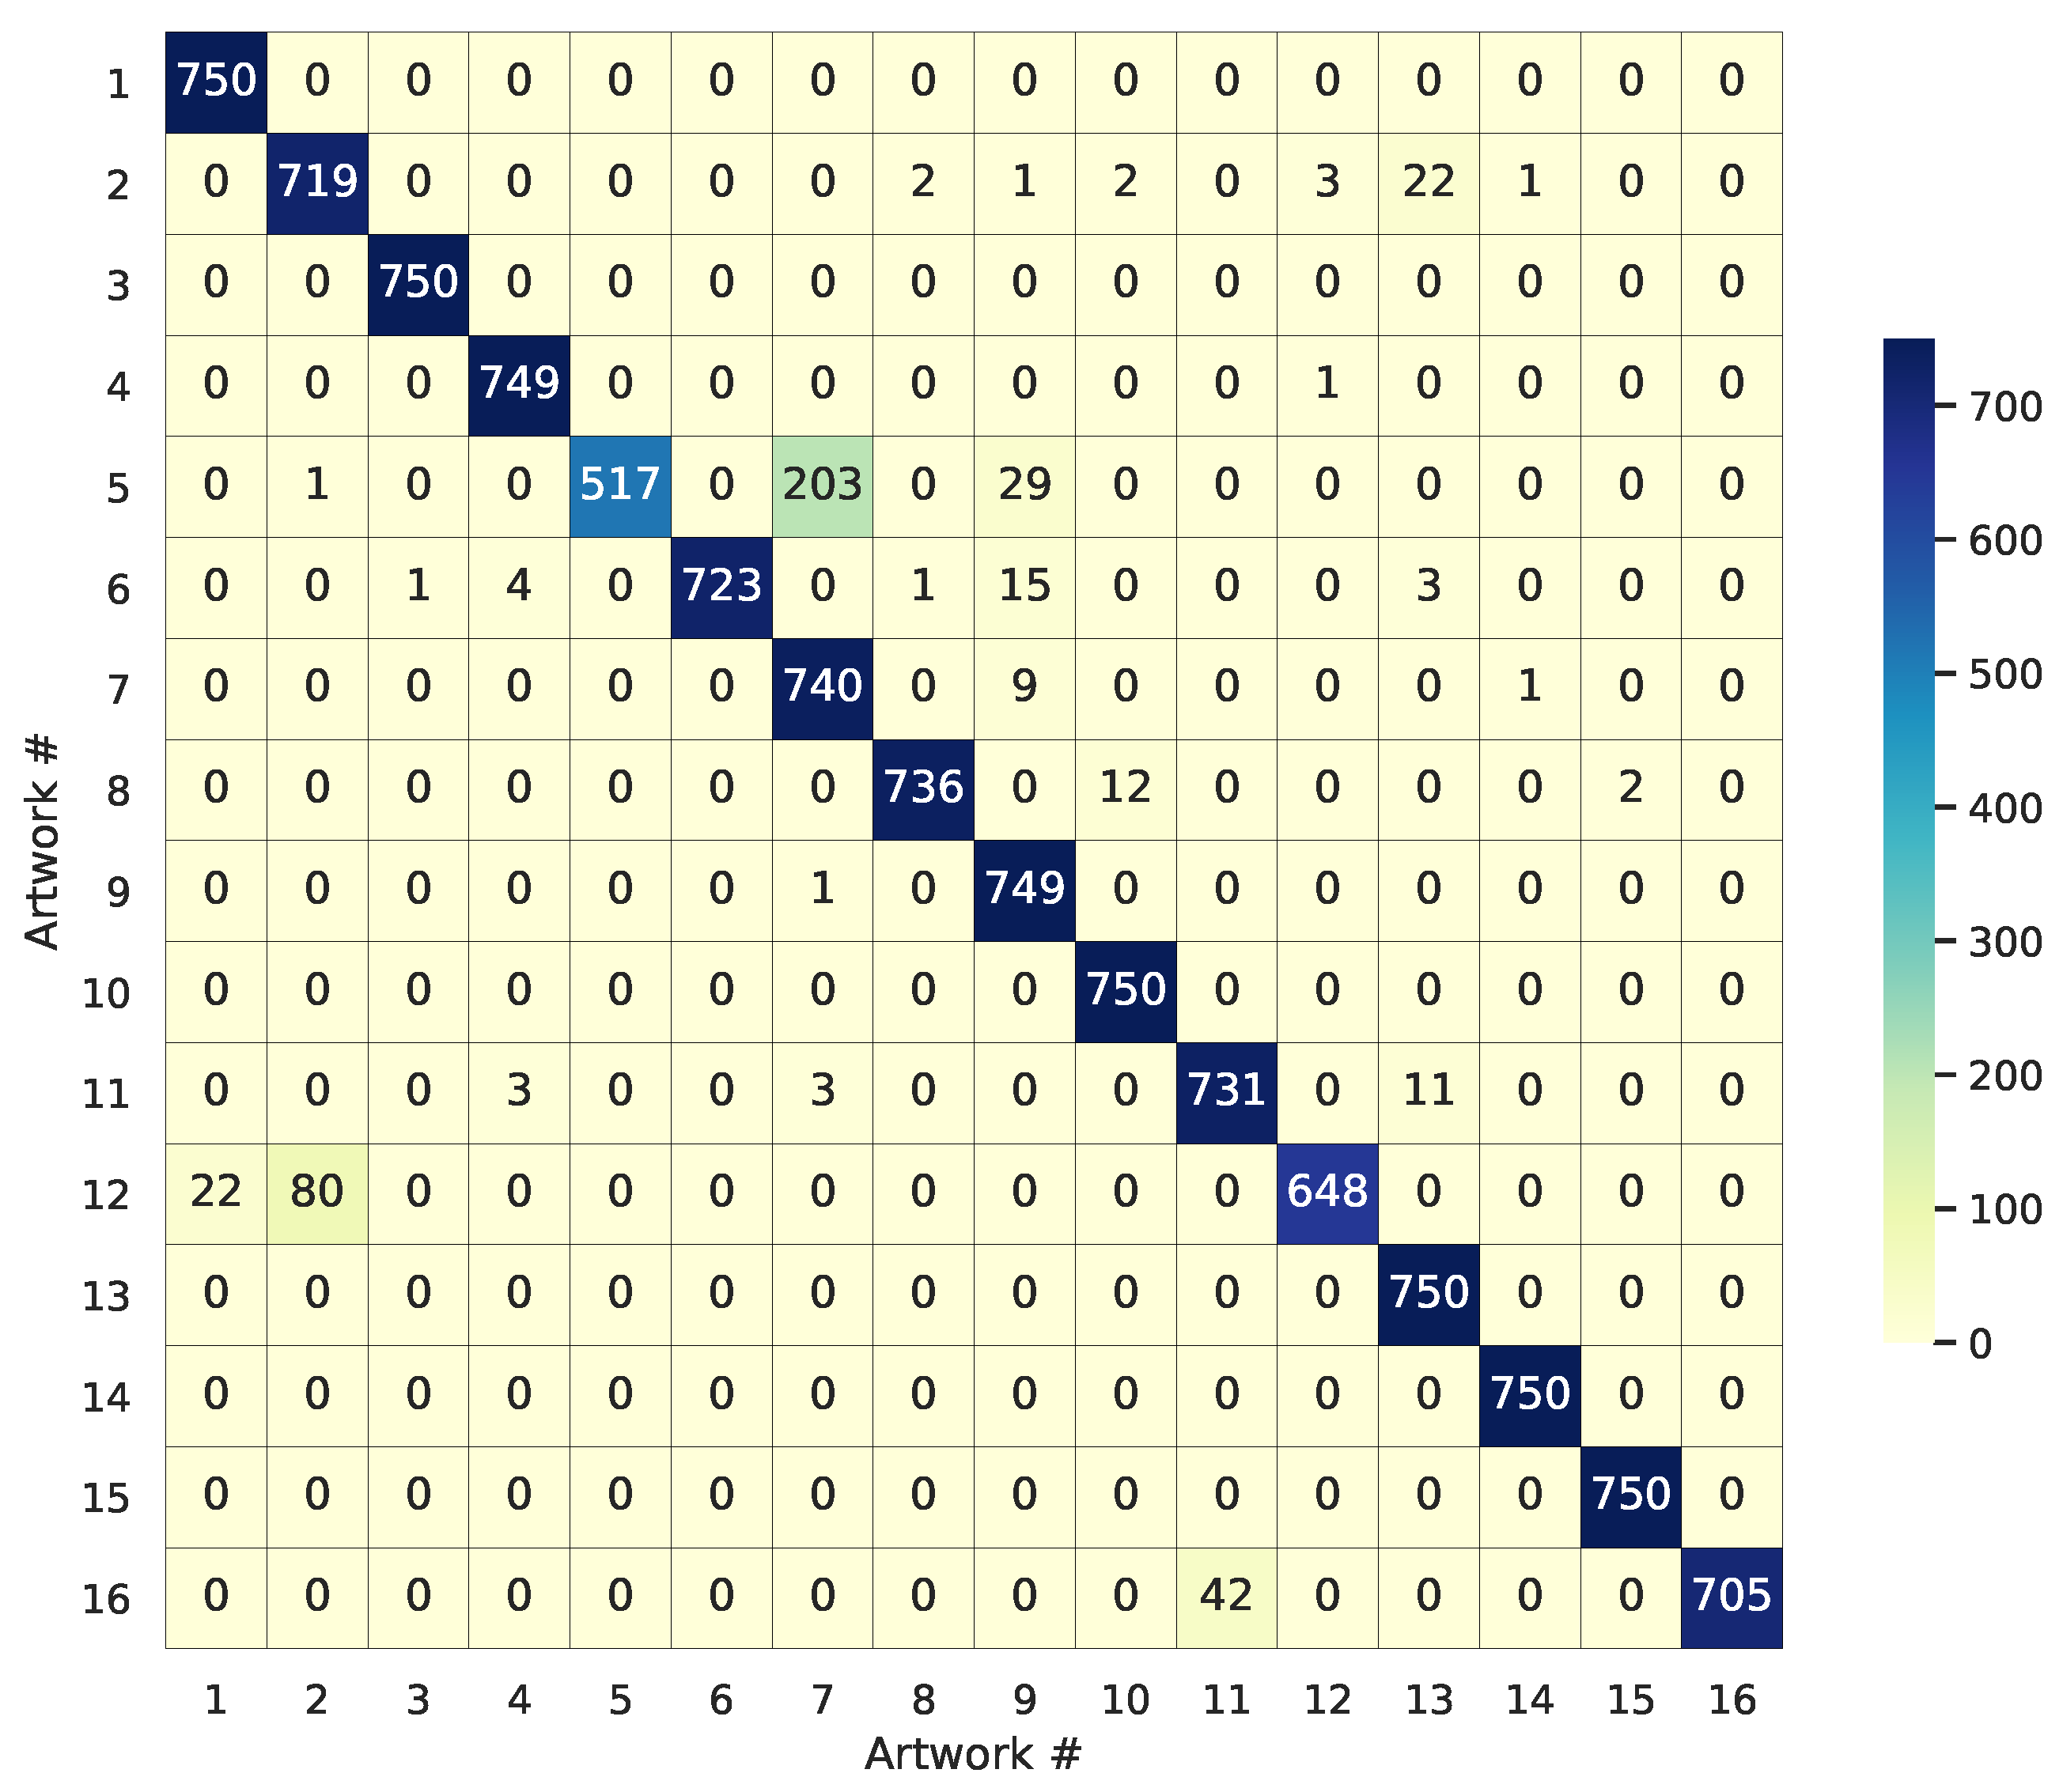
3.4. Experimental Results and Conclusions
4. Artwork Recognition in a Real Environment
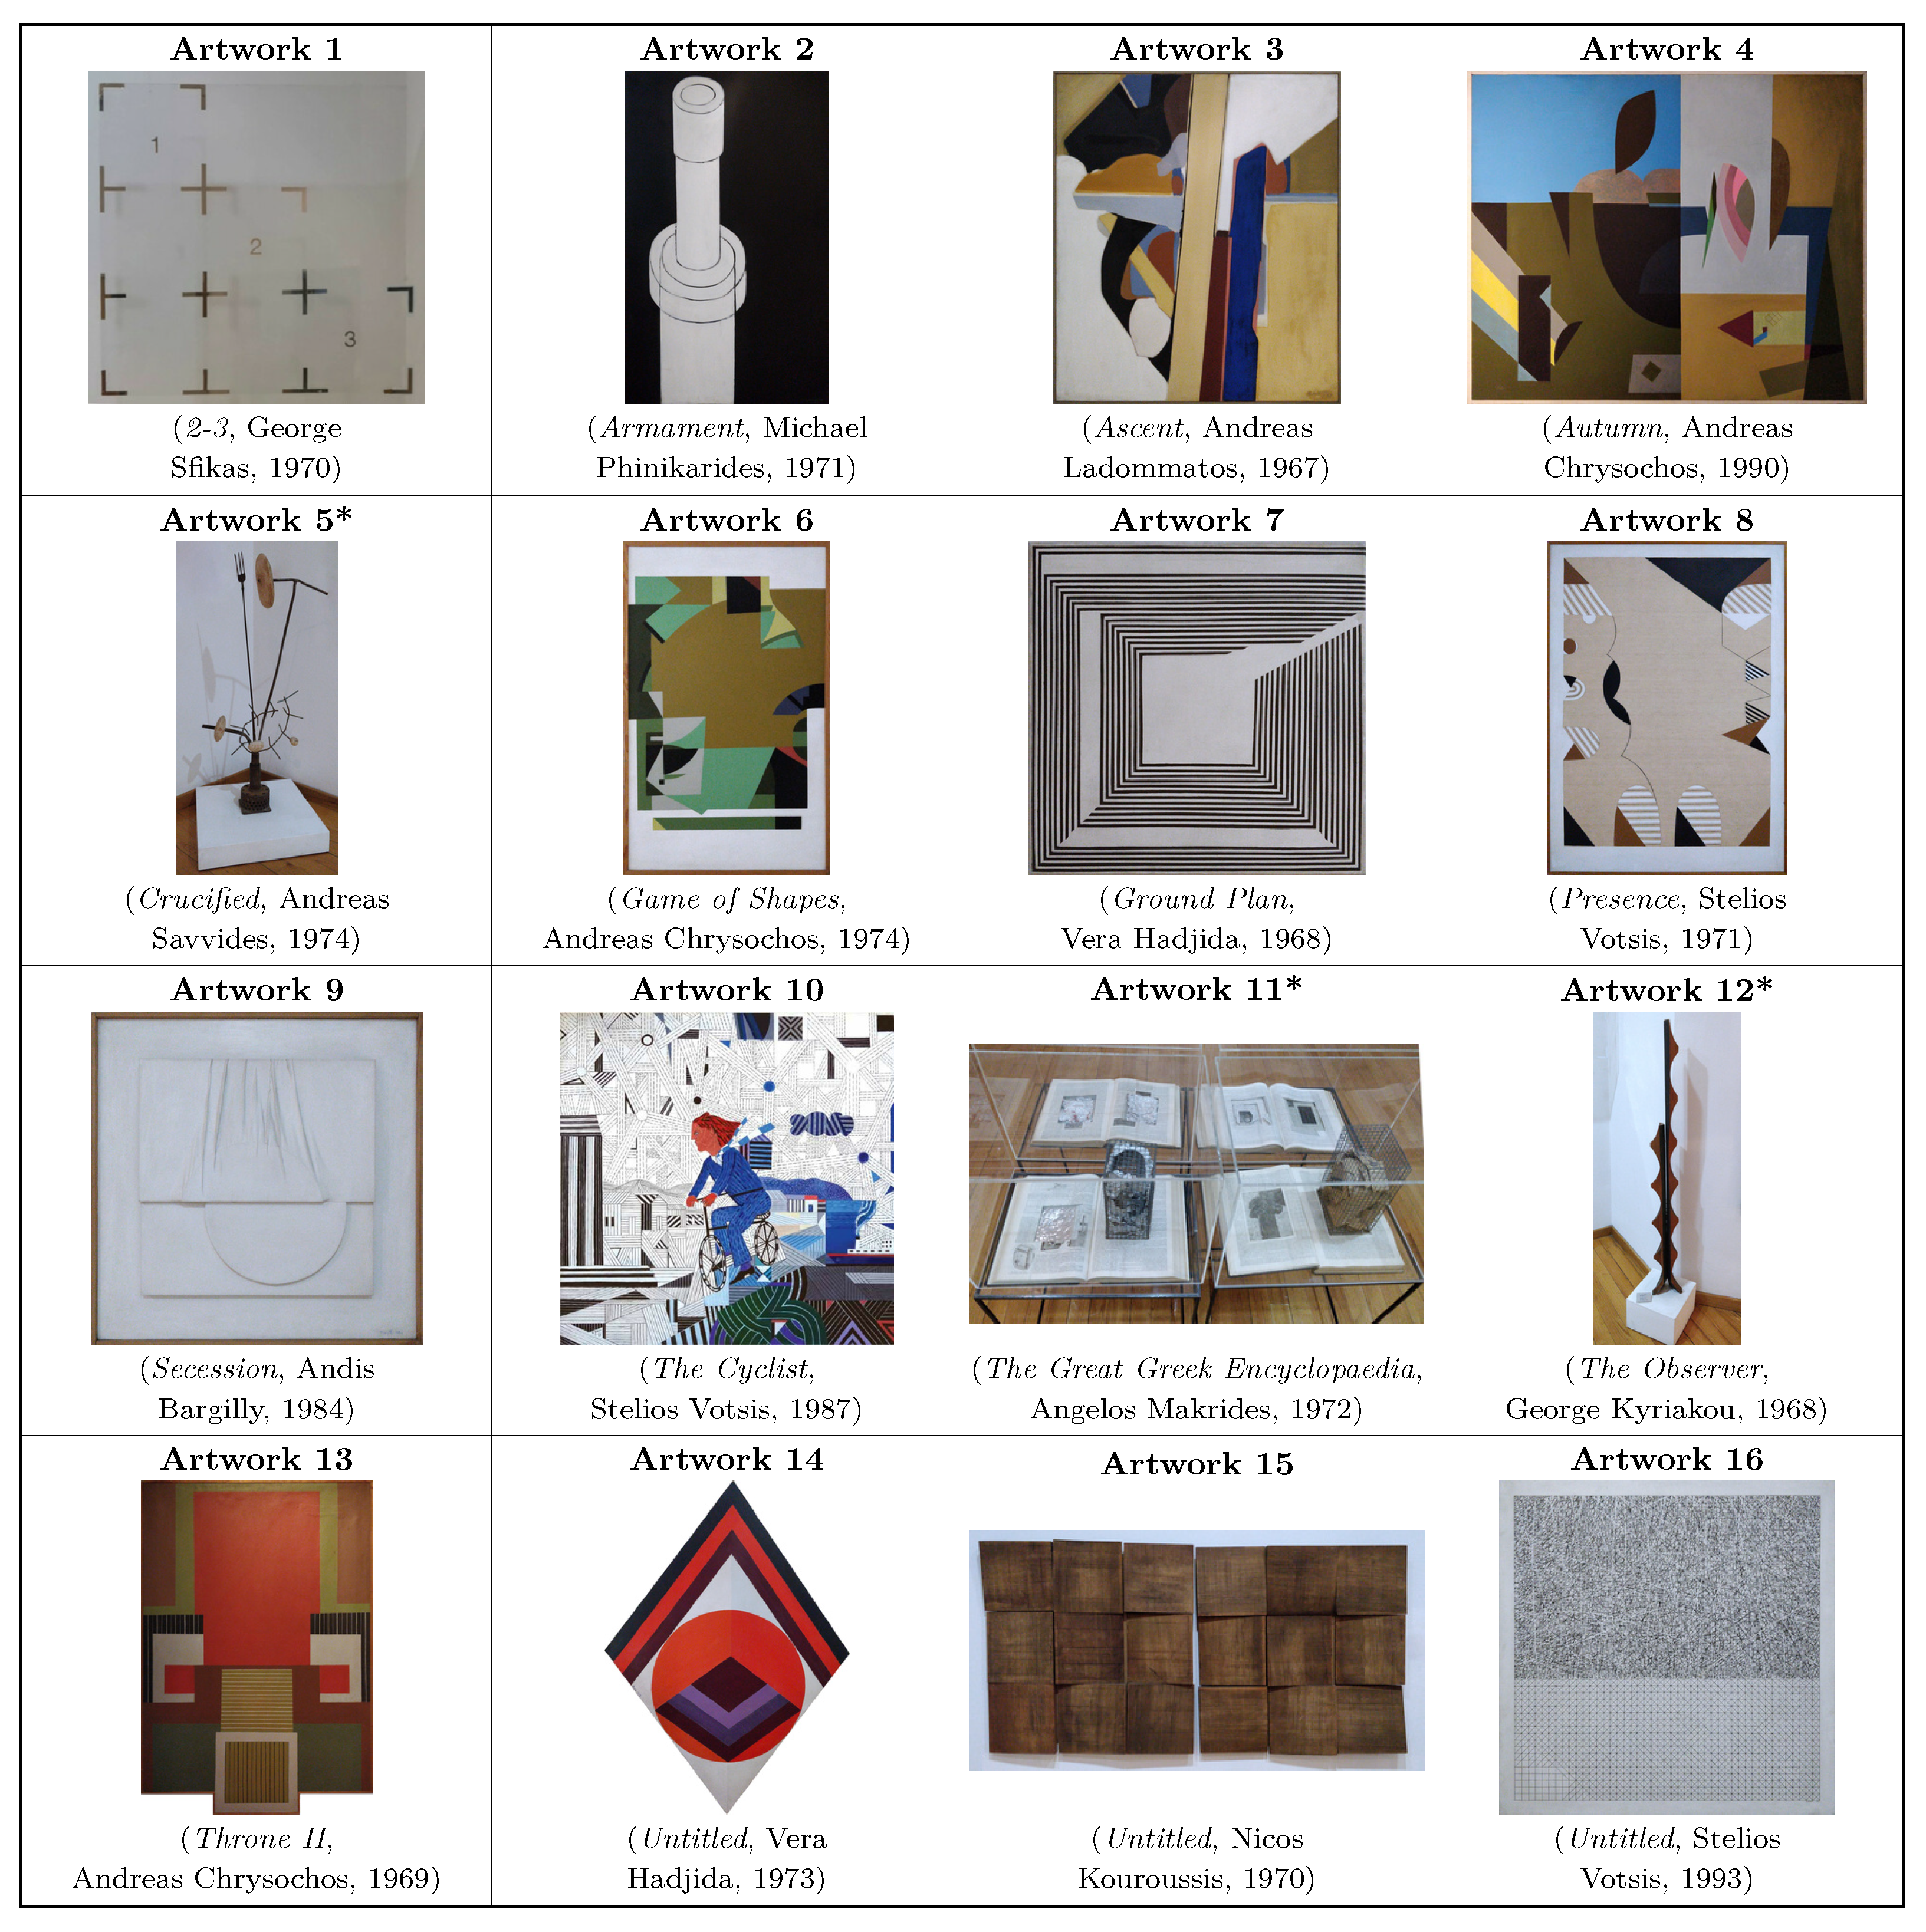
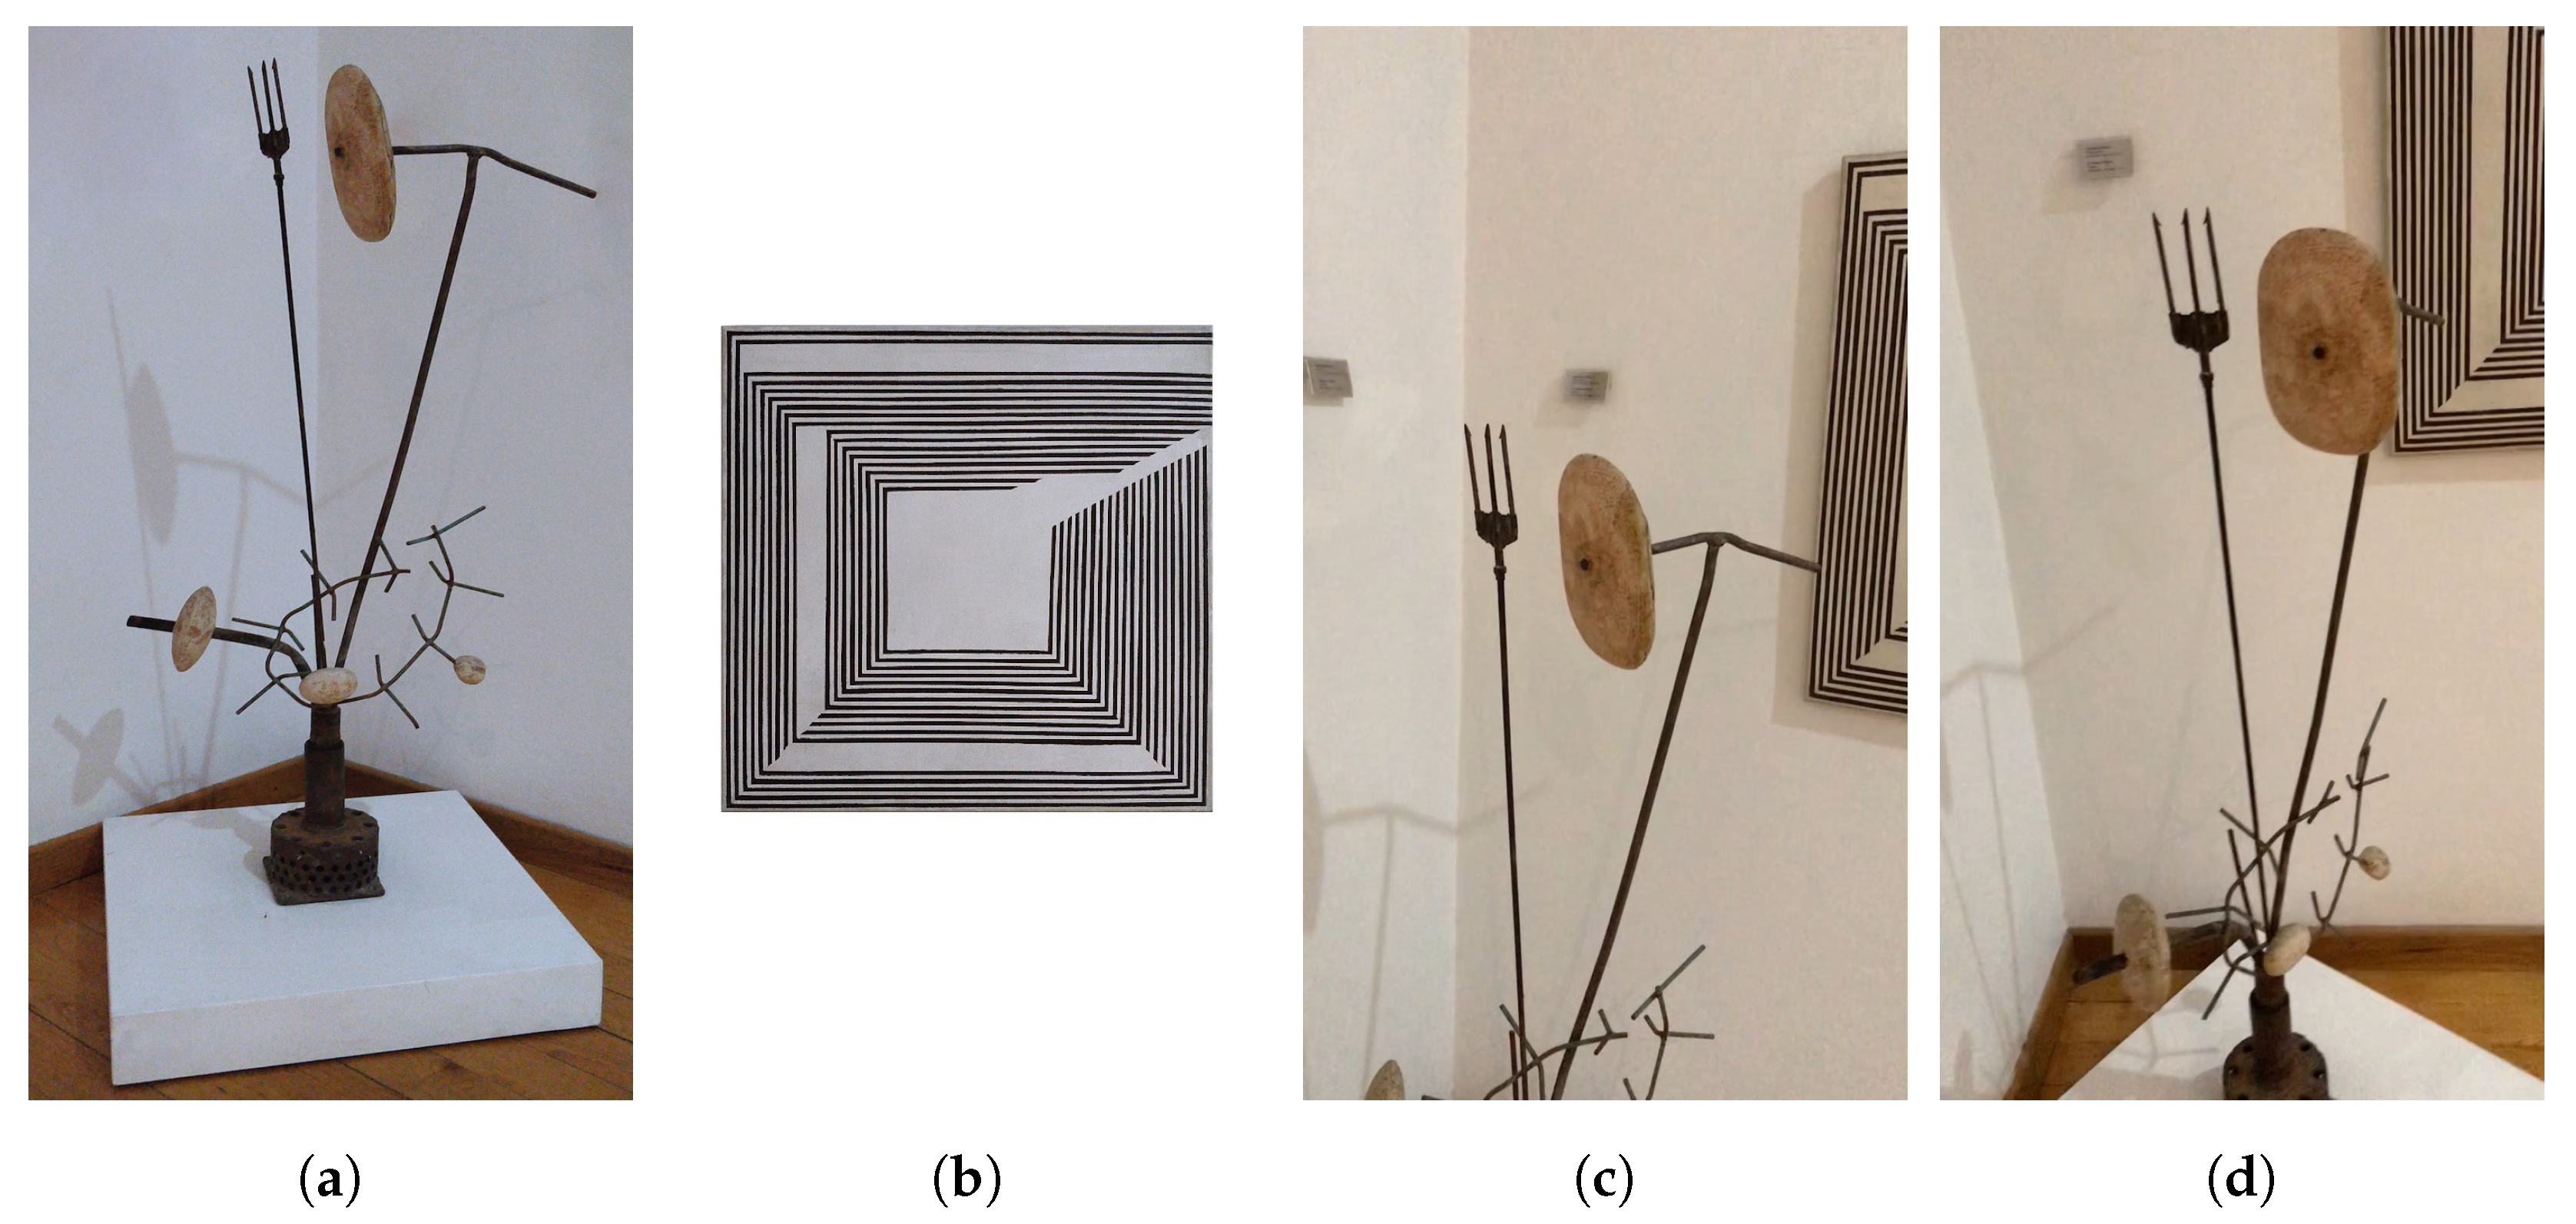
4.1. Dataset
4.2. CNN Artwork Recognition Models
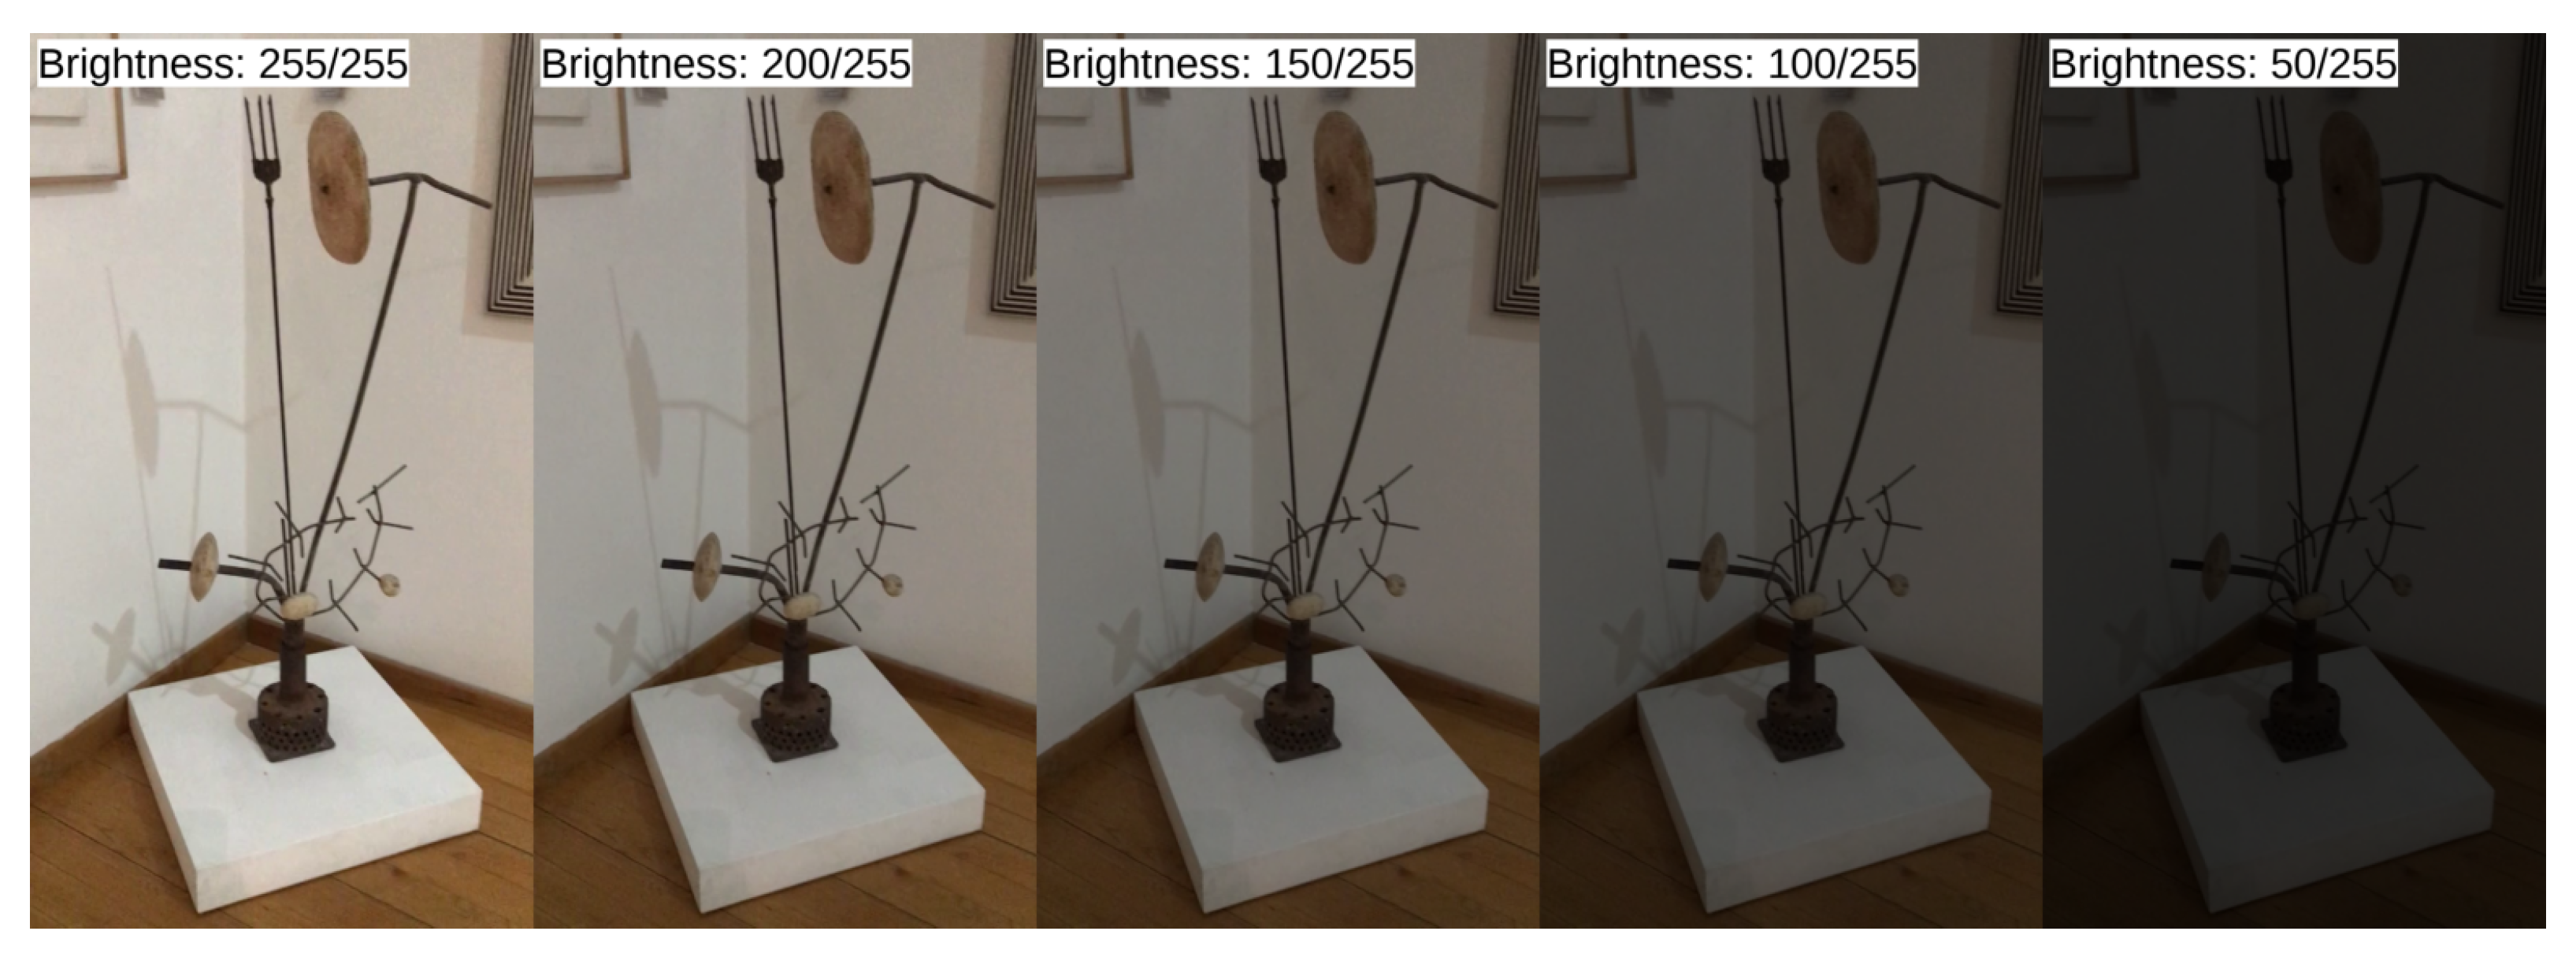
4.3. Experimental Results
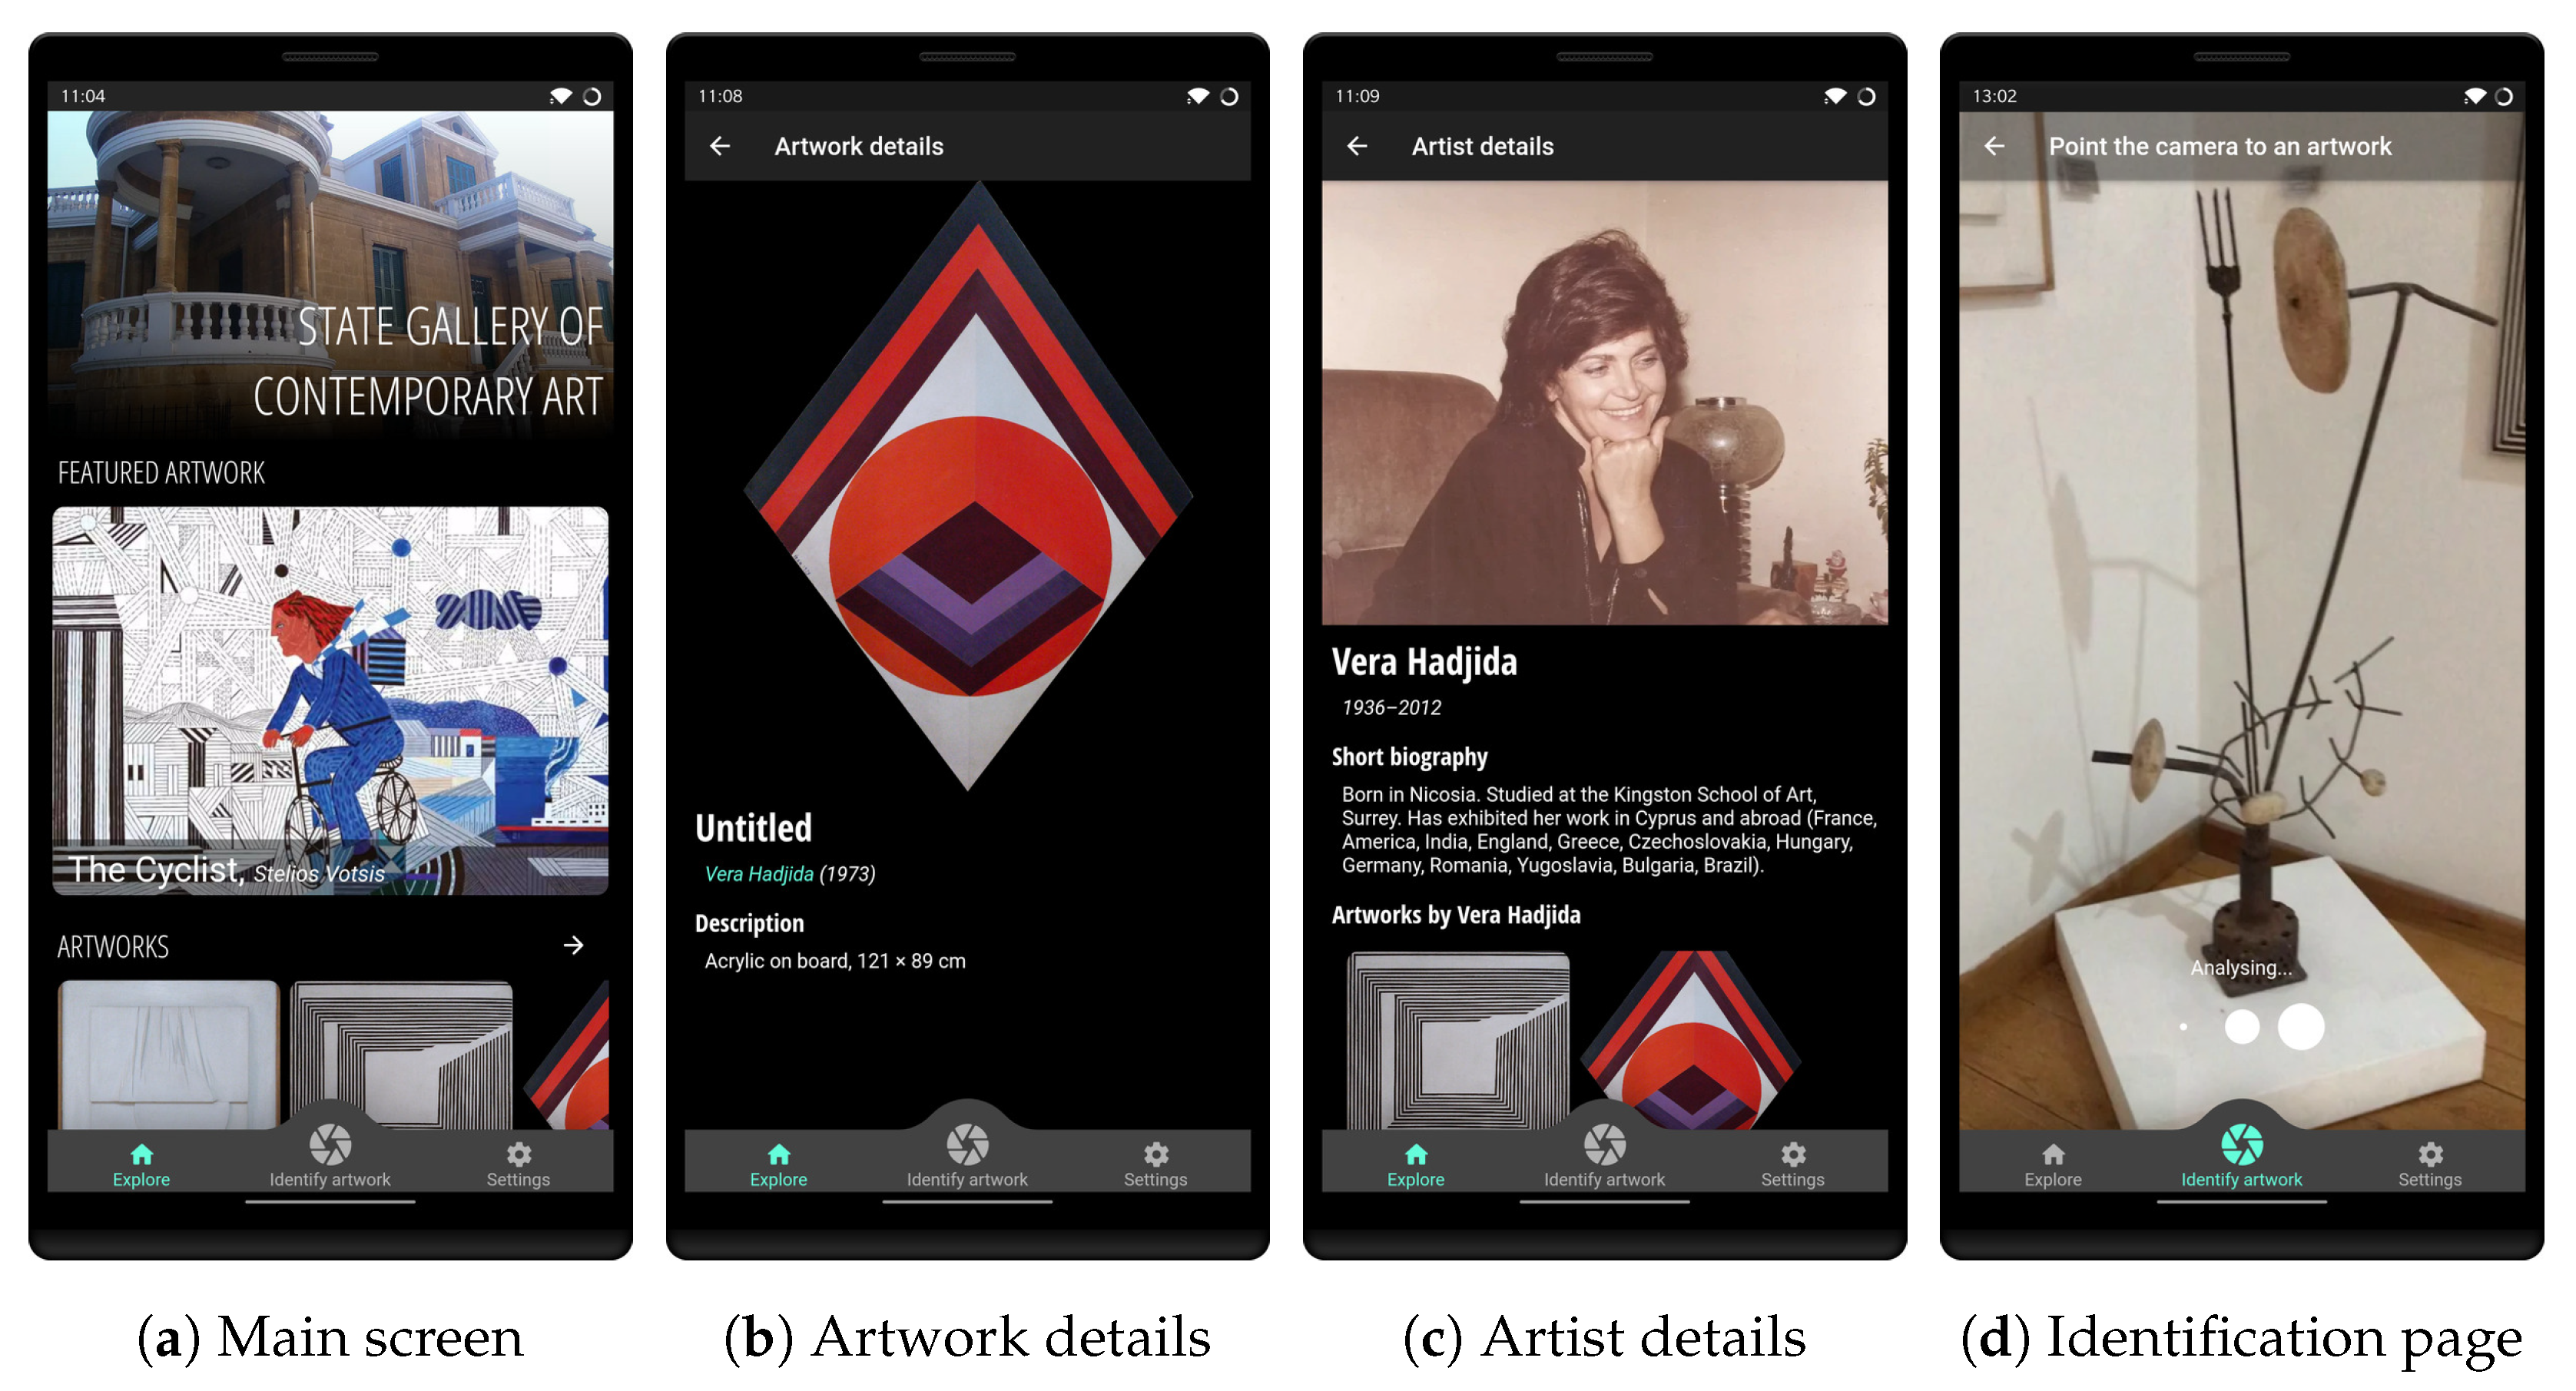
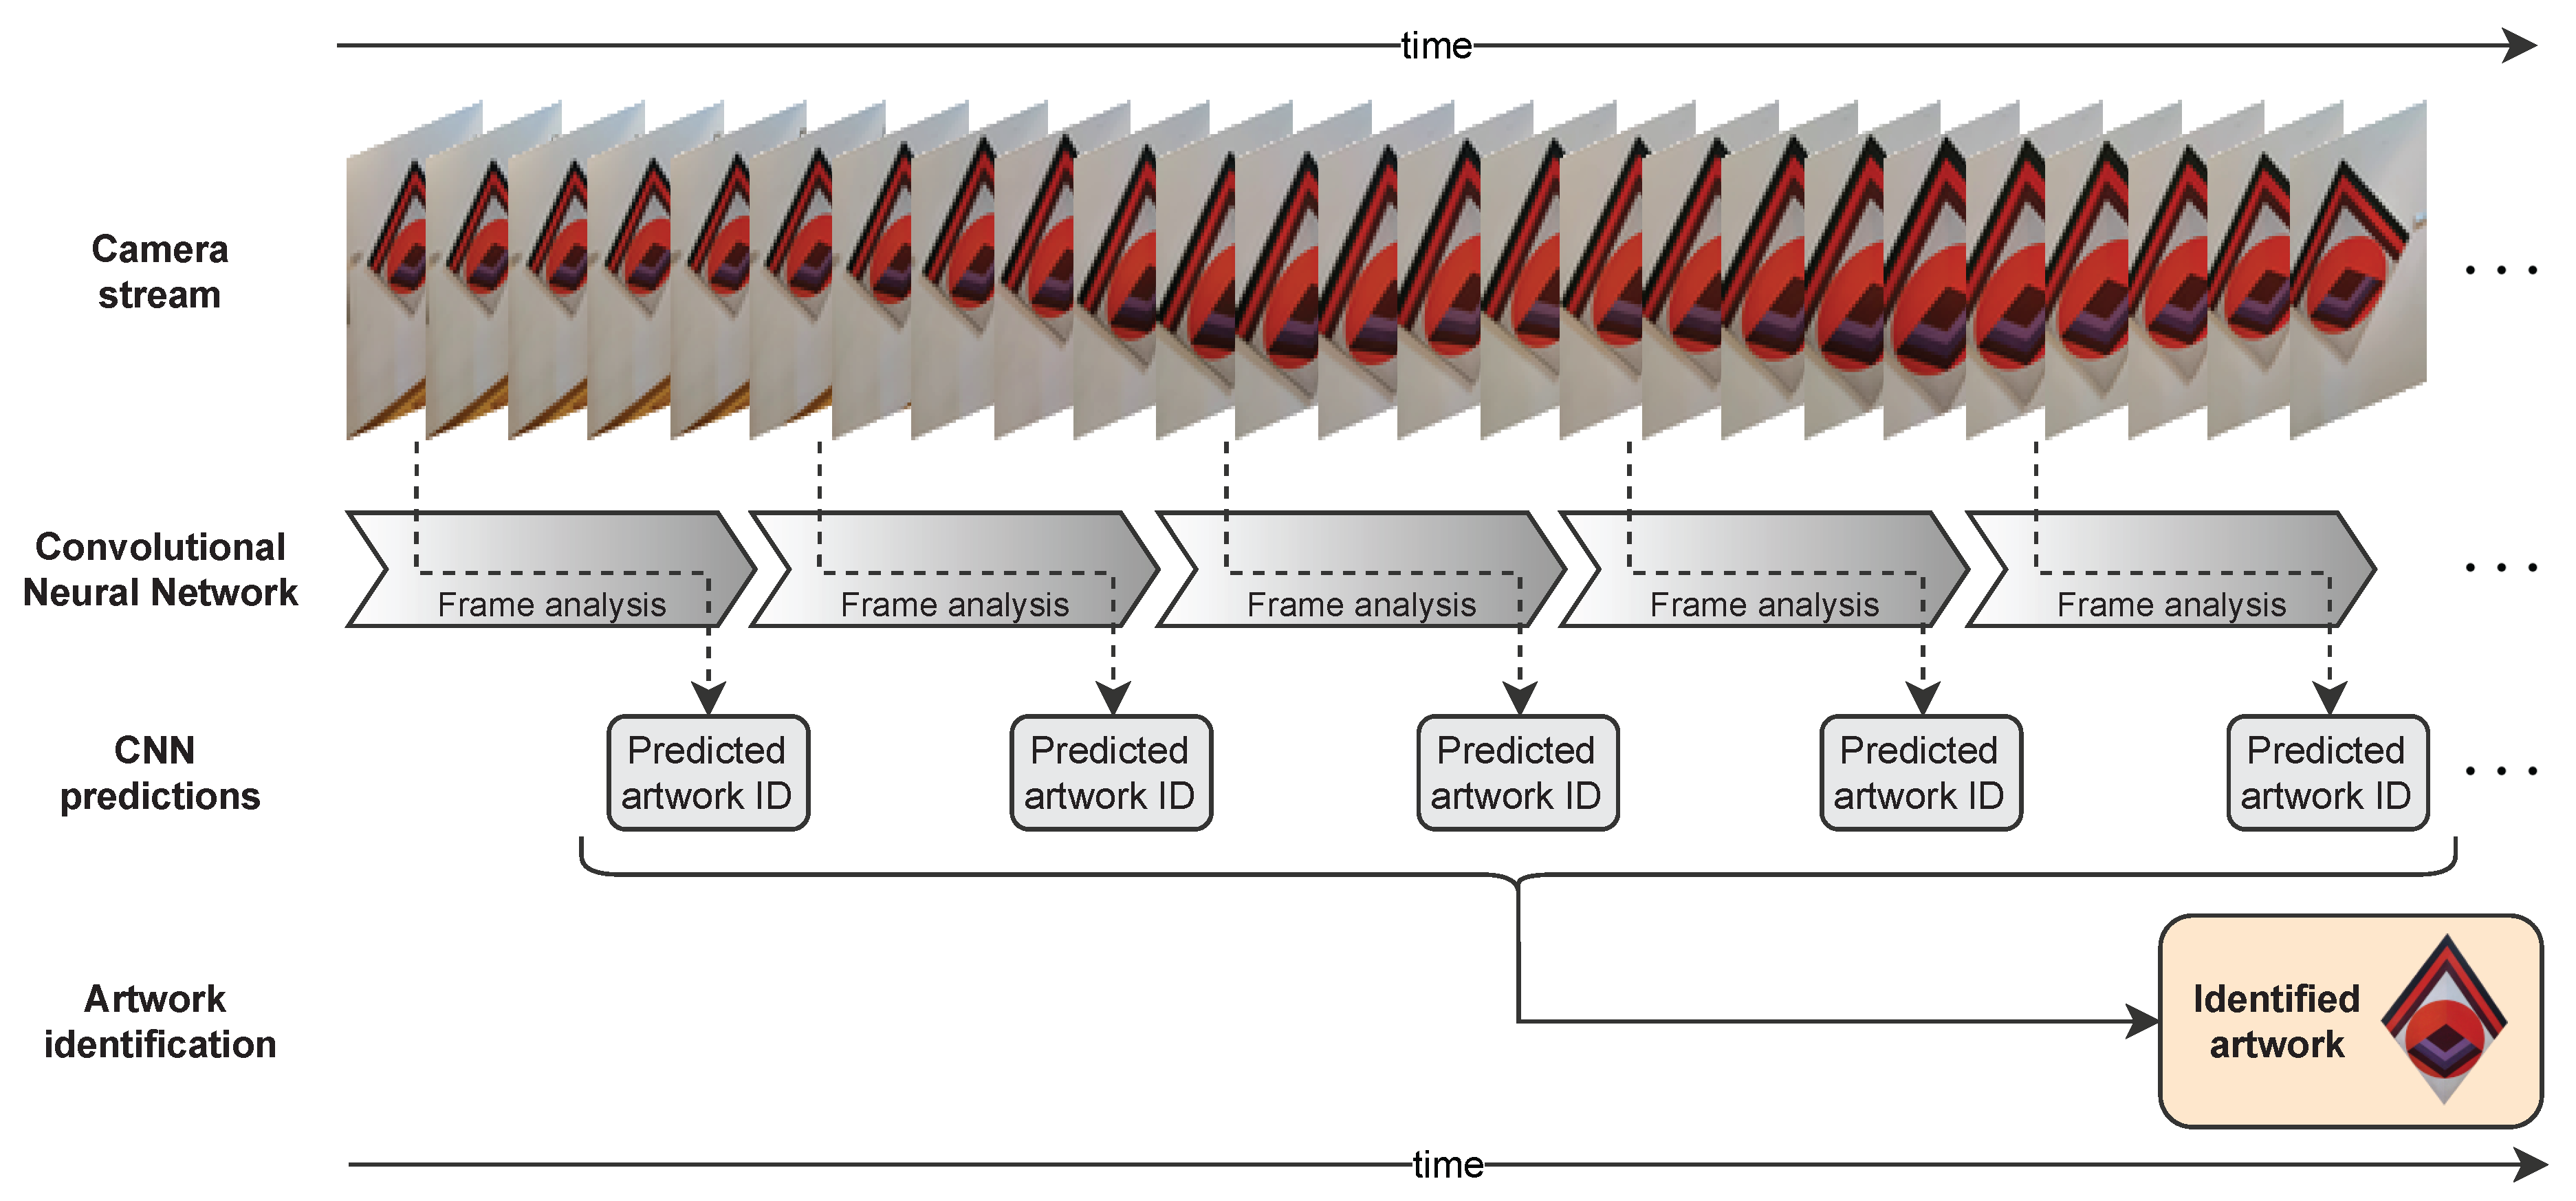
5. Smartphone App Development and Evaluation
5.1. Smartphone App Development
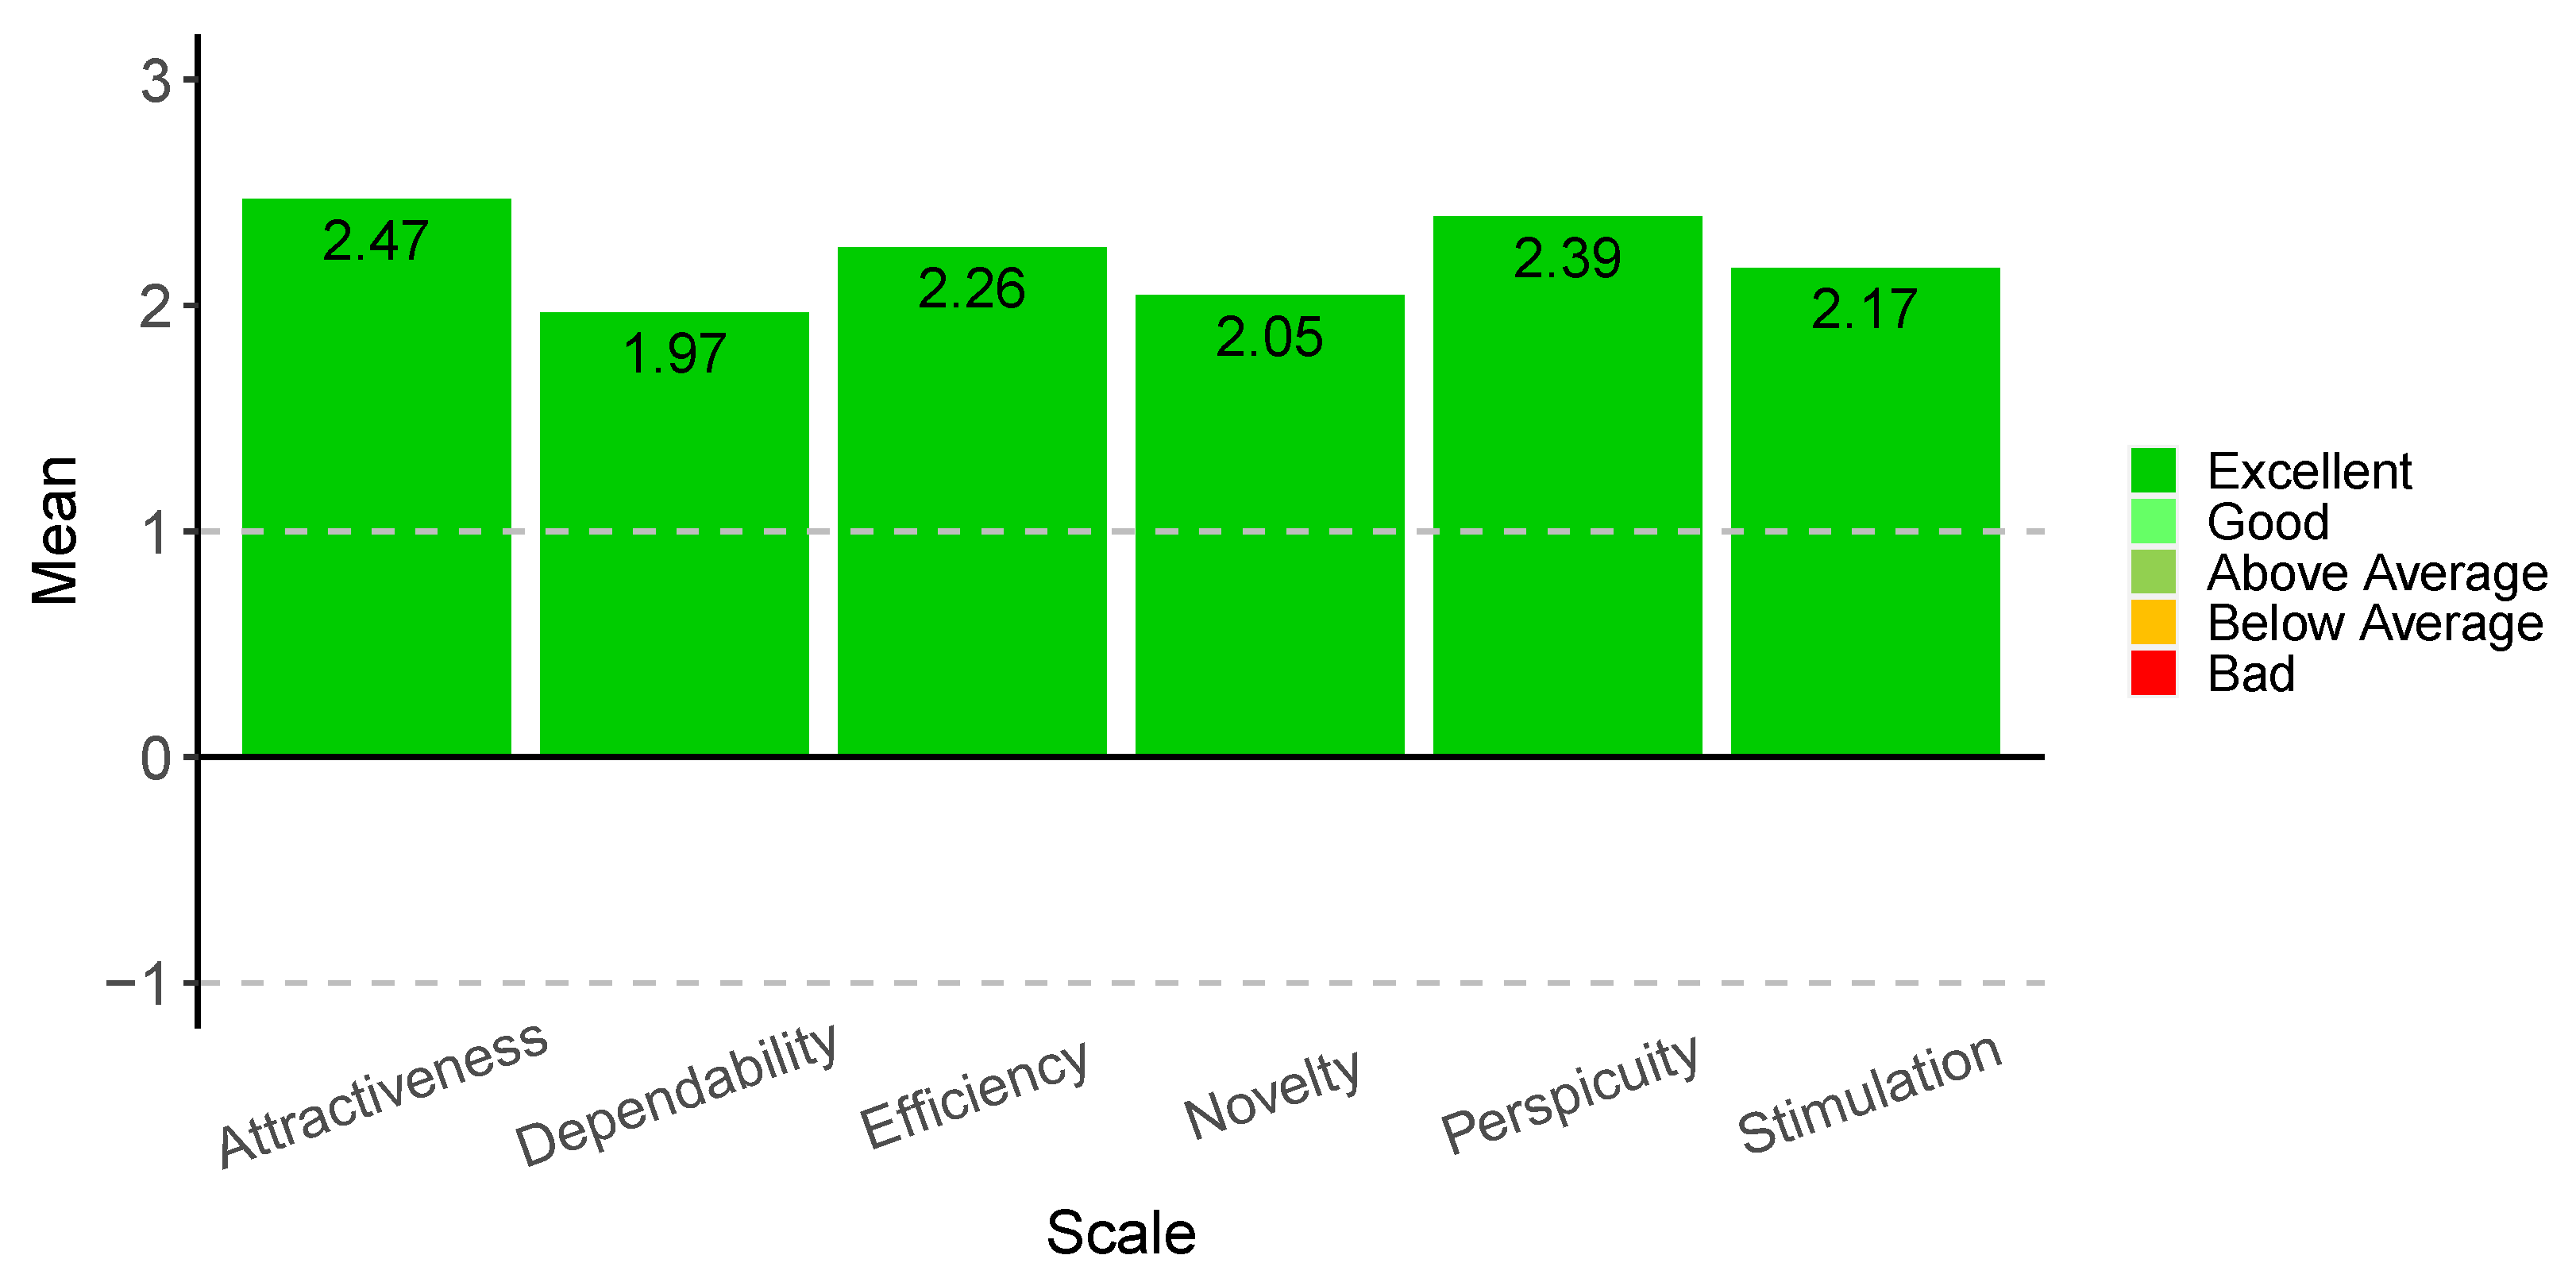
5.2. Smartphone App Evaluation
6. Conclusions
Author Contributions
Funding
Institutional Review Board Statement
Informed Consent Statement
Data Availability Statement
Acknowledgments
Conflicts of Interest
References
- Lanir, J.; Kuflik, T.; Sheidin, J.; Yavin, N.; Leiderman, K.; Segal, M. Visualizing Museum Visitors’ Behavior: Where Do They Go and What Do They Do There? Pers. Ubiquitous Comput. 2017, 21, 313–326. [Google Scholar] [CrossRef]
- Tomiuc, A. Navigating Culture. Enhancing Visitor Museum Experience through Mobile Technologies. From Smartphone to Google Glass. J. Media Res. 2014, 7, 33–47. [Google Scholar]
- Miluniec, A.; Swacha, J. Museum Apps Investigated: Availability, Content and Popularity. e-Rev. Tour. Res. 2020, 17, 764–776. [Google Scholar]
- Theodosiou, Z.; Lanitis, A. Visual Lifelogs Retrieval: State of the Art and Future Challenges. In Proceedings of the 2019 14th International Workshop on Semantic and Social Media Adaptation and Personalization (SMAP), Larnaca, Cyprus, 9–10 June 2019; pp. 1–5. [Google Scholar] [CrossRef]
- Loizides, F.; El Kater, A.; Terlikas, C.; Lanitis, A.; Michael, D. Presenting Cypriot Cultural Heritage in Virtual Reality: A User Evaluation. In Proceedings of the Euro-Mediterranean Conference, Sousse, Tunisia, 1–4 November 2022; Springer: Berlin/Heidelberg, Germany, 2014; pp. 572–579. [Google Scholar] [CrossRef]
- Hooper-Greenhill, E. Studying Visitors. In A Companion to Museum Studies; Macdonald, S., Ed.; Blackwell Publishing Ltd.: Malden, MA, USA, 2006; Chapter 22; pp. 362–376. [Google Scholar] [CrossRef]
- Tesoriero, R.; Gallud, j.A.; Lozano, M.; Penichet, V.M.R. Enhancing visitors’ experience in art museums using mobile technologies. Inf. Syst. Front. 2014, 16, 303–327. [Google Scholar] [CrossRef]
- Rashed, M.G.; Suzuki, R.; Yonezawa, T.; Lam, A.; Kobayashi, Y.; Kuno, Y. Tracking Visitors in a Real Museum for Behavioral Analysis. In Proceedings of the 2016 Joint 8th International Conference on Soft Computing and Intelligent Systems (SCIS) and 17th International Symposium on Advanced Intelligent Systems (ISIS), Sapporo, Japan, 25–28 August 2016; pp. 80–85. [Google Scholar] [CrossRef]
- Mezzini, M.; Limongelli, C.; Sansonetti, G.; De Medio, C. Tracking Museum Visitors through Convolutional Object Detectors. In Proceedings of the Adjunct Publication of the 28th ACM Conference on User Modeling, Adaptation and Personalization, Genoa, Italy, 14–17 July 2020; Association for Computing Machinery: New York, NY, USA, 2020; pp. 352–355. [Google Scholar] [CrossRef]
- Ferrato, A.; Limongelli, C.; Mezzini, M.; Sansonetti, G. Using Deep Learning for Collecting Data about Museum Visitor Behavior. Appl. Sci. 2022, 12, 533. [Google Scholar] [CrossRef]
- Shapiro, B.R.; Hall, R.P.; Owens, D.A. Developing & Using Interaction Geography in a Museum. Int. J. Comput. Support. Collab. Learn. 2017, 12, 377–399. [Google Scholar] [CrossRef]
- Mason, M. The MIT Museum Glassware Prototype: Visitor Experience Exploration for Designing Smart Glasses. J. Comput. Cult. Herit. 2016, 9, 1–28. [Google Scholar] [CrossRef]
- Zhang, R.; Tas, Y.; Koniusz, P. Artwork Identification from Wearable Camera Images for Enhancing Experience of Museum Audiences. In Proceedings of the MW17: Museums and the Web, Cleveland, OH, USA, 19–22 April 2017; Springer: Berlin/Heidelberg, Germany; pp. 240–247. [Google Scholar]
- Ragusa, F.; Furnari, A.; Battiato, S.; Signorello, G.; Farinella, G.M. Egocentric Visitors Localization in Cultural Sites. J. Comput. Cult. Herit. 2019, 12, 1–19. [Google Scholar] [CrossRef]
- Ioannakis, G.; Bampis, L.; Koutsoudis, A. Exploiting artificial intelligence for digitally enriched museum visits. J. Cult. Herit. 2020, 42, 171–180. [Google Scholar] [CrossRef]
- Gultepe, E.; Conturo, T.E.; Makrehchi, M. Predicting and grouping digitized paintings by style using unsupervised feature learning. J. Cult. Herit. 2018, 31, 13–23. [Google Scholar] [CrossRef] [PubMed]
- Hong, Y.; Kim, J. Art Painting Detection and Identification Based on Deep Learning and Image Local Features. Multimed. Tools Appl. 2019, 78, 6513–6528. [Google Scholar] [CrossRef]
- Nakahara, H.; Yonekawa, H.; Fujii, T.; Sato, S. A Lightweight YOLOv2: A Binarized CNN with A Parallel Support Vector Regression for an FPGA. In Proceedings of the 2018 ACM/SIGDA International Symposium on Field-Programmable Gate Arrays, FPGA ’18, Monterey, CA, USA, 25–27 February 2018; Association for Computing Machinery: New York, NY, USA, 2018; pp. 31–40. [Google Scholar] [CrossRef]
- Crowley, E.J.; Zisserman, A. In Search of Art. In Proceedings of the Computer Vision—ECCV 2014 Workshops, Zurich, Switzerland, 6–12 September 2014; Agapito, L., Bronstein, M.M., Rother, C., Eds.; Springer International Publishing: Cham, Switzerland, 2015; pp. 54–70. [Google Scholar]
- Barucci, A.; Cucci, C.; Franci, M.; Loschiavo, M.; Argenti, F. A Deep Learning Approach to Ancient Egyptian Hieroglyphs Classification. IEEE Access 2021, 9, 123438–123447. [Google Scholar] [CrossRef]
- Dalens, T.; Sivic, J.; Laptev, I.; Campedel, M. Painting Recognition from Wearable Cameras. Technical Report hal-01062126, INRIA. 2014. Available online: https://www.di.ens.fr/willow/research/glasspainting/ (accessed on 11 July 2022).
- Portaz, M.; Kohl, M.; Quénot, G.; Chevallet, J. Fully Convolutional Network and Region Proposal for Instance Identification with Egocentric Vision. In Proceedings of the 2017 IEEE International Conference on Computer Vision Workshops (ICCVW), Venice, Italy, 22–29 October 2017; pp. 2383–2391. [Google Scholar] [CrossRef]
- Seidenari, L.; Baecchi, C.; Uricchio, T.; Ferracani, A.; Bertini, M.; Bimbo, A.D. Deep Artwork Detection and Retrieval for Automatic Context-Aware Audio Guides. ACM Trans. Multimed. Comput. Commun. Appl. 2017, 13, 1–21. [Google Scholar] [CrossRef]
- Lanitis, A.; Theodosiou, Z.; Partaourides, H. Artwork Identification in a Museum Environment: A Quantitative Evaluation of Factors Affecting Identification Accuracy. In Digital Heritage. Progress in Cultural Heritage: Documentation, Preservation, and Protection; Ioannides, M., Fink, E., Cantoni, L., Champion, E., Eds.; EuroMed 2020. Lecture Notes in Computer Science; Springer: Cham, Switzerland, 2021; Volume 12642, pp. 588–595. [Google Scholar] [CrossRef]
- Iandola, F.N.; Han, S.; Moskewicz, M.W.; Ashraf, K.; Dally, W.J.; Keutzer, K. SqueezeNet: AlexNet-Level Accuracy with 50x Fewer Parameters and <0.5 MB Model Size. arXiv 2016, arXiv:1602.07360. [Google Scholar]
- Deng, J.; Dong, W.; Socher, R.; Li, L.; Li, K.; Li, F.F. ImageNet: A Large-Scale Hierarchical Image Database. In Proceedings of the 2009 IEEE Conference on Computer Vision and Pattern Recognition, Miami, FL, USA, 20–25 June 2009; pp. 248–255. [Google Scholar] [CrossRef] [Green Version]
- ImageNet. Online. 2020. Available online: http://image-net.org (accessed on 17 March 2021).
- Kingma, D.P.; Ba, J. Adam: A method for stochastic optimization. arXiv 2014, arXiv:1412.6980. [Google Scholar]
- Clark, A. Pillow (PIL Fork) Documentation, 2020. Version 8.0.0. Available online: https://pillow.readthedocs.io/en/stable/releasenotes/8.0.0.html (accessed on 11 July 2022).
- XOIO-AIR. Cutout People—Greenscreen Volume 1. 2012. Available online: https://xoio-air.de/2012/greenscreen_people_01/ (accessed on 11 July 2022).
- Simonyan, K.; Zisserman, A. Very Deep Convolutional Networks for Large-Scale Image Recognition. arXiv 2015, arXiv:1409.1556. [Google Scholar]
- Szegedy, C.; Vanhoucke, V.; Ioffe, S.; Shlens, J.; Wojna, Z. Rethinking the Inception Architecture for Computer Vision. In Proceedings of the 2016 IEEE Conference on Computer Vision and Pattern Recognition (CVPR), Las Vegas, NV, USA, 26 June–1 July 2016; pp. 2818–2826. [Google Scholar] [CrossRef]
- Sandler, M.; Howard, A.; Zhu, M.; Zhmoginov, A.; Chen, L.C. MobileNetV2: Inverted Residuals and Linear Bottlenecks. In Proceedings of the IEEE Conference on Computer Vision and Pattern Recognition, Salt Lake City, UT, USA, 18–22 June 2018; pp. 4510–4520. [Google Scholar] [CrossRef]
- Schrepp, M.; Hinderks, A.; Thomaschewski, J. Applying the User Experience Questionnaire (UEQ) in Different Evaluation Scenarios. In Design, User Experience, and Usability, Theories, Methods, and Tools for Designing the User Experience, Proceedings of the Third International Conference, Herakleion, Greece, 22–27 June 2014; Marcus, A., Ed.; Springer International Publishing: Cham, Switzerland, 2014; pp. 383–392. [Google Scholar] [CrossRef]
- Schulz, J.; Veal, C.; Buck, A.; Anderson, D.; Keller, J.; Popescu, M.; Scott, G.; Ho, D.K.C.; Wilkin, T. Extending deep learning to new classes without retraining. In Proceedings of the Detection and Sensing of Mines, Explosive Objects, and Obscured Targets XXV, Online, 27 April–8 May 2020; Bishop, S.S., Isaacs, J.C., Eds.; International Society for Optics and Photonics, SPIE: Bellingham, WA, USA, 2020; Volume 11418, pp. 13–26. [Google Scholar] [CrossRef]
- Draelos, T.J.; Miner, N.E.; Lamb, C.C.; Cox, J.A.; Vineyard, C.M.; Carlson, K.D.; Severa, W.M.; James, C.D.; Aimone, J.B. Neurogenesis deep learning: Extending deep networks to accommodate new classes. In Proceedings of the 2017 International Joint Conference on Neural Networks (IJCNN), Anchorage, AK, USA, 14–19 May 2017; pp. 526–533. [Google Scholar] [CrossRef]
- Parisi, G.I.; Kemker, R.; Part, J.L.; Kanan, C.; Wermter, S. Continual lifelong learning with neural networks: A review. Neural Netw. 2019, 113, 54–71. [Google Scholar] [CrossRef]


| Condition | Parameters | Experiment 1: Correct Classification Rate | Experiment 2: Correct Classification Rate |
|---|---|---|---|
| Wall texture | No texture (baseline) | 99% | 100% |
| Green stripe | 95% | 100% | |
| Blue stripe | 94% | 98% | |
| Gold fan | 88% | 100% | |
| Number of visitors | 0 (baseline) | 99% | 100% |
| 5 | 92% | 100% | |
| 10 | 71% | 98% | |
| 15 | 83% | 93% | |
| Distance | 150 cm (baseline) | 99% | 100% |
| 200 cm | 88% | 100% | |
| 250 cm | 78% | 100% | |
| 300 cm | 76% | 100% | |
| Camera point of view | Forward (baseline) | 99% | 100% |
| Upwards | 98% | 100% | |
| Downwards | 77% | 100% | |
| Left | 87% | 100% | |
| Right | 86% | 100% | |
| Ambient light intensity | 255 (baseline) | 99% | 100% |
| 200 | 96% | 100% | |
| 150 | 63% | 99% | |
| 100 | 27% | 46% | |
| Camera speed | 10 s | 100% | 100% |
| 20 s (baseline) | 99% | 100% | |
| 30 s | 99% | 100% | |
| 40 s | 99% | 100% | |
| Random camera movements | N/A | 72% | 98% |
| InceptionV3 | MobileNetV2 | VGG19 |
|---|---|---|
| InceptionV3 original layers (excl. top layer, initialized with ImageNet weights) | MobileNetV2 original layers (excl. top layer, initialized with ImageNet weights) | VGG19 original layers (excl. top layer, initialized with ImageNet weights) |
| Global average pooling 2D layer | Flatten layer | Flatten layer |
| Dense layer (1024, activation = ’ReLU’) | Dropout layer (rate = 0.5) | Dropout layer (rate = 0.5) |
| Dense layer (17 classes, softmax) | Dense layer (17 classes, softmax) | Dense layer (17 classes, softmax) |
| Architecture | Model Size (.tflite) | Inference Time/Frame | Accuracy |
|---|---|---|---|
| VGG19 | 78 MB | 4000 ms+ | 0.9739 |
| VGG19 (quantized) | 20 MB | 1800–2000 ms | 0.9749 |
| InceptionV3 | 91 MB | 600–800 ms | 0.9902 |
| InceptionV3 (quantized) | 23 MB | 400–550 ms | 0.9869 |
| MobileNetV2 | 15 MB | 200–350 ms | 0.9967 |
| MobileNetV2 (quantized) | 4 MB | 180–300 ms | 0.8693 |
| Distance | 1 m | 1.5 m | 2.5 m | Avg | 1 m | 1.5 m | 2.5 m | Avg | |
|---|---|---|---|---|---|---|---|---|---|
| View | |||||||||
| Brightness = 255/255 (Visitor height = 0%) | Brightness = 200/255 (Visitor height = 0%) | ||||||||
| Forward | 100.0% | 100.0% | 94.2% | 98.1% | 100.0% | 100.0% | 93.2% | 97.8% | |
| Downwards | 100.0% | 99.9% | 92.1% | 97.3% | 100.0% | 100.0% | 91.4% | 97.1% | |
| Upwards | 100.0% | 96.1% | 78.9% | 91.7% | 98.1% | 98.8% | 77.8% | 91.5% | |
| Left | 100.0% | 100.0% | 90.6% | 96.9% | 100.0% | 100.0% | 85.4% | 95.1% | |
| Right | 100.0% | 100.0% | 87.8% | 95.9% | 100.0% | 100.0% | 91.4% | 97.1% | |
| Avg | 100.0% | 99.2% | 88.7% | 96.0% | 99.6% | 99.8% | 87.8% | 95.7% | |
| Brightness = 150/255 (Visitor height = 0%) | Brightness = 100/255 (Visitor height = 0%) | ||||||||
| Forward | 100.0% | 100.0% | 93.0% | 97.7% | 100.0% | 100.0% | 93.4% | 97.8% | |
| Downwards | 100.0% | 100.0% | 91.0% | 97.0% | 100.0% | 100.0% | 88.1% | 96.0% | |
| Upwards | 97.5% | 97.8% | 78.1% | 91.1% | 99.2% | 94.2% | 78.5% | 90.7% | |
| Left | 100.0% | 100.0% | 86.6% | 95.5% | 100.0% | 100.0% | 91.1% | 97.0% | |
| Right | 100.0% | 100.0% | 93.1% | 97.7% | 100.0% | 99.8% | 89.8% | 96.5% | |
| Avg | 99.5% | 99.5% | 88.4% | 95.8% | 99.8% | 98.8% | 88.2% | 95.6% | |
| Brightness = 50/255 (Visitor height = 0%) | Visitor height = 50% (Brightness = 255/255) | ||||||||
| Forward | 89.2% | 92.6% | 86.1% | 89.3% | 68.1% | 70.4% | 49.9% | 62.8% | |
| Downwards | 98.0% | 98.8% | 78.0% | 91.6% | 47.6% | 54.2% | 25.1% | 42.3% | |
| Upwards | 87.2% | 89.1% | 56.9% | 77.8% | 60.5% | 61.0% | 33.4% | 51.6% | |
| Left | 99.9% | 99.0% | 85.4% | 94.8% | 72.0% | 72.6% | 46.4% | 63.7% | |
| Right | 97.4% | 98.0% | 65.2% | 86.9% | 56.9% | 64.4% | 28.5% | 49.9% | |
| Avg | 94.4% | 95.5% | 74.3% | 88.1% | 61.0% | 64.5% | 36.7% | 54.1% | |
| Scale | Component 1 | Component 2 |
|---|---|---|
| Attractiveness | Attractive–unattractive | Friendly–unfriendly |
| Dependability | Meets expectations–does not meet expectations | Obstructive–supportive |
| Efficiency | Fast–slow | Impractical–practical |
| Novelty | Conservative–innovative | Inventive–conventional |
| Perspicuity | Clear–confusing | Complicated–easy |
| Stimulation | Not interesting–interesting | Valuable–inferior |
Publisher’s Note: MDPI stays neutral with regard to jurisdictional claims in published maps and institutional affiliations. |
© 2022 by the authors. Licensee MDPI, Basel, Switzerland. This article is an open access article distributed under the terms and conditions of the Creative Commons Attribution (CC BY) license (https://creativecommons.org/licenses/by/4.0/).
Share and Cite
Theodosiou, Z.; Thoma, M.; Partaourides, H.; Lanitis, A. A Systematic Approach for Developing a Robust Artwork Recognition Framework Using Smartphone Cameras. Algorithms 2022, 15, 305. https://doi.org/10.3390/a15090305
Theodosiou Z, Thoma M, Partaourides H, Lanitis A. A Systematic Approach for Developing a Robust Artwork Recognition Framework Using Smartphone Cameras. Algorithms. 2022; 15(9):305. https://doi.org/10.3390/a15090305
Chicago/Turabian StyleTheodosiou, Zenonas, Marios Thoma, Harris Partaourides, and Andreas Lanitis. 2022. "A Systematic Approach for Developing a Robust Artwork Recognition Framework Using Smartphone Cameras" Algorithms 15, no. 9: 305. https://doi.org/10.3390/a15090305
APA StyleTheodosiou, Z., Thoma, M., Partaourides, H., & Lanitis, A. (2022). A Systematic Approach for Developing a Robust Artwork Recognition Framework Using Smartphone Cameras. Algorithms, 15(9), 305. https://doi.org/10.3390/a15090305