Article

Prediction of Injuries in CrossFit Training: A Machine Learning Perspective

by
Serafeim Moustakidis
1,
Athanasios Siouras
1,2,
Konstantinos Vassis
3,
Ioannis Misiris
4,
Elpiniki Papageorgiou
5,6,* and
Dimitrios Tsaopoulos
6
1
AIDEAS OÜ, Narva mnt 5, 10117 Tallinn, Harju Maakond, Estonia
2
Department of Computer Science and Biomedical Informatics, School of Science, University of Thessaly, 35131 Lamia, Greece
3
School of Health Sciences, University of Thessaly, Department of Physiotherapy, 35100 Lamia, Greece
4
“Physio’clock” Advanced Physiotherapy Center, 41223 Larissa, Greece
5
Department of Energy Systems, University of Thessaly, Geopolis Campus, 41500 Larisa, Greece
6
Institute for Bio-Economy & Agri-Technology, Center for Research and Technology Hellas, 60361 Volos, Greece
*
Author to whom correspondence should be addressed.
Algorithms 2022, 15(3), 77; https://doi.org/10.3390/a15030077
Submission received: 30 January 2022 / Revised: 18 February 2022 / Accepted: 21 February 2022 / Published: 24 February 2022
(This article belongs to the Special Issue Ensemble Algorithms and/or Explainability)

Abstract

:
CrossFit has gained recognition and interest among physically active populations being one of the most popular and rapidly growing exercise regimens worldwide. Due to the intense and repetitive nature of CrossFit, concerns have been raised over the potential injury risks that are associated with its training including rhabdomyolysis and musculoskeletal injuries. However, identification of risk factors for predicting injuries in CrossFit athletes has been limited by the absence of relevant big epidemiological studies. The main purpose of this paper is the identification of risk factors and the development of machine learning-based models using ensemble learning that can predict CrossFit injuries. To accomplish the aforementioned targets, a survey-based epidemiological study was conducted in Greece to collect data on musculoskeletal injuries in CrossFit practitioners. A Machine Learning (ML) pipeline was then implemented that involved data pre-processing, feature selection and well-known ML models. The performance of the proposed ML models was assessed using a comprehensive cross validation mechanism whereas a discussion on the nature of the selected features is also provided. An area under the curve (AUC) of 77.93% was achieved by the best ML model using ensemble learning (Adaboost) on the group of six selected risk factors. The effectiveness of the proposed approach was evaluated in a comparative analysis with respect to numerous performance metrics including accuracy, sensitivity, specificity, AUC and confusion matrices to confirm its clinical relevance. The results are the basis for the development of reliable tools for the prediction of injuries in CrossFit.

1. Introduction

It is widely accepted that a physically active lifestyle and sports participation are important for all age groups with positive impact [1,2,3]. However, sports participation also carries a risk for injuries, which may in some cases lead to permanent disability [4]. Sports injuries are very common across different sports among both elite and recreational athletes, affect health and performance and may even cause prolonged problems in a person’s life [5]. Sports injuries can lead to pain, loss of playing or working time, as well as decreased motility and stability [5].
CrossFit (CF) is one of the most popular and rapidly growing exercise regimens in Greece, as is worldwide [6]. It is a high-intensity, conditioning and training program [7,8] that has gained recognition (widespread attention) and interest among physically active populations [8,9,10,11] for its focus on successive ballistic motions that build strength and endurance [8]. CF is based on a set of complex functional exercises that include (1) cyclical (running, rowing, rope jumping), (2) weightlifting and (3) ballistic movements (bars, push-ups etc.) [7,12] performed at high intensity, quickly and repetitively with limited or no recovery time between sets [8,9]. These exercises are related to rapid muscular fatigue, which can lead to a loss of concentration and skill, elevating the risk of injury [9,10]. Recently, due to the popularity of CF practice, many studies have conducted injury-related epidemiological surveys in CF practitioners in many countries [6,7,8,9,11,13,14,15,16,17,18,19,20,21,22]. According to the aforementioned studies, it is necessary: (i) to compile more data about musculoskeletal injuries of this type of exercise in order to better understand their origin and aitiology, (ii) to identify the risk factors that are associated with injuries and take proactive steps to prevent them, (iii) to increase the safety level and better serve the active athlete population who participate in CF. Further research and investigation into CF is needed to enhance our understanding of the causes of injuries thus facilitating the establishment of injury preventive strategies.
Sport injuries have been recognized as global health problem with significant impact on national health systems worldwide [6]. Specifically, injuries, such a demanding exercise program such as CF, may result in: (i) loss of manpower, (ii) increased costs due to extensive medical treatments and rehabilitation as well as (iii) poor quality of life. Several factors have been related with the development of injuries during CF practice. A recent systematic review revealed that multiple factors have been suggested to increase the risk of injury [23] including biological and anthropometric characteristics (older age, gender), history of previous injuries, longer periods of training, limited experience on CF, lack of coach supervision and the extensive participation in competitions.
In the majority of the studies, data were analyzed using traditional statistical methods, such as Pearson correlation coefficients, multiple regression, and general linear models with partial correlation coefficients. Logistic regression (LR) represents the most primitive form of Machine Learning (ML) techniques and has been frequently applied in the literature [24,25]. However, regression analysis is static and not predictive, meaning that it does not autoregulate to “learn” from complex data relationships, especially when more data inputs are added. Given the mass proliferation of data in sports and addressing the growing needs for reducing the health, performance and financial consequences of injuries in athletes, this study represents the first foray into the development of models capable of predicting CF injuries using advanced ML algorithms.
ML is a subset of artificial intelligence that uses computational algorithms with the aim of providing new insights on relationships between variables that has significant potential for application in sports medicine research [26,27]. ML refers actually to the process by which a computer system utilizes data to train itself to make better decisions. ML and data mining have recently emerged as a strategical area to exploit knowledge in sports providing solutions in various sport domain including prediction of physical performance [28] and recovery rates following traumatic brain injury [29] as well as biomechanical analysis of change of direction in subjects with chronic groin pain [30]. Based on their ability to understand the non-linear dynamics of human body, ML algorithms have been used in various sports such as baseball [31], soccer [32,33,34], hockey [31,35], basketball and floorball [36].
According to our knowledge, identification of risk factors for predicting injuries in CF athletes has been limited by the absence of relevant big epidemiological studies. The main purpose of this paper is threefold: (i) the design of the first ever survey-based epidemiological study in Greece that collects data on musculoskeletal injuries in CF practitioners; (ii) the identification of risk factors that are associated with injuries in CF and (iii) the development of machine learning-based models that can predict CF injuries using a small descriptive subset of selected risk factors. To accomplish the aforementioned targets, a robust ML pipeline was implemented that involves data pre-processing, feature selection and well-known ML models. The performance of the proposed ML models was assessed using a comprehensive cross validation mechanism whereas a discussion on the nature of the selected features is also provided.
The rest of the paper is organized as follows. Section 2 gives a description of the epidemiological study performed including information about the study design, sample calculation and inclusion/exclusion criteria. Section 2 also presents the proposed methodology along with the necessary data pre-processing, feature selection and validation approach. Results along with the associated discussion are given in Section 3 and Section 4, respectively. Conclusions and future work are finally drawn in Section 5.

2. Materials and Methods

2.1. Study Design

This study is a survey-based descriptive epidemiological study designed to collect data on musculoskeletal injuries in CF practitioners in Greece. The purpose of the study was to: (i) investigate the epidemiological profile among CF participants in Greece; (ii) identify the most common musculoskeletal injuries endured during CF training; (iii) determine the main risk factors for musculoskeletal injuries in Greek CF practitioners. It was approved by the Ethical Committee of the Faculty of Physiotherapy, School of Health Sciences, University of Thessaly (n.1575ΣΕ2/13-4-2020). The study was carried out using an electronic, anonymous, self-administered questionnaire. The questionnaire was based on previous relevant studies [7,11,15,17] and was further modified by four experts with different backgrounds. Data were collected from April 2020 to June 2020 via an electronic survey tool using a Google-based form in Greek language. The questionnaire consisted of three parts. The first part included items concerning demographics—general information (gender, age, height, weight, training location). The second part had specific questions about CF (physical effort that work involve, CF experience, training sessions per week and duration, participation in competitions, days a week of rest, regular performance of other sports, sports activity level prior to CF, reasons of start practicing CF, supervision by a coach, professional monitoring, recovery, nutrition, etc.). The last, third part, focused on the occurrence of injuries while practicing CF, injury location and type of injury over the whole CF practice (lifetime prevalence).
The following simple formula [37] was used for calculating the adequate sample size in our prevalence study:
n 1.96 2 δ 2 p 1 p
where n denotes the sample size, p is the estimated prevalence and δ is the margin of error. The minimum sample required to conduct the study was 1068 people, taking into account that there exist approximately 35,000 CF athletes all over Greece and assuming that 50% are injured, with 95% CI and 3% accuracy of injury prevalence. Since the existing number of CF participants in Greece remains unknown, the authors of this study followed the calculation method of Sprey et al. [11].
The inclusion criteria were determined to include those CF practitioners who: (i) practice in Greek boxes with at least Level 1 certified trainers, (ii) aged 18 or over and (iii) had attended at least one one-week training session and were present during the data collection days. It should be noted that the study sample consists of CF practitioners of both sexes who work out in Greece regardless of their participation in competitions.
Participants were excluded if they: (i) trained independently outside of a CF gym or outside Greece, (ii) trained in noncertified fitness centers or on their own, (iii) were performing other type of functional training, (iv) were younger than 18 years, (v) were affected by chronic osteo-articular diseases and (vi) provided incomplete questionnaires.
The sample included 1224 CF practitioners aged 18 to 59 (443 (36%) females and 781 (64%) males) (Table 1). In this paper, the injury prediction task is considered as a two-class classification problem. Specifically, the participants of the study were divided into two groups: (1) Class 0: Healthy participants (not injured during CF) and (2) Class 1: Participants who reported having suffered an injury while practicing CF and this injury was confirmed by a medical professional. So, the main objective of the study is to build ML models that could discriminate the two aforementioned groups and therefore be able to decide whether a new testing sample (participant) will be assigned in one of the two classes.

2.2. Data Preprocessing

Risk factors with more than 20% missing values compared to the total numbers of subjects were excluded from the dataset. To handle missing values, data imputation was employed. Specifically, missing values in the categorical or numerical variables were replaced by the most frequent value of the non-missing variables. In our paper, data were normalized with respect to features’ standard deviation (Z-score). This leads a common basis that facilitates the smooth and effective application of the subsequent processing steps (feature selection and learning).

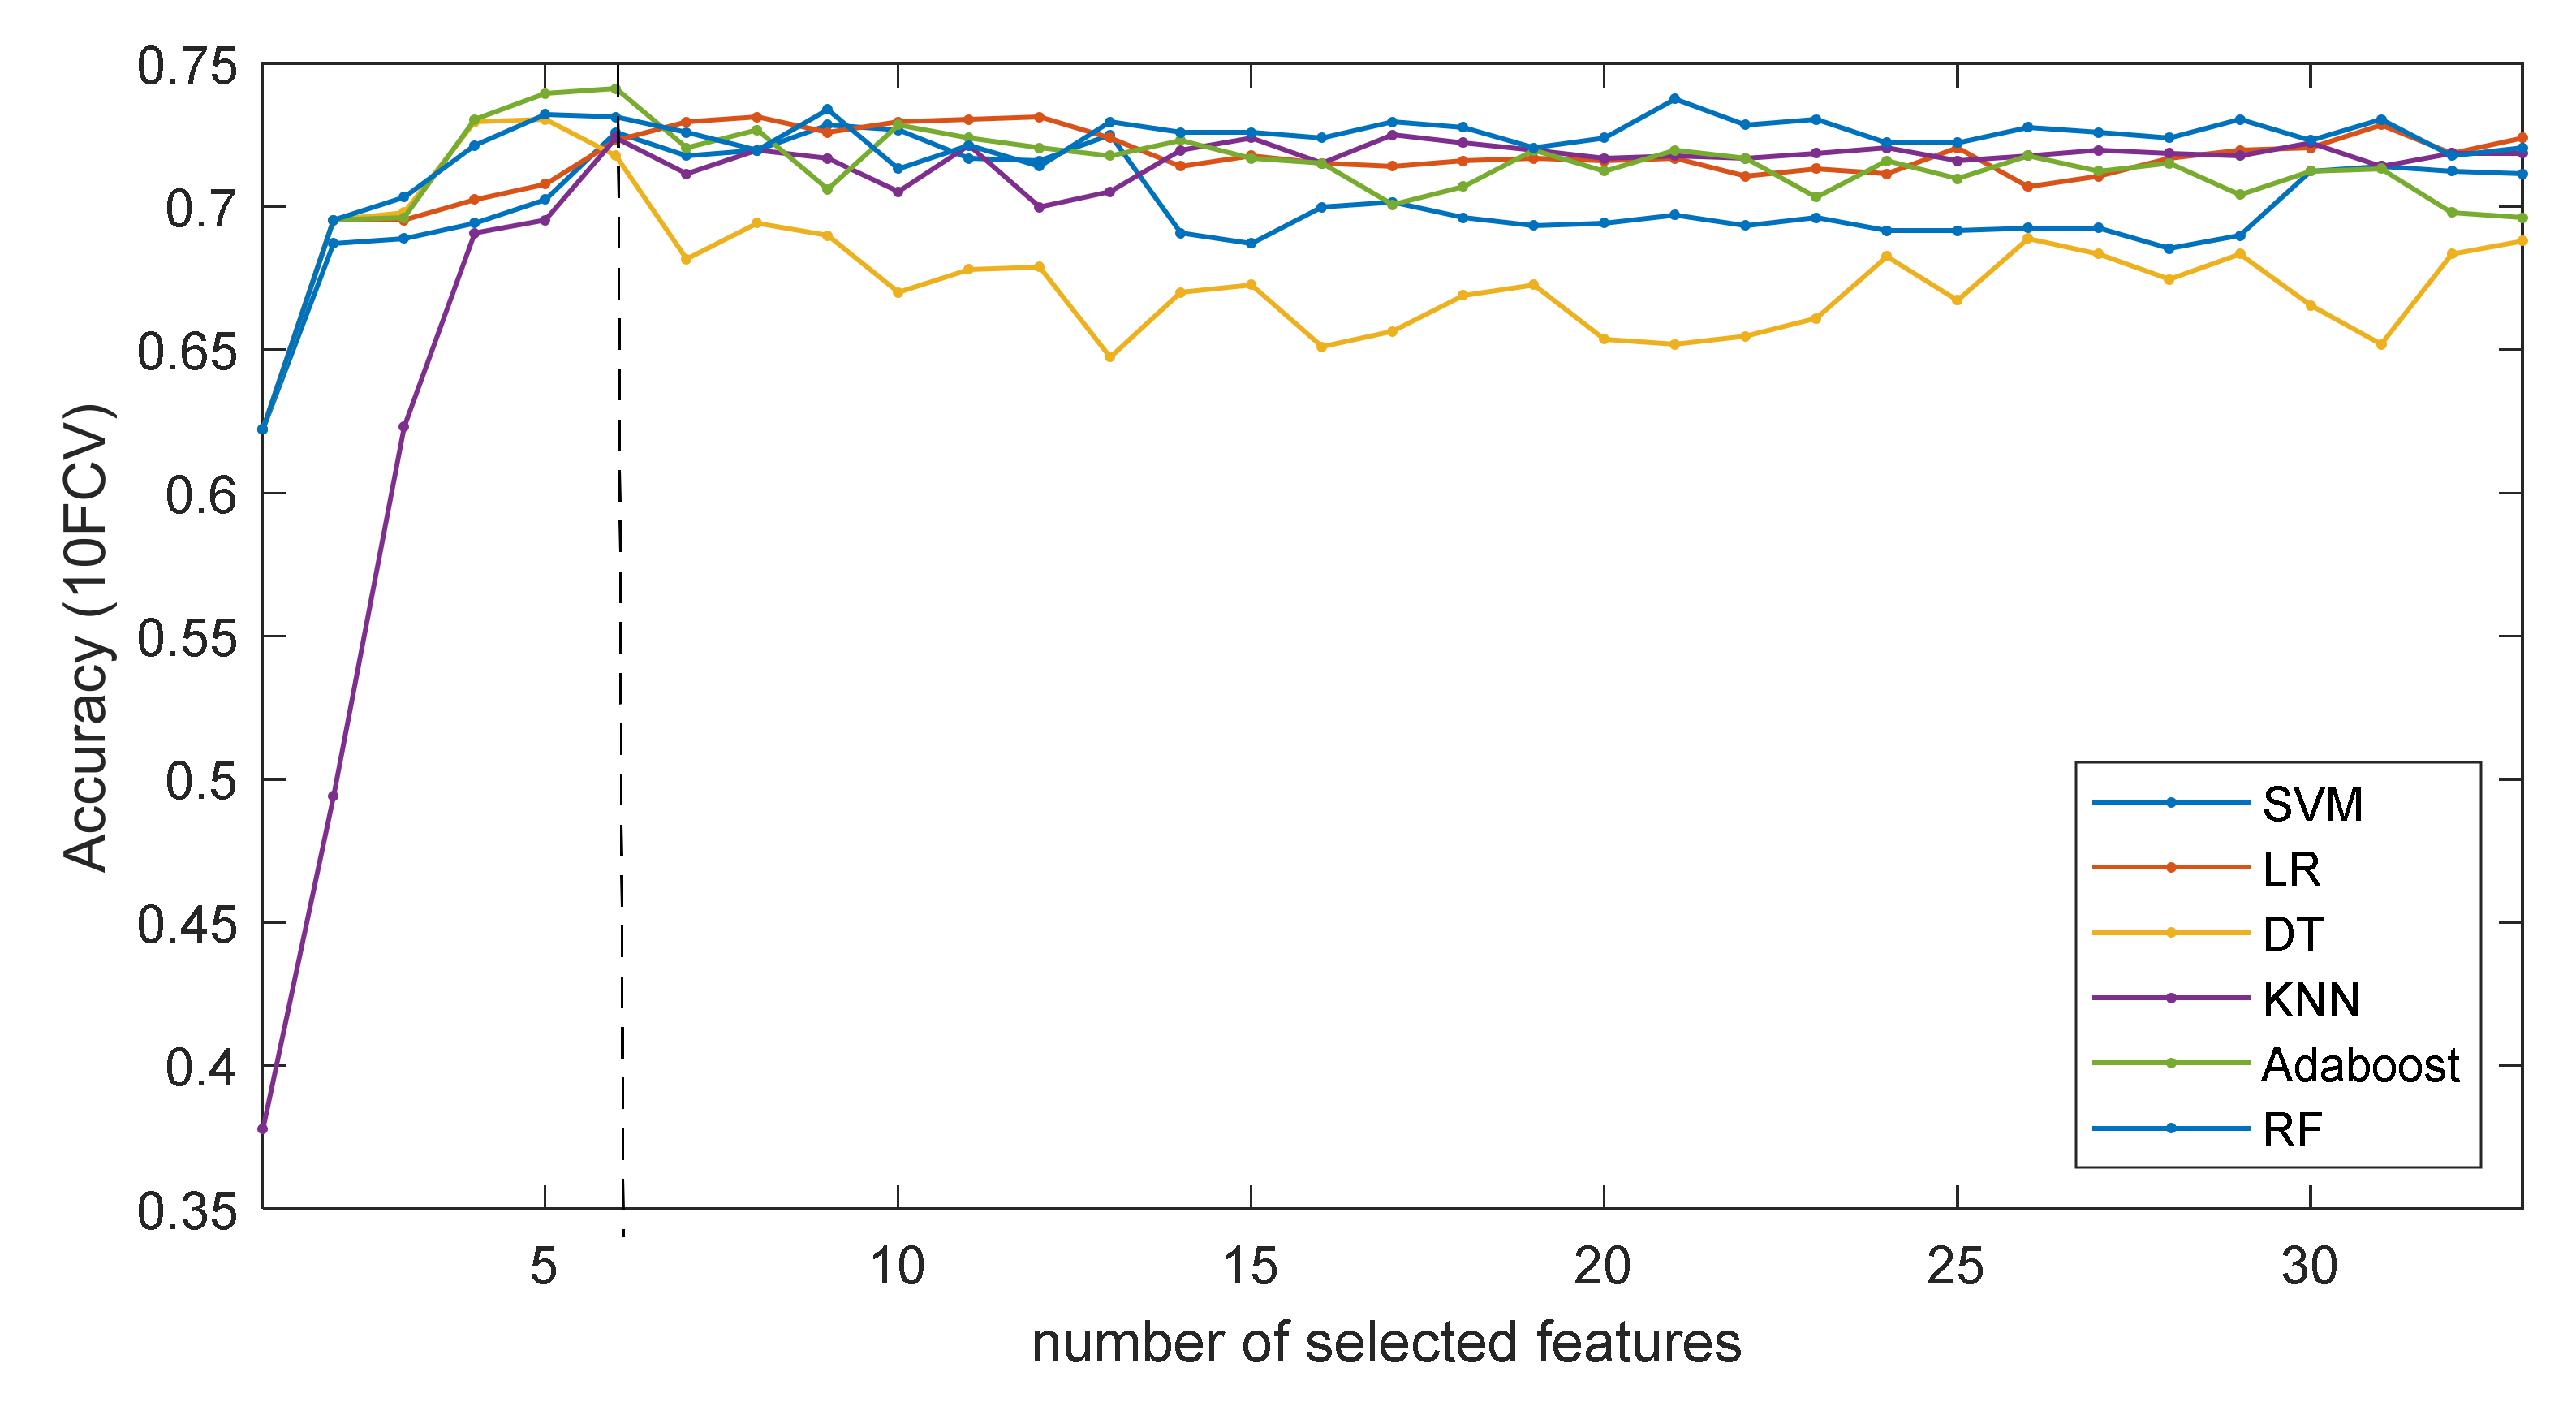
2.3. Statistical Analysis and Feature Selection

Feature Selection (FS) was applied on the pre-processed training dataset to identify variables that are associated with injuries. This reduction of the space dimensionality also reduces the complexity of the final ML models and thus improves their performance and generalization. The SVM-FuzCoC feature selection algorithm, that was proposed in previous studies [38,39], was applied to select a small subset of informative as well as non-redundant (complementary) features. This method achieves a reasonable trade-off between accuracy and computational complexity.
Statistical analysis was performed with Statistical Package for Social Sciences (SPSS), version 25.0. Quantitative variables were described as means with the standard deviations, whereas qualitative variables as percentages reporting 95% confidence intervals. Statistical comparison between risk factors and the outcome was performed using independent-samples t-test for continuous variables and Chi-squared tests for the categorical ones. Statistically significant considered all comparisons with two-tailed p-values smaller than 0.05 with confidence intervals (CI) of 95%.

2.4. Machine Learning Methodology

Various ML models were evaluated for their suitability in the task of predicting injuries. A brief description of these models is given below. We tested logistic regression [24] which is an extension of the linear regression model for classification problems. Logistic regression (LR) models the probabilities for classification problems with two possible outcomes. The response variables can be both categorical or continuous and an iterative maximum likelihood procedure is implemented to fit the final model. Decision Trees (DTs) [40] were also investigated for their suitability. DTs are a non-parametric supervised learning method that is simple to understand and interpret. They require little data preparation and use a hierarchical structure to go from observations about an item (represented in the branches) to conclusions about the item’s target value (represented in the leaves).
Based on their capacity to deal with the overfitting problem that appears in high-dimensional spaces, K-Nearest Neighbor (KNN) [41] as well as non-linear Support Vector Machines (SVM) algorithms [42] were also employed here. In the classification setting, the decision-making mechanism of KNN is driven by a majority vote between the K most similar instances to a given “unseen” observation. Similarity is defined according to a distance metric (Euclidean or other) between two data points. Furthermore, SVMs are a set of supervised learning methods that are effective in high-dimensional feature spaces and have been widely used for both classification and regression. SVMs try to maximize the separation performance and at the same time keep margin between the two classes as wide as possible so that other points can still be classified correctly. Finally, the ensemble techniques Adaboost [43] and Random Forest (RF) [44] were also evaluated using DT models as weak learners. Both ensemble techniques create a set of weak learners (decision trees in our case) whose decisions are combined by aggregating the votes received to decide the final class of the test object. Adaboost proceeds sequentially in multiple rounds using the entire training sample and iteratively improves its performance using information from the classification results in the previous rounds. RF builds independent weak learners on random subsets of the training sample and the most popular class is chosen as the final classification output.
Hyperparameter selection was implemented to optimize the performance of our models and to avoid overfitting and bias errors. Each model was optimized with respect to a number of preselected hyperparameters. (Table 2). The code for the pre-processing of the data, feature selection, implementation and validation of the ML models was implemented in Matlab 2021b (R2021b).

2.5. Validation

The performance of the ML models was evaluated using 10-Fold Cross Validation (10FCV). 10FCV is a modification of the holdout method. Initially the dataset was divided into 10 subsets. Each ML model was trained using data from the k-1 folds and the trained model was then validated on the remaining kth fold. This process was repeated until every fold has served as testing set. Then the final performance of the model was calculated by averaging the 10 recorded scores.
The classification performance of the competing ML models was evaluated with respect to a number of evaluation criteria that are extracted on the basis of the confusion matrix. Specifically, precision, sensitivity, specificity and classification accuracy have been widely utilized in the recent literature to assess the predictive performance of ML techniques in various health applications [45,46,47,48]. The aforementioned metrics are shortly described below.
Precision is also referred to as Positive Predictive Value (PPV) and is defined as follows:
P r e c i s i o n = T P T P + F P
Sensitivity is the proportion of true positives that are correctly identified by the model and is defined by:
S e n s i t i v i t y = T P T P + F N
Specificity is the proportion of the true negatives correctly identified by the model and is defined by:
S p e c i f i c i t y = T N T N + F P
A Receiver Operating Characteristic curve, or ROC curve, is a graphical plot that illustrates the diagnostic ability of a binary classifier system as its discrimination threshold is varied. AUC stands for “Area under the Curve” and provides an aggregate measure of performance across all possible classification thresholds.
Classification Accuracy (ACC) is the percentage of correct predictions (either positive or negative) over the total number of samples.
A c c u r a c y = T P + T N T P + T N + F P + F N

3. Results

3.1. Identification of Important Risk Factors

Figure 1 shows the classification accuracy (10FCV) of the six competing ML models with respect to the number features, as they have been ranked by the proposed FS algorithm. An increase on the classification performance of all ML algorithms was observed for the first 6 selected features, whereas the inclusion of additional features had no significant effect on the classification accuracies. The overall best 10FCV accuracy was obtained by Adaboost at the first six selected features (0.7466). In light of these results, the first six selected features were finally kept for the subsequent analysis.
Table 3 cites the six most important risk factors as they have been selected by the proposed FS methodology. Risk factors associated with the frequency/intensity of exercise (three variables) as well as medical history (two variables) were selected. Gender was also proved to be a contributing factor and was included in the final feature subset.
Independent-samples t-tests were conducted to compare the three continuous factors (F2–F4) with the outcome (injured/non-injured). Chi-square tests of independence were performed to examine the relation between the outcome and the qualitative factors F1, F5 and F6. The results of the statistical analysis verify that there are significant changes between the two subpopulations (C0: non-injured and C1: injured) in all the six selected risk factors. Table 4 below highlights the distribution of samples in the entire population and the two sub-cohorts for each of the six selected risk factors.

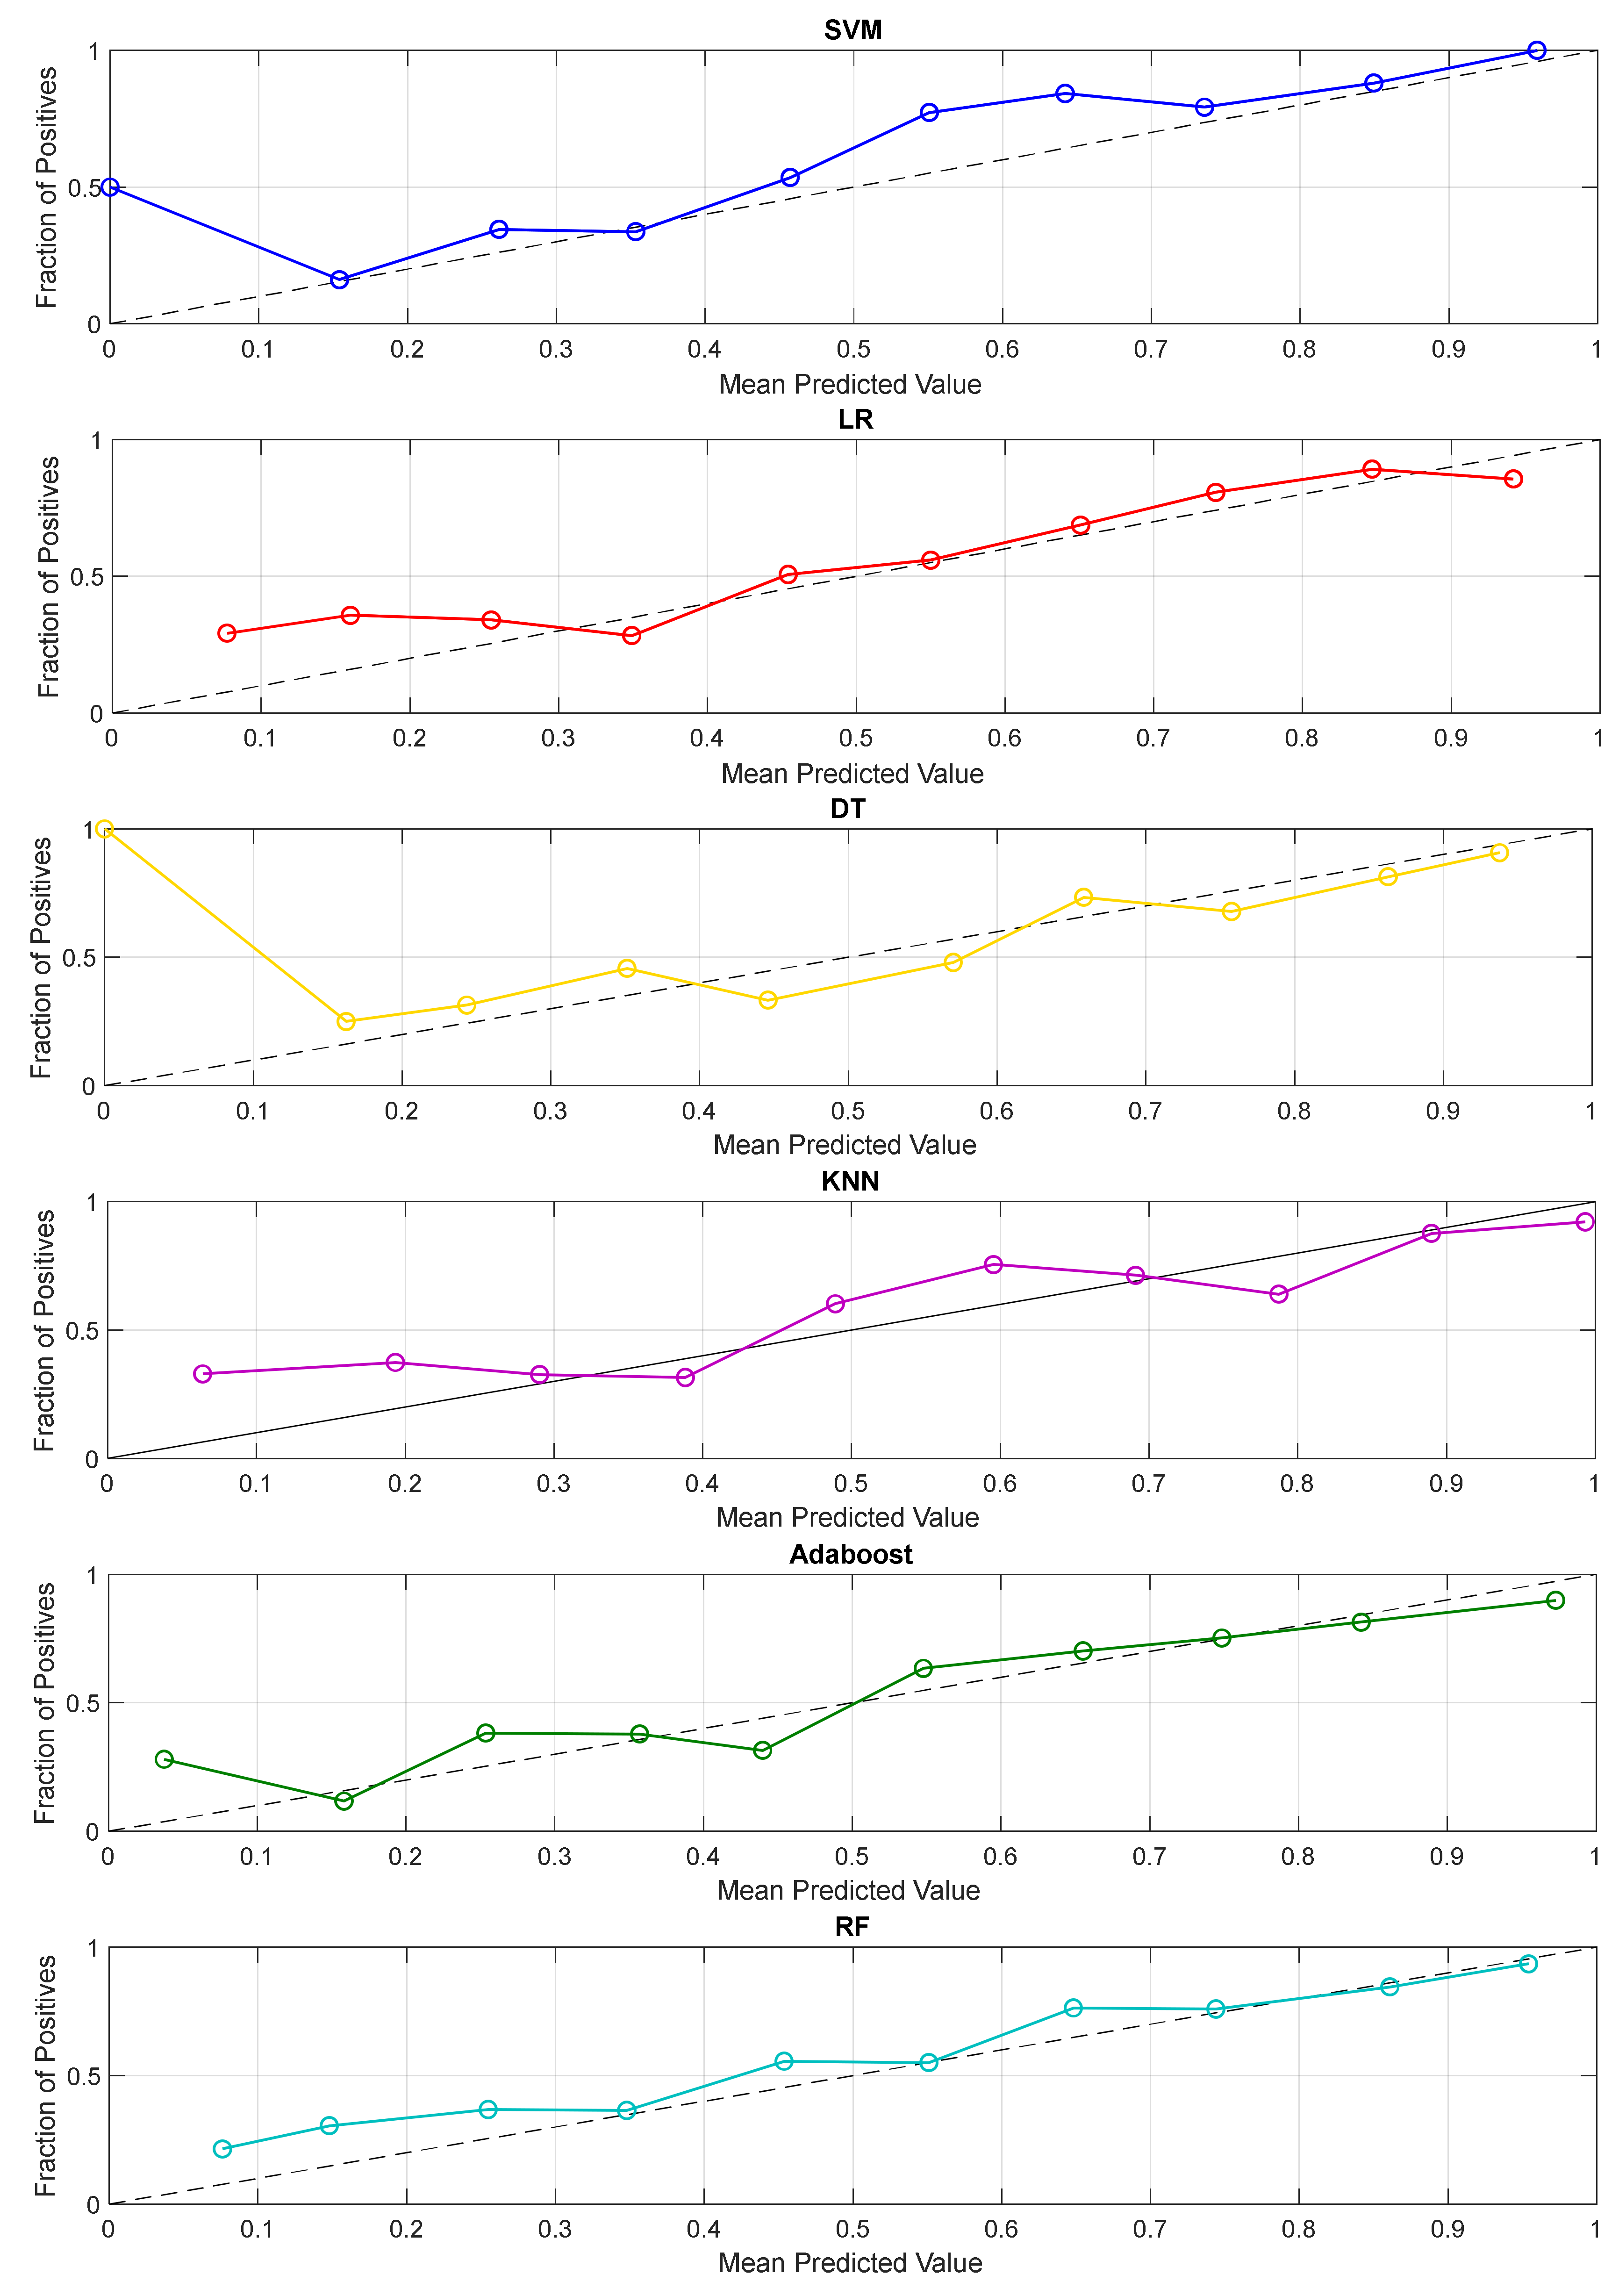
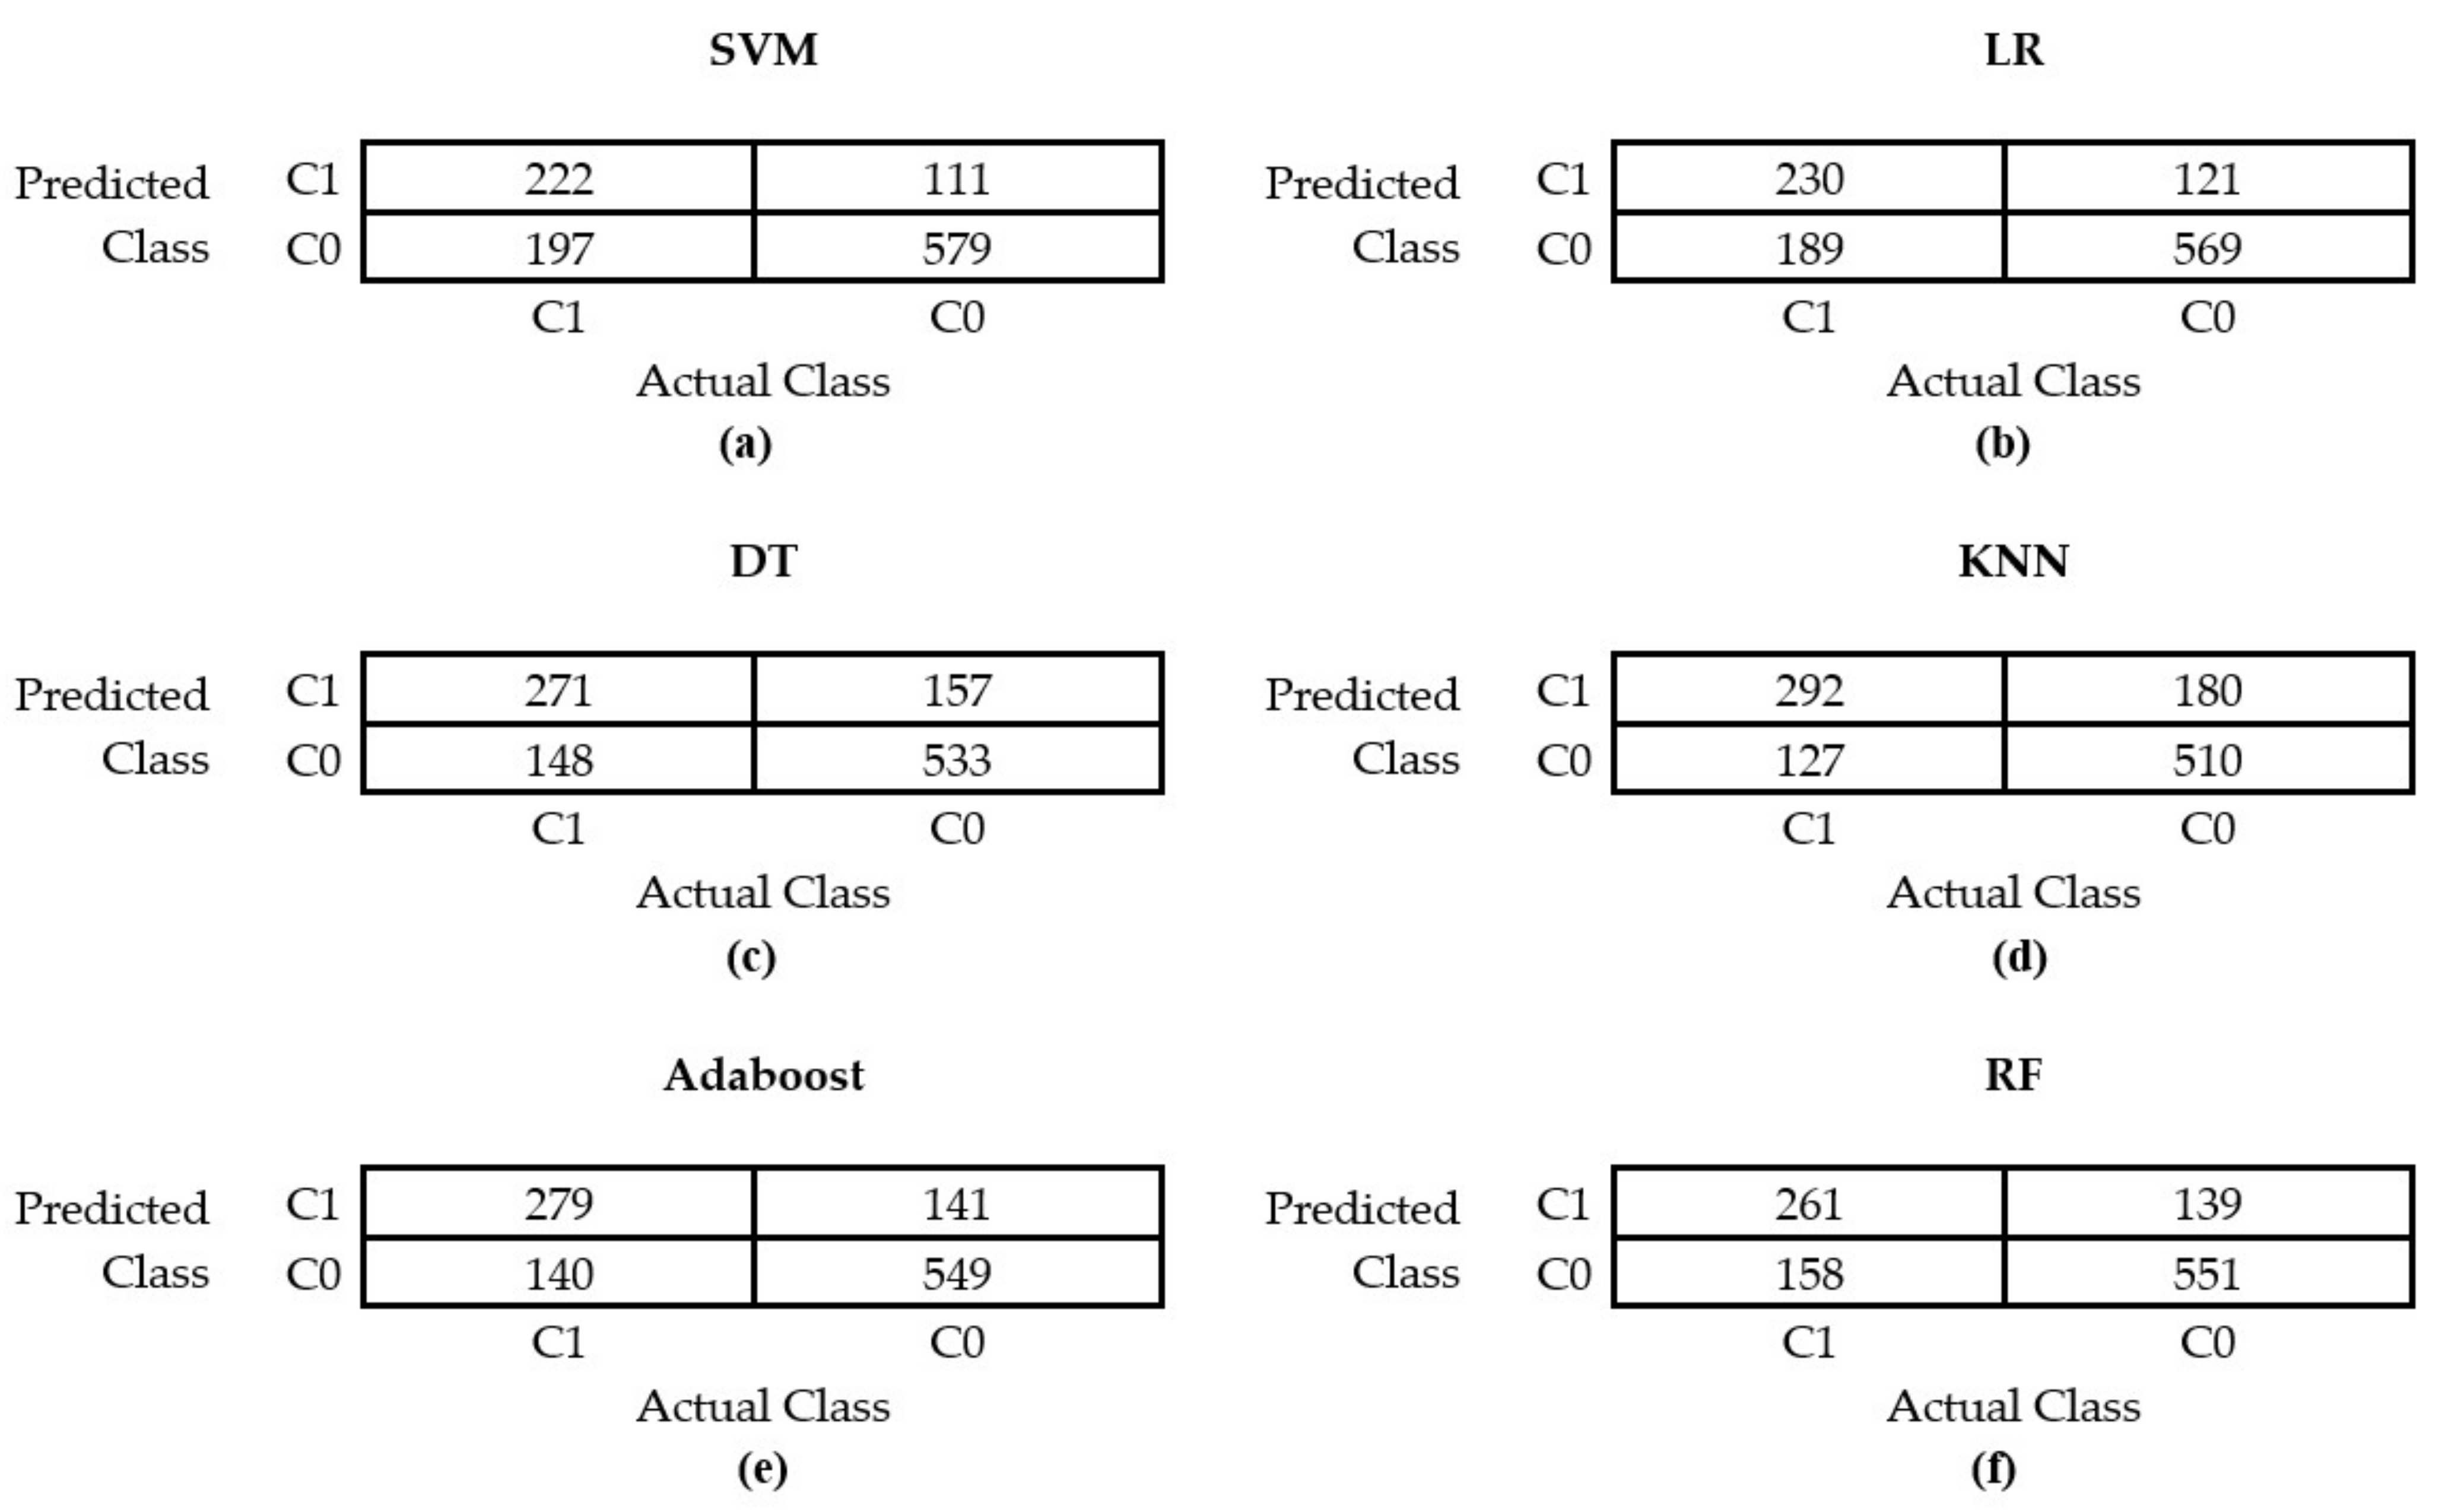
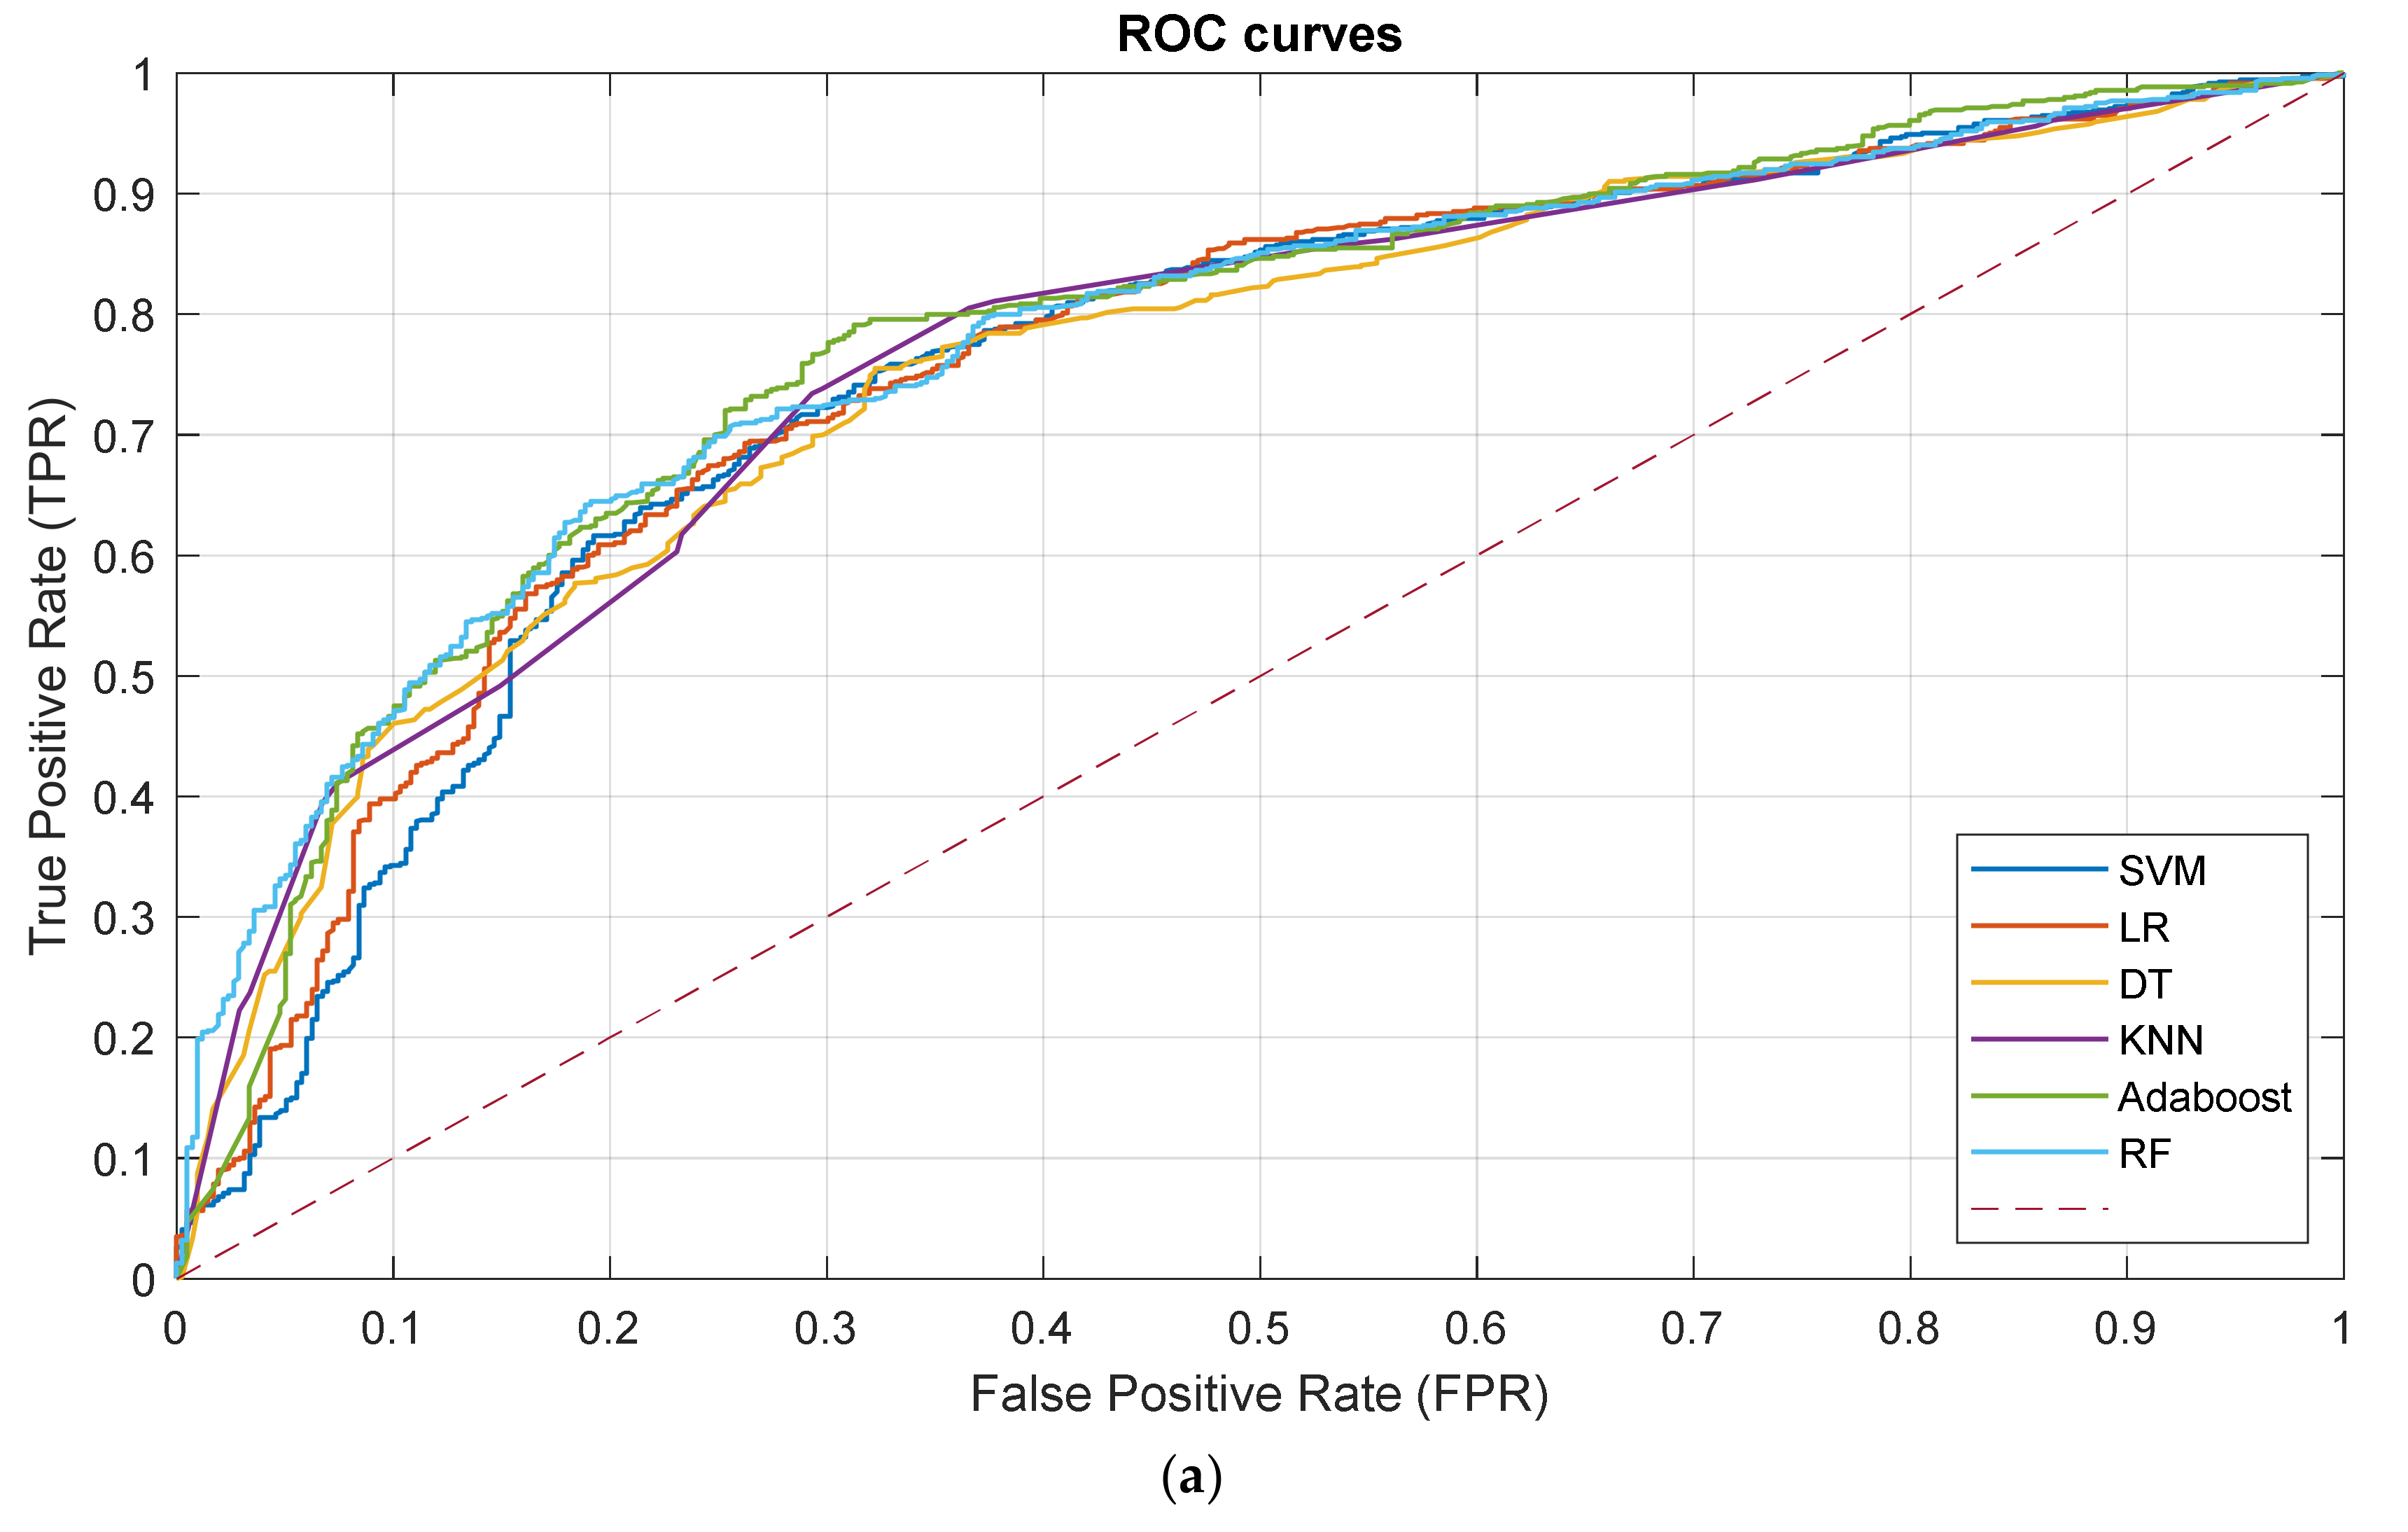
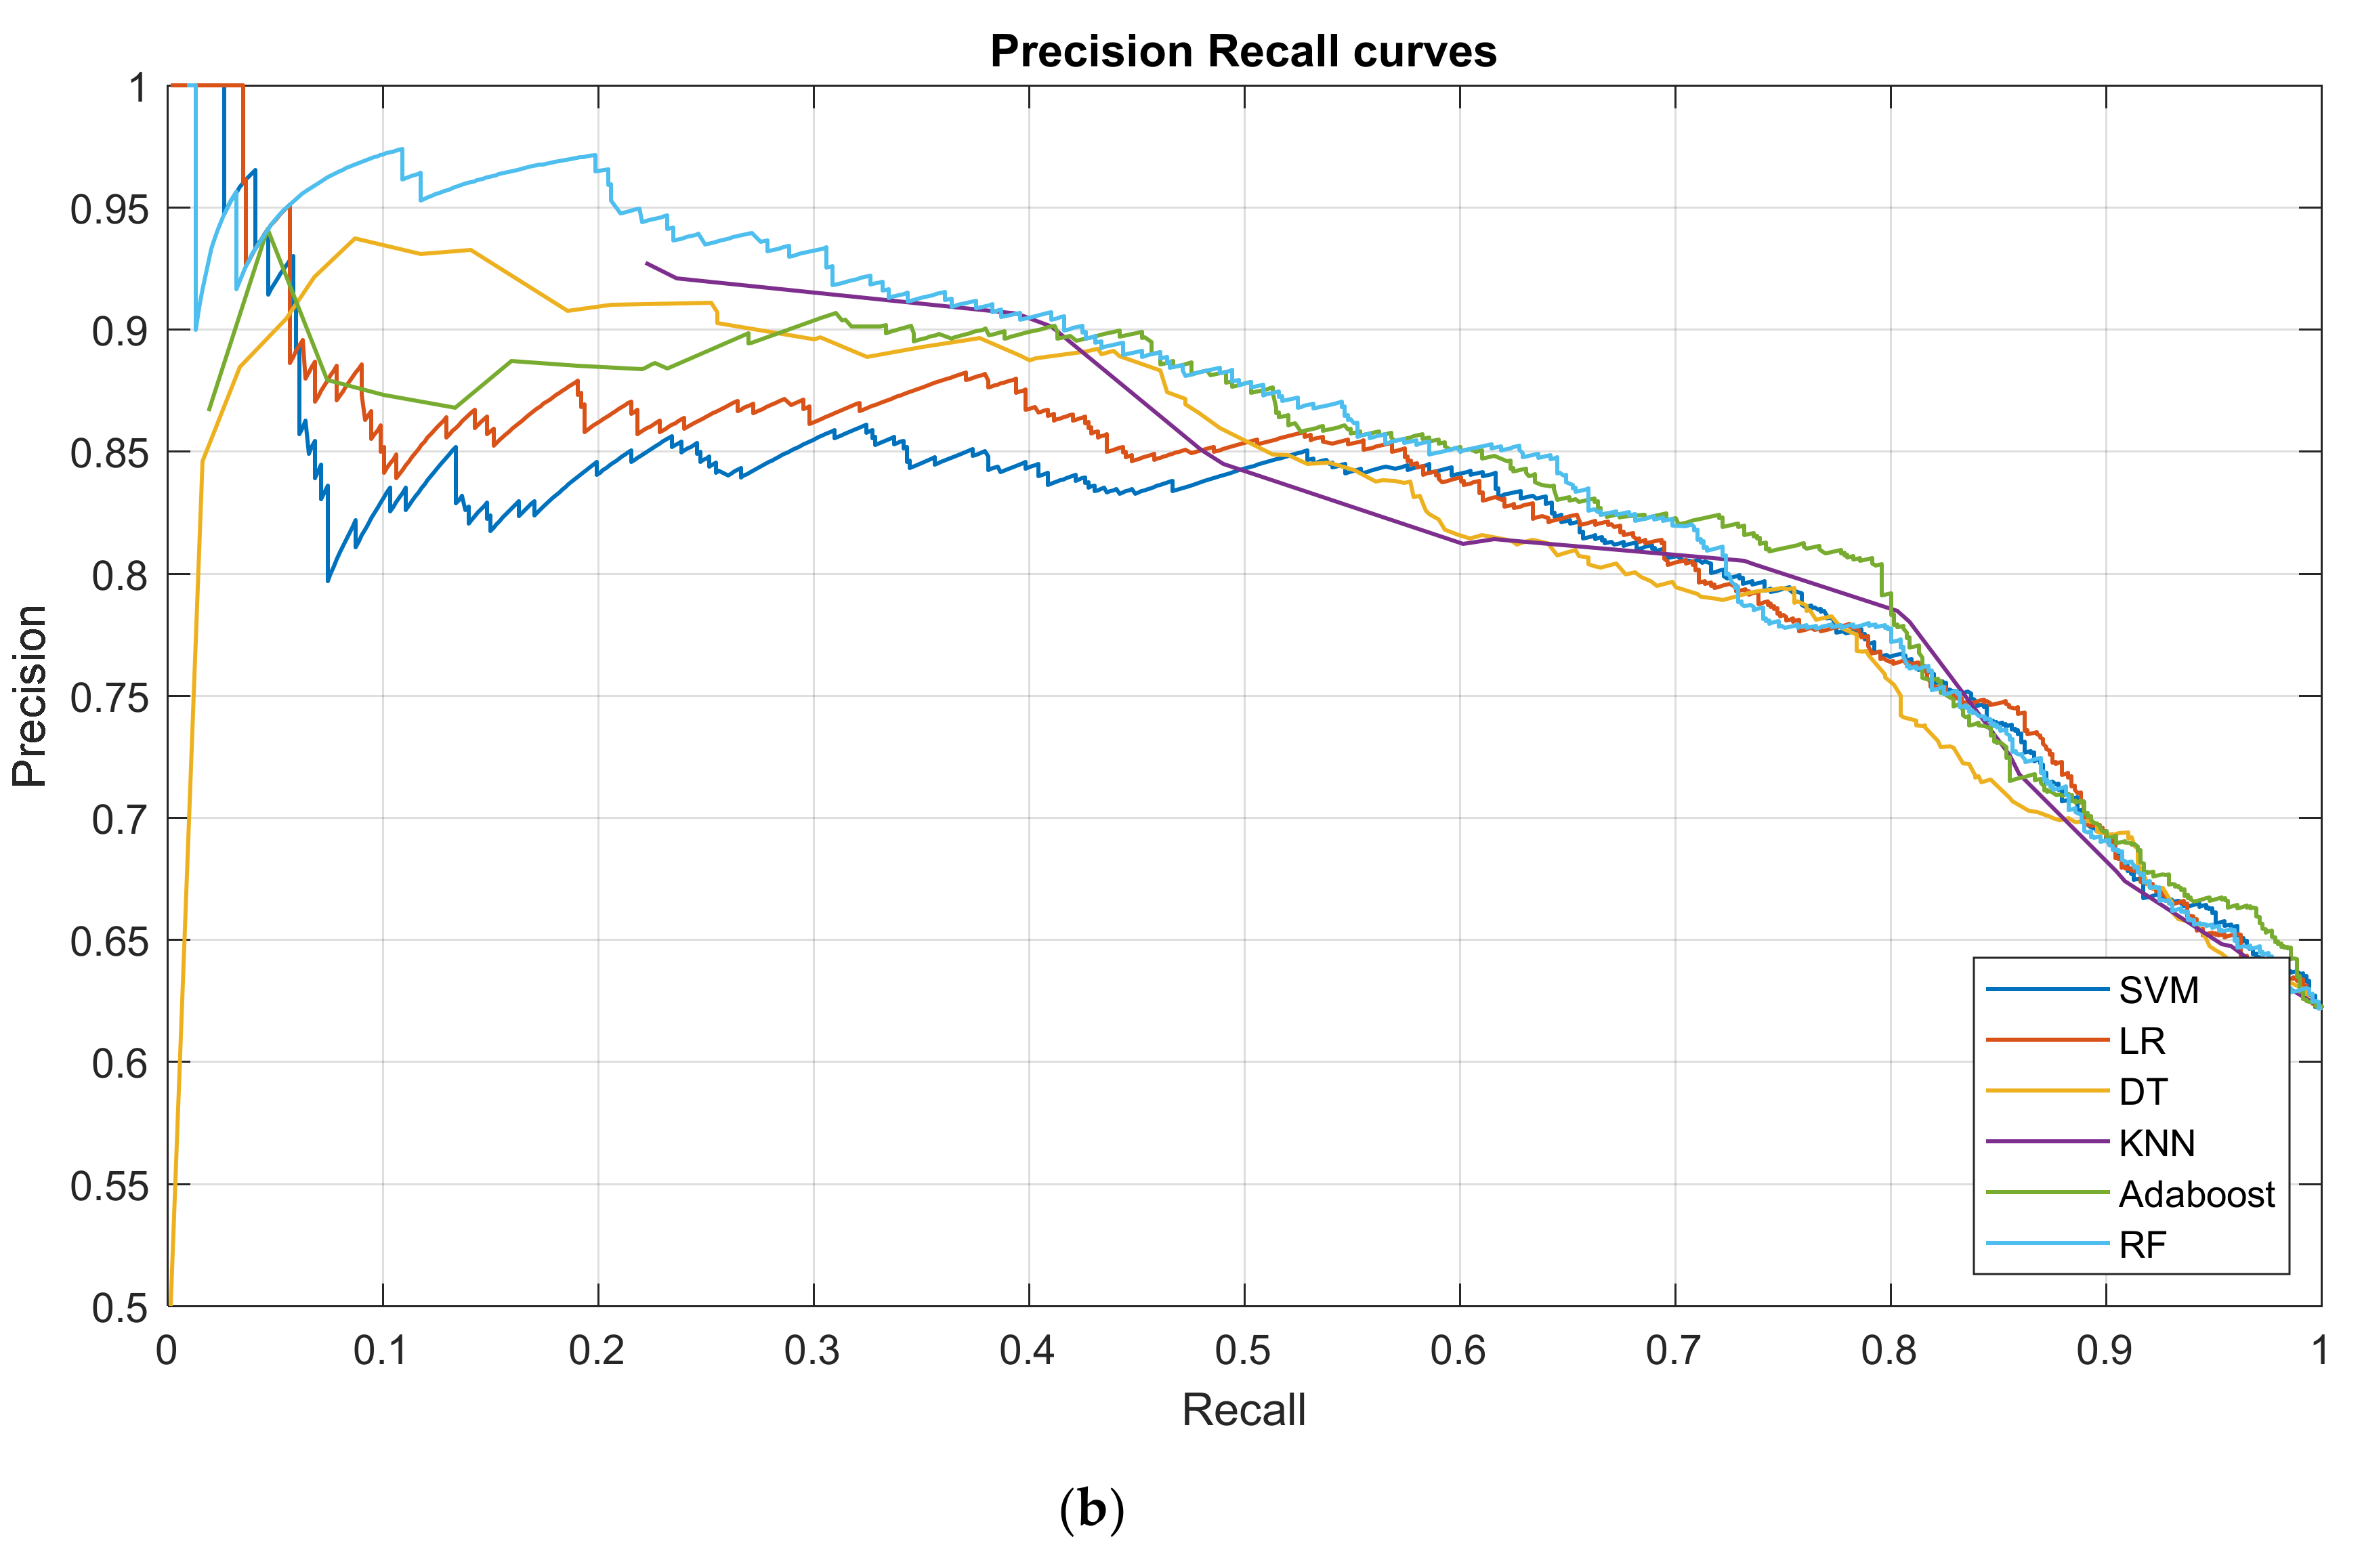
3.2. Prediction Performance

Figure 2 shows the confusion matrixes obtained from the six ML models. The following remarks could be extracted: (i) LR and SVM failed to cope with the class imbalance problem leading to very low accuracies for the minority class of injured subjects (54.9% and 53%, respectively). Overall, they both achieved a 10FCV performance of approximately 72%. (ii) DT and KNN accomplished a similar overall performance (~72%), however they had a better distribution of accuracies among the two classes. Especially, KNN had an almost equivalent performance for participants in both classes (69.7% for class C1 and 73.9% for class C0). (iii) Adaboost accomplished the overall highest 10FCV performance (74.7%) with 66.6% and 79.6% accuracies for classes C1 and C0, respectively. (iv) RF was the second-best classifier with a 73.22% accuracy and a good trade-off between the accuracies in classes C0 and C1 (79.8% and 62.3%).
Table 5 cites the predictive performance of the six ML models with respect to various metrics, whereas the associated ROC and precision recall curves for each of the models are shown in Figure 3. The best AUC performances were achieved by the two ensemble techniques: Adaboost (AUC 0.7793, 95% CI: 0.7466–0.8064) and RF (AUC: 0.7790, 95% CI: 0.7528–0.8063). KNN and LR accomplished slightly lower AUC (0.7658, 95% CI: 0.7353–0.7933 and 0.7610, 95% CI: 0.7341–0.7871, respectively). SVM and DT gave AUC scores in the range of [0.755–0.76]. Precision, sensitivity and specificity of the ML models ranged from 0.74 to 0.8%, 0.73 to 0.83 and 0.52 to 0.69, respectively, as shown in Table 5.
Statistical analysis was also performed using McNemar tests [49] to identify significant differences in the performance of the competing ML models. Adaboost was proved to be significantly more accurate than SVM (p = 0.0162), LR (p = 0.0096), DT (p = 0.0185) and KNN (p = 0.0213) at a confidence level of 5%. Adaboost performance was not statistically higher than the performance of RF (p = 0.0572).
Figure 4 shows reliability graphs for each of the six competing ML models that compare how well the predicted outputs of the binary classifiers are calibrated. The average predicted probabilities for binned predictions are shown in the X axis, whereas Y axis denotes the proportion of samples whose class is positive per bin. Being a measure of uncertainty, the reliability graphs of Figure 4 demonstrate how closely the predicted class probability reflects its ground truth likelihood. The two ensemble algorithms (Adaboost and RF) were proved to be the most reliable ones achieving the lowest observed mean average errors (MAE of 0.0797 and 0.0692, respectively) from the ideal calibration condition (shown with the dashed black line). LR accomplished a moderate MAE of 0.0857, whereas the rest of models achieved MAEs higher than 0.1.
Having accomplished the best accuracy (0.7466), the highest AUC (0.7793), the second highest precision (0.7968), fourth sensitivity (0.7956), second reliability performance and second highest specificity (0.6658) among the six models, Adaboost was proved to be the most efficient model overall.

4. Discussion

In the present study six risk factors for injury during CF training were identified: (i) CF participation in months/years (CF experience); (ii) days/weeks of training; (iii) training duration; (iv) prior to CF level of activity; (v) medical history/previous injuries; (vi) gender. These risk factors have been reported in previous studies related to CF injuries either individually or combined with other risk factors using various statistical methods.
Mehrab et al. (2017) [15] identified CF participation (CF experience) as a risk factor of injury. They suggested that coaches and athletes should focus on correct movement patterns and workouts designed for beginners. This is something that happens in most CF boxes. Every CF training center has a different beginners’ program; therefore, the quality of coaching might vary [15]. It is reasonable that loads can be managed better by more experienced athletes and thus they have smaller injury risk than inexperienced ones [50]. Szeles et al. (2020) [21] found that a 1-year increase in CF experience reduced the odds of sustaining a musculoskeletal injury related to CF by approximately half. On the other hand, Feito et al. (2018) [18] reported that CF athletes with 3 years of experience reported more injuries (43.1%) compared with those with 1 to 3 years (38.8%) and those with less than 1 year (18.0%) of experience. In agreement with their findings Montalvo et al. (2017) [9] and da Costa et al. (2019) [19] found that more CF experience (in years) was associated with higher odds of sustaining a musculoskeletal injury related to CF.
Training frequency is also an important risk factor for injury in CF. According to the American College of Sports Medicine (ACSM) [51] in order to obtain the physiological training effects, such as the cardiovascular conditioning improvement and muscle hypertrophy, training program prescription should include at least 3 training sessions per week. Minghelli & Vicente (2019) [7] in a sample of 885 worldwide athletes, found that participants of CF who trained twice or less than a week had a 3.24 greater probability of injury than those who exercised more. Feito et al. (2018) [18] and Minghelli and Vicente (2019) [7] were in agreement with the finding of the aforementioned studies and particularly they stated that practitioners who trained fewer times a week had increased probability to have an injury than those who trained three or more times a week.
There is conflicting evidence whether the duration of CF participation is a risk factor for injury. Alekseyev et al. (2020) [6] found a positive correlation between injury prevalence and training duration per week in CF athletes. This comes in agreement with studies of Montalvo et al. (2017) [9] and Sprey et al. (2016) [11] who concluded that a higher length of participation in CF was associated with a higher injury incidence. On the other hand Soares (2017) [16], Sprey et al. (2016) [11] and Weisenthal et al. (2014) [8] found no significant difference between injury incidence and training session duration. Further research is needed to determine if CF training duration is related to injuries in CF.
The present study showed that referring medical history to the coach is a risk factor for future injuries in CF. Medical history knowledge can prevent injuries by modifying CF exercises’ parameters and informing coach of any health problems that may affect performance or problems that may endanger the trainee’s health. Therefore, supervision by a proper and trained coach is considered of paramount importance. There is strong evidence that previous injuries increase the risk of future injuries in several sports [52,53,54,55] as well as in CF [21].
To our knowledge there is no clear evidence regarding gender and its relationship with CF related injuries. It is difficult to make a conclusive statement on this since some studies have statistical significant results [8,10,56] but others did not [9,11]. CF is a sport that incorporates movements such as squats, pull-ups and a variety in types of lifting (i.e., Olympic style) combined with overhead movements. In sports that include lifting, female participation used to be uncommon thus documenting gender differences in injury epidemiology is scarce. Keogh et al. (2006) [57] in their study about power lifters found that the injury rate for men was marginally higher than women’s. On the other hand, Quatman et al. (2009) [58] studying weightlifting found that females were at a higher risk of lower extremity injuries compared to males. Females do not have the same increases in strength, power and coordination during puberty compared to men, so gender differences in neuromuscular patterns after the onset of puberty exist [58]. These neuromuscular imbalances may place females at a higher risk of injury [58]. Further studies should examine if any strong relationship exists between gender and CF athletes’ population with respect to injuries prevalence.
Apart from the identification of the most important risk factors, this study also contributes to the development of ML-based models that could potentially predict an injury or at least categorize CF practitioners or athletes into different risk categories (high versus low risk of injury). Despite the improved predictive accuracy achieved by Adaboost compared to the rest of the competing ML models, this remains relatively low (less than 75% in accuracy and less than 78% in AUC). The inability of the ML models to achieve a far superior predictive accuracy could also be attributed to the fact that a relatively small number of risk factors has been considered and that the current dataset lacks quantitative performance-related variables that could provide more detailed and measurable information with respect to the physical state of the athletes. Future work includes the inclusion of data from wearables that could quantify the physical abilities of the CF practitioners. Finally, the employed ML models are treated as black boxes and therefore it is currently impossible to provide explanations on the decisions. To overcome the aforementioned challenges, explainability analysis could be also considered to quantify the contributions of each of the selected risk factors on the prediction outputs.

5. Conclusions

This paper focuses on the development of an ML-based methodology capable of identifying important risk factors which are strongly associated with CF injuries. To facilitate the training process, a survey-based epidemiological study was conducted in Greece to collect data on musculoskeletal injuries in CF practitioners. A variety of ML models were then built on a set of selected features to implement the prediction task. The nature of the selected features was also discussed to increase our understanding of their contribution to potential injury risks. After an extensive experimentation, an AUC of 77.93% was achieved by Adaboost on a group of six selected risk factors. The authors believe that this study will add another puzzle piece to this growing topic, in an attempt to protect CF practitioners and therefore reduce injuries and costs.

Author Contributions

Conceptualization, S.M.; methodology, S.M., A.S. and K.V.; software, S.M.; validation, K.V., I.M. and D.T.; formal analysis, S.M. and A.S.; data collection, I.M. and K.V.; data curation, A.S., K.V. and I.M.; writing—original draft preparation, S.M.; writing—review and editing, K.V., I.M., A.S., E.P. and D.T.; visualization, S.M.; supervision, D.T. and E.P. All authors have read and agreed to the published version of the manuscript.

Funding

This research received no external funding.

Institutional Review Board Statement

The study was conducted in accordance with the Declaration of Helsinki and approved by the Ethical Committee of the Faculty of Physiotherapy, School of Health Sciences, Univer-sity of Thessaly (n.1575ΣΕ2/13-4-2020).

Informed Consent Statement

Informed consent was obtained from all subjects involved in the study.

Data Availability Statement

Data is contained within the article.

Acknowledgments

We would like to thank all the participants who took part in this study. A special thanks to Lambros Kourtis for his helpful comments and suggestions.

Conflicts of Interest

The authors declare no conflict of interest.

References

  1. Ratey, J.J.; Loehr, J.E. The Positive Impact of Physical Activity on Cognition during Adulthood: A Review of Underlying Mechanisms, Evidence and Recommendations. Rev. Neurosci. 2011, 22, 171–185. [Google Scholar] [CrossRef]
  2. Sun, F.; Norman, I.J.; While, A.E. Physical Activity in Older People: A Systematic Review. BMC Public Health 2013, 13, 449. [Google Scholar] [CrossRef] [Green Version]
  3. Xiong, J.; Ye, M.; Wang, L.; Zheng, G. Effects of Physical Exercise on Executive Function in Cognitively Healthy Older Adults: A Systematic Review and Meta-Analysis of Randomized Controlled Trials: Physical Exercise for Executive Function. Int. J. Nurs. Stud. 2020, 114, 103810. [Google Scholar] [CrossRef]
  4. Bahr, R.; Holme, I. Risk Factors for Sports Injuries—A Methodological Approach. Br. J. Sports Med. 2003, 37, 384–392. [Google Scholar] [CrossRef] [PubMed]
  5. Myklebust, G.; Holm, I.; Mæhlum, S.; Engebretsen, L.; Bahr, R. Clinical, Functional, and Radiologic Outcome in Team Handball Players 6 to 11 Years after Anterior Cruciate Ligament Injury: A Follow-up Study. Am. J. Sports Med. 2003, 31, 981–989. [Google Scholar] [CrossRef]
  6. Alekseyev, K.; John, A.; Malek, A.; Lakdawala, M.; Verma, N.; Southall, C.; Nikolaidis, A.; Akella, S.; Erosa, S.; Islam, R. Identifying the Most Common CrossFit Injuries in a Variety of Athletes. Rehabil. Process Outcome 2020, 9, 1179572719897069. [Google Scholar] [CrossRef] [PubMed]
  7. Minghelli, B.; Vicente, P. Musculoskeletal Injuries in Portuguese CrossFit Practitioners. J. Sports Med. Phys. Fit. 2019, 59, 1213–1220. [Google Scholar] [CrossRef]
  8. Weisenthal, B.M.; Beck, C.A.; Maloney, M.D.; DeHaven, K.E.; Giordano, B.D. Injury Rate and Patterns among CrossFit Athletes. Orthop. J. Sports Med. 2014, 2, 2325967114531177. [Google Scholar] [CrossRef] [PubMed]
  9. Montalvo, A.M.; Shaefer, H.; Rodriguez, B.; Li, T.; Epnere, K.; Myer, G.D. Retrospective Injury Epidemiology and Risk Factors for Injury in CrossFit. J. Sports Sci. Med. 2017, 16, 53. [Google Scholar] [PubMed]
  10. Moran, S.; Booker, H.; Staines, J.; Williams, S. Rates and Risk Factors of Injury in CrossFit: A Prospective Cohort Study. J. Sports Med. Phys Fit. 2017, 57, 1147–1153. [Google Scholar]
  11. Sprey, J.W.C.; Ferreira, T.; de Lima, M.V.; Duarte Jr, A.; Jorge, P.B.; Santili, C. An Epidemiological Profile of Crossfit Athletes in Brazil. Orthop. J. Sports Med. 2016, 4, 2325967116663706. [Google Scholar] [CrossRef] [PubMed] [Green Version]
  12. Meyer, J.; Morrison, J.; Zuniga, J. The Benefits and Risks of CrossFit: A Systematic Review. Workplace Health Saf. 2017, 65, 612–618. [Google Scholar] [CrossRef] [PubMed]
  13. Da Silva, C. A Profile of Injuries among Participants at the 2013 CrossFit Games in Durban 2015. Diss. 2015. Available online: https://openscholar.dut.ac.za/handle/10321/1415 (accessed on 10 December 2021).
  14. Summitt, R.J.; Cotton, R.A.; Kays, A.C.; Slaven, E.J. Shoulder Injuries in Individuals Who Participate in CrossFit Training. Sports Health 2016, 8, 541–546. [Google Scholar] [CrossRef] [Green Version]
  15. Mehrab, M.; de Vos, R.-J.; Kraan, G.A.; Mathijssen, N.M.C. Injury Incidence and Patterns among Dutch CrossFit Athletes. Orthop. J. Sports Med. 2017, 5, 2325967117745263. [Google Scholar] [CrossRef] [PubMed] [Green Version]
  16. Soares, M.R.A.D.R. An Epidemiological Profile of Crossfit Participants in Portugal 2017. Master’s Thesis, Universidade Lusófona de Humanidades e Tecnologias, Lisabon, Portugal, 2017. [Google Scholar]
  17. Tafuri, S.; Salatino, G.; Napoletano, P.; Monno, A.; Notarnicola, A. The Risk of Injuries among CrossFit Athletes: An Italian Observational Retrospective Survey. J. Sports Med. Phys. Fit. 2019, 59, 1544–1550. [Google Scholar] [CrossRef] [PubMed]
  18. Feito, Y.; Burrows, E.K.; Tabb, L.P. A 4-Year Analysis of the Incidence of Injuries Among CrossFit-Trained Participants. Orthop. J. Sports Med. 2018, 6, 2325967118803100. [Google Scholar] [CrossRef] [PubMed] [Green Version]
  19. Da Costa, T.S.; Louzada, C.T.N.; Miyashita, G.K.; da Silva, P.H.J.; Sungaila, H.Y.F.; Lara, P.H.S.; Pochini, A.D.C.; Ejnisman, B.; Cohen, M.; Arliani, G.G. CrossFit®: Injury Prevalence and Main Risk Factors. Clinics 2019, 74, e1402. [Google Scholar] [CrossRef] [Green Version]
  20. de Oliveira, M.G.; Pereira, L.G.C.; Teymeny, A.A.T.A.T. Incidência de lesões musculoesqueléticas em praticantes de CrossFit. Rev. Ciências da Saúde-UNIPLAN 2019, 1, 11. [Google Scholar]
  21. Szeles, P.R.D.Q.; da Costa, T.S.; da Cunha, R.A.; Hespanhol, L.; de Castro Pochini, A.; Ramos, L.A.; Cohen, M. CrossFit and the Epidemiology of Musculoskeletal Injuries: A Prospective 12-Week Cohort Study. Orthop. J. Sports Med. 2020, 8, 2325967120908884. [Google Scholar]
  22. Gile, M.; Petit, J.; Gremeaux, V. Évaluation Du Taux de Blessures Chez Les Pratiquants de CrossFit En France. J. Traumatol. du Sport 2020, 37, 2–9. [Google Scholar] [CrossRef]
  23. Rodríguez, M.Á.; García-Calleja, P.; Terrados, N.; Crespo, I.; Del Valle, M.; Olmedillas, H. Injury in CrossFit®: A Systematic Review of Epidemiology and Risk Factors. Phys. Sportsmed. 2021, 50, 3–10. [Google Scholar] [CrossRef] [PubMed]
  24. Bini, S.A. Artificial Intelligence, Machine Learning, Deep Learning, and Cognitive Computing: What Do These Terms Mean and How Will They Impact Health Care? J. Arthroplasty 2018, 33, 2358–2361. [Google Scholar] [CrossRef] [PubMed]
  25. Belk, J.W.; Marshall, H.A.; McCarty, E.C.; Kraeutler, M.J. The Effect of Regular-Season Rest on Playoff Performance among Players in the National Basketball Association. Orthop. J. Sports Med. 2017, 5, 2325967117729798. [Google Scholar] [CrossRef] [PubMed]
  26. Ofoghi, B.; Zeleznikow, J.; MacMahon, C.; Raab, M. Data Mining in Elite Sports: A Review and a Framework. Meas. Phys. Educ. Exerc. Sci. 2013, 17, 171–186. [Google Scholar] [CrossRef]
  27. Zelič, I.; Kononenko, I.; Lavrač, N.; Vuga, V. Induction of Decision Trees and Bayesian Classification Applied to Diagnosis of Sport Injuries. J. Med. Syst. 1997, 21, 429–444. [Google Scholar] [CrossRef] [PubMed]
  28. Fielitz, L.; Scott, D. Prediction of Physical Performance Using Data Mining.(Measurement). Res. Q. Exerc. Sport 2003, 74, A25. [Google Scholar]
  29. Andrews, P.J.D.; Sleeman, D.H.; Statham, P.F.X.; McQuatt, A.; Corruble, V.; Jones, P.A.; Howells, T.P.; Macmillan, C.S.A. Predicting Recovery in Patients Suffering from Traumatic Brain Injury by Using Admission Variables and Physiological Data: A Comparison between Decision Tree Analysis and Logistic Regression. J. Neurosurg. 2002, 97, 326–336. [Google Scholar] [CrossRef] [PubMed] [Green Version]
  30. Richter, C.; King, E.; Falvey, E.; Franklyn-Miller, A. Supervised Learning Techniques and Their Ability to Classify a Change of Direction Task Strategy Using Kinematic and Kinetic Features. J. Biomech. 2018, 66, 1–9. [Google Scholar] [CrossRef] [PubMed]
  31. Wright, A.; Karnuta, J.; Luu, B.; Haeberle, H.; Makhni, E.; Schickendantz, M.; Ramkumar, P. Machine Learning Accurately Predicts Next Season NHL Player Injury Before It Occurs: Validation of 10,449 Player-Years from 2007-17. Orthop. J. Sports Med. 2020, 8, 2325967120S00360. [Google Scholar] [CrossRef]
  32. Rommers, N.; Rössler, R.; Verhagen, E.; Vandecasteele, F.; Verstockt, S.; Lenoir, M.; D’Hondt, E.; Witvrouw, E. 009 Big Data in Youth Elite Football: Could Machine Learning Help Us to Better Understand Injury Risk? Br. J. Sports Med. 2020, 54, A5. [Google Scholar]
  33. Jaspers, A.; De Beéck, T.O.; Brink, M.S.; Frencken, W.G.P.; Staes, F.; Davis, J.J.; Helsen, W.F. Relationships between the External and Internal Training Load in Professional Soccer: What Can We Learn from Machine Learning? Int. J. Sports Physiol. Perform. 2018, 13, 625–630. [Google Scholar] [CrossRef] [PubMed]
  34. Ruddy, J.D.; Shield, A.J.; Maniar, N.; Williams, M.D.; Duhig, S.; Timmins, R.G.; Hickey, J.; Bourne, M.N.; Opar, D.A. Predictive Modeling of Hamstring Strain Injuries in Elite Australian Footballers. Med. Sci. Sports Exerc. 2018, 50, 906–914. [Google Scholar] [CrossRef] [PubMed] [Green Version]
  35. Karnuta, J.M.; Luu, B.C.; Haeberle, H.S.; Saluan, P.M.; Frangiamore, S.J.; Stearns, K.L.; Farrow, L.D.; Nwachukwu, B.U.; Verma, N.N.; Makhni, E.C. Machine Learning Outperforms Regression Analysis to Predict Next-Season Major League Baseball Player Injuries: Epidemiology and Validation of 13,982 Player-Years from Performance and Injury Profile Trends, 2000–2017. Orthop. J. Sports Med. 2020, 8, 2325967120963046. [Google Scholar] [CrossRef] [PubMed]
  36. Jauhiainen, S.; Kauppi, J.-P.; Leppänen, M.; Pasanen, K.; Parkkari, J.; Vasankari, T.; Kannus, P.; Äyrämö, S. New Machine Learning Approach for Detection of Injury Risk Factors in Young Team Sport Athletes. Int. J. Sports Med. 2021, 42, 175–182. [Google Scholar] [CrossRef] [PubMed]
  37. Arifin, W.N. Introduction to Sample Size Calculation. Educ. Med. J. 2013, 2, e89–e96. [Google Scholar] [CrossRef]
  38. Moustakidis, S.P.; Theocharis, J.B. SVM-FuzCoC: A Novel SVM-Based Feature Selection Method Using a Fuzzy Complementary Criterion. Pattern Recognit. 2010, 43, 3712–3729. [Google Scholar] [CrossRef]
  39. Moustakidis, S.P.; Theocharis, J.B.; Giakas, G. Feature Selection Based on a Fuzzy Complementary Criterion: Application to Gait Recognition Using Ground Reaction Forces. Comput. Methods Biomech. Biomed. Eng. 2012, 15, 627–644. [Google Scholar] [CrossRef] [PubMed]
  40. Witten, I.; Frank, E.; Hall, M. Introduction to Data Mining. In Data Mining: Practical Machine Learning Tools and Techniques, 3rd ed.; Morgan Kaufmann-Elsevier: Burlington, MA, USA, 2011. [Google Scholar]
  41. Atkeson, C.G.; Moore, A.W.; Schaal, S. Locally Weighted Learning. In Lazy Learning; Springer: Berlin/Heidelberg, Germany, 1997; pp. 11–73. [Google Scholar]
  42. Cortes, C.; Vapnik, V. Support-Vector Networks. Mach. Learn. 1995, 20, 273–297. [Google Scholar] [CrossRef]
  43. Freund, Y.; Schapire, R.E. A Decision-Theoretic Generalization of on-Line Learning and an Application to Boosting. J. Comput. Syst. Sci. 1997, 55, 119–139. [Google Scholar] [CrossRef] [Green Version]
  44. Breiman, L. Random Forests. Mach. Learn. 2001, 45, 5–32. [Google Scholar] [CrossRef] [Green Version]
  45. Le, N.Q.K.; Kha, Q.H.; Nguyen, V.H.; Chen, Y.-C.; Cheng, S.-J.; Chen, C.-Y. Machine Learning-Based Radiomics Signatures for EGFR and KRAS Mutations Prediction in Non-Small-Cell Lung Cancer. Int. J. Mol. Sci. 2021, 22, 9254. [Google Scholar] [CrossRef]
  46. Hung, T.N.K.; Le, N.Q.K.; Le, N.H.; Van Tuan, L.; Nguyen, T.P.; Thi, C.; Kang, J.-H. An AI-based Prediction Model for Drug-drug Interactions in Osteoporosis and Paget’s Diseases from SMILES. Mol. Inform. 2022, 2100264. [Google Scholar] [CrossRef] [PubMed]
  47. Kokkotis, C.; Ntakolia, C.; Moustakidis, S.; Giakas, G.; Tsaopoulos, D. Explainable Machine Learning for Knee Osteoarthritis Diagnosis Based on a Novel Fuzzy Feature Selection Methodology. Phys. Eng. Sci. Med. 2022, 1–11. [Google Scholar] [CrossRef] [PubMed]
  48. Kampaktsis, P.N.; Tzani, A.; Doulamis, I.P.; Moustakidis, S.; Drosou, A.; Diakos, N.; Drakos, S.G.; Briasoulis, A. State-of-the-art Machine Learning Algorithms for the Prediction of Outcomes after Contemporary Heart Transplantation: Results from the UNOS Database. Clin. Transplant. 2021, 35, e14388. [Google Scholar] [CrossRef]
  49. Fagerland, M.W.; Lydersen, S.; Laake, P. The McNemar Test for Binary Matched-Pairs Data: Mid-p and Asymptotic Are Better than Exact Conditional. BMC Med. Res. Methodol. 2013, 13, 91. [Google Scholar] [CrossRef] [Green Version]
  50. Junior, L.C.H.; Costa, L.O.P.; Carvalho, A.C.A.; Lopes, A.D. A Description of Training Characteristics and Its Association with Previous Musculoskeletal Injuries in Recreational Runners: A Cross-Sectional Study. Braz. J. Phys. Ther. 2012, 16, 46–53. [Google Scholar]
  51. Ferguson, B. ACSM’s Guidelines for Exercise Testing and Prescription 9th Ed. 2014. J. Can. Chiropr. Assoc. 2014, 58, 328. [Google Scholar]
  52. Agresta, C.E.; Krieg, K.; Freehill, M.T. Risk Factors for Baseball-Related Arm Injuries: A Systematic Review. Orthop. J. Sports Med. 2019, 7, 2325967119825557. [Google Scholar] [CrossRef] [PubMed] [Green Version]
  53. Girometti, R.; De Candia, A.; Sbuelz, M.; Toso, F.; Zuiani, C.; Bazzocchi, M. Supraspinatus Tendon US Morphology in Basketball Players: Correlation with Main Pathologic Models of Secondary Impingement Syndrome in Young Overhead Athletes. Preliminary Report. Radiol. Med. 2006, 111, 42–52. [Google Scholar] [CrossRef]
  54. Giroto, N.; Hespanhol Junior, L.C.; Gomes, M.R.C.; Lopes, A.D. Incidence and Risk Factors of Injuries in Brazilian Elite Handball Players: A Prospective Cohort Study. Scand. J. Med. Sci. Sports 2017, 27, 195–202. [Google Scholar] [CrossRef]
  55. Saragiotto, B.T.; Yamato, T.P.; Junior, L.C.H.; Rainbow, M.J.; Davis, I.S.; Lopes, A.D. What Are the Main Risk Factors for Running-Related Injuries? Sports Med. 2014, 44, 1153–1163. [Google Scholar] [CrossRef] [PubMed]
  56. Grier, T.; Canham-Chervak, M.; McNulty, V.; Jones, B.H. Extreme Conditioning Programs and Injury Risk in a US Army Brigade Combat Team. US Army Med. Dep. J. 2013, 11, 36–47. [Google Scholar]
  57. Keogh, J.; Hume, P.A.; Pearson, S. Retrospective Injury Epidemiology of One Hundred One Competitive Oceania Power Lifters: The Effects of Age, Body Mass, Competitive Standard, and Gender. J. Strength Cond. Res. 2006, 20, 672–681. [Google Scholar] [CrossRef] [PubMed]
  58. Quatman, C.E.; Myer, G.D.; Khoury, J.; Wall, E.J.; Hewett, T.E. Sex Differences in “Weightlifting” Injuries Presenting to United States Emergency Rooms. J. Strength Cond. Res. Strength Cond. Assoc. 2009, 23, 2061–2067. [Google Scholar] [CrossRef] [PubMed] [Green Version]
Figure 1. Accuracy with respect to the number of selected features for all the competing algorithms.
Algorithms 15 00077 g001
Figure 2. Confusion matrixes of the six competing ML models: (a) SVM, (b) LR, (c) DT, (d) KNN, (e) Adaboost and (f) RF.
Algorithms 15 00077 g002
Figure 3. (a) Receiver–operating characteristic curves, (b) Precision–recall curves for ML models.
Algorithms 15 00077 g003aAlgorithms 15 00077 g003b
Figure 4. Reliability diagrams of the competing ML models.
Algorithms 15 00077 g004
Table 1. Demographic data of the participants.
C1C0Totalp-Value
Sexn (%)n (%)n (%)0.00
Female143 (11.68)300 (24.51)443 (36)
Male391 (31.95)390 (31.86)781 (64)
Age group 0.00
<18000 (0)
18-29230 (18.80)368 (30.07)598 (49)
30-39212 (17.32)236 (19.28)448 (37)
40-4984 (6.86)78 (6.37)162 (13)
≥508 (0.65)8 (0.65)16 (1)
Mean ± SD175.43 ± 8.56175.37 ± 8.95175.40 ± 8.78
Median (range)176 (150–203)176 (153–198)176 (150–203)
Height 0.00
Mean ± SD175.43 ± 8.56175.37 ± 8.95175.40 ± 8.78
Median (range)176 (150–203)176 (153–198)176 (150–203)
Weight 0.00
Mean ± SD77.26 ± 13.2774.84 ± 13.2375.89 ± 13.24
Median (range)77 (47–120)77 (47–120)77 (47–120)
BMI, kg/m2 0.00
Mean ± SD24.96 ± 2.7124.14 ± 2.6724.5 ± 2.72
Median (range)24.92 (17.93–35.92)24.13 (17.63–35.83)24.54 (17.63–35.92)
Table 2. ML hyperparameters tested in our experimentation.
ML ModelHyperparamaeters
LRC: {0.01, 0.1, 1, 10, 100}, penalty: {‘l1’, ‘l2’}
DTcriterion: {‘gini’, ‘entropy’}, min_samples_leaf: {1, 2, 3, 4, 5}, min_samples_split: {2, 3, 4, 5, 6, 7}
KNNalgorithm: {‘auto’, ‘ball_tree’, ‘kd_tree’, ‘brute’}, leaf_size: {1, 2, 3, 5}, n_neighbors: {3, 4, 5, 7, 9, 12, 14, 15, 16, 17}, weights: {‘uniform’, ‘distance’}
SVMkernel: {‘rbf’, ‘linear’, ‘sigmoid’}, C: {0.001, 0.1, 0.1, 10, 25, 50, 100, 1000}, gamma: {0.01, 0.001, 0.0001, 1 × 10⁻⁵}
Adaboostcriterion: {‘gini’, ‘entropy’}, min_samples_leaf: {1, 2, 3, 4, 5}, min_samples_split: {2, 3, 4, 5, 6, 7}, n_estimators: {10, 15, 20, 25, 27, 30}
RFcriterion: {‘gini’, ‘entropy’}, min_samples_leaf: {1, 2, 3, 4, 5}, min_samples_split: {2, 3, 4, 5, 6, 7}, n_estimators: {10, 15, 20, 25, 27, 30}
Table 3. Statistical analysis of the selected features with respect to the outcome (presence of injury).
#Risk Factor CategoryQuestionnaire Itemst-StatisticsPearson Chi-Squarep-Value
F1DemographicsGender 36.350.00 *
F2CrossFit experienceHow long have you been participating in CrossFit?11.462 0.00 *
F3Days/weeks of trainingOn average, how many days a week do you train in CrossFit?4.121 0.00 *
F4Training durationOn average, what is the duration of your workout (including warm-up)?7.352 0.00 *
F5Prior to CrossFit level of activityWhat was the level of your athletic activity—fitness in the last 1 year before you start CrossFit? 38.430.00 *
F6Medical history/previous injuriesDid you mention to your CrossFit trainer from the beginning (before you started training with him) a detailed medical history (with previous injuries or accompanying health problems you may have had)? 26.840.00 *
* indicates significant difference between C0 and C1 at the confidence level of 95% (p-value < 0.05).
Table 4. Number of samples (and percentages) in the entire population as well as in the two classes considered in our study (C0: healthy participants and C1: injured ones).
#Selected Risk FactorN (%)
AllC0C1
F1Gender
female443 (36)300 (24.5)143 (11.7)
male 781 (64)390 (31.9)391 (31.9)
F2How long have you been participating in CrossFit?
0–6 mo126 (10.3)89 (7.3)37 (3)
6–12 mo143 (11.7)113 (9.2)30 (2.5)
12–24 mo361 (29.5)254 (21)107 (8.5)
≥24 mo594 (48.5)234 (19.1)360 (29.4)
F3On average, how many days a week do you train in CrossFit?
1–2 times/wk 69 (6)45 (4)24 (2)
3–4 times/wk 592 (48)357 (29.1)235 (18.9)
>4 times/wk 563 (46)288 (23.5)275 (22.5)
F4On average, what is the duration of your workout (including warm-up)?
<1 h98 (8)55 (4.5)43 (3.5)
≥1 h1126 (92)635 (51.9)491 (40.1)
F5What was the level of your athletic activity–fitness in the last 1 year before you started CrossFit?
Low216 (17.6)116 (9.4)100 (8.2)
Medium598 (48.9)388 (31.7)210 (17.2)
High410 (33.5)186 (15.2)224 (18.3)
F6Did you mention to your CrossFit trainer from the beginning (before you started training with him) a detailed medical history (with previous injuries or accompanying health problems you may have had)?
yes 1009 (82)603 (49)406 (33)
no215 (18)87 (7.3)128 (10.7)
#. Feature ID.
Table 5. Predictive performance of ML models (10 FCV) with respect to various validation metrics.
ML AlgorithmAccuracyPrecision
(C0/C1)
Sensitivity
(C0/C1)
Specificity
(C0/C1)
AUC [Confidence Interval]
SVM0.72220.7461/0.66670.8391/0.52980.5298/0.83910.7550 [0.7240,0.7845]
LR0.72040.7506/0.65530.8246/0.54890.5489/0.82460.7610 [0.7341,0.7871]
DT0.72490.7826/0.63320.7724/0.64670.6467/0.77240.7590 [0.7295,0.7881]
KNN0.72310.8006/0.61860.7391/0.69680.6968/0.73910.7658 [0.7353,0.7933]
AdaBoost0.74660.7968/0.66430.7956/0.66580.6658/0.79560.7793 [0.7466,0.8064]
RF0.73220.7772/0.65250.7986/0.62290.6229/0.79860.7790 [0.7528,0.8063]
Publisher’s Note: MDPI stays neutral with regard to jurisdictional claims in published maps and institutional affiliations.

