Article

Optimized Dissolved Oxygen Fuzzy Control for Recombinant Escherichia coli Cultivations

by
Rafael Akira Akisue
1,
Matheus Lopes Harth
1,
Antonio Carlos Luperni Horta
1,2 and
Ruy de Sousa Junior
1,2,*
1
Graduate Program in Chemical Engineering, Campus São Carlos, Federal University of São Carlos, Rod. Washington Luís km 235, São Carlos 13565-905, Brazil
2
Department of Chemical Engineering, Campus São Carlos, Federal University of São Carlos, Rod. Washington Luís km 235, São Carlos 13565-905, Brazil
*
Author to whom correspondence should be addressed.
Algorithms 2021, 14(11), 326; https://doi.org/10.3390/a14110326
Submission received: 6 October 2021 / Revised: 31 October 2021 / Accepted: 2 November 2021 / Published: 5 November 2021

Abstract

:
Due to low oxygen solubility and mechanical stirring limitations of a bioreactor, ensuring an adequate oxygen supply during a recombinant Escherichia coli cultivation is a major challenge in process control. Under the light of this fact, a fuzzy dissolved oxygen controller was developed, taking into account a decision tree algorithm presented in the literature, and implemented in the supervision software SUPERSYS_HCDC. The algorithm was coded in MATLAB with its membership function parameters determined using an Adaptive Network-Based Fuzzy Inference System tool. The controller was composed of three independent fuzzy inference systems: Princ1 and Princ2 assessed whether there would be an increment or a reduction in air and oxygen flow rates (respectively), whilst Delta estimated the size of these variations. To test the controller, simulations with a neural network model and E. coli cultivations were conducted. The fuzzification of the decision tree was successful, resulting in smoothing of air and oxygen flow rates and, hence, in an attenuation of dissolved oxygen oscillations. Statistically, the average standard deviation of the fuzzy controller was 2.45 times lower than the decision tree (9.48%). Results point toward an increase in the flow meter lifespan and a possible reduction of the metabolic stress suffered by E. coli during the cultivation.

1. Introduction

Cultivation of Escherichia coli has been extensively studied, focusing on high productivity, oxygen availability, medium composition, acetate production, feeding control strategy, bioreactor type, and operation policy [1,2,3,4]. A major challenge is to ensure an adequate and continuous dissolved oxygen supply in the cultivation medium during the process. It is well documented that oxygen deprivation can cause harmful effects on E. coli growth and biomass productivity due to the accumulation of inhibitory by-products (such as acetate) [5,6,7,8]. In a series of works, O’Beirne and Hamer (1999) studied the correlation between oxygen availability and E. coli cell growth. At first, high oxygen availability can lead to a high biomass yield, with low acetate production. However, at a certain point, oxygen surplus becomes detrimental for the cultivation (decreasing both biomass yield and specific growth rate and increasing acetate production) [9,10,11]. Given the low solubility of oxygen in water and mechanical stirring limitations of the bioreactor (limited agitation speed to avoid shearing and limited oxygen delivered by the gas sparge), the dissolved oxygen control is highly nonlinear and represents a challenging control problem [12,13]. Regarding the current control strategies, the majority struggles with dissolved oxygen concentration (DOC) peaks and non-smooth behavior of air and oxygen flow rates. In this context, efforts were made in order to improve the DOC control in bioreactors.
To overcome difficulties with varying process dynamics, adaptive controllers have been suggested. Lee et al. [14] proposed a one step ahead DOC controller. Process modeling was based on material balance equations, and it was linearized via first order Euler approximation. Its parameters were re-evaluated by a modified recursive least squares method, and, as for the one-step-ahead predictor, the extended Kalman filter was applied in order to reduce noise effects. Manipulated variables were air flow rate and agitation speed. Results showed an improvement in performance and stability compared to the classic PID controller [14]. Aiming to create a control strategy independent from complex modeling equations, Hsiao et al. [15] employed a modified AutoRegressive-Moving-Average model. Its parameters were re-evaluated by a recursive linear regression method. Authors presented an indirect pole placement controller with air flow rate and agitation speed as manipulated variables. Although positive results were obtained for wild E. coli cultivation, the controller had mild problems trying to maintain DOC near 30% during the induction phase [15]. Åkesson and Hagander [16] and Arevalo et al. [17] designed adaptive controllers based on gain-scheduling. Both process models were based on material balance equations. In the first work, five operation points were stablished based on manipulated variable stirrer speed. In the second work, 16 operation points were stablished based on agitation speed and air flow rate. In Reference [16], gain scheduling was combined with a PID controller, whilst, in Reference [17], the technique was combined with a PI controller. Both adaptive controllers were tested in simulations and validated in cultivations. Results, in general, were satisfactory, although the first controller had tunning issues, and the second presented difficulties with moderate disturbances. Chitra et al. [18] designed a Model Reference Adaptive Control scheme, based on MIT rule [19], applied to DOC control. In this strategy, the controller parameters were adjusted so that the output of the process tracked the output reference model (with the same reference input). For the simulations, the process model was designed based on experimental data. As in Reference [16], the single manipulated variable was stirrer speed. Simulations showed satisfactory results comparing with a PI controller.
As an alternative to the traditional control perspective, the Knowledge-Based (KB) methodologies were introduced in order to deal with uncertainties and nonlinearities of complex biological systems [20]. Horta et al. [21,22,23] designed a hybrid system aiming to control DOC in a bioreactor. The DOC controller was a single module in a complete automation system for monitoring and controlling cultivations called SUPERSYS_HCDC. The hybrid system was developed by combining a digital PID controller (manipulating agitation speed) and a pseudocode based on a decision tree (manipulating air and oxygen flow rates). Results showed that, on average, it was possible to keep DOC levels near its setpoint value [21,22,23]. However, further analysis showed that the decision tree did no provide smooth responses for the manipulated variables, thus revealing the need for improvements. Fuzzy control is one of the best-known KB methodologies, and it is formed by the combination of fuzzy sets theory and fuzzy logic, applied to control problems [24,25]. Martin and Couch [12] designed a DOC controller based on fuzzy logic. The input variables were “Error” and “Change in error” of dissolved oxygen concentration (with “error” been defined as the difference between the current dissolved oxygen concentration value and its setpoint value). Output variables were air flow and agitation speed variations. To test the fuzzy controller and tune its parameters, simulations were conducted (based on previous cultivation data collected under specific conditions in order to represent the desired controller behavior). Results showed that DOC was kept near its setpoint value of 30% [12]. In a previous work, Akisue et al. [26] started applying fuzzy reasoning, aiming to improve the dissolved oxygen control module from Horta et al. [21,22,23]. For the development of the fuzzy controller, the pseudocode of the decision tree was fuzzified using E. coli cultivation data and via MATLAB software. Parameters were determined via Adaptive Neuro-Fuzzy Inference System (ANFIS) tool. To test the controller, a simulator was designed by coupling the fuzzy controller with a neural network model of the process. Simulation results showed that the fuzzy controller provided smoother air and oxygen flow rates compared with the decision tree. It also kept DOC near its optimum value of 30% [26]. This sketch is one on the few recent applications to employ fuzzy reasoning in DOC control [27].
Under the light of these facts, this work aims to develop, implement and validate an optimized fuzzy DOC controller, based on the sketch presented by Akisue et al. [26]. It is important to emphasize that the cited sketch was focused only on evaluating (through computational simulations) the potential of the fuzzy controller. Present work, in turn, is much more robust, bringing new (unpublished) simulation results and experimental validation. Nevertheless, the sketch in Akisue et al. [26] paved the way for the final version of the DOC fuzzy controller presented here. During the development process, the extensive simulations were essential to upgrade the subroutines (via improved selection of the input variables for the fuzzy system and refinement of their granulation). The modifications were necessary to raise the controller to an implementation level and bring the experimental validation results to this publication. For the new simulations, we adjusted the controller parameters and tested it with neural network models. To validate the controller, we implemented it in the SUPERSYS_HCDC software (adapting the MATLAB coded controller to a LabVIEW graphic language) and conducted E. coli cultivations. Batch cultivations were performed in a 5 L bioreactor with a chemically-defined medium. Dissolved oxygen concentration was monitored by the fuzzy controller (manipulating air and oxygen flow rates). Analytical methods for samples included optical density, dry cell weight, and High-Performance Liquid Chromatography.

2. Theory and Software

2.1. Fuzzy Theory

Fuzzy theory was formulated by professor Lotfi A. Zadeh and introduced in “Fuzzy Sets” [24]. Fuzzy logic [28,29] aimed the formalization of an approximate reasoning, and it is characterized for employing concepts, such as linguistic variables and fuzzy if-then rules. One of the most important aspects of the concept of linguistic variable is to consider them as a form of compression (called granulation), in which the granules are an overlapping of fuzzy sets [25,30]. Fuzzy if-then rules translate expert knowledge into a set of linguistic rules. This set characterizes the fuzzy controller behavior. Hence, it can be implied that fuzzy control is based on words rather than complex equations. The idea of fuzzy control is to model control actions based on expert knowledge. That is, the fuzzy controller provides an algorithm that converts qualitative control strategies (based on h of observation of the process) to an automatic control strategy [24,31,32].
Fuzzy logic found strong supporters in Japan. The Sendai Subway 1999 series is still one of the most important applications of fuzzy logic. It successfully increased smoothness during starts and stops (increasing passenger’s comfort) and was 10% more energy efficient when compared to human control actions [33,34]. Horiuchi [35,36], Kishimoto [36], Honda and Kobayashi [37], and Shioya et al. [38] reviewed applications of fuzzy control in bioprocesses, such as Ajinomoto’s fuzzy automatic substrate feeder [36,39], Sankyo’s fuzzy pH controller [36,37], Nippon Roche’s fuzzy culture phase identifier, and a fuzzy temperature control for sake brewing [36,37,38]. Outside Japan, Sousa and Almeida [40] applied fuzzy logic in order to determine the optimal moment to start substrate feeding in a Cephalosporium acremonium cultivation. With three reasoning levels (Attention, Action, and Protection), the fuzzy controller enabled safe automatic feeding operation [40]. Based on Sousa and Almeida [40], Nucci et al. [41] developed a fuzzy controller in order to determine harvesting threshold in a Bacillus megaterium cultivation for Penicillin G acylase production. Experimental results showed that the CO2 peak was precisely identified by the fuzzy controller [41]. Borges et al. [42] created an automatic solids feeder controlled by fuzzy logic. Based on mass deviation as input, the motor speed was determined by the fuzzy controller. Results showed that the controller outperformed the classic on-off controller in all validation tests with smoother feeding profiles [42].
Fuzzy-related research studies have been steadily increasing in the last decade [43,44,45,46]. Its application has been effective to overcome the intrinsic non-linearities of biological systems [47]. However, just a fraction of the current papers was dedicated to improve dissolved oxygen control, a closer view shows that these works are mainly focused on improving waste water treatment plants [43,44,45,46].

2.2. SUPERSYS_HCDC

Precise feeding control rate, undesired metabolic by-products production, temperature and pH alterations, variations in DOC, and foam formation can stir a cultivation either to success or failure [1,2,3,4]. Thus, a highly experienced and skilled bioreactor operator is required during the cultivation. However, cultures can take longer than 30 h, uninterruptedly. Therefore, an affordable supervision tool, based on artificial intelligence, could assist and even replace (in several moments) human supervision. Based on these premises, SUPERSYS_HCDC was conceived in the Laboratory for Development and Automation of Bioprocesses, from Federal University of São Carlos (Brazil), as one of first complete affordable automation system for monitoring and controlling cultivations, including high-cell density cultivations [21,22,23,47]. Under its supervision, several microorganism cultivations were conducted, such as: Saccharomyces cerevisiae, Pichia pastoris, Bacillus megaterium, and Escherichia coli. The program was coded in MATLAB (6.5) and implemented in the LabVIEW (8.0) platform, where the controllers were segmented in control modules, such as: pH and temperature control, alarms, automatic supplementary feeding, and especially, the dissolved oxygen control module [47].
The hybrid system was developed by combining a digital PID controller in velocity form (manipulating the agitation speed) and a decision tree (manipulating air and oxygen flow rates).
The PID strategy for agitation speed is described by Equation (1):
g i t S p t = A g i t S p t 1 + k c { S e t P D O C t S e t P D O C t 1 + t T i S e t P D O C t + T d t S e t P D O C t 2 S e t P D O C t 1 + S e t P D O C t 2 } ,
where AgitSp is the agitation speed (rpm), Kc (rpm/%), Ti (s.%/rpm), and Td (rpm. s/%) are the proportional, integral, and derivative constants (respectively), SetP (%) is the dissolved oxygen concentration setpoint value, DOC (%) is the dissolved oxygen concentration, t is the iteration, and ∆t (s) is elapsed time between iterations.
The pseudocode for air and oxygen flow rates control was based on the decision tree presented in Figure 1, which is interpreted as follows. If DOC is lower than its setpoint value, the decision tree starts by evaluating the agitation speed (AgitSp). If it is low (lower than 70% of its superior limit-AgitSpSL = 950 rpm), and oxygen is already been injected in the system ( Q O 2 ), air flow rate (QAir) should be increased by Delta (∆Q), and oxygen enrichment should be decreased by the same amount. However, if the agitation speed is higher than or equal to 99% of its superior limit and DOC < DOCIL (dissolved oxygen inferior limit), then, two options are presented in the decision tree. It is observed if the sums of air and oxygen flow rates have already surpassed the maximum gas flow rate (Qmax), then, airflow rate is decreased, and oxygen enrichment is increased. However, then, airflow rate should be increased, and oxygen enrichment should remain constant [21,22,23,47].

2.3. Fuzzy Logic Toolbox

The development of the fuzzy controller (which encompasses the establishment of linguistic variables, membership functions—with their adjusted parameters, and the fuzzy rules) was achieved via Fuzzy Inference System (FIS) and Adaptive Neuro-Fuzzy Inference System (ANFIS) tools, both from MATLAB’s Fuzzy Logic toolbox. It provides users with predefined functions and applications in MATLAB language to analyze, design, and simulate fuzzy logic-based systems [48].
The FIS application allows users to create, edit, and visualize fuzzy inference systems based on graphic tools. First, the number of linguistic inputs and outputs, each nomenclature, classification (Mamdani or Takagi-Sugeno), and the aggregation/defuzzification methods are stablished in Fuzzy Logic Designer. Under the Membership Function Editor, users can edit and visualize input and output membership functions (and their parameters). It is also possible to determine the membership functions ranges and their type (trapezoidal, triangular, gaussian, and others). Finally, the Rule Editor focuses on the fuzzy rules that define the behavior of the system. Users can establish the rules (based on completeness and consistency principles) and attribute weights to each rule. Under the visualization tab, both Rule Viewer and Surface Viewer are considered diagnostic tools. In the first, users can evaluate the active rules and how a specific membership function impacts the final result. The second one, in its turn, evaluates the output dependency in relation to two inputs, described by a response surface [48].
In FIS, the parameter values and membership functions shape are defined by users. However, when it is not possible to define them by expert’s knowledge, ANFIS is a practical tool. Created by Jang [49], it adjusts fuzzy parameters by mapping inputs and outputs based on process data and a feedforward neural network with a hybrid learning technique, that is, the parameter adjustments allow the system to learn from the data. In the first pass (forward pass), the consequent parameters are calculated by the least square method, whilst, in the second pass (backward pass), the error is back propagated, and the premises parameters are updated based on the gradient descent method, as shown in Equation (2) [49].
α = η   E α   .
α is a generic parameter to be optimized, η is the learning rate, and E is the measured error.
To create a neuro fuzzy inference system, MATLAB provides the Neuro Fuzzy Designer application. First, input and output data of the process to be modeled are pre-processed (with each line been a pair of input-output data) and loaded in the application. Then, the basic fuzzy inference structure is determined by the user (number of linguistic variables and membership function parameters) and further processed via grid partition method. The FIS training is based on backpropagation or a hybrid learning. Finally, it is possible to test the FIS with a separate dataset [48].

2.4. Artificial Neural Networks

Artificial Neural networks are inspired by biological nervous systems and are composed by single or multiple layers of neurons. A layer includes a combination of weights—in the form of a matrix—that multiplies the input strength. The summation (net input function) of the weighted inputs with the bias form the argument for the transfer function (typically a sigmoid or a linear function) [50,51]. The main idea of a neural network is that these parameters (weights and biases) can be adjusted (or trained), in the sense that a particular input can lead to a specific target output. Neural networks can be classified into static and dynamic networks. The first (also called feedforward) has no feedback elements and contains no delays. The second group (also called recurrent), in turn, depends not only on the current input of the network but also on previous inputs and outputs. Dynamic networks are generally more powerful than static ones (due to the presence of memory, they can also be trained to learn sequential or time varying patterns) [50,51].
Before training, the first step is a division of the loaded dataset into three subsets. The first is the training set, which is used for updating the network parameters (weights and biases). The second subset is the validation set, which is used to measure the network generalization power and halt the training process when the generalization stops being improved (when the error associated with the validation set begins to rise). The third subset is the test set. The neural network architecture choice plays an important role as too few neurons can lead to underfitting. Too many neurons, on the other hand, can increase the power of the network but can also lead to overfitting. During training, the weights and biases are iteratively adjusted to minimize the network performance function (F), by default, the mean squared error (mse), presented in Equation (3) [50,51].
F = m s e = 1 N i = 1 N e i 2 = 1 N i = 1 N t i a i 2 ,
where mse is the mean squared error between the network outputs “a” and the target outputs “t”.
Any standard numerical optimization algorithm can be used to optimize the performance function. Every time the neural network is trained, a different solution is expected due to the different parameter initialization and the different data subset allocation (for training, validation, and test). To analyze the training results, a regression plot can be created. It shows the relationship between the outputs of the network and the targets [50,51].

3. Material and Methods

3.1. Escherichia Coli Cultivation Data for Simulations

E. coli cultivation data for fuzzy controller development was kindly donated by professor Horta [21]. Fed batch cultivations of E. coli BL21(DE3) harboring the plasmid pET37b(+) (expressing a fragment of pneumococcal surface protein A) were performed in a 5L bioreactor (Laboratory for Development and Automation of Bioprocesses-UFSCar-São Carlos, Brazil), supervised by SUPERSYS_HCDC software [21,22,47,52]. Culture pH was kept at 6.7 during batch phase and 6.9 during fed-batch phase. Temperature was kept at 35 °C. Dissolved oxygen concentration was maintained at 30% of saturation by a hybrid system (PID and a decision tree algorithm). Conductivity and permittivity were monitored by a biomass sensor. For further details, please refer to References [23,52]. In total, 16 cultivations of E. coli were conducted (labeled A1 up to A16). However, due to the partially available data in some of them, just a few were eligible to be used for the fuzzy controller training. Among them, the two with highest attained maximum cell concentration were selected. A16 dataset (155 gdry weight/L) was used to fuzzify the decision tree, whereas A12 dataset (123 gdry weight/L) [23,52] was employed for robustness test.

3.2. Fuzzy Controller

The fuzzy control system was developed using Fuzzy Logic Toolbox (MATLAB) and its tools: FIS and ANFIS. Based on the decision tree algorithm (Figure 1) [22,47], a strategy for the fuzzy controller was defined. The fuzzy DOC control was divided in three independent Sugeno-type inference systems [53]. The first, Delta, not only determines the size variations in air and oxygen flow rates (delta, in L/min) but also guides the controller through three possible scenarios. The closer the measured DOC value is to its setpoint, the lower delta value will be. On the other hand, if the measured DOC value is below the setpoint value, Delta will infer a delta value used by the next two inference systems (Princ1 and Princ2) in order to determine whether there will be an increment or a reduction of delta (in size) in air (Princ1) or oxygen (Princ2) flow rates. The last scenario is safety mechanism. For DOC values above the setpoint, either one or both flow rates will be decreased (by delta).
The first inference system, Delta, was evaluated based on two input variables: current dissolved oxygen concentration and agitation speed. The three linguistic values for each input were defined based on cultivation data observation and expert’s knowledge. The output of Delta fuzzy system was the size variations in air and oxygen flow rates (delta).
Both Princ1 and Princ2 inference systems are described by the same set of input variables, and their output (QairVar and QO2Var, respectively) do not define air or oxygen flow rates directly. Instead, these values must be compared with certain limits, mimicking the decision tree. For instance, if QairVar is equal to or higher than a limit (heuristically determined), the controller issues an increase of delta in air flow rate. If not, the controller is set to decrease air flow rate by the same value. Similar reasoning applies to QO2Var range values (but with the additional possibility of maintaining the same O2 flow rate, besides the possibilities of increasing or decreasing it). This comparison approach is highly efficient, since QairVar and QO2Var are sensitive to mild disturbances. By stablishing actuation ranges (and limited delta steps), we hoped to avoid severe oscillations. For Princ1 and Princ2, AgitSp, DOC, and QairIF (an auxiliary variable responsible for indicating the threshold for exchanging aeration for oxygen enrichment) were considered as the main input variables. The linguistic values for each one of them were chosen based on the decision tree strategy. Besides, comparing the proposed strategy with the decision tree, microorganism concentration (CX) and specific growth rate (Mi) were also considered as inputs for the fuzzy controller. This seemingly increased the complexity of the system. However, it granted a new depth to the fuzzy controller regarding the culture phase and its specificities. For both inputs, two linguistic values were attributed.
For Delta inference system training an experimental data matrix was loaded into the ANFIS tool. The inputs were defined based on three linguistic values each with Gaussian type-1 shape membership functions Equation (4):
x , σ , c = e x c 2 2 σ 2 ,
where σ is the standard deviation (that controls the width of the bell shape), and c is the mean (that defines the peak center position).
The output functions were linear equations as shown by generalized Equation (5).
F i = a   A g i t S p i + b   D O C i + c ,
where a and b are the coefficients for variables AgitSp and DOC (respectively), whereas c is the linear coefficient.
Optimization method chosen was a hybrid one (backpropagation and least squares) with at least 25 training epochs. The root mean squared error (rmse) of the training was 0.035, which express an almost perfect match between observed and predicted values.
By applying completeness and consistency principles, ANFIS created nine “If-Then” fuzzy rules, as shown in Table 1.
Here, LP, MP, HP, and VHP are the linguistic values Low and Positive, Medium and Positive, High and Positive, and Very High and Positive (respectively).
Fi is represented by the generalized linear Equation (5), with parameters a, b, and c for F1 up till F9, presented in Table 2:
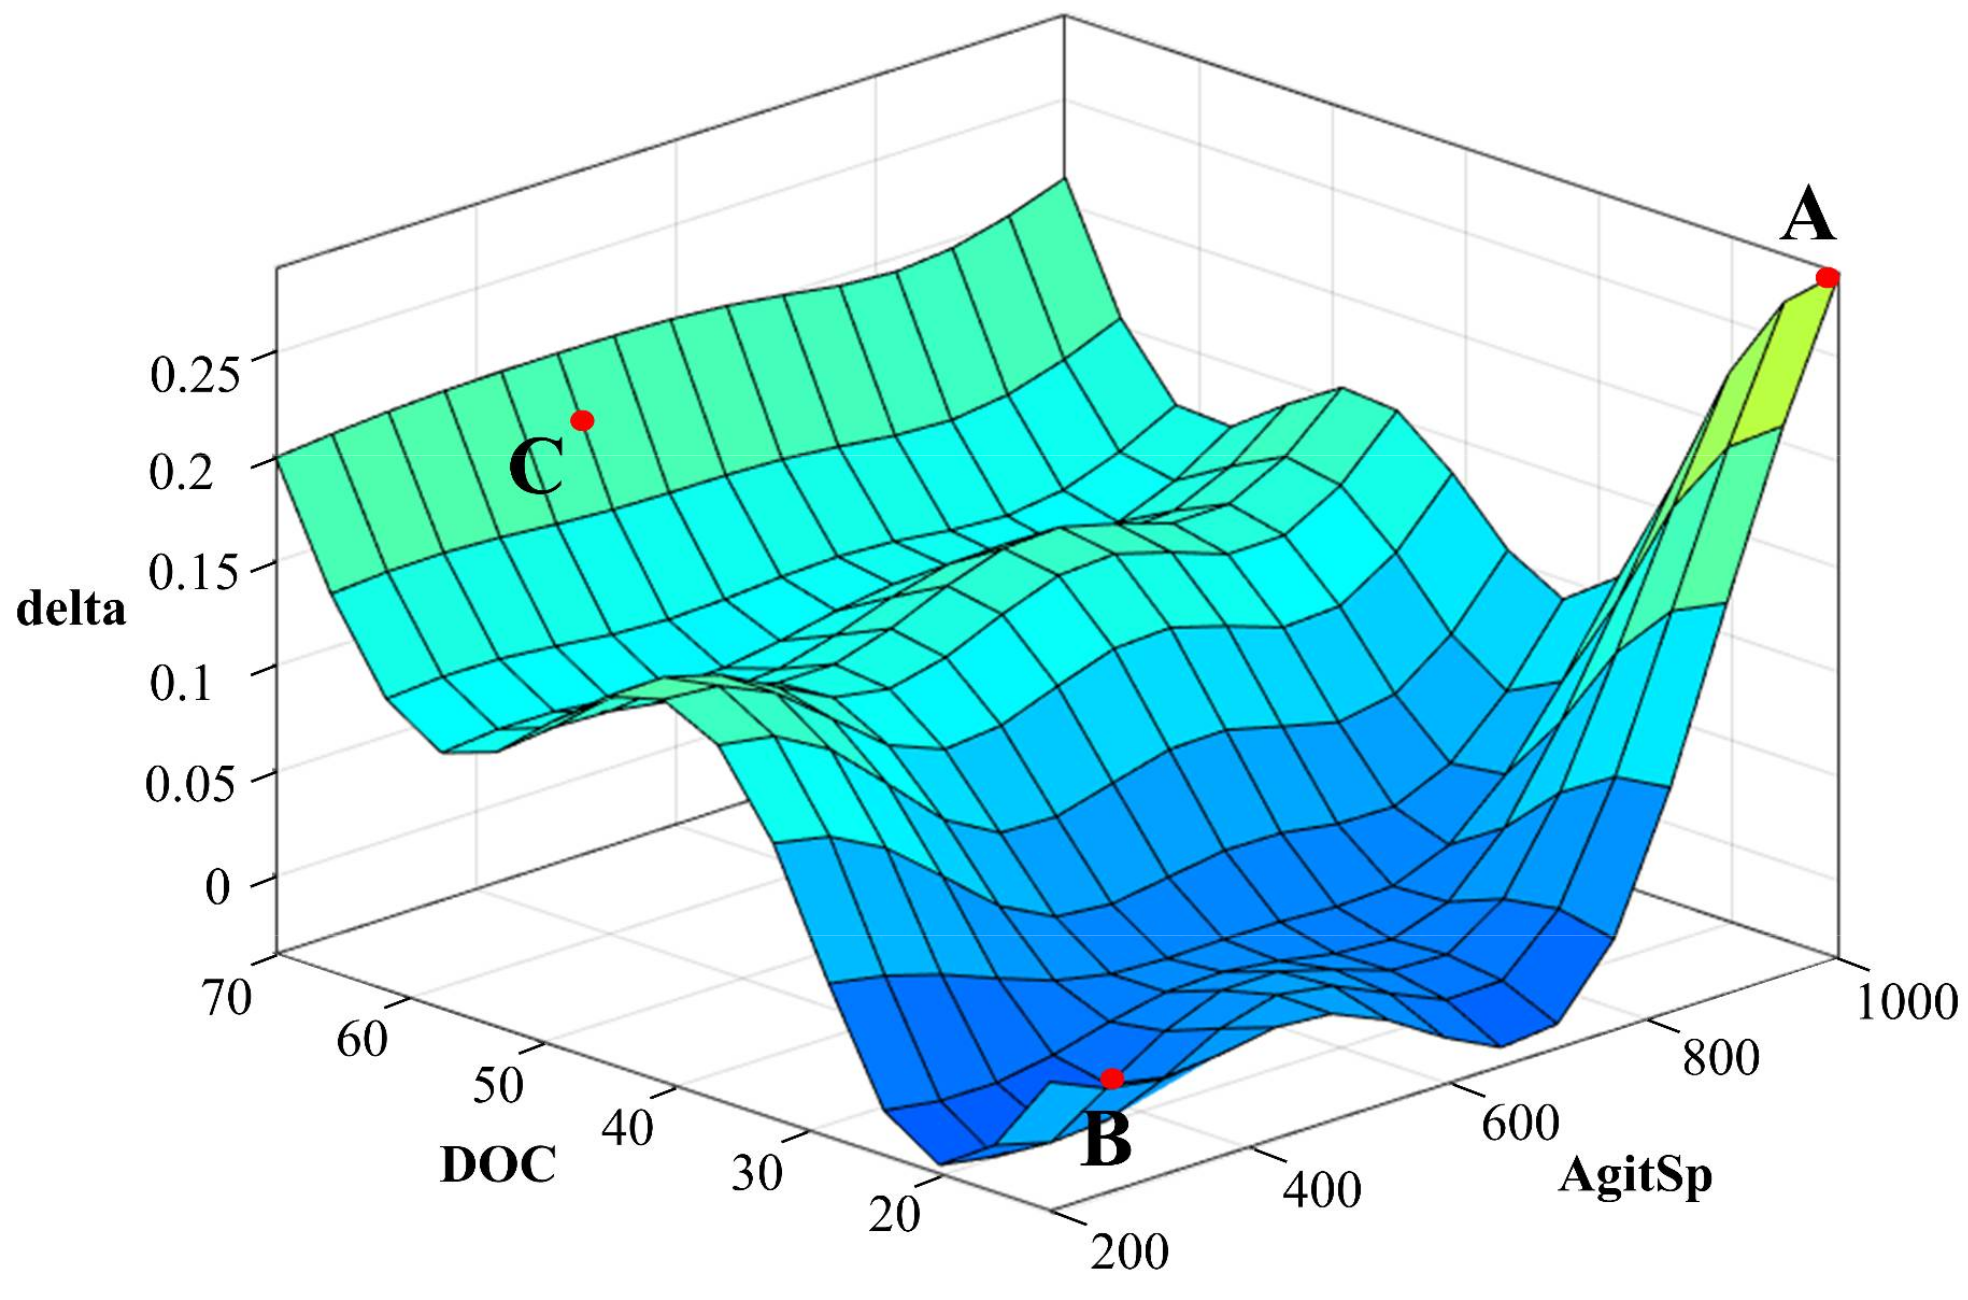
Figure 2 illustrates the surface response of Delta fuzzy system in relation to the input variables AgitSp and DO.
Analyzing the behavior of delta, its peak (point A) is reached when the DOC is on its lowest value, with maximum agitation speed. In this case, air flow rate should be increased (by a value around 0.28 L/min). The region around point B is characterized by a low dissolved oxygen concentration under low agitation speed. The strategy determines that the correction is conducted by an increase in the agitation speed (via PID controller), instead of gas flow variation (therefore, delta is 0). Point C is located in the safety mechanism region. Once the dissolved oxygen supersaturation is detected, Delta inference system infers a positive output (delta, in size), in order to decrease gas flow rates.
To train Princ1 and Princ2 fuzzy systems, the matrices were built with experimental data of agitation speed, DOC, microorganism concentration, specific grow rate (acquired from A16 dataset), and QairIF values (estimated based on the comparison between the maximum gas flow rate and the actual gas flow rate). QairIF values close to 0.10 indicate gas unsaturation (therefore, a possibility of increasing air flow rate). On the other hand, QairIF values close to 0.9 indicate gas saturation (therefore, a necessity of replacing air by pure oxygen enrichment). The targets (QairVar or QO2Var) were estimated based on input analysis and air and oxygen flow rates variations.
After loading the matrices into the ANFIS tool, the number of linguistic values was selected (based on expert knowledge) with Gaussian type-1 membership functions Equation (4). The output membership functions were also linear equations, as shown by generalized Equation (6).
F i = a   A g i t S p i + b   D O C i + c   Q a i r I F   i + d   C X i + e   M i i + f ,
where a, b, c, d, and e are the coefficients for variables AgitSp, DOC, QairIF, CX, and Mi (respectively), and f is the linear coefficient [26].
Optimization method chosen was a hybrid one with at least 25 training epochs. The root mean squared error (rmse) of the training was 0.10 for Princ1 and 0.12 for Princ2, which express an almost perfect match between observed and predicted values.
By applying completeness and consistency principles, ANFIS created 72 “If-Then” fuzzy rules for each inference system; for example:
If AgitSp is LP, and DOC is LP, and QairIF is NO, and CX is LP, and Mi is LP, then Output is F1′.
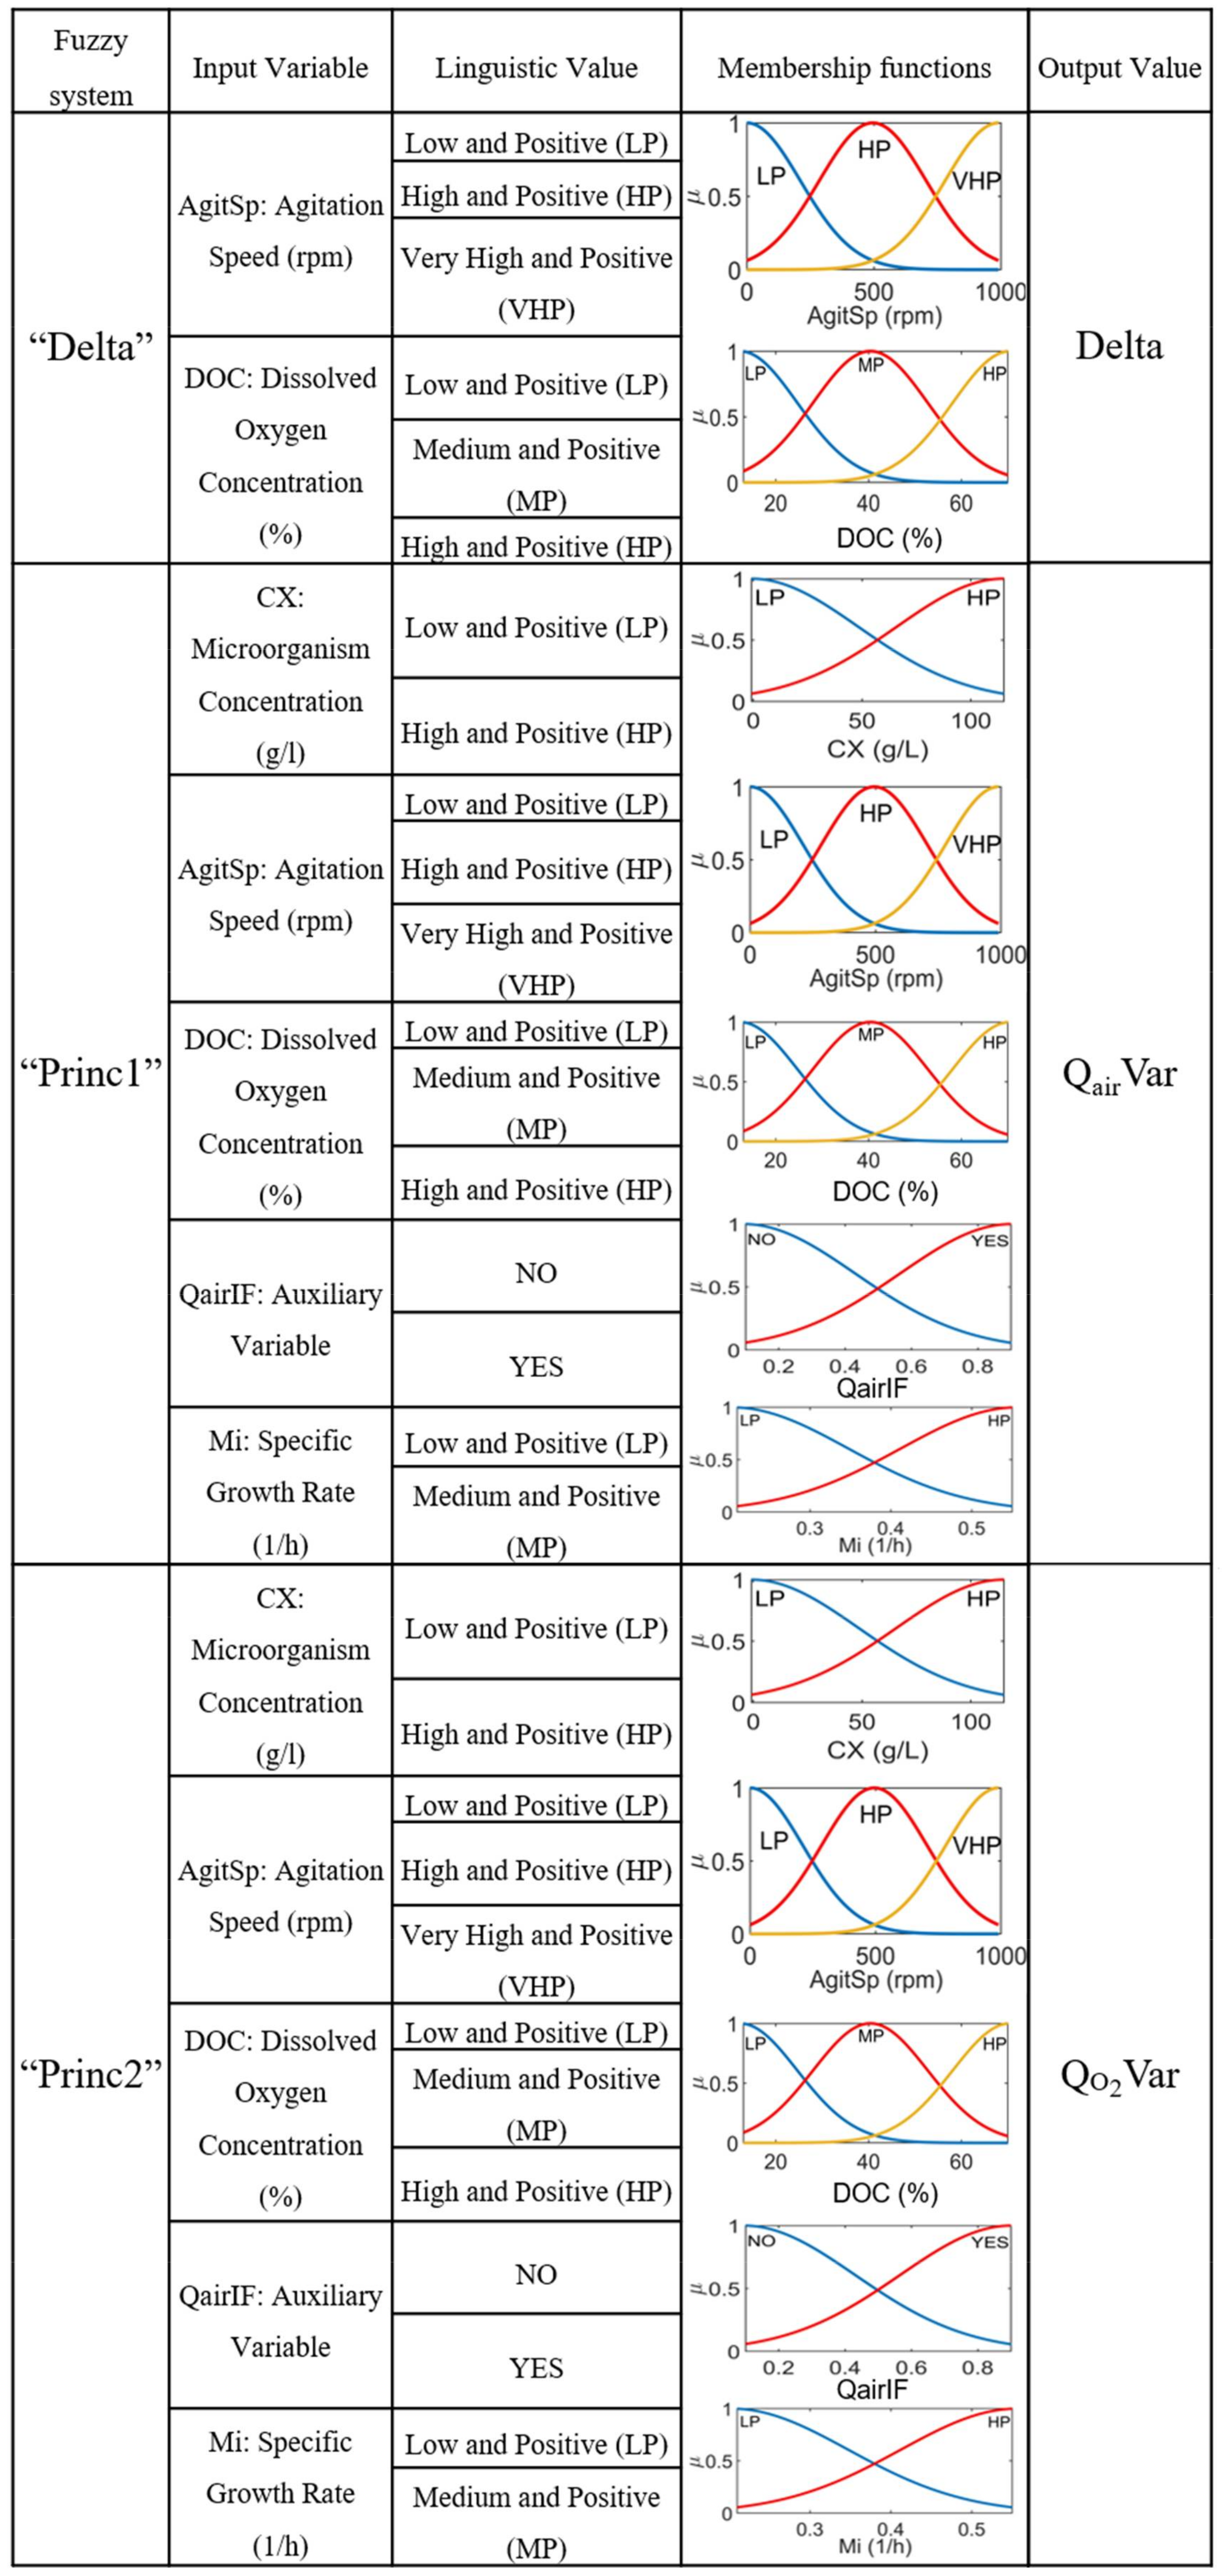
Figure 3 summarizes Delta, Princ1, and Princ2 fuzzy inference systems (with their respective input linguistic variables, linguistic values, and membership function parameters) set by ANFIS tool.

3.3. Simulator

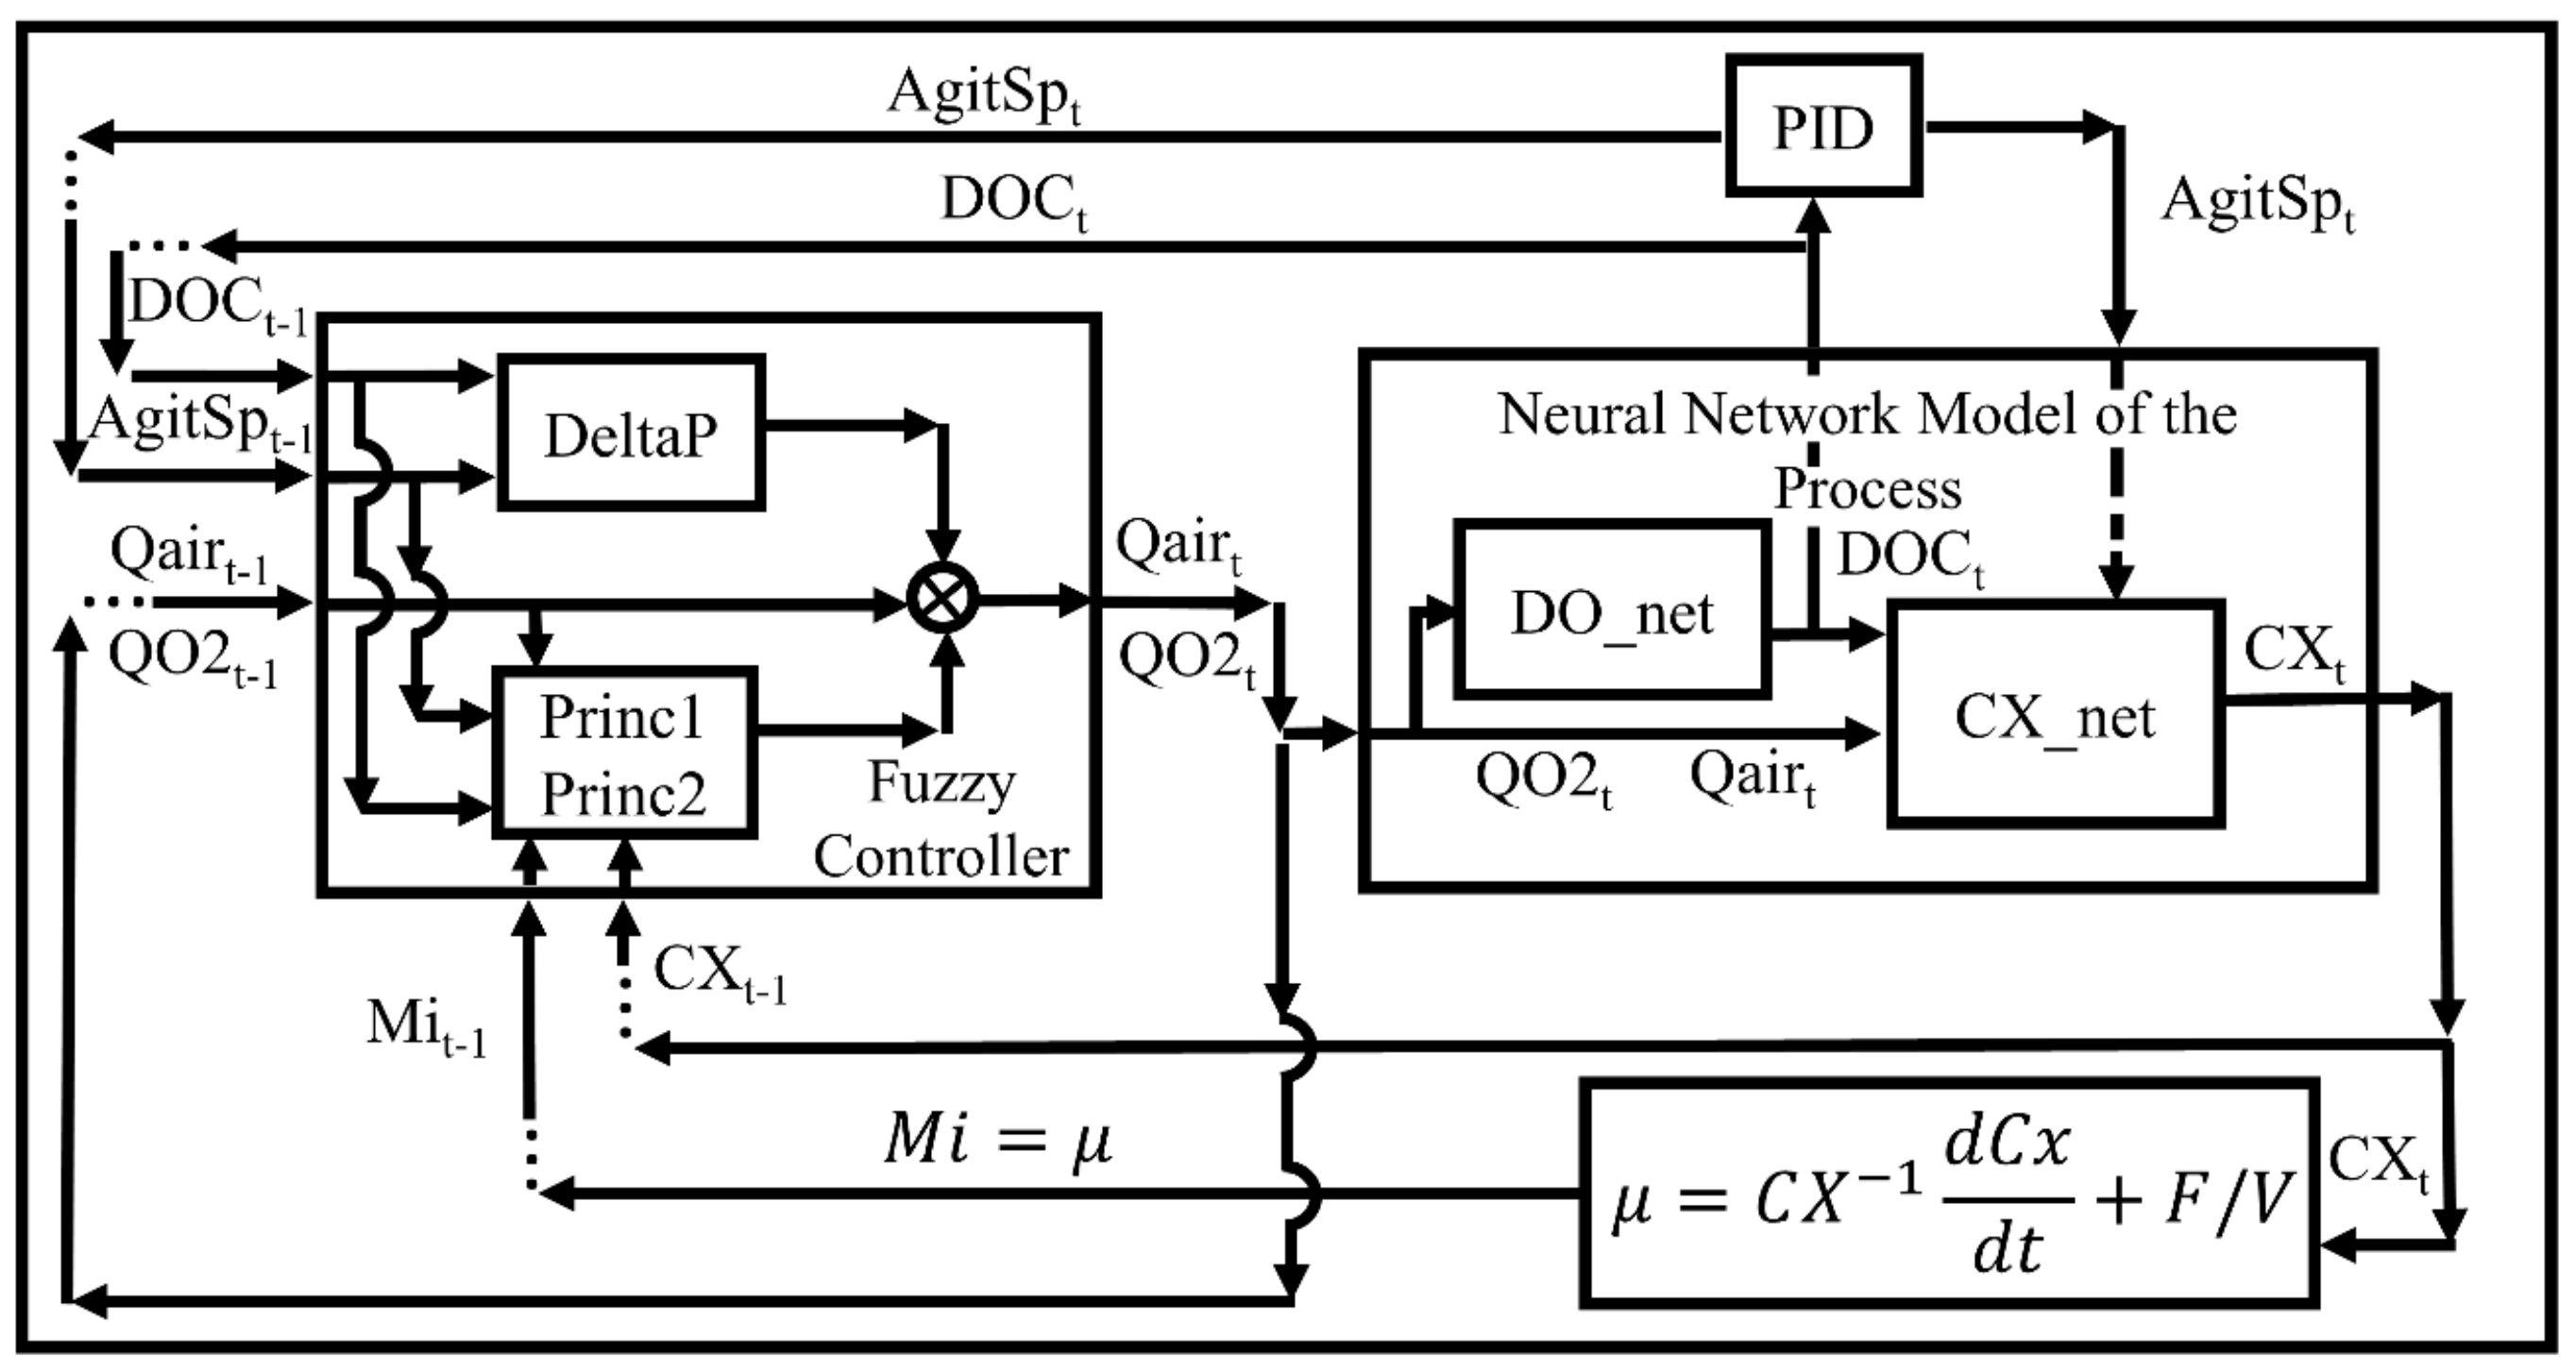
Although the fuzzy controller parameters were adjusted by ANFIS tool, QairVar and QO2Var still missed a fine tuning. In order to test and fine tune the fuzzy controller, a simulator was coded in MATLAB. Figure 4 illustrates the concept of the simulator. From previous values of microorganism concentration (CX), dissolved oxygen concentration (DOC), agitation speed (AgitSp), air and oxygen flow rates (Qair, QO2), and specific growth rate (Mi), the fuzzy controller provided updated air and oxygen flow rates. These values were passed on to the first neural network (DO_net) in order to estimate the dissolved oxygen concentration. With the updated DOC, the PID controller determined the agitation speed. The newly corrected values of gas flow rates, dissolved oxygen concentration, and agitation speed were used by the second neural network (CX_net) in order to estimate the microorganism concentration. By applying material balance for cells in a fed-batch operation, it was possible to estimate the specific growth rate. At last, the updated values were fed back into the fuzzy controller to start the next time-step.
Both neural networks were created using the Neural Network Time Series application (MATLAB). Due to presence of memory, dynamic neural networks (nonlinear problem with single input and single output vectors) were chosen. To model CX_net, two matrices were loaded into the application: an input matrix with air and oxygen flow rates, agitation speed, and DOC and an output matrix with target microorganism concentration. The application randomly divided the dataset based on the default percentages of 70, 15, and 15% (training, validation, and test) for each training phase. With multiple inputs and a smooth target output, the correlation coefficient was 1 in every training phase. Contrarily, DO_net training had opposite characteristics: with few input variables (air and oxygen flow rates) and an oscillatory behaviour of the target output, the datasets had to be reduced to about 6% of its original size. By balancing smaller correlation coefficients (about 0.65), it was possible to obtain a more generic network (avoiding overfitting). This strategy was applied to both A16 and A12 datasets, and the training results are illustrated in Table 3.
During training, a heuristic search was conducted in order to determine the best architectures for the networks. For CX_net, the architecture chosen was one hidden layer of 4 sigmoid neurons with 4 delays, followed by an output layer of a single linear neuron. On the other hand, for DO_net, the architecture chosen was one hidden layer of 15 sigmoid neurons with 4 delays, followed by an output layer of a single linear neuron. The larger number of neurons in DO_net reflects its complexity compared to CX_net.

3.4. Fuzzy Controller Implementation in SUPERSYS_HCDC Program and E. coli Cultivation Test

3.4.1. Implementation of Fuzzy Controller

As SUPERSYS_HCDC software was developed in the LabVIEW platform, the fuzzy controller-written in MATLAB code was translated to a visual programming language. In order to facilitate the transition, the fuzzy controller code was rewritten in a MATLAB script node. In addition, virtual instruments (VI’s) were employed to adapt the fuzzy controller to the limitations imposed by the culture and by mechanical instruments. An elapsed time VI (working as a timer) was programmed in order to activate the fuzzy controller every 40 s. This delay period was necessary to implement the control action (change in the gas flow rates) and wait for the process response (change in DO). The second adaptation were gas flow rate limits. As a mechanical instrument, the flowmeter is limited by its precision (±0.1 L/min) and by upper/lower boundaries. Therefore, minimum and maximum restrictions are required. The last adaptation was based on adjustable QairVar and QO2Var range values, which were adapted to VI’s and converted to input variables. Therefore, users could insert, manually, their values in SUPERSYS_HCDC front panel (as opposed to the fixed values during the simulations). Although the new DOC fuzzy controller was successfully implemented in LabVIEW, the decision tree was kept as backup system.

3.4.2. Bioreactor Experimental Set-Up

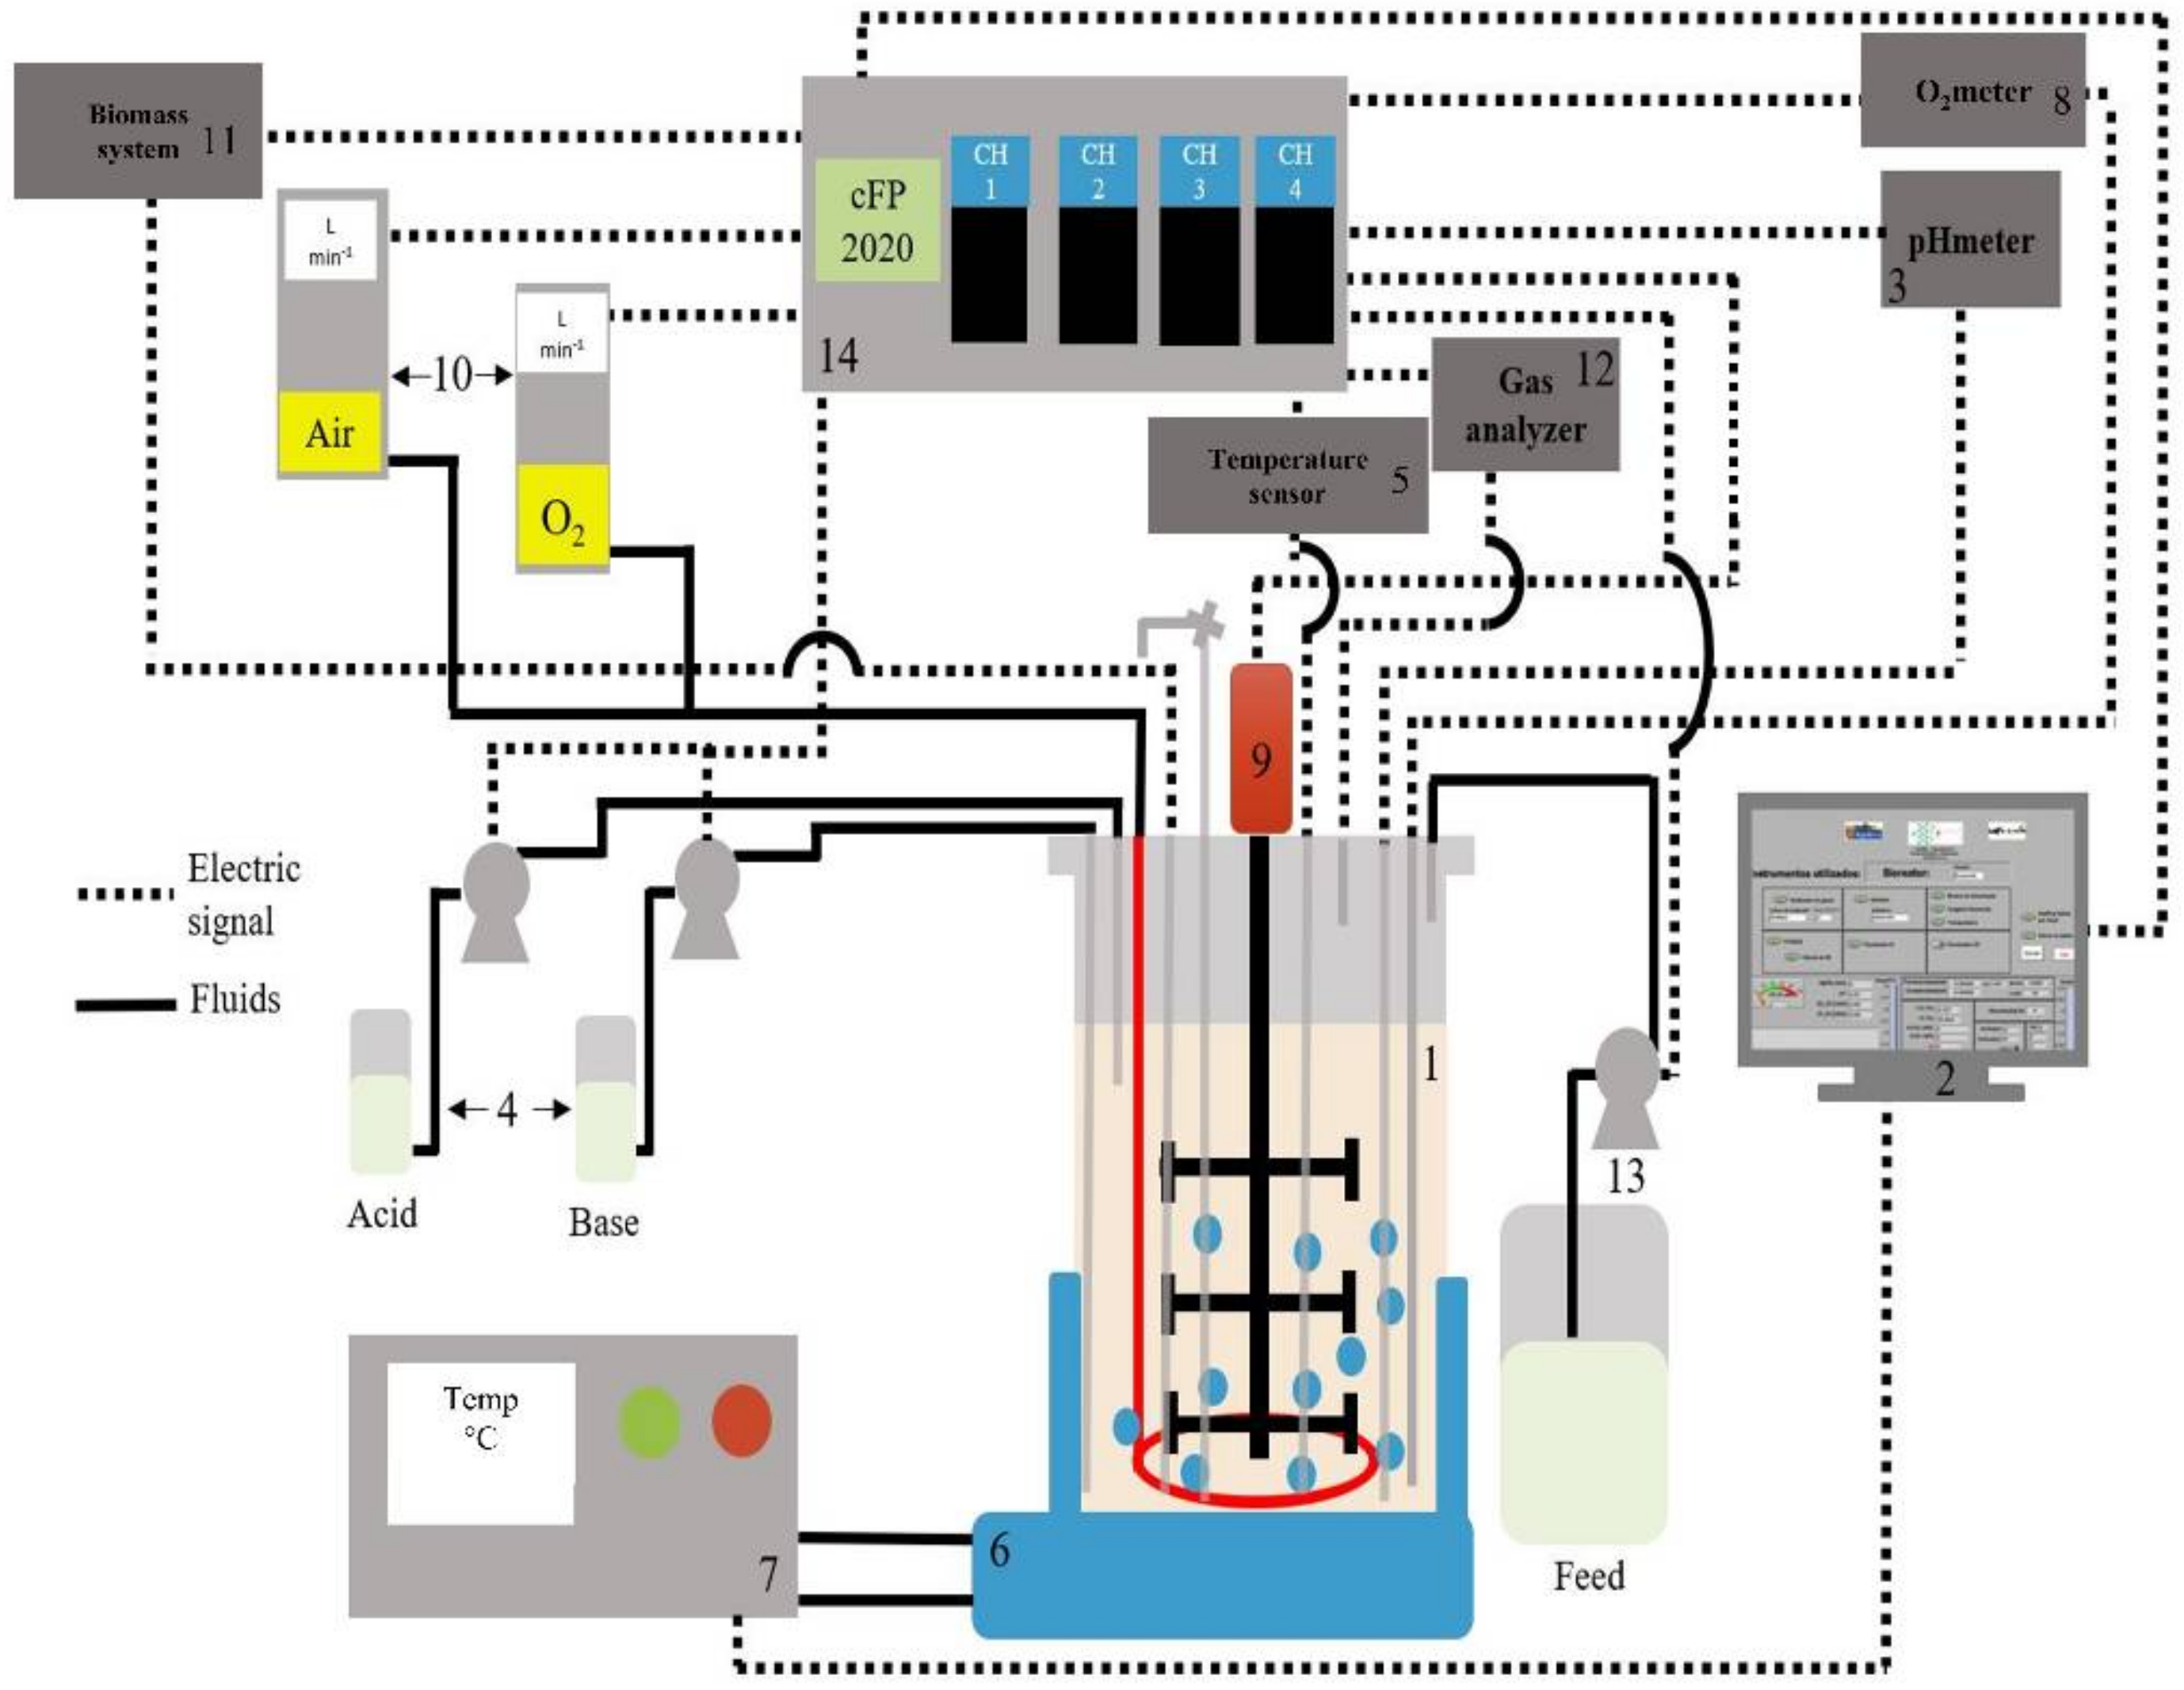
The experimental set-up for the cultivations is shown in Figure 5. Cultivations were conducted in a 5 L stirred tank bioreactor (1), developed in house and supervised by SUPERSYS_HCDC program (2). pH was controlled by adding NH4OH (30%) or H3PO4 (3) (pHmeter GLI PRO—Milwaukee, WI, USA) (4). Temperature was measured by a thermistor (PT100 Camtec mit Exacta) (5) and controlled by a cooling jacket (6) coupled with a thermostatic bath (7). DOC was monitored by a dissolved oxygen sensor (8) (Mettler Inpro 6800—Columbus, OH, USA) and controlled by a hybrid system composed by a PID controller and a fuzzy controller. The PID controller set agitation speed between 200 and 950 rpm (9). Gas flow rate was controlled by two flowmeters (10) (GFC AALBORG—Orangeburg, NY, USA). Conductivity and permittivity were monitored by a biomass sensor (HAMILTON—Reno, NV, USA) (11). The exhaustion gas composition was measured by a gas analyzer (12) (902P Quantek instruments—Grafton, MA, USA). Medium feed was introduced in the bioreactor using a peristaltic pump (13) (MASTERFLEX—Radnor, PA, USA). Monitoring and control of all instruments were made via compact field point (14) (cFP-2020 National Instruments—Austin, TX, USA) [21,23,47,52].

3.4.3. E. coli Strain and Culture Media

Recombinant fragment of Pneumococcal surface protein (PspA) gene from clade 4 (PspA4PRO) was cloned into pET37b+ vector and inserted into Escherichia coli BL21(DE3) [54]. The clone was kindly provided by Dr. Eliane Miyagi from Butantan Institute (São Paulo, Brazil).
Batch cultivations were carried out in a chemically defined medium (HDF-High Density Fermentation medium) for microorganism cultivations adapted from [52,55,56]. The mineral salts (NH4)2HPO4 (5.30 g/L), KH2PO4 (17.73 g/L), citric acid (2.27 g/L), and trace elements from stock solutions of CoCl2.6H2O (3.33 mg/L), CuCl2·2H2O (2.00 mg/L), MnCl2·4H2O (20 mg/L), H3BO3 (4.00 mg/L), Na2MoO4·2H2O (2.80 mg/L), Zn(CH3COOH)2·H2O (33.80 mg/L), EDTA (18.80 mg/L) were mixed and solubilized in distilled water. The pH was adjusted to 6.3 (to avoid salt precipitation), and the solution was autoclaved at 120 °C for 15 min. Glycerol (60.00 g/L) and MgSO4·7H2O (1.60 g/L) solutions were also adjusted to pH 6.3 and autoclaved separately. For the medium assembly, the three solutions were mixed in a laminar flow cabinet. Kanamycin (50.00 mg/L) and Thiamine (45.00 mg/L) were diluted in milli-Q water, sterilized by membrane filtration (0.22 µm pore diameter) and added to the cooled medium. Polypropylene glycol (PPG) (1.00 mL/L) was added as antifoam [55].

3.4.4. Bioreactor Cultivation

The inoculum was prepared in a two-stage procedure. From a chemically-defined medium plate, single isolated colonies of E. coli were inoculated into two 500 mL Erlenmeyer flasks with 50 mL of fresh HDF medium. The flasks were incubated in a shaker (SL-223 Solab) at 37 °C and 300 rpm for 12 h. After reaching an optical density of 2.0 at 600 nm (OD600 nm), guaranteeing that the cells were in the exponential growth phase, a 5 mL aliquot from this culture was transferred to two Erlenmeyer flasks (1 L volume) with 100 mL of fresh HDF medium. The two flasks were incubated in a shaker at 37 °C and 300 rpm, with growth monitoring every hour via optical density measurements. After reaching an optical density of 2.5 at 600 nm, the flasks were mixed together in a laminar flow cabinet and inoculated into the reactor (obtaining an initial OD600nm of approximately 0.1) [21,52,55,56].
Batch cultivations were performed in a 5 L in house bioreactor. After calibrating the pH sensor, the bioreactor was sealed and autoclaved at 120 °C and 1.1 bar for 15 min. After cooling down, it was charged with 3.8 L of fresh medium, and DOC and biomass sensors were calibrated. Following the inoculation, cultivation conditions were set: pH controlled at 6.7, temperature set at 35 °C, and DOC kept at 30% of saturation [21,52,55,56]. Online data acquisition, monitoring, and control of all instruments were performed by SUPERYS_HCDC software. Samples were taken periodically in order to assess cell growth and acetic acid production. With carbon source depletion, a 0.5 L glycerol pulse was injected in the bioreactor after approximately 13.5 h.

3.4.5. Analytical Methods

For each sample, optical density tests were performed at 600 nm wavelength in a spectrophotometer (Genesys 10S UV-Vis-Themo Electron Corp.—Madison, WI, USA) after proper dilution. To establish a correlation between OD and dry cell weight, 1.5 mL samples were centrifugated (IEC microCL 21R-Thermo Electron Corp.—Madison, WI, USA) at 5000 rpm, 4 °C for 10 min in previously weighted 2 mL centrifuge tubes. The supernatant was reserved for HPLC analysis. The pellet was resuspended in 1 mL distilled water, centrifuged at 10,000 rpm, 5 °C for 5 min. The supernatant was discarded, and the pellets were dried at 70 °C for 12 h and weighted. Glycerol and acetic acid concentrations were analyzed by HPLC (Shimadzu—Kyoto, Japan). Aminex HPX-87H column (Biorad Life Science—Hercules, CA, USA) was employed for the analysis. The mobile phase was H2SO4 (5 mM) and the running was performed at 60 °C for 30 min at 0.60 mL/min. Refraction index detection (RID) was used to determine glycerol concentration, whilst UV detection at 210 nm was used for acetic acid analysis [54,56].

4. Results and Discussions

4.1. Simulation Results

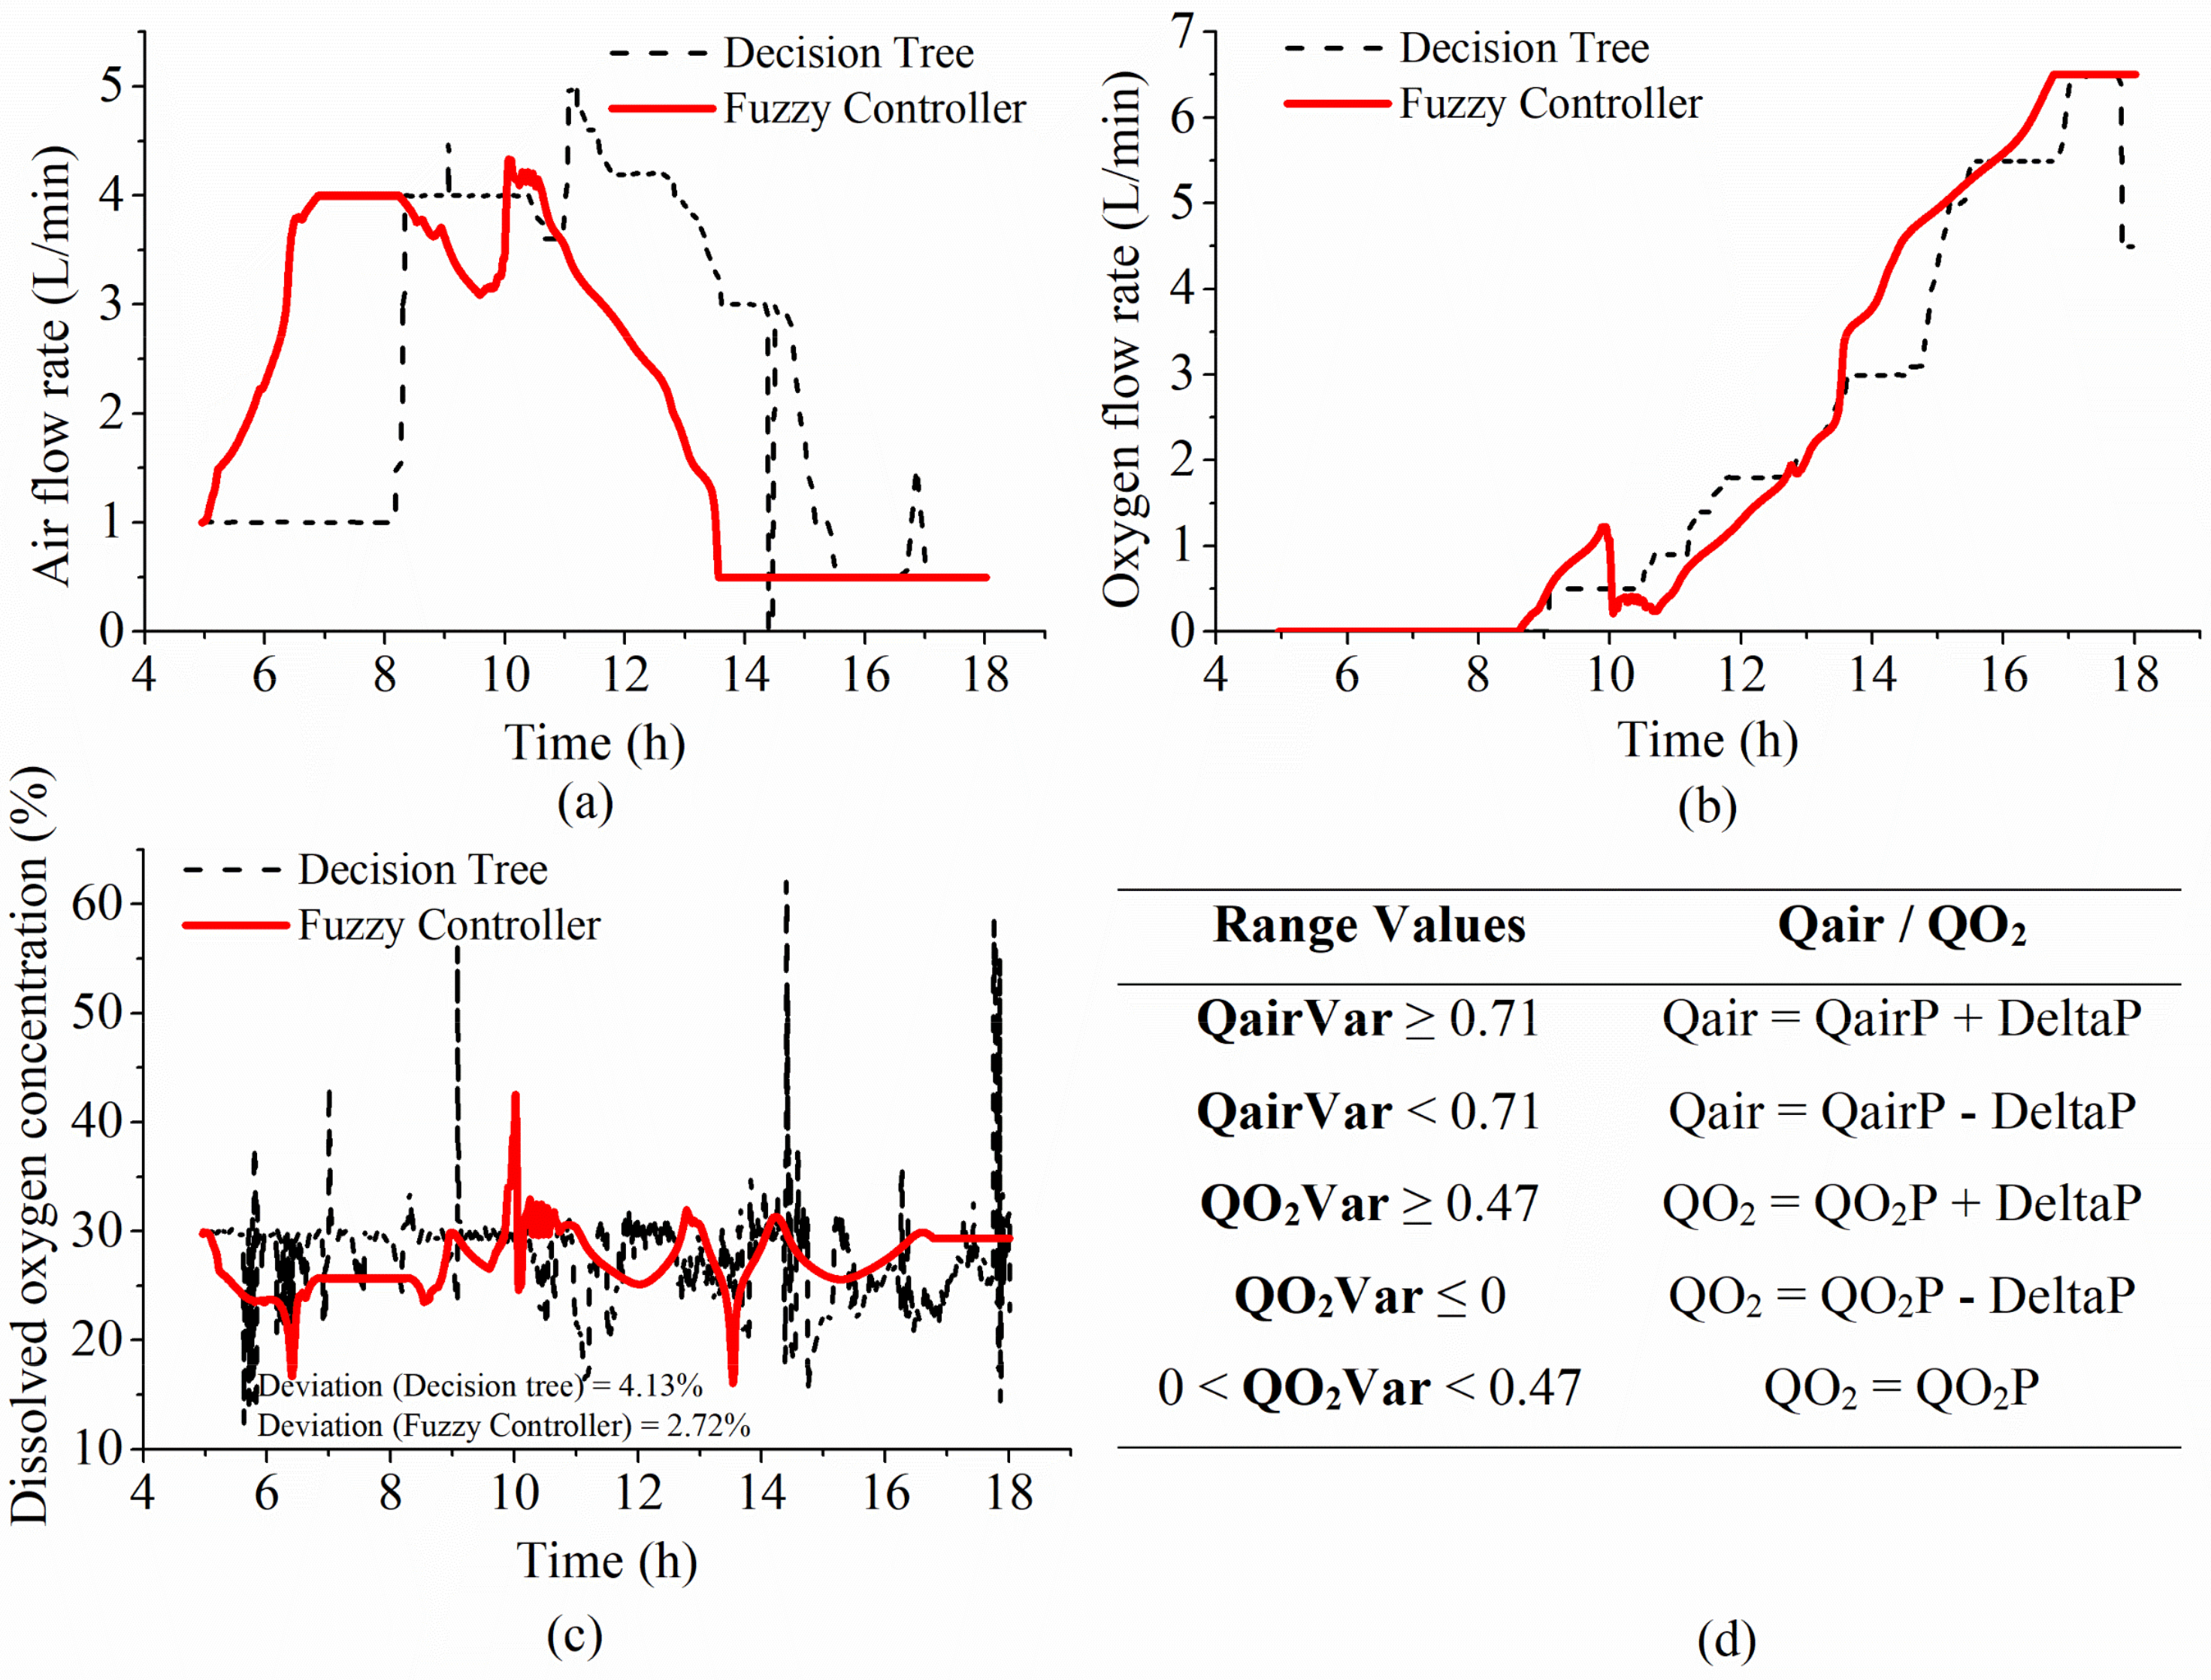
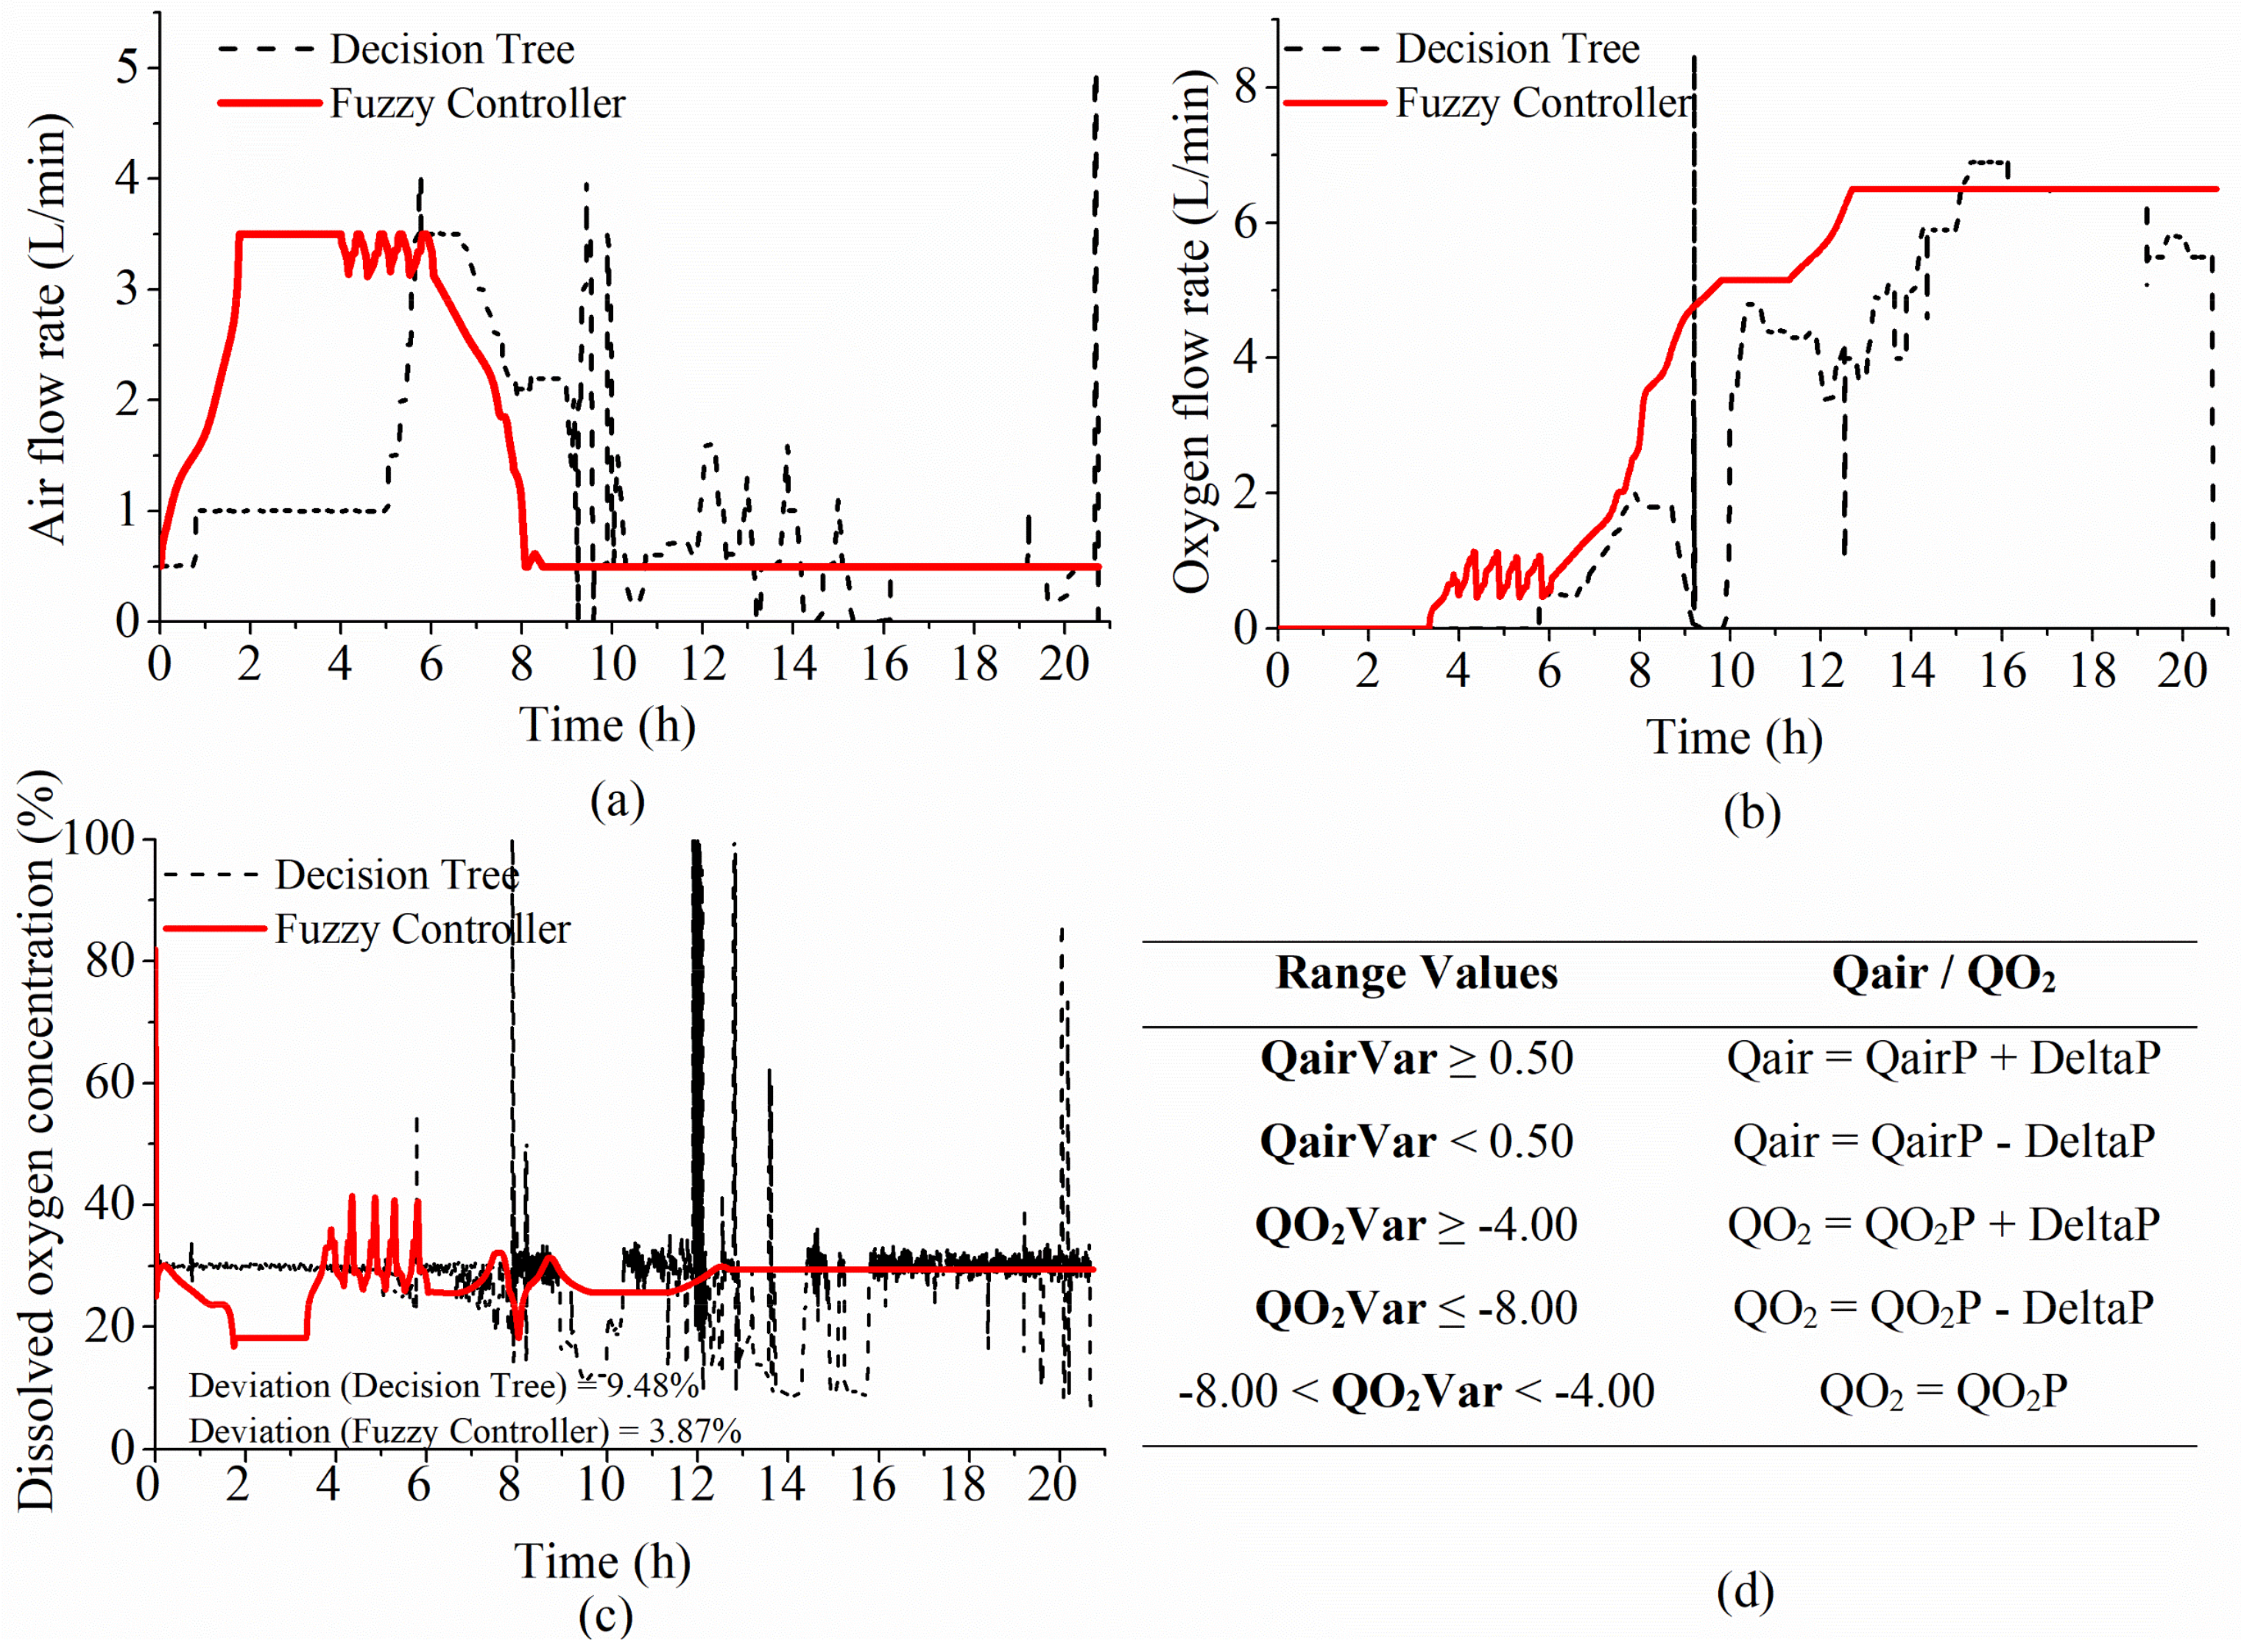
Figure 6 and Figure 7 illustrate the simulation results for the modeled processes, based on A16 and A12 datasets (respectively). The first simulation represents the base case (both fuzzy controller and neural networks were trained with the same A16 dataset). However, the second simulation is a robustness test, in order to test the fuzzy controller performance under a different simulated process (based on the A12 dataset).
Figure 6a,b compare the fuzzy controller and the decision tree dynamics in relation to air and oxygen flow rates (respectively). The result was an improvement in stability, for both flow rates. It also affected DO_net results; in a way that a smooth behavior (that is, the dissolved oxygen peaks were soften) was observed (Figure 6c). The fixed QairVar and QO2Var range values (associated with Princ1 and Princ2 subroutines, respectively) were heuristically determined by balancing small deviations in air and oxygen flow rates (compared with the decision tree responses) and smoother DOC behavior (Figure 6d). Both final QairVar and QO2Var range values were smaller than the output target used during ANFIS training. Thus, with the fuzzy DOC controller, it was possible to maintain the dissolved oxygen concentration near its optimum value of 30%, with little offset. It is worth noticing that the standard deviation of the decision tree responses was 1.52 times higher than those provided by the fuzzy controller (2.72%), proving, statistically, that DOC peaks were softened.
A second set of simulation run-ups was conducted aiming to test the fuzzy controller robustness. It is important to notice that no change in membership function parameters of fuzzy control was carried out for the new test. The second pair of trained neural networks (based on A12 dataset) were coupled with the simulator, and a new heuristic search for QairVar and QO2Var range values was performed.
Figure 7a,b compare the fuzzy controller and the decision tree dynamics. The result was an improvement in stability, for air and oxygen flow rates, by applying fuzzy logic. It also affected DO_net results, in a way so that a smoother behavior of the output was observed (Figure 7c). The fixed QairVar and QO2Var range values were heuristically determined by balancing small deviations in gas flow rates and smoother DOC behavior (Figure 7d). Both final QairVar and QO2Var range values were smaller than the output target used during ANFIS training (especially QO2Var range values). The standard deviation of the decision tree responses was 2.45 times higher than the fuzzy controller (3.87%), proving, statistically, that DOC peaks were softened.
In both modeled processes, the fuzzy controller kept the dissolved oxygen concentration near its setpoint value (30%), with little offset. The trends of air and oxygen flow rates, required by the E. coli cultivation, were followed by the fuzzy controller, with smoother behavior. Overall, the DOC peaks were softened; that is, the fuzzy controller responses were smoother than those provided by the decision tree.
All the findings described in this section suggest that the fuzzy logic is a viable option for DOC control in an E. coli cultivation, with robust control parameters adjusted by ANFIS.

4.2. DOC Fuzzy Controller Application in E. coli Cultivations

Following the implementation of the fuzzy controller in the SUPERSYS_HCDC program, tests were conducted on order to assess the performance of the controller during E. coli cultivations.

4.2.1. Initial Experiments

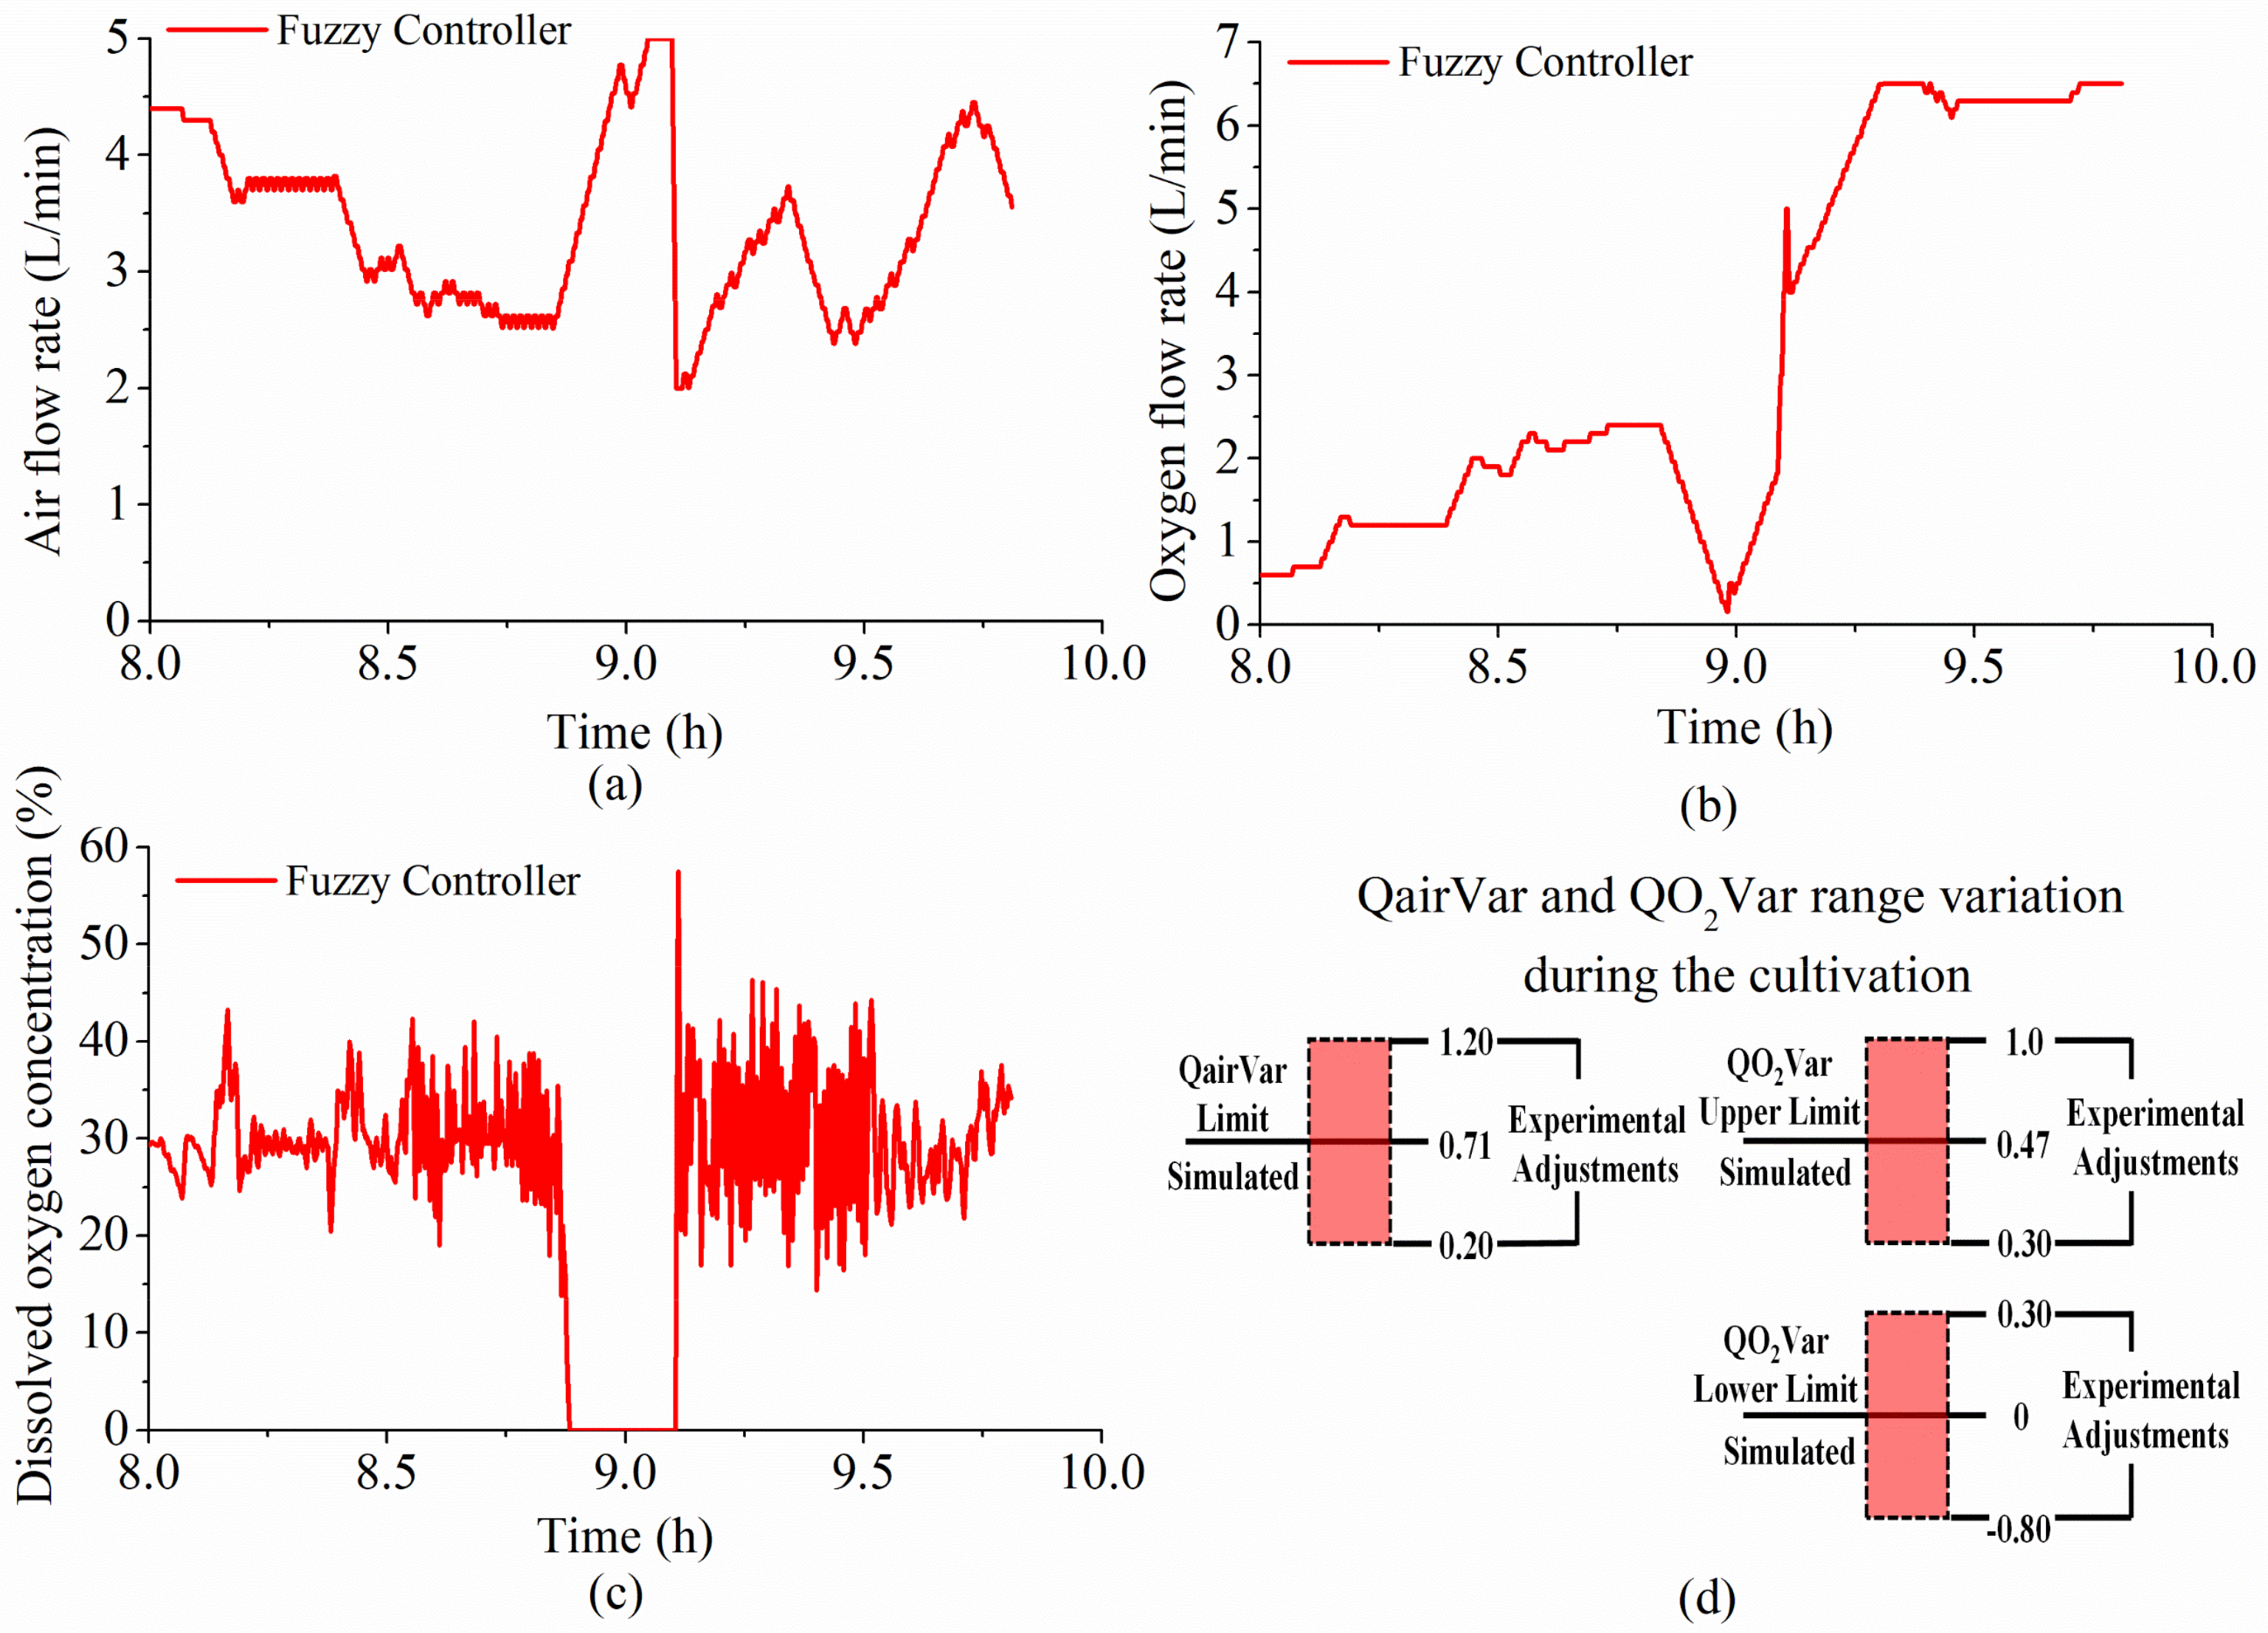
Initial tests consisted in E. coli cultivations, partially supervised by the fuzzy controller. In one of them, the decision tree was responsible for DOC control up till the eighth h, whilst the remaining period was overseen by the fuzzy controller (Figure 8).
The first period (data suppressed) was essential in order to stabilize the process, in some extent, for the fuzzy controller. Figure 8a,b show air and oxygen flow rates dynamics (respectively). The abrupt fall of oxygen flow rate was due to pressure loss in the gas line, which caused the dissolved oxygen depletion, as shown in Figure 8c. After pressure regularization, the elevated air flow rate was replaced by oxygen enrichment, leading to oscillations in DOC. This behavior contributed to a frequent tuning of QairVar and QO2Var limits during the re-stabilization period. However, these variations were small (maximum deviations of −0.80 and +0.53 from simulated values). Therefore, adjusted QairVar and QO2Var parameters were close to the simulation results (Figure 8d).
Overall, the fuzzy controller was able to kept the dissolved oxygen concentration near its setpoint value (30%) during the cultivation with a fast recovery after a critical deoxygenation period. The subsequent oscillatory period was short due to the adjustable QairVar and QO2Var range values, which proves the robustness of the controller parameters. However, fluctuations in DOC were observed before the disturbances, which led us to pursue further adjustments in the fuzzy controller structure.

4.2.2. Adjustments in Princ1 and Princ2 Fuzzy Systems and Further E. coli Tests

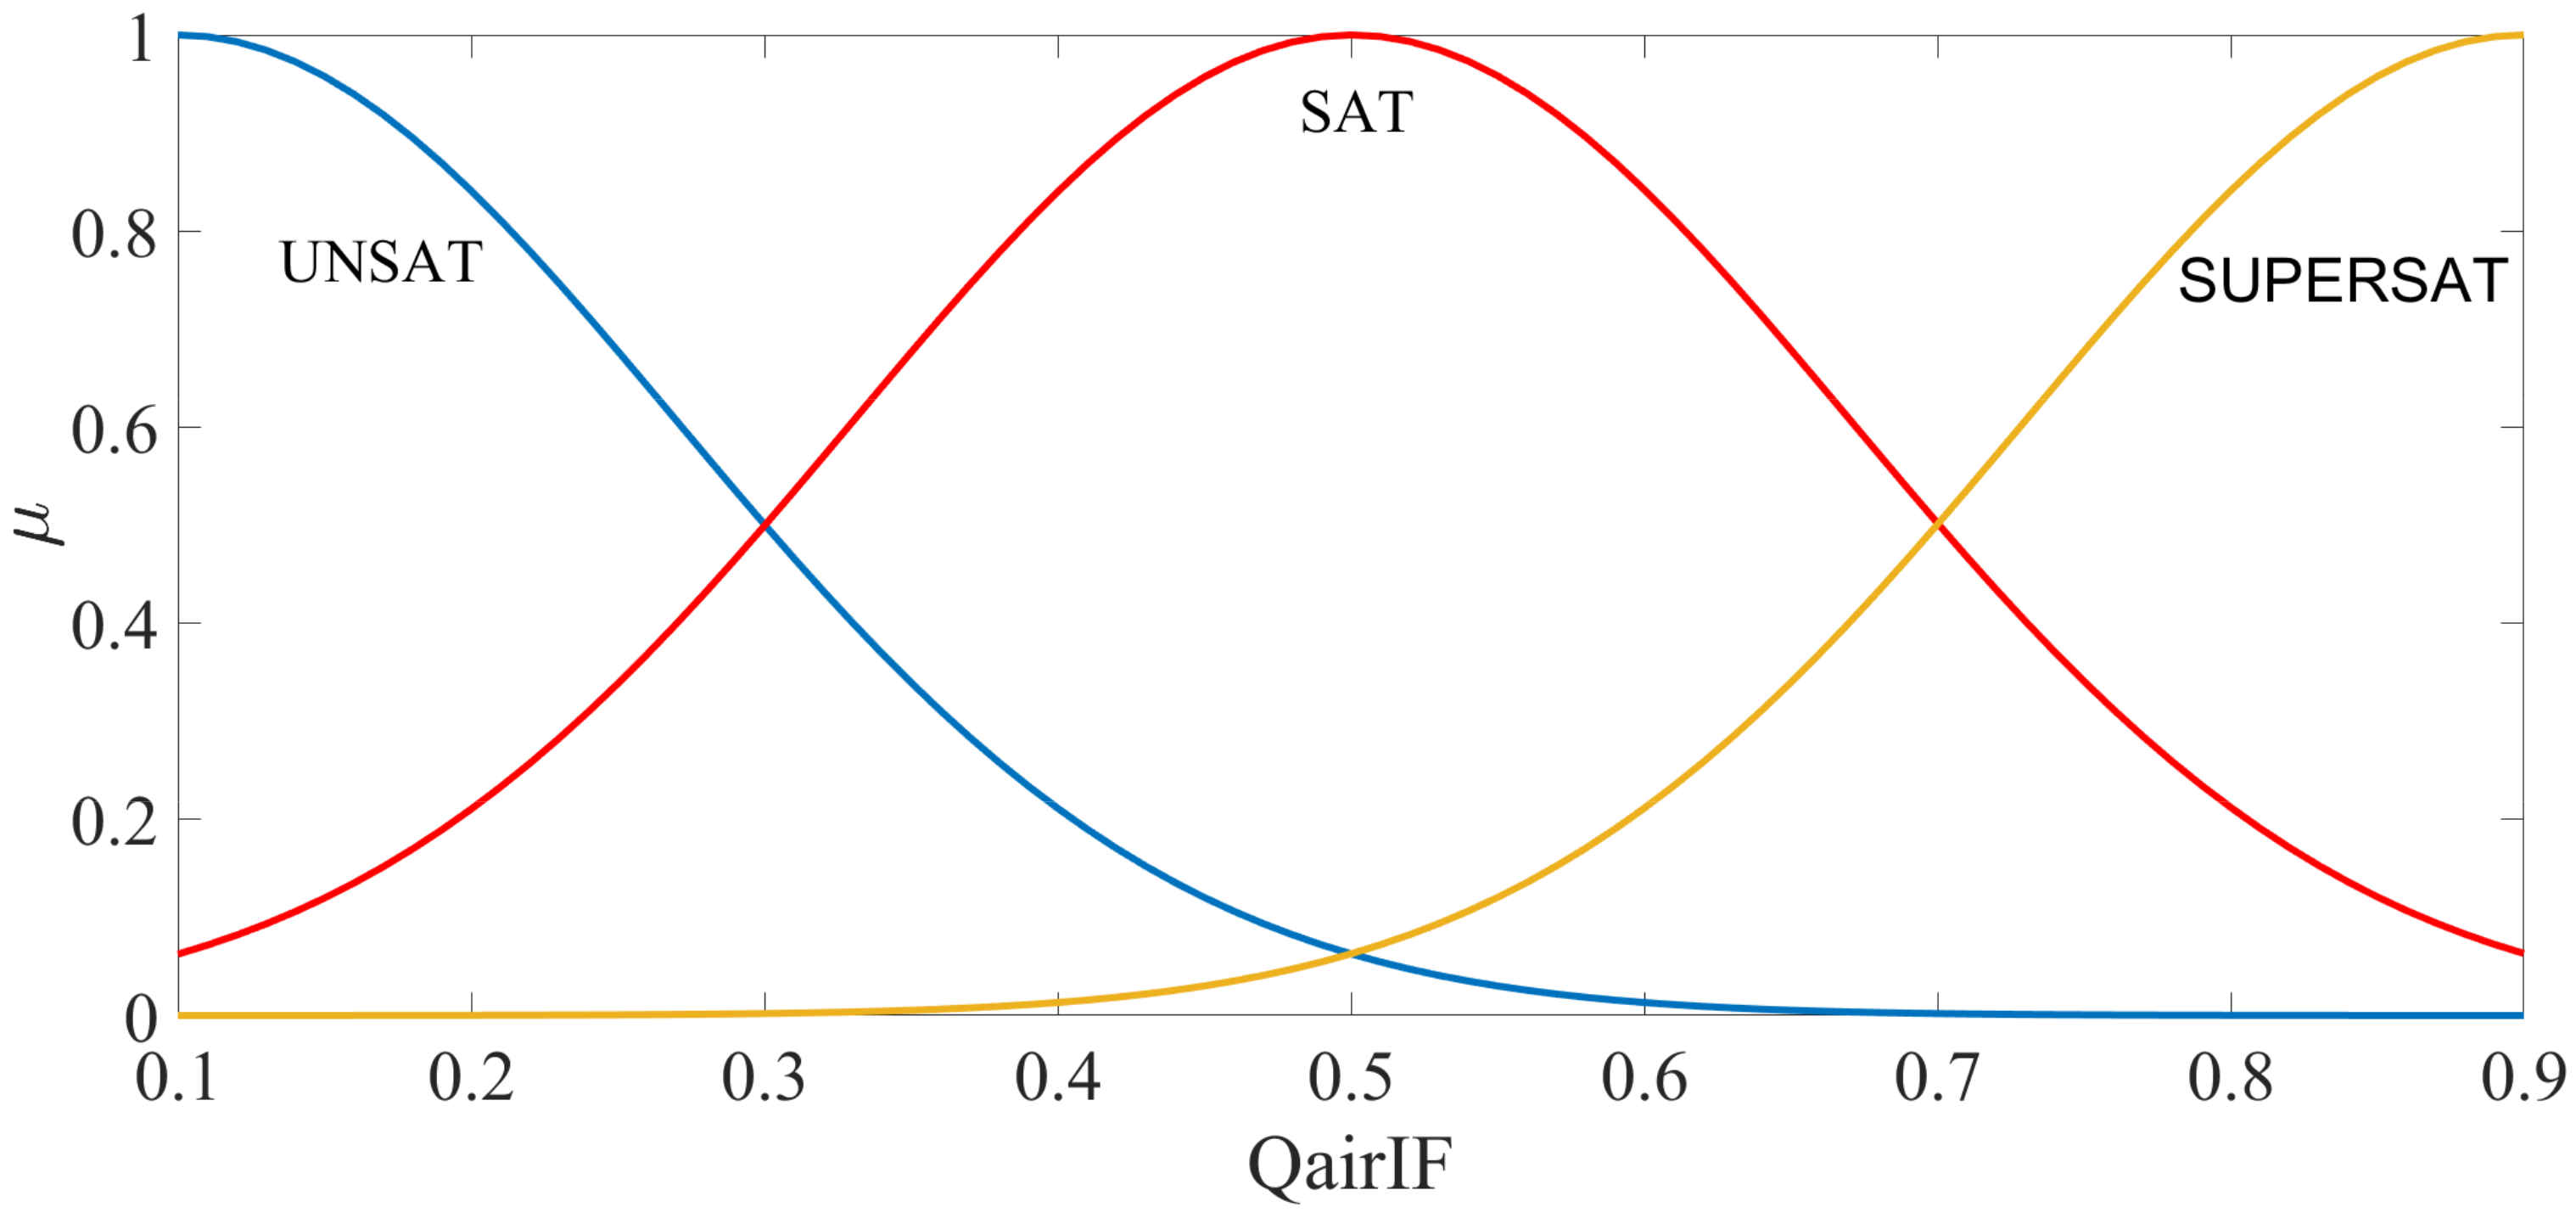
Since QairIF is an important variable, that defines if pure oxygen should be enriched in the cultivation (therefore decreasing air flow rate), efforts were made to improve its performance. Initial experiments results pointed mild difficulties establishing whether maximum gas flow rate had been reached or even surpassed (as this limit changed during the cultivation). Therefore, three linguistic values (unsaturated, saturate, and supersaturate) for QairIF were determined and adjusted by ANFIS, as shown in Figure 9.
With the new linguistic values, it was possible to establish clear limits between gas saturation levels, while keeping track of the maximum gas fluctuations during the cultivation. The three values were chosen based on the fuzzy control strategy and in the decision tree (Figure 1). At first, the system is unsaturated; therefore, air flow rate is continuously increased (with constant oxygen flow rate). When the system reached saturation (sum of air and oxygen flow rates equals the maximum gas flow rate), it gradually started to replace air flow rate with oxygen enrichment. As a protection mechanism, if the sum was greater than the maximum gas flow rate, both gas flow rate would be diminished (up till the saturation point).
By applying completeness and consistency principles, ANFIS created 108 “If-Then” fuzzy rules for each inference system. Some of them are summarized in Table 4.
With parameters a, b, c, d, e, and f, Equation (6) is summarized in Table 5.
The root mean squared errors of the training processes were 0.085 for Princ1 and 0.058 for Princ2. Once more, the training showed an almost perfect match between predicted and target values.
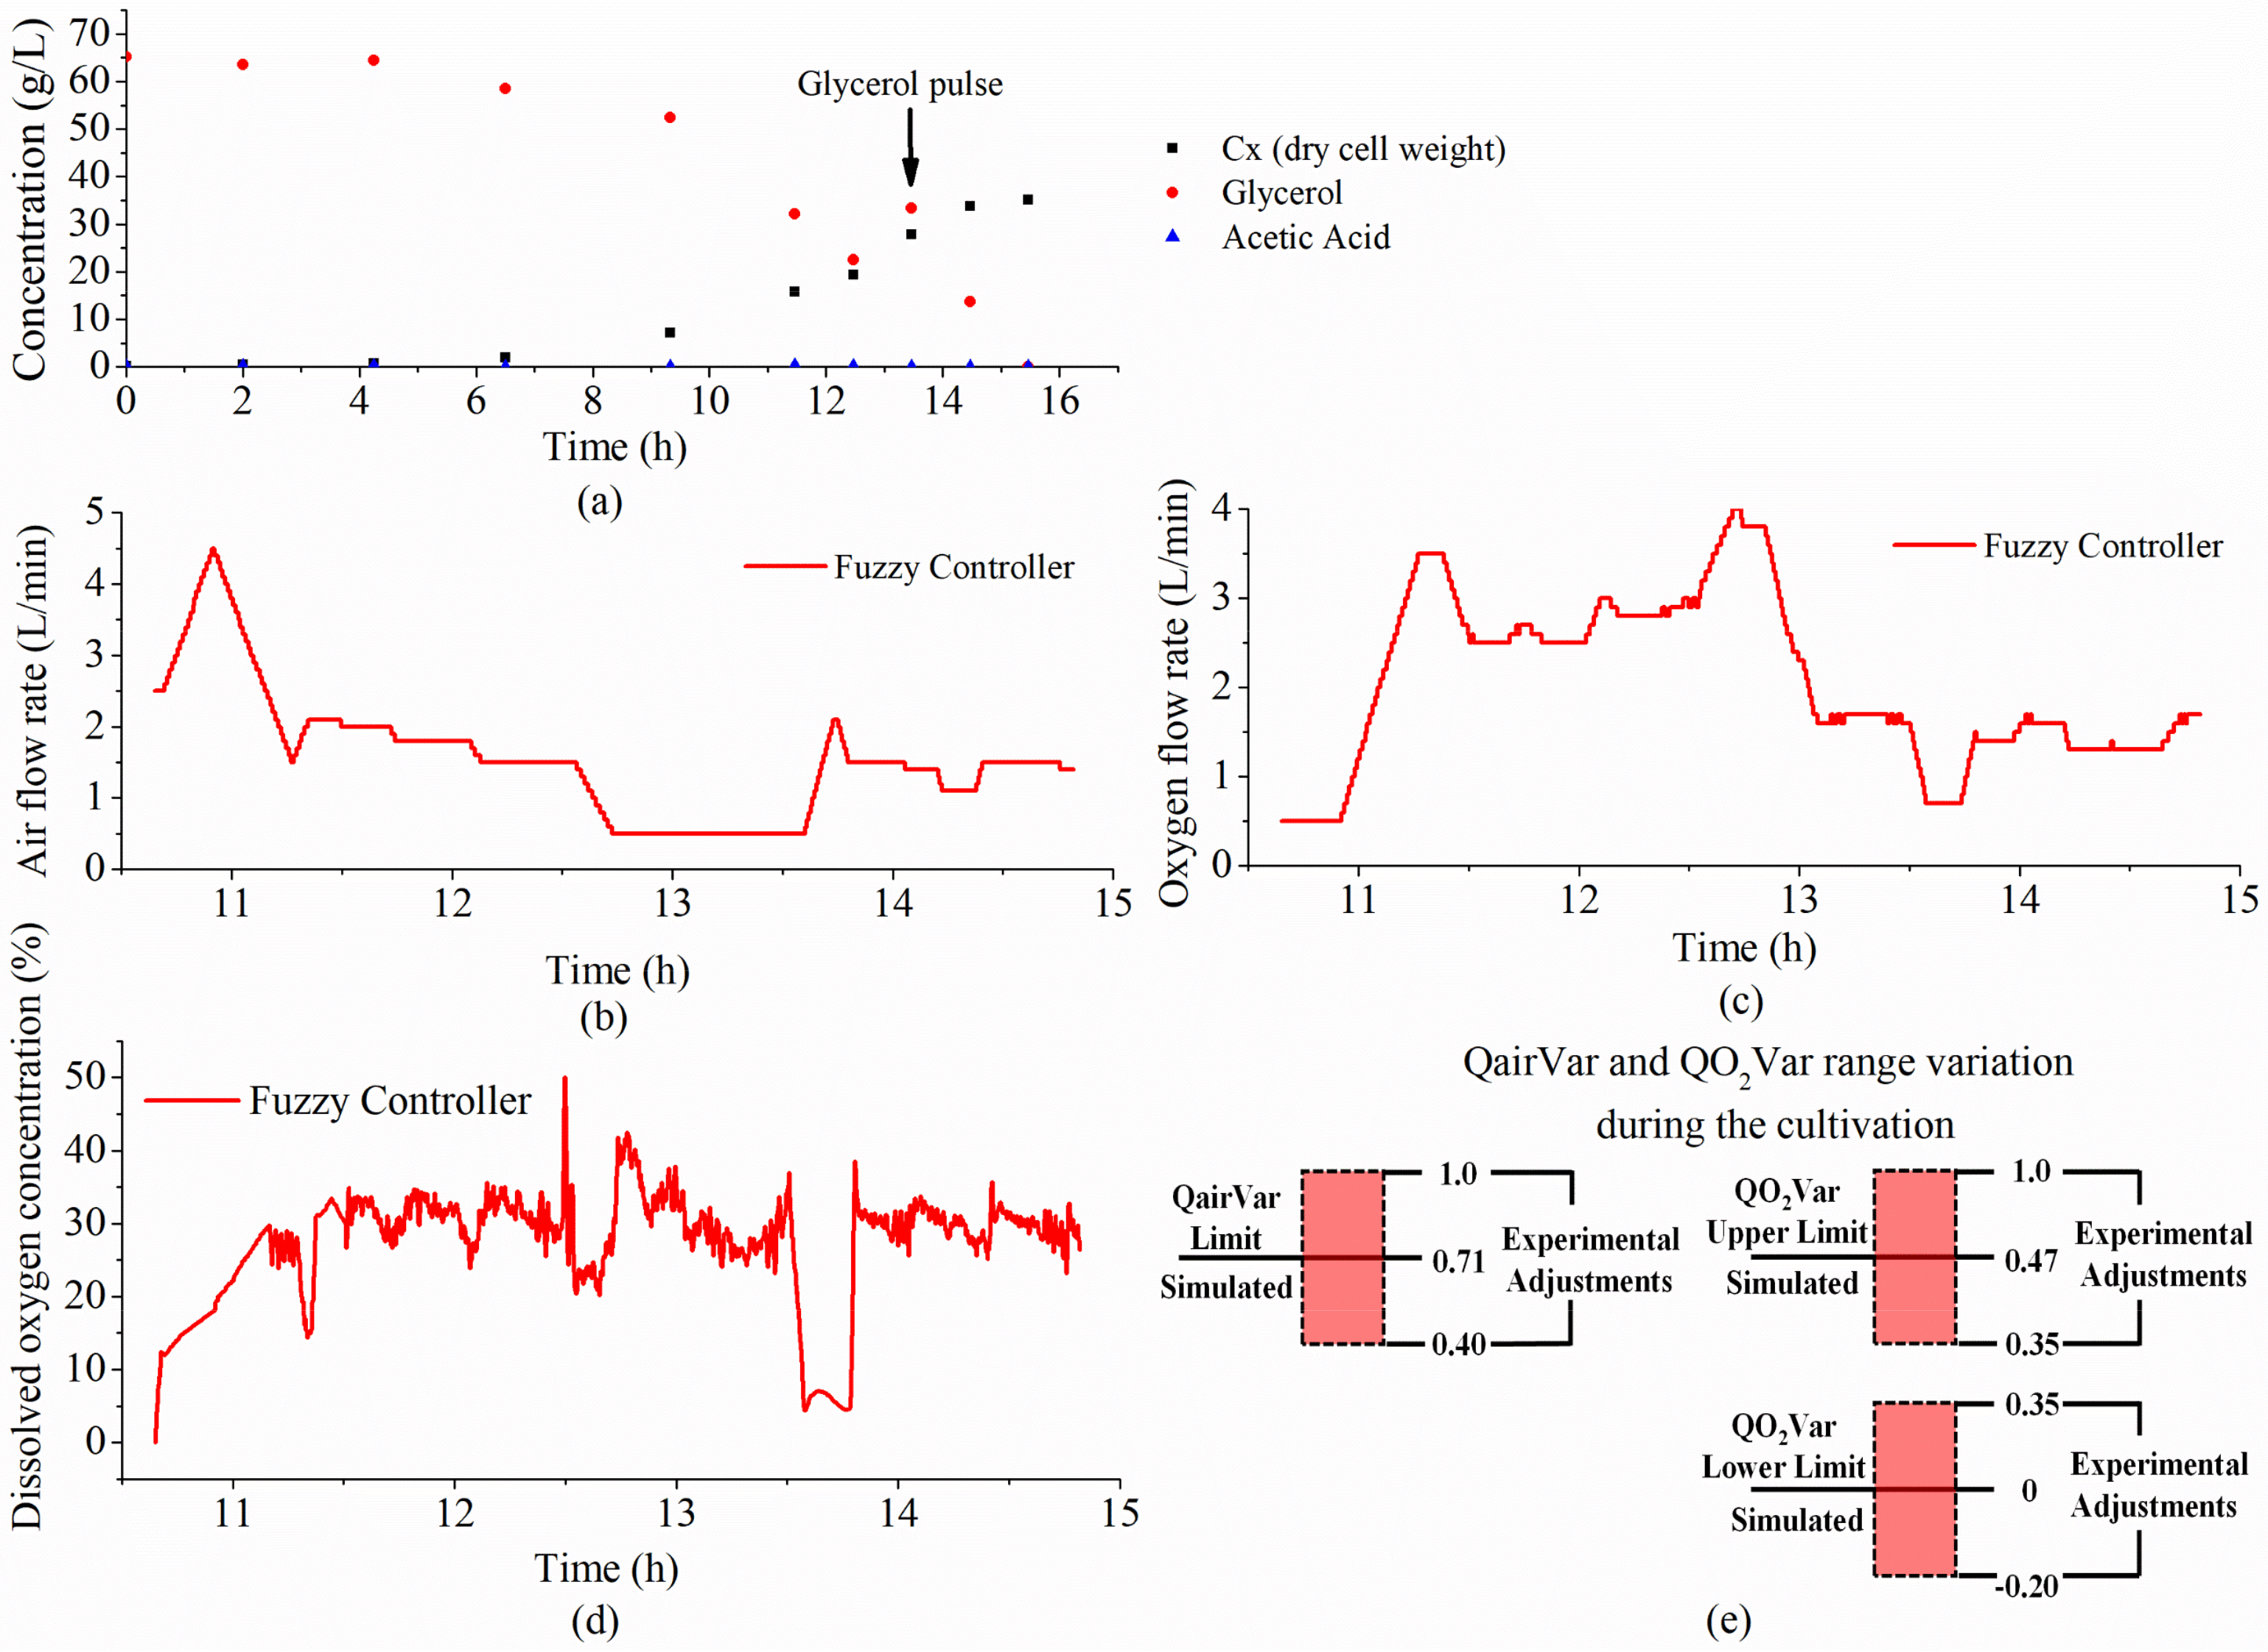
Following the re-training of the fuzzy inference systems and their re-implementation in the SUPERSYS_HCDC software, other E. coli cultivations were conducted. In one of them, the first 10 h were supervised by the decision tree, whilst the remaining period was overseen by the fuzzy controller. Analyzing the results, it was possible to obtain a final concentration of 35 gdry cell weight/L (with 2.41 g/(L * h) of productivity). Acetic acid production was neglectable (maximum concentration of 0.15 g/L, as shown in Figure 10a). Figure 10b,c show air and oxygen flow rates dynamics (respectively). By comparing these results with Figure 8a,b, it is possible to notice a smoother behavior of the manipulated variables. It also led to a less oscillatory DOC behavior during the cultivation. The exception was at around 13.5 h, when the glycerol pulse was injected in the system, causing an abrupt fall in DOC (Figure 10d). The fast recovery and stabilization of DOC around the set point value (30%) proved, once more, the robustness of the fuzzy controller. Figure 10e compares the simulation results for QairVar and QO2Var range values (used as initial condition set for the fuzzy controller) and their maximum variation range (heuristically determined during the experiment). Both values were close to the simulation results (maximum deviations of −0.31 and +0.53 from simulated values).
Comparing Figure 8 and Figure 10, the adjustments in the fuzzy controller showed improvements in the DOC control. The mild fluctuations observed in Figure 8c were attenuated. Statistically, in both Figure 8c and Figure 10d, DOC mean was approximately 30%. The standard deviation in Figure 10d was smaller than in Figure 8c (3.93% and 5.59%, respectively), which was translated into an attenuation of DOC peaks in the latter. Although corrections in QairVar and QO2Var range values were necessary in both experiments, a clear reduction in the deviation was observed, pointing toward an increase in stability and performance. Therefore, this paper presents a relevant contribution in the field of DOC control and its influence in recombinant microorganism cultivation, a topic of major importance that has been debated in other articles [57,58,59].

5. Conclusions

The findings have shown the feasibility of applying fuzzy reasoning for DOC control in a bioreactor. Regarding the classical control strategies-based on complex equations and mathematical modeling-fuzzy logic overcame the high DOC non-linearity by translating the expert’s knowledge into a linguistic, rule-based controller. Moreover, from its concept up till its operation, the fuzzy controller proved to be less complicated than the classical strategies. With few selected input and output variables and cultivation data, the optimized fuzzy controller proved to be robust (regarding its parameters) and adaptable (as modifications could be easily performed during the implementation step in the SUPERSYS_HCDC software). Simulation results have shown smoother behavior of the manipulated variables (air and oxygen flow rates) compared with the previous controller (decision tree), leading to an attenuation of DOC peaks. These findings were confirmed based on E. coli cultivations results. Furthermore, experimental QairVar and QO2Var range values were close to the simulation results, with mild adjustments during the experiments, proving the robustness of the fuzzy controller parameters.
Overall, the results lead not only to an increase in the flow meter lifespan (due to its sensitivity to abrupt oscillations in air and oxygen flow rates) but also point toward a possible reduction in the metabolic stress suffered by the E. coli, given its sensitivity to oscillations in dissolved oxygen concentration. Further investigations, based on this new strategy of DOC control, can lead to a productivity increase and cost reduction in microorganism cultivations.
Computation-wise, the fuzzy controller proved to be flexible, as it was implemented in two wide-known types of programming software (MATLAB and LabVIEW). In addition, the fuzzy controller is an important update in the SUPERSYS_HDCD program that could benefit different research studies on microorganism cultivation. Although fuzzy reasoning applicability has been proven successful in different fields, its implementation on bioreactor control is still timid. This work is one of the few recent attempts to readdress DOC control issues in bioreactors, an area that requires different solutions for complex problems.

Author Contributions

Conceptualization, R.A.A. and R.d.S.J.; methodology, R.A.A., A.C.L.H. and R.d.S.J.; software, R.A.A. and R.d.S.J.; validation, R.A.A., M.L.H., A.C.L.H. and R.d.S.J.; formal analysis, R.A.A. and R.d.S.J.; investigation, R.A.A., M.L.H., A.C.L.H. and R.d.S.J.; resources, A.C.L.H. and R.d.S.J.; data curation, R.A.A. and A.C.L.H.; writing—original draft preparation, R.A.A.; writing—review and editing, R.A.A., A.C.L.H. and R.d.S.J.; visualization, R.A.A. and R.d.S.J.; supervision, R.d.S.J.; project administration, R.d.S.J.; funding acquisition, A.C.L.H. and R.d.S.J. All authors have read and agreed to the published version of the manuscript.

Funding

This study was financed in part by the Coordenação de Aperfeiçoamento de Pessoal de Nível Superior-Brasil (CAPES)-Finance Code 001. Authors would also like to thank CNPq and FAPESP.

Conflicts of Interest

The authors declare no conflict of interest.

References

  1. Riesenberg, D. High-cell-density cultivation of Escherichia coli. Curr. Opin. Biotechnol. 1991, 2, 380–384. [Google Scholar] [CrossRef]
  2. Lee, S.Y. High cell-density culture of Escherichia coli. Trends Biotechnol. 1996, 14, 98–105. [Google Scholar] [CrossRef]
  3. Riesenberg, D.; Guthke, R. High-cell-density cultivation of microorganisms. Appl. Microbiol. Biotechnol. 1999, 51, 422–430. [Google Scholar] [CrossRef]
  4. Shiloach, J.; Fass, R. Growing, E. coli to high cell density—A historical perspective on method development. Biotechnol. Adv. 2005, 23, 345–357. [Google Scholar] [CrossRef] [PubMed]
  5. Luli, G.W.; Strohl, W.R. Comparison of growth, acetate production, and acetate inhibition of Escherichia coli strains in batch and fed-batch fermentations. Appl. Environ. Microbiol. 1990, 56, 1004–1011. [Google Scholar] [CrossRef] [Green Version]
  6. Majewski, R.A.; Domach, M.M. Simple constrained-optimization view of acetate overflow in E. coli. Biotechnol. Bioeng. 1990, 35, 732–738. [Google Scholar] [CrossRef]
  7. Nakano, K.; Rischke, M.; Sato, S.; Märkl, H. Influence of acetic acid on the growth of Escherichia coli K12 during high-cell-density cultivation in a dialysis reactor. Appl. Microbiol. Biotechnol. 1997, 48, 597–601. [Google Scholar] [CrossRef]
  8. Phue, J.N.; Shiloach, J. Impact of dissolved oxygen concentration on acetate accumulation and physiology of E. coli BL21, evaluating transcription levels of key genes at different dissolved oxygen conditions. Metab. Eng. 2005, 7, 353–363. [Google Scholar] [CrossRef] [PubMed]
  9. O’Beirne, D.; Hamer, G. Oxygen availability and growth of Escherichia coli W3110: Dynamic responses to limitation and starvation. Bioprocess Eng. 2000, 23, 381–387. [Google Scholar] [CrossRef]
  10. O’Beirne, D.; Hamer, G. Oxygen availability and the growth of Escherichia coli W3110: A problem exacerbated by scale-up. Bioprocess Eng. 2000, 23, 487–494. [Google Scholar] [CrossRef]
  11. Eiteman, M.A.; Altman, E. Overcoming acetate in Escherichia coli recombinant protein fermentations. Trends Biotechnol. 2006, 24, 530–536. [Google Scholar] [CrossRef]
  12. Martin, T.W.; Couch, L.T. Fuzzy logic control of dissolved oxygen in a bio-reactor. In Proceedings of the IEEE 5th International Fuzzy Systems, New Orleans, LA, USA, 8–11 September 1996; IEEE: Piscataway, NJ, USA, 1996; pp. 936–940. [Google Scholar]
  13. Schmidell, W.; Lima, U.A.; Aquarone, E.; Borzani, W. Biotecnologia Industrial: Volume 2, 1st ed.; Edgard Blücher: São Paulo, Brazil, 2001; ISBN 9788578110796. [Google Scholar]
  14. Lee, S.C.; Hwang, Y.B.; Chang, H.N.; Chang, Y.K. Adaptive control of dissolved oxygen concentration in a bioreactor. Biotechnol. Bioeng. 1991, 37, 597–607. [Google Scholar] [CrossRef]
  15. Hsiao, J.; Ahluwali, M.; Kaufman, J.B.; Clem, T.R.; Shiloach, J. Adaptive Control Strategy for Maintaining Dissolved Oxygen Concentration in High Density Growth of Recombinant, E. coli. Ann. N. Y. Acad. Sci. 1992, 665, 320–333. [Google Scholar] [CrossRef] [PubMed]
  16. Akesson, M.; Hagander, P. Control of Dissolved Oxygen in Stirred Bioreactors. Technical Reports TFRT-7571. 1998, pp. 1–16. Available online: https://portal.research.lu.se/en/publications/control-of-dissolved-oxygen-in-stirred-bioreactors (accessed on 2 November 2021).
  17. Arevalo, H.; Sanchez, F.; Ruiz, F.; Guerrero, D.; Patino, D.; Almeciga-Diaz, C.J.; Rodriguez-Lopez, A. Gain-Scheduled Oxygen Concentration Control System for a Bioreactor. IEEE Lat. Am. Trans. 2018, 16, 2689–2697. [Google Scholar] [CrossRef]
  18. Chitra, M.; Pappa, N.; Abraham, A. Dissolved Oxygen Control of Batch Bioreactor using Model Reference Adaptive Control scheme. IFAC-Pap. 2018, 51, 13–18. [Google Scholar] [CrossRef]
  19. Mareels, I.M.Y.; Anderson, B.D.O.; Bitmead, R.R.; Bodson, M.; Sastry, S.S. Revisiting the Mit Rule for Adaptive Control. IFAC Proc. Vol. 1987, 20, 161–166. [Google Scholar] [CrossRef]
  20. Konstantinov, K.; Yoshida, T. Knowledge-Based Control of Fermentation Processes. Biotechnol. Bioeng. 1992, 39, 479–486. [Google Scholar] [CrossRef]
  21. Horta, A.C.L. Sistema Automático de Supervisão e Controle de Cultivos de Alta Densidade Celular de E.coli Recombinante. Doctoral Dissertation, Federal University of São Carlos, São Carlos, Brazil, 2011. [Google Scholar]
  22. Horta, A.C.L.; Da Silva, A.J.; Sargo, C.R.; Gonçalves, V.M.; Zangirolami, T.C.; De Campos Giordano, R. Robust artificial intelligence tool for automatic start-up of the supplementary medium feeding in recombinant E. coli cultivations. Bioprocess Biosyst. Eng. 2011, 34, 891–901. [Google Scholar] [CrossRef] [PubMed]
  23. Horta, A.C.L.; Silva, A.J.; Sargo, C.R.; Velez, A.M.; Gonzaga, M.C.; Giordano, R.C.; Gonçalves, V.M.; Zangirolami, T.C. A supervision and control tool based on artificial intelligence for high cell density cultivations. Braz. J. Chem. Eng. 2014, 31, 457–468. [Google Scholar] [CrossRef]
  24. Zadeh, L.A. Fuzzy sets. Inf. Control 1965, 8, 338–353. [Google Scholar] [CrossRef] [Green Version]
  25. Zadeh, L.A. Fuzzy logic, neural networks, and soft computing. Commun. ACM 1994, 37, 77–84. [Google Scholar] [CrossRef]
  26. Akisue, R.A.; Horta, A.C.L.; de Sousa, R. Development of a Fuzzy System for Dissolved Oxygen Control in a Recombinant Escherichia coli Cultivation for Heterologous Protein Expression. In Computer Aided Chemical Engineering, Proceeding of the 28th European Symposium on Computer Aided Process Engineering, Graz, Austria, 10–13 June; Friedl, A., Klemeš, J.J., Radl, S., Varbanov, P.S., Wallek, T., Eds.; Elsevier B.V: Amsterdam, The Netherlands, 2018; Volume 43, pp. 1129–1134. [Google Scholar] [CrossRef]
  27. Noll, P.; Henkel, M. History and Evolution of Modeling in Biotechnology: Modeling & Simulation, Application and Hardware Performance. Comput. Struct. Biotechnol. J. 2020, 18, 3309–3323. [Google Scholar] [CrossRef]
  28. Zadeh, L.A. Fuzzy Logic and Approximate Reasoning. Synthese 1975, 30, 407–428. [Google Scholar]
  29. Zadeh, L.A. Fuzzy Logic. Comput. 1988, 21, 83–93. [Google Scholar] [CrossRef]
  30. Belohlavek, R.; Dauben, J.W.; Klir, G.J. Fuzzy Logic and Mathematics, 1st ed.; Oxford University Press: Oxford, UK, 2017; Volume 1, ISBN 9780190200015. [Google Scholar]
  31. Gomide, F.A.C.; Gudwin, R.R. Modelagem, Controle, Sistemas e Lógica Fuzzy. SBA Control Automação 1994, 4, 97–115. [Google Scholar]
  32. Nelles, O. Nonlinear System Identification, 1st ed.; Springer: Berlin/Heidelberg, Germany, 2001; ISBN 978-3-642-08674-8. [Google Scholar]
  33. Kosko, B. Fuzzy Thinking the New Science of Fuzzy Logic, 1st ed.; Hyperion: New York, NY, USA, 1994; Volume 1. [Google Scholar]
  34. Zadeh, L.A. Fuzzy logic—A personal perspective. Fuzzy Sets Syst. 2015, 281, 4–20. [Google Scholar] [CrossRef]
  35. Horiuchi, J.I. Fuzzy modeling and control of biological processes. J. Biosci. Bioeng. 2002, 94, 574–578. [Google Scholar] [CrossRef]
  36. Horiuchi, J.I.; Kishimoto, M. Application of fuzzy control to industrial bioprocesses in Japan. Fuzzy Sets Syst. 2002, 128, 117–124. [Google Scholar] [CrossRef]
  37. Honda, H.; Kobayashi, T. Fuzzy control of bioprocess. J. Biosci. Bioeng. 2000, 89, 401–408. [Google Scholar] [CrossRef]
  38. Shioya, S.; Shimizu, K.; Yoshida, T. Knowledge-based design and operation of bioprocess systems. J. Biosci. Bioeng. 1999, 87, 261–266. [Google Scholar] [CrossRef]
  39. Nakamura, T.; Kuratani, T.; Morita, Y. Fuzzy Control Application to Glutamic Acid Fermentation. IFAC Proc. Vol. 1985, 18, 231–235. [Google Scholar] [CrossRef]
  40. Sousa, R.; Almeida, P.I.F. Design of a fuzzy system for the control of a biochemical reactor in fed-batch culture. Process Biochem. 2001, 37, 461–469. [Google Scholar] [CrossRef]
  41. Nucci, E.R.; Silva, R.G.; Gomes, T.C.; Giordano, R.C.; Cruz, A.J.G. A fuzzy logic algorithm for identification of the harvesting threshold during PGA production by Bacillus megaterium. Braz. J. Chem. Eng. 2005, 22, 521–527. [Google Scholar] [CrossRef]
  42. Borges, A.S.; Montano, I.D.C.; Sousa Junior, R.; Suarez, C.A.G. Automatic solids feeder using fuzzy control: A tool for fed batch bioprocesses. J. Process Control 2020, 93, 28–42. [Google Scholar] [CrossRef]
  43. Belchior, C.A.C.; Araújo, R.A.M.; Landeck, J.A.C. Dissolved oxygen control of the activated sludge wastewater treatment process using stable adaptive fuzzy control. Comput. Chem. Eng. 2012, 37, 152–162. [Google Scholar] [CrossRef]
  44. Huang, M.; Wan, J.; Wang, Y.; Ma, Y.; Zhang, H.; Liu, H.; Hu, Z.; Yoo, C.K. Modeling of a paper-making wastewater treatment process using a fuzzy neural network. Korean J. Chem. Eng. 2012, 29, 636–643. [Google Scholar] [CrossRef]
  45. Yang, T.; Qiu, W.; Ma, Y.; Chadli, M.; Zhang, L. Fuzzy model-based predictive control of dissolved oxygen in activated sludge processes. Neurocomputing 2014, 136, 88–95. [Google Scholar] [CrossRef]
  46. Piotrowski, R. Supervisory fuzzy control system for biological processes in sequencing wastewater batch reactor. Urban Water J. 2020, 17, 325–332. [Google Scholar] [CrossRef]
  47. Horta, A.C.L.; Zangirolami, T.C.; de Giordano, R.C.; Reis, G.B.; da Cruz, A.J.G.; de Jesus, C.D.F. SUPERSYS_HCDC—Programa de Computador Para Monitoramento e Controle de Biorreatores Para Cultivos; Instituto Nacional da Propriedade Industrial: Brasilia, Brazil, 2011. [Google Scholar]
  48. MathWorks. Fuzzy Logic Toolbox TM User ’s Guide, 29th ed.; MathWorks: Natick, MA, USA, 2016. [Google Scholar]
  49. Jang, J.-S.R. ANFIS: Adaptive-Network-based Fuzzy Inference System. IEEE Trans. Syst. Man Cybern. 1993, 23, 665–683. [Google Scholar] [CrossRef]
  50. Howard, D.; Mark, B. Neural Network Toolbox Documentation. In Neural Network Tool, 4th ed.; MathWorks: Natick, MA, USA, 2004; p. 846. [Google Scholar]
  51. Beale, M.; Hagan, M.; Demuth, H. Neural Network ToolboxTM User’s Guide R2017b, 31st ed.; MathWorks: Natick, MA, USA, 2017. [Google Scholar] [CrossRef]
  52. Horta, A.C.L.; Sargo, C.R.; Da Silva, A.J.; De Carvalho Gonzaga, M.; Dos Santos, M.P.; Gonçalves, V.M.; Zangirolami, T.C.; De Campos Giordano, R. Intensification of high cell-density cultivations of rE. coli for production of S. pneumoniae antigenic surface protein, PspA3, using model-based adaptive control. Bioprocess Biosyst. Eng. 2012, 35, 1269–1280. [Google Scholar] [CrossRef]
  53. Takagi, T.; Sugeno, M. Fuzzy Identification of Systems and Its Applications to Fault Diagnosis Systems. IEEE Trans. Syst. Man Cybern. 1985, 15, 116–132. [Google Scholar] [CrossRef]
  54. Carvalho, R.J.; Cabrera-Crespo, J.; Tanizaki, M.M.; Gonçalves, V.M. Development of production and purification processes of recombinant fragment of pneumococcal surface protein A in Escherichia coli using different carbon sources and chromatography sequences. Appl. Microbiol. Biotechnol. 2012, 94, 683–694. [Google Scholar] [CrossRef] [PubMed]
  55. Silva, G.G. Aspectos Morfológicos, Reológicos e Fisiológicos dos Cultivos de Eschericha coli Recombinante. Master’s Thesis, Federal University of São Carlos, São Carlos, Brazil, 2015. [Google Scholar]
  56. Sargo, C.R. Aperfeiçoamento de Cultivos de Alta Densidade Celular de rE.coli Utilizando Glicerol Como Fonte de Carbono. Master’s Thesis, Federal University of São Carlos, São Carlos, Brazil, 2011. [Google Scholar]
  57. De León, A.; Barba-De La Rosa, A.P.; Mayani, H.; Galindo, E.; Ramírez, O.T. Two Useful Dimensionless Parameters That Combine Physiological, Operational and Bioreactor Design Parameters for Improved Control of Dissolved Oxygen. Biotechnol. Lett. 2001, 23, 1051–1056. [Google Scholar] [CrossRef]
  58. De León-Rodríguez, A.; Galindo, E.; Ramírez, O.T. Design and Characterization of a One-Compartment Scale-down System for Simulating Dissolved Oxygen Tension Gradients. J. Chem. Technol. Biotechnol. 2010, 85, 950–956. [Google Scholar] [CrossRef]
  59. De León, A.; Hernández, V.; Galindo, E.; Ramírez, O.T. Effects of dissolved oxygen tension on the production of recombinant penicillin acylase in Escherichia coli. Enzyme Microb. Technol. 2003, 33, 689–697. [Google Scholar] [CrossRef]
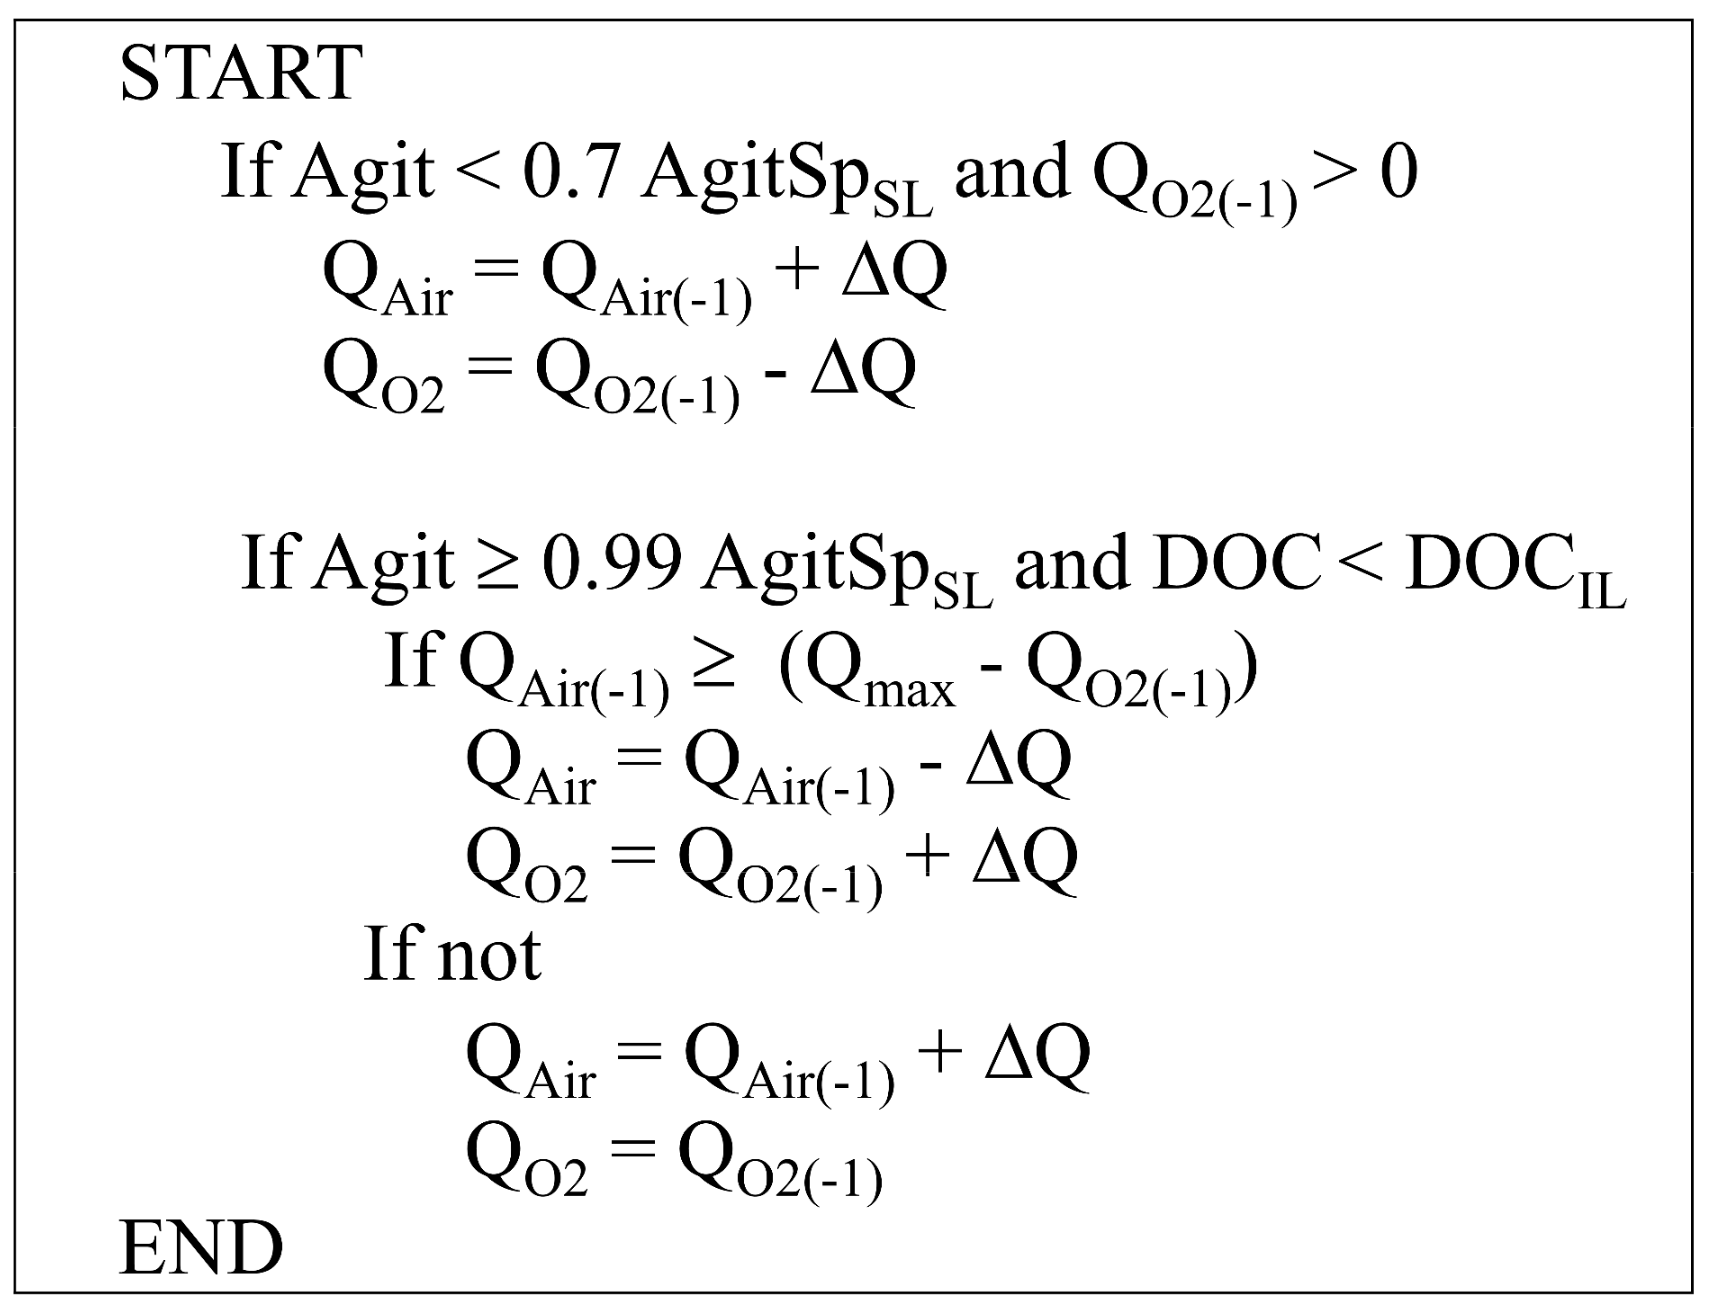
Figure 1. Decision tree for air and oxygen flow rates manipulation in SUPERSYS_HCDC.
Algorithms 14 00326 g001
Figure 2. Delta surface response after ANFIS training.
Algorithms 14 00326 g002
Figure 3. Delta, Princ1, and Princ2 Sugeno-type fuzzy inference systems input variables (with their linguistic values and membership functions) adjusted by ANFIS.
Algorithms 14 00326 g003
Figure 4. Simulator scheme comprised of the fuzzy controller, neural network model of the process, PID controller, and specific growth rate equation.
Algorithms 14 00326 g004
Figure 5. Bioreactor set-up scheme.
Algorithms 14 00326 g005
Figure 6. Simulation results for DOC fuzzy control using the simulator. The dashed line represents previously controlled cultivation data using the decision tree, whereas the solid line represents the simulated process, controlled by the fuzzy controller. Dynamics of air (a) and oxygen (b) flow rates comparing both controllers, dissolved oxygen results during fuzzy control compared with the decision tree (c), and limits for comparing QairVar and QO2Var to appropriate range values (d) to analyze if maintaining, increasing, or decreasing the previous QairP and QO2P flow rates.
Algorithms 14 00326 g006
Figure 7. Robustness tests results for DOC fuzzy control using the simulator. The dashed line represents previously controlled cultivation data using the decision tree, whereas the solid line represents the simulated process, controlled by the fuzzy controller. Dynamics of air (a) and oxygen (b) flow rates comparing both controllers, DOC results during fuzzy control compared with the decision tree (c), and limits for comparing QairVar and QO2Var to appropriate range values (d) to analyze if maintaining, increasing, or decreasing the previous QairP and QO2P flow rates.
Algorithms 14 00326 g007
Figure 8. Initial E. coli cultivation tests results. Fuzzy controller was activated for almost two h during the cultivation. Dynamics of air (a) and oxygen (b) flow rates, dissolved oxygen behavior (c), and experimental adjustment in limits for QairVar and QO2Var (d) during the E. coli cultivation test.
Algorithms 14 00326 g008
Figure 9. QairIF linguistic values (Unsaturated, Saturated, and Supersaturated) and their respective membership functions, adjusted by ANFIS.
Algorithms 14 00326 g009
Figure 10. E. coli cultivation tests results. Fuzzy controller was activated around the 10th h. Cell mass, carbon source consumption and acetic acid production during the cultivation (a), dynamics of air (b) and oxygen (c) flow rates, dissolved oxygen behavior (d), and experimental adjustment in limits for QairVar and QO2Var (e) during the E. coli cultivation test.
Algorithms 14 00326 g010
Table 1. Rule table of Delta fuzzy system.
RuleAgitSpDOCOutput (Delta)
1LPLPF1
2LPMPF2
3LPHPF3
4HPLPF4
5HPMPF5
6HPHPF6
7VHPLPF7
8VHPMPF8
9VHPHPF9
Table 2. Output linear function parameters values from Delta fuzzy system fitted by ANFIS.
Functionabc
F1−4.23 × 10⁻⁴−1.40 × 10−20.25
F2−2.73 × 10−43.92 × 10−40.15
F34.20 × 10−51.54 × 10⁻²−0.89
F4−5.76 × 10−48.00 × 10−30.25
F56.24 × 10−41.71 × 10−20.93
F63.54 × 10−72.32 × 10⁻²−1.45
F70.87 × 10−45.17 × 10⁻⁴−0.34
F88.06 × 10−41.54 × 10⁻²−1.27
F91.65 × 10−42.08 × 10⁻²−1.43
Table 3. Results for the neural networks building phases (training, validation, and test). A16 dataset was used for fuzzy controller initial performance test, and A12 dataset was used for further robustness test.
DatasetPhaseDO_netCX_net
SamplesR 1SamplesR 1
A16Training2160.6836811.00
Validation470.597891.00
Testing470.667891.00
A12Training2900.7751600.98
Validation620.7211060.98
Testing620.6311060.98
1 Where R is the correlation coefficient between the neural network output and its target output value. R value close to 1 indicates total correspondence, whereas a R value close to 0 indicates random correlation.
Table 4. Rule table of Princ1 fuzzy system. Princ2 has the same input values, though with different linear output functions.
RuleAgitSpDOQairIFCXMiOutput
R1LPLPUNSATLPLPF1′
R2LPLPUNSATLPMPF2′
R3LPLPUNSATHPLPF3′
R106VHPHPSUPERSATLPMPF106′
R107VHPHPSUPERSATHPLPF107′
R108VHPHPSUPERSATHPMPF108′
Table 5. Output linear function parameters values from Princ1 fuzzy system fitted by ANFIS.
Functionabcdef
F1′5.39 × 10⁻⁴−5.23 × 10−42.70 × 10−61.37 × 10−52.29 × 10−73.33 × 10⁻⁷
F2′5.37 × 10−43.25 × 10−52.68 × 10−61.36 × 10−53.31 × 10−72.68 × 10−6
F3′5.37 × 10⁻⁴−1.61 × 10−62.36 × 10−61.37 × 10−53.32 × 10−72.68 × 10⁻⁶
F106′−1.72 × 10−32.48 × 10−2−1.67 × 10−61.97 × 10−4−8.36 × 10⁻⁷−1.74 × 10⁻⁶
F107′2.18 × 10⁻⁴−1.56 × 10−31.55 × 10−72.49 × 10−51.05 × 10−72.21 × 10⁻⁷
F108′9.69 × 10−59.37 × 10−58.00 × 10−81.05 × 10−54.67 × 10−89.79 × 10−8
Publisher’s Note: MDPI stays neutral with regard to jurisdictional claims in published maps and institutional affiliations.