
Using Decision Trees and Random Forest Algorithms to Predict and Determine Factors Contributing to First-Year University Students’ Learning Performance


Abstract
:1. Introduction
2. Literature Review
2.1. TheLearning Performance of First-Year Students
2.2. Decision Trees
2.3. Random Forests
2.4. Artificial Neural Networks
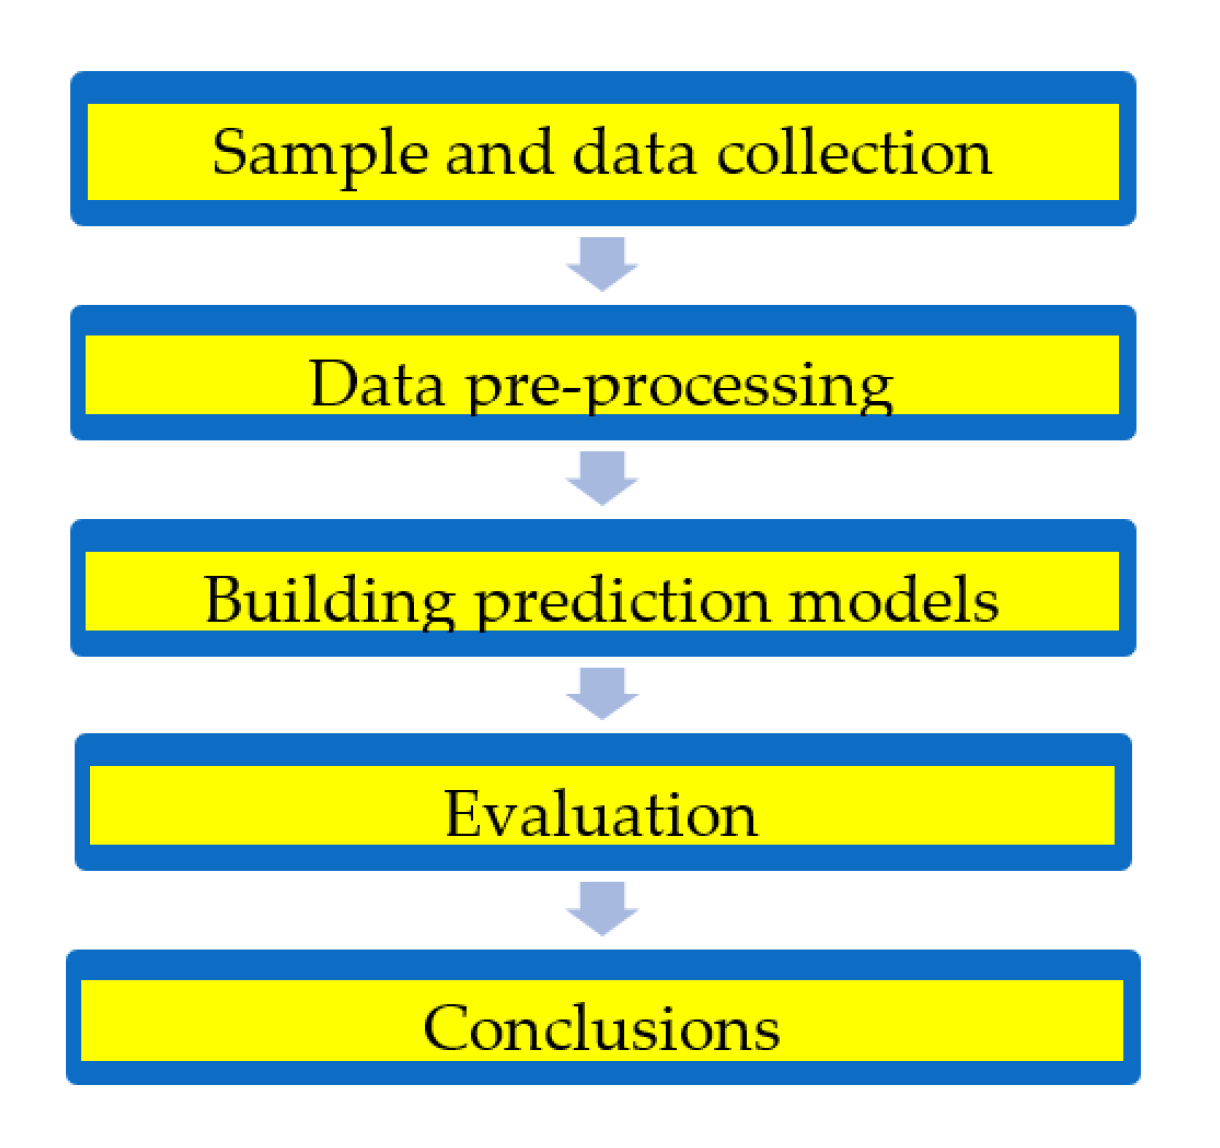
3. Methodology
3.1. Sample and Data Collection
3.2. Data Pre-Processing
3.3. Building Prediction Models
- Case 1 is the origin case for the output: Excellent, Very Good, Good, Average, and Poor class to measure the four models’ prediction performance originally and generally.
- Case 2 is to combine the majority output: Very Good, Good, Average classes into the Normal class to investigate whether the four models predict the minority or not.
- Case 3 is to focus only on the minority output: Excellent and Poor classes.
3.3.1. Decision Trees (DT)
- (1)
- Create training and testing data
- (2)
- Set decision tree parameters
- (3)
- Create an initial rule tree
- (4)
- Prune this tree
- (5)
- Process the pruned tree to improve its understandability
- (6)
- Pick a tree whose performance is the best among all constructed trees
- (7)
- Repeat steps 1–6 for 10 experiments
- (8)
- Take the mean values and standard deviation of the classification performance in 10 experiments for benchmarking.
- (1)
- Create training and testing data.
- (2)
- Set DT parameters.
- (3)
- Process the DT with training, testing, and cross validation for prediction accuracy.
- (4)
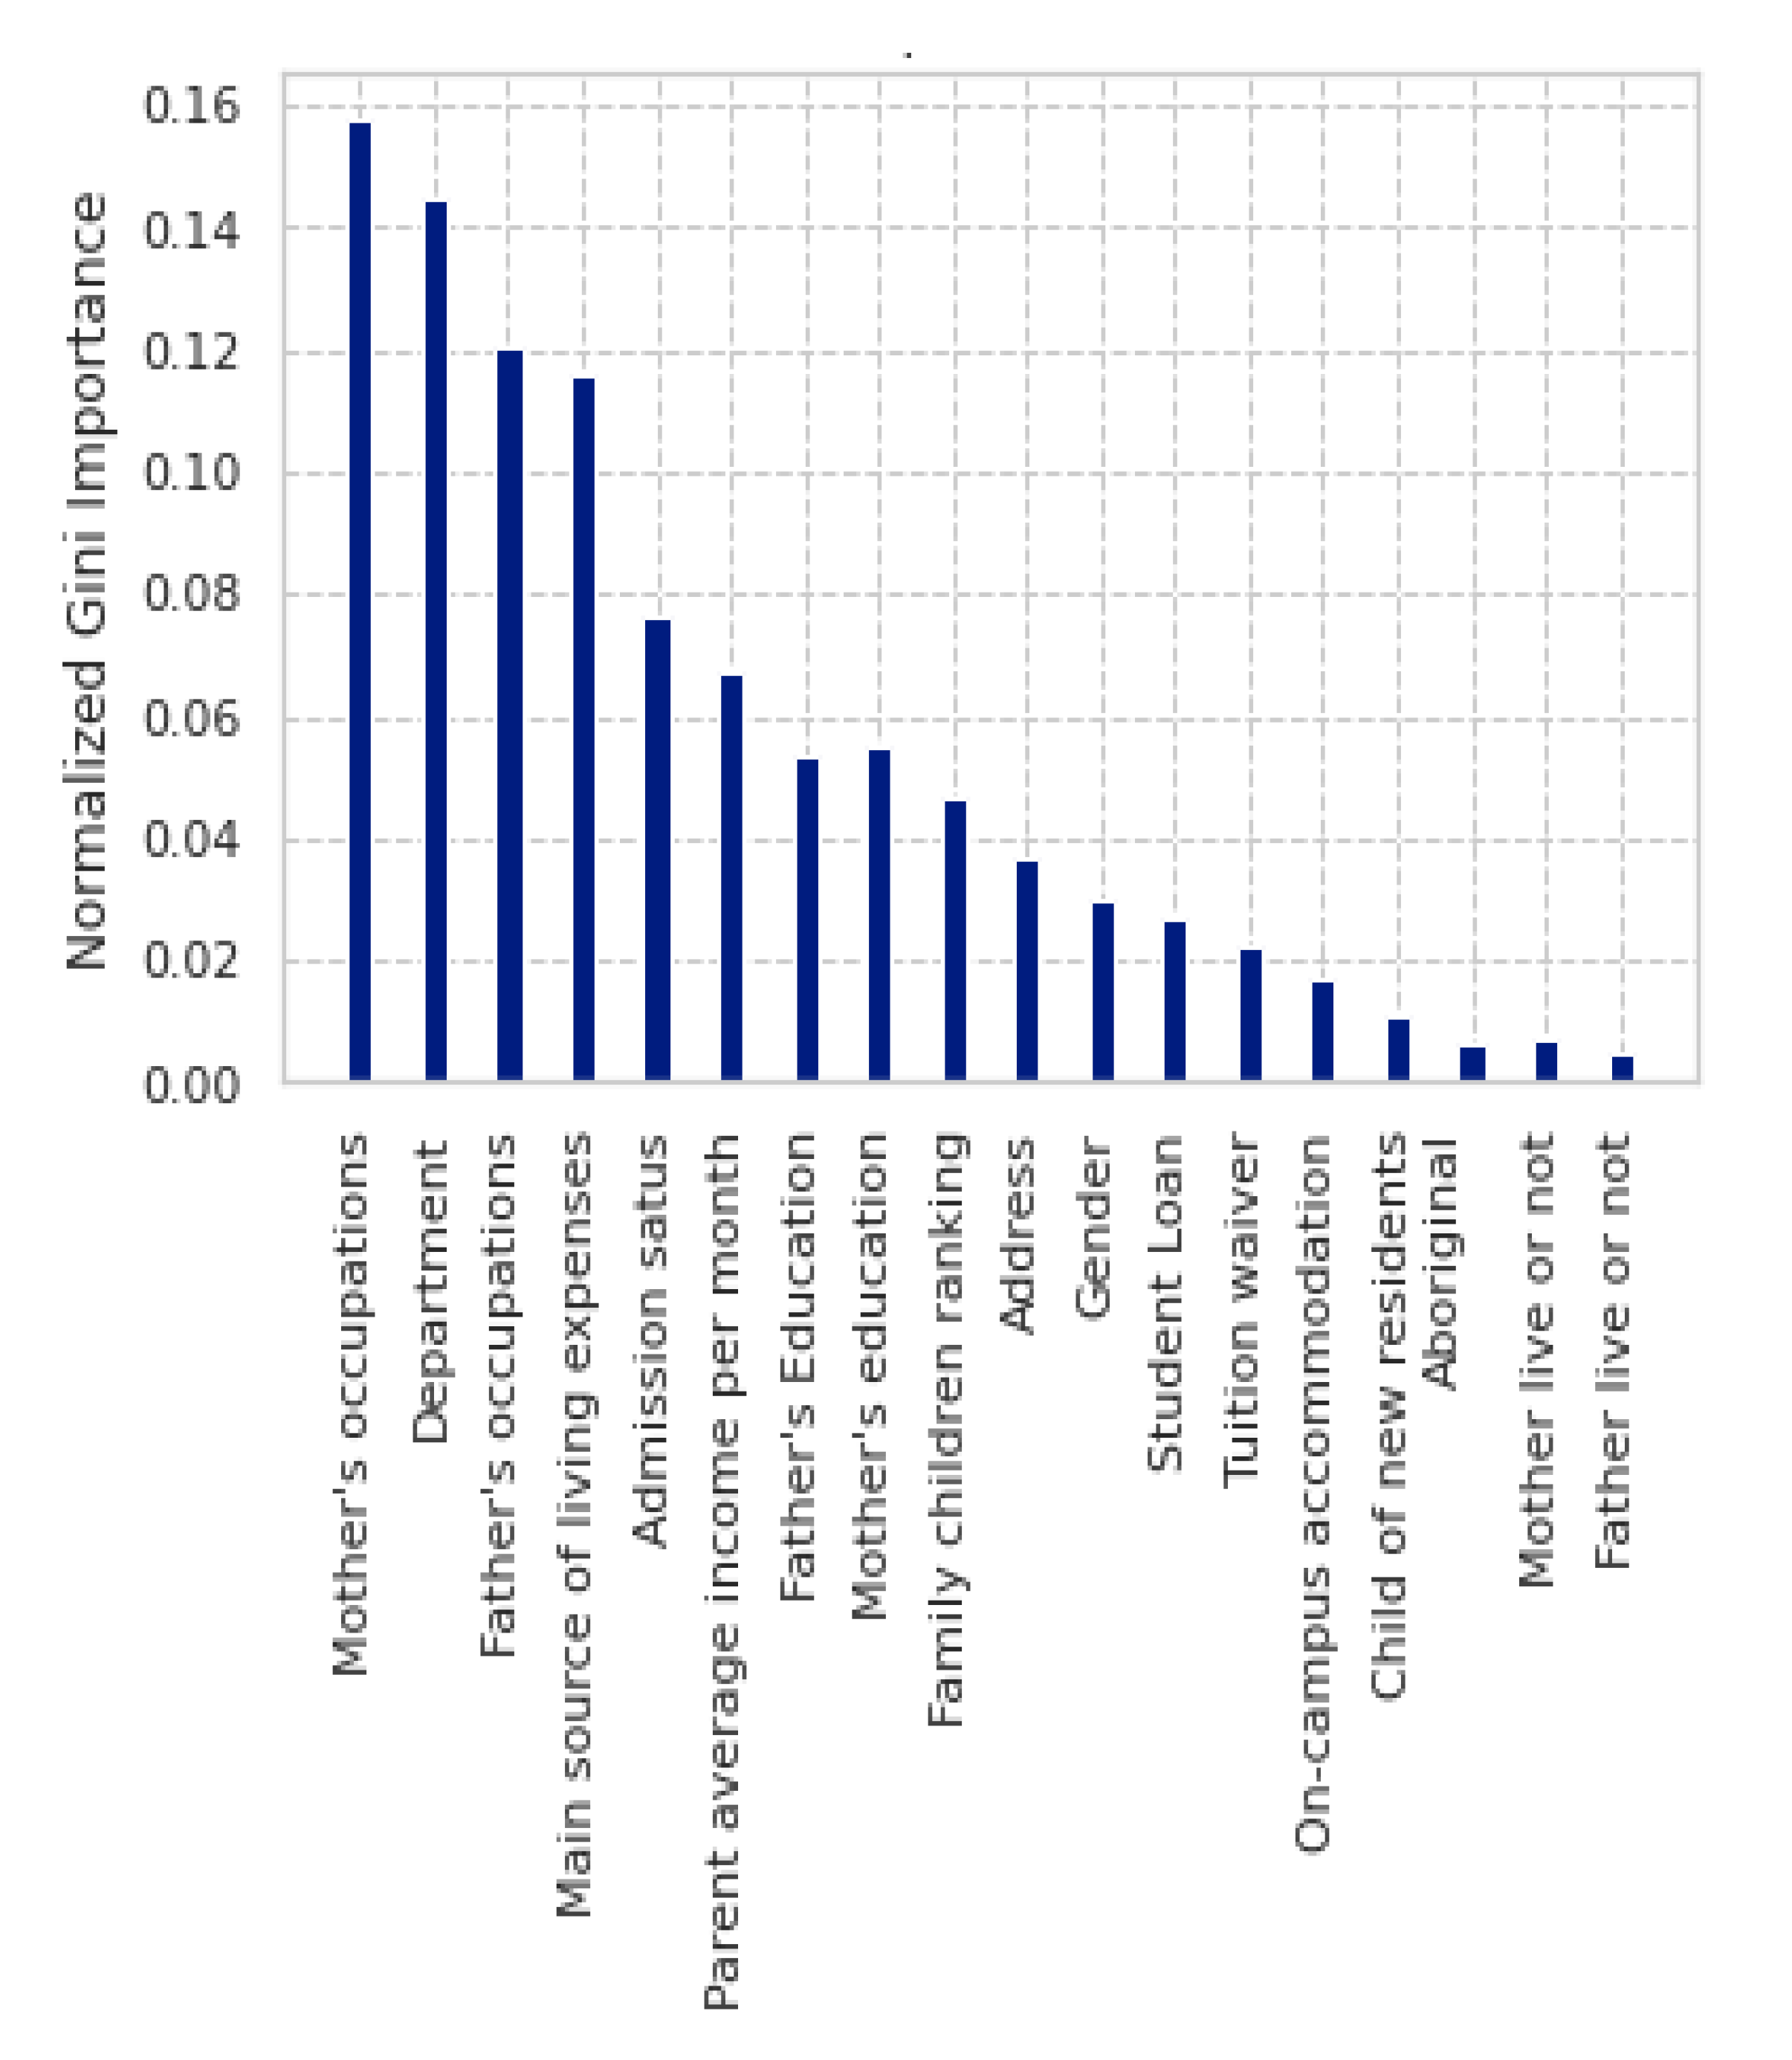
- Plot the Gini feature importance results.
- (5)
- Repeat steps 1–4 for 10 experiments.
- (6)
- Take the mean values and standard deviation of the classification performance in 10 experiments for benchmarking.
3.3.2. Random Forest (RF)
- (1)
- Create training and testing data.
- (2)
- Set random forest parameters.
- (3)
- Process the RF with training, testing, and cross validation for prediction accuracy.
- (4)
- Plot the Gini feature importance results.
- (5)
- Repeat steps 1–4 for 10 experiments.
- (6)
- Take the mean values and standard deviation of the classification performance in 10 experiments for benchmarking.
3.3.3. Multilayer Perceptron (MLP)
- (1)
- Set the initial weight and deviation value
- (2)
- Input training data and target data
- (3)
- Calculate the error between the expected output and the target
- (4)
- Adjust the weight and update the network weight
- (5)
- Repeat step (3)~step (4) until the end of learning or convergence.
4. Experimental Results
- Case 1: EX-VG-G-AVG-Poor (Excellent-Very Good-Good-Average-Poor) classification,
- Case 2: EX-Normal-Poor (Excellent-Normal-Poor) classification, and
- Case 3: Ex-Poor (Excellent-Poor) classification.
4.1. Data Preprocessing
4.2. Definition of the Input and Output Variables
4.3. Experiment Results
4.3.1. Results of Case 1 and Case 2
4.3.2. Results of Case 3
4.3.3. Results of Importance Feature Selection
4.4. Extracted Rules from Decision Trees
- Rule 1 shows that the on-the-job students are hardworking and have excellent academic performance.
- Rule 2 reports that if the main source of living expenses comes from family support, and the mother is a housewife who does not need to earn money for living can pay full attention to her children’s education, it is not surprising that such students will perform well in their studies.
- Rule 3 displays that when students of TF2 department live in the dormitory on campus, their academic performance will be excellent because the on-campus dormitory is mainly provided for economically disadvantaged students. Therefore, living in the dormitory inside the school is less expensive. Moreover, there is an unnecessary daily commute, students can fully use the on-campus library and other learning resources, thus the learning performance is naturally excellent. In the future, the accommodation for the TF2 department students should be arranged for the on-campus dormitory.
- Rule 4 points out that if students’ sources of living expenses come from their families, and the occupation of their mothers is as a government employee, they will have excellent academic performance.
- Rule 5 is also for specific departments. If students of TD5 department pay for student loans, their academic performance will be very good.
- Rule 6 points out that if the father’s occupation is a government employee, the students’ academic performance will be excellent.
- In Rule 7, if the source of living expense comes from scholarships and grants from inside and outside the school, students will perform very well.
- Regarding Rule 8, for female students, if the mother is a full-time housewife, they will perform well.
- Rule 9 also indicates that if the mother’s occupation is an educator, the student’s performance will also be very good.
- Compared with Rule 2, Rule 10 has a clear contrast for male students, if the mother is a housewife, the academic performance will be poor. This results from the patriarchal tradition of Taiwanese society. Housewife mothers spoil their sons, which can cause this phenomenon. Therefore, it is necessary to carry out stricter learning supervision for the male students before the senior years.
- Rule 11 is for the TD5 department. If students in that department do not have student loans, i.e., they have better family background, their academic performance will be quite poor. This can be inferred that if the rich families do not have strict requirements for their children’s education, their family member’s academic performance will be poor. In this case, more than 50% of the students, who paid for student loans, received government financial subsidies, and tuition reductions or exemptions over the years are consistent among Taiwanese private vocational universities. The students enrolled in TD5 also have low admission scores. Therefore, the university can provide intensive study guidance and strict schoolwork supervision for those students who are not doing well financially, in the departments with low admission scores.
- Rule 12 reflects the general situation of students in private vocational universities in Taiwan. If the source of living expenses is mainly from part-time jobs, then those students’ academic performance will also be poor. At this point, the government has launched a program of “purchasing working hours”, which allows economically disadvantaged students to invest in studies by paying work-study fees. They can get financial support and promote social class mobility as with doing part-time jobs.
- Rule 13 states that if a freshman is a transfer student, academic performance will be quite poor. Therefore, for the transfer students who enter the school in the first year, the student guidance system will help them integrate into class and establish contacts. After solving the possible problems, the school’s remedial teaching methods can be effective.
5. Discussion and Conclusions
Author Contributions
Funding
Institutional Review Board Statement
Acknowledgments
Conflicts of Interest
References
- Haskell, C.D. Institutional research as a bridge. High. Educ. Eval. Dev. 2017, 11, 2–11. [Google Scholar] [CrossRef] [Green Version]
- Iyer, N.C.; Gireesha, H.M.; Shet, R.M.; Nissimgoudar, P.; Mane, V. Autonomous Driving Platform: An Initiative under Institutional Research Project. Procedia Comput. Sci. 2020, 172, 875–880. [Google Scholar] [CrossRef]
- Cheng, T.M.; Hou, H.Y.; Agrawal, D.C.; Chen, L.S.; Chi, C.J. Factors affecting starting wages of master’s degree-graduates in Taiwan. J. Inst. Res. South East Asia 2020, 18, 136–154. [Google Scholar]
- Bai, S.; Hew, K.F.; Sailer, M.; Jia, C. From top to bottom: How positions on different types of leaderboard may affect fully online student learning performance, intrinsic motivation, and course engagement. Comput. Educ. 2021, 173, 104297. [Google Scholar] [CrossRef]
- Rivas, A.; González-Briones, A.; Hernández, G.; Prieto, J.; Pablo Chamoso, P. Artificial neural network analysis of the academic performance of students in virtual learning environments. Neurocomputing 2021, 423, 713–720. [Google Scholar] [CrossRef]
- Tarik, A.; Aissa, H.; Yousef, F. Artificial Intelligence and Machine Learning to Predict Student Performance during the COVID-19. Procedia Comput. Sci. 2021, 184, 835–840. [Google Scholar] [CrossRef]
- Rahman, S.R.; Islam, A.; Akash, P.P.; Parvin, M.; Moon, N.N.; Nur, F.N. Effects of co-curricular activities on student’s academic performance by machine learning. Curr. Res. Behav. Sci. 2021, 2, 100057. [Google Scholar] [CrossRef]
- Kanakana, G.; Olanrewaju, A. Predicting student performance in engineering education using an artificial neural network at Tshwane University of Technology. In Proceedings of the International Conference on Industrial Engineering, Systems Engineering and Engineering Management for Sustainable Global Development, Stellenbosch, South Africa, 21–23 September 2011; Volume 2123, p. 17. [Google Scholar]
- Arrieta, A.B.; Díaz-Rodríguez, N.; Del Ser, J.; Bennetot, A.; Tabik, S.; Barbado, A.; Garcia, S.; Gil-Lopez, S.; Molina, D.; Benjamins, R.; et al. Explainable Artificial Intelligence (XAI): Concepts, taxonomies, opportunities and challenges toward responsible AI. Inf. Fusion 2019, 58, 82–115. [Google Scholar] [CrossRef] [Green Version]
- Heidari, A.A.; Faris, H.; Mirjalili, S.; Aljarah, I.; Mafarja, M. Ant lion optimizer: Theory, literature review, and application in multi-layer perceptron neural networks. In Nature-Inspired Optimizers; Springer: Cham, Switzerland, 2020; pp. 23–46. [Google Scholar]
- van der Zanden, P.J.; Denessen, E.; Cillessen, A.H.; Meijer, P.C. Domains and predictors of first-year student success: A systematic review. Educ. Res. Rev. 2018, 23, 57–77. [Google Scholar] [CrossRef]
- Ayala, J.C.; Manzano, G. Academic performance of first-year university students: The influence of resilience and engagement. High. Educ. Res. Dev. 2018, 37, 1321–1335. [Google Scholar] [CrossRef]
- Baneres, D.; Rodriguez-Gonzalez, M.E.; Serra, M. An Early Feedback Prediction System for Learners At-Risk Within a First-Year Higher Education Course. IEEE Trans. Learn. Technol. 2019, 12, 249–263. [Google Scholar] [CrossRef]
- Beaulac, C.; Rosenthal, J.S. Predicting University Students’ Academic Success and Major Using Random Forests. Res. High. Educ. 2019, 60, 1048–1064. [Google Scholar] [CrossRef] [Green Version]
- Neumann, H.; Padden, N.; McDonough, K. Beyond English language proficiency scores: Understanding the academic performance of international undergraduate students during the first year of study. High. Educ. Res. Dev. 2018, 38, 324–338. [Google Scholar] [CrossRef]
- Ghosh, S.K.; Janan, F. Prediction of Student’s Performance Using Random Forest Classifier. In Proceedings of the 11th Annual International Conference on Industrial Engineering and Operations Management, Singapore, 7–11 March 2021. [Google Scholar]
- Abu Naser, S.; Zaqout, I.; Abu Ghosh, M.; Atallah, R.; Alajrami, E. Predicting Student Performance Using Artificial Neural Network: In the Faculty of Engineering and Information Technology. Int. J. Hybrid Inf. Technol. 2015, 8, 221–228. [Google Scholar] [CrossRef]
- Arsad, P.M.; Buniyamin, N. A neural network students’ performance prediction model (NNSPPM). In Proceedings of the 2013 IEEE International Conference on Smart Instrumentation, Measurement and Applications (ICSIMA), Kuala Lumpur, Malaysia, 25–27 November 2013; pp. 1–5. [Google Scholar]
- Bakare, C.G. Some psychological correlates of academic success and failure. AJER 1975, 2, 11–22. [Google Scholar]
- Oladokun, V.O.; Adebanjo, A.T.; Charles-Owaba, O.E. Predicting students’ academic performance using artificial neural network: A case study of an engineering course. Pac. J. Sci. Technol. 2008, 9, 72–79. [Google Scholar]
- Dynan, K.E.; Rouse, C.E. The underrepresentation of women in economics: A study of undergraduate economics students. J. Ecol. Educ. 1997, 28, 350–368. [Google Scholar] [CrossRef]
- Anderson, G.; Benjamin, D.; Fuss, M.A. The determinants of success in university introductory economics courses. J. Ecol. Educ. 1994, 25, 99–119. [Google Scholar] [CrossRef]
- Adedeji, O.B. A Study of the Relationship between Students Ume Results and Their Undergraduate Performance; Department Of Industrial and Production Engineering, University Of Ibadan: Ibadan, Nigeria, 2001; Unpublished work. [Google Scholar]
- Romero, C.; Ventura, S.; Espejo, P.; Hervás, C. Data mining algorithms to classify students. In Proceedings of the Educational Data Mining, Montréal, QC, Canada, 20–21 June 2008; pp. 20–21. [Google Scholar]
- Chhachhiya, D.; Sharma, A.; Gupta, M. Designing optimal architecture of neural network with particle swarm optimization techniques specifically for educational dataset. In Proceedings of the 2017 7th International Conference on Cloud Computing, Data Science & Engineering-Confluence, Noida, India, 12–13 January 2017; pp. 52–57. [Google Scholar] [CrossRef]
- Anderton, R.S. Identifying factors that contribute to academic success in first year allied health and science degrees at an Australian University. Aust. J. Educ. 2017, 61, 184–199. [Google Scholar] [CrossRef]
- Chen, M.-Y.; Chang, J.-R.; Chen, L.-S.; Shen, E.-L. The key successful factors of video and mobile game crowdfunding projects using a lexicon-based feature selection approach. J. Ambient. Intell. Humaniz. Comput. 2021, 1–19. [Google Scholar] [CrossRef]
- Kabakchieva, D. Student performance prediction by using data mining classification algorithms. J. Comput. Sci. Manag. Res. 2012, 1, 686–690. [Google Scholar]
- Zhu, W.; Zeng, X. Decision Tree-Based Adaptive Reconfigurable Cache Scheme. Algorithms 2021, 14, 176. [Google Scholar] [CrossRef]
- Wang, C.; Bi, J.; Sai, Q.; Yuan, Z. Analysis and Prediction of Carsharing Demand Based on Data Mining Methods. Algorithms 2021, 14, 179. [Google Scholar] [CrossRef]
- Wijenayake, S.; Graham, T.; Christen, P. A Decision Tree Approach to Predicting Recidivism in Domestic Violence. In Pacific-Asia Conference on Knowledge Discovery and Data Mining; Springer: Cham, Switzerland, 2018; pp. 3–15. [Google Scholar] [CrossRef] [Green Version]
- Roy, A.G.; Urolagin, S. Credit risk assessment using decision tree and support vector machine based data analytics. Creative Business and Social Innovations for a Sustainable Future. In Proceedings of the 1st American University in the Emirates International Research Conference, Dubai, United Arab Emirates, 15–16 November 2017; pp. 79–84. [Google Scholar]
- Wang, X.; Zhou, C.; Xu, X. Application of C4.5 decision tree for scholarship evaluations. Procedia Comput. Sci. 2019, 151, 179–184. [Google Scholar] [CrossRef]
- Hamoud, A.K.; Hashim, A.S.; Awadh, W.A. Predicting Student Performance in Higher Education Institutions Using Decision Tree Analysis. Int. J. Interact. Multimedia Artif. Intell. 2018, 5, 26. [Google Scholar] [CrossRef] [Green Version]
- Al-Hoqani, W.M.A.; Regula, T. A semi automated assessment and marking approach of decision tree diagram. Mater. Today Proc. 2021, in press. [Google Scholar] [CrossRef]
- Villavicencio, C.; Macrohon, J.; Inbaraj, X.; Jeng, J.-H.; Hsieh, J.-G. COVID-19 Prediction Applying Supervised Machine Learning Algorithms with Comparative Analysis Using WEKA. Algorithms 2021, 14, 201. [Google Scholar] [CrossRef]
- Chang, J.-R.; Chen, M.-Y.; Chen, L.-S.; Chien, W.-T. Recognizing important factors of influencing trust in O2O models: An example of OpenTable. Soft Comput. 2019, 24, 7907–7923. [Google Scholar] [CrossRef]
- Duke, C.R. Learning Outcomes: Comparing Student Perceptions of Skill Level and Importance. J. Mark. Educ. 2002, 24, 203–217. [Google Scholar] [CrossRef]
- Breiman, L. Random forests. Mach. Learn. 2001, 45, 5–32. [Google Scholar] [CrossRef] [Green Version]
- Abubakar, Y.; Ahmad, N.B.H. Prediction of students’ performance in e-learning environment using random forest. IJIC 2017, 7. [Google Scholar] [CrossRef]
- Chen, S.-H.; Pai, F.-Y.; Yeh, T.-M. Using the Importance–Satisfaction Model and Service Quality Performance Matrix to Improve Long-Term Care Service Quality in Taiwan. Appl. Sci. 2019, 10, 85. [Google Scholar] [CrossRef] [Green Version]
- Chen, W.-K.; Chen, L.-S.; Pan, Y.-T. A text mining-based framework to discover the important factors in text reviews for predicting the views of live streaming. Appl. Soft Comput. 2021, 111, 107704. [Google Scholar] [CrossRef]
- Tsai, S.-C.; Chen, C.-H.; Shiao, Y.-T.; Ciou, J.-S.; Wu, T.-N. Precision education with statistical learning and deep learning: A case study in Taiwan. Int. J. Educ. Technol. High. Educ. 2020, 17, 12. [Google Scholar] [CrossRef]
- Nasser, I.M.; Al-Shawwa, M.O.; Abu-Naser, S.S. Developing Artificial Neural Network for Predicting Mobile Phone Price Range. Int. J. Acad. Inf. Syst. Res. 2019, 3, 1–6. [Google Scholar]
- Chang, J.-R.; Chen, M.-Y.; Chen, L.-S.; Tseng, S.-C. Why Customers Don’t Revisit in Tourism and Hospitality Industry? IEEE Access 2019, 7, 146588–146606. [Google Scholar] [CrossRef]
- Bosch, E.; Seifried, E.; Spinath, B. What successful students do: Evidence-based learning activities matter for students’ performance in higher education beyond prior knowledge, motivation, and prior achievement. Learn. Individ. Differ. 2021, 91, 102056. [Google Scholar] [CrossRef]
- Osmanbegovic, E.; Suljic, M. Data mining approach for predicting student performance. Econo. Rev. J. Econo. Busin 2012, 10, 3–12. [Google Scholar]
- Kim, B.H.; Vizitei, E.; Ganapathi, V. GritNet: Student performance prediction with deep learning. arXiv 2018, arXiv:1804.07405. [Google Scholar]
- Dharmasaroja, P.; Kingkaew, N. Application of artificial neural networks for prediction of learning performances. In Proceedings of the 12th International Conference on Natural Computation, Fuzzy Systems and Knowledge Discovery (ICNC-FSKD), Changsha, China, 13–15 August 2016; pp. 745–751. [Google Scholar] [CrossRef]
- Sivasakthi, M. Classification and prediction based data mining algorithms to predict students’ introductory programming performance. In Proceedings of the 2017 International Conference on Inventive Computing and Informatics (ICICI), Coimbatore, India, 23–24 November 2017; pp. 346–350. [Google Scholar] [CrossRef]


| Case No. | Transferred Number | Output Variable | Average Score | Distribution/Classification |
|---|---|---|---|---|
| Case 1: Origin | 5 | Excellent (EX) | 90–100 points | Origin case: EX-VG-G-AVG-Poor classification |
| 4 | Very Good (VG) | 80–89 points | ||
| 3 | Good (G) | 70–79 points | ||
| 2 | Average (AVG) | 50–69 points | ||
| 1 | Poor | 0–49 points | ||
| Case 2: Combination of majority | 3 | Excellent | 90–100 points | Combination of majority: EX-Normal-Poor classification |
| 2 | Normal | 50–89 points | ||
| 1 | Poor | 0–49 points | ||
| Case 3: Focus on minority | 2 | Excellent | 90–100 points | Focus on minority: EX-Poor classification |
| 1 | Poor | 0–49 points |
| No. | Feature Name | Feature Description | No. | Feature Name | Feature Description |
|---|---|---|---|---|---|
| 1 | Department | Students’ majored department | 10 | Main source of living expenses | Students’ living expenses support |
| 2 | Gender | Students’ sex | 11 | Student loan | Students borrow money in- and out- school or from friends/relatives |
| 3 | Address | Students’ home address type | 12 | Tuition waiver | Free or reduce tuition fee |
| 4 | Admission status | School admission offered to student | 13 | Father live with or not | Students’ father lives in the family or separates with their mother |
| 5 | Aboriginal | Students’ origin | 14 | Father’s occupation | Careers of students’ father |
| 6 | Child of new residents | Immigration status of students’ family | 15 | Father’s education | Father’s highest education status |
| 7 | Family children ranking | Student’s born time in the family | 16 | Mother live with or not | Students’ mother lives in the family or separates with their father |
| 8 | Parent average income per month | The average income of student’s parents in each month | 17 | Mother’s occupations | Careers of students’ father |
| 9 | On-campus accommodation | Students live in- or out of the school. | 18 | Mother’s education | Mother’s highest education status |
| Experiment No. | Case 1: Origin | Case 2: Combination of Majority | ||||||
|---|---|---|---|---|---|---|---|---|
| EX-VG-G-AVG-Poor Classification | EX-Normal-Poor Classification | |||||||
| CART (%) | C5.0 (%) | RF (%) | MLP (%) | CART (%) | C5.0 (%) | RF (%) | MLP (%) | |
| 1 | 51.86 | 47.80 | 52.69 | 42.32 | 87.75 | 91.60 | 89.62 | 90.66 |
| 2 | 51.24 | 47.30 | 51.86 | 39.83 | 86.92 | 91.60 | 89.62 | 90.66 |
| 3 | 50.62 | 47.90 | 52.48 | 41.28 | 87.34 | 91.60 | 89.62 | 90.66 |
| 4 | 50.82 | 47.20 | 52.28 | 40.87 | 87.55 | 91.60 | 89.62 | 90.66 |
| 5 | 51.45 | 49.10 | 53.73 | 43.15 | 87.13 | 91.60 | 89.62 | 90.66 |
| 6 | 52.28 | 46.20 | 52.28 | 40.66 | 88.17 | 91.60 | 89.62 | 87.75 |
| 7 | 52.07 | 49.10 | 52.69 | 41.70 | 88.17 | 91.60 | 89.62 | 90.24 |
| 8 | 51.86 | 47.90 | 52.07 | 41.28 | 88.38 | 91.60 | 89.62 | 90.04 |
| 9 | 50.82 | 47.30 | 53.11 | 45.58 | 86.92 | 91.60 | 89.62 | 88.58 |
| 10 | 52.07 | 48.60 | 52.28 | 40.04 | 87.75 | 91.60 | 89.62 | 89.21 |
| Mean | 51.51 | 47.84 | 52.55 | 41.67 | 87.61 | 91.60 | 89.62 | 89.91 |
| Standard Deviation | 0.60 | 0.91 | 0.55 | 1.70 | 0.53 | 0.00 | 0.00 | 1.05 |
| Predicted | EX | Normal | Poor | |
|---|---|---|---|---|
| Actual | ||||
| EX | 0 | 93 | 0 | |
| Normal | 0 | 2206 | 0 | |
| Poor | 0 | 108 | 0 | |
| Experiment No. | Case 3: Focus on Minority | |||
|---|---|---|---|---|
| EX-Poor Classification | ||||
| CART (%) | C5.0 (%) | RF (%) | MLP (%) | |
| 1 | 80.04 | 75.20 | 82.92 | 73.17 |
| 2 | 80.04 | 74.60 | 73.17 | 60.97 |
| 3 | 80.48 | 74.10 | 75.60 | 63.41 |
| 4 | 78.04 | 74.60 | 80.48 | 60.97 |
| 5 | 80.48 | 74.10 | 82.92 | 63.41 |
| 6 | 78.04 | 72.70 | 82.92 | 65.85 |
| 7 | 80.48 | 72.70 | 82.92 | 82.92 |
| 8 | 81.48 | 75.20 | 82.92 | 73.17 |
| 9 | 82.92 | 76.60 | 80.48 | 70.73 |
| 10 | 78.04 | 76.10 | 75.60 | 75.60 |
| Mean | 80.00 | 74.59 | 79.99 | 69.02 |
| Standard Deviation | 1.60 | 1.28 | 3.78 | 7.28 |
| Source | DF | Adj SS | Adj MS | F-Value | p-Value |
|---|---|---|---|---|---|
| Factor | 3 | 826.5 | 275.49 | 15.43 | 0.000 |
| Error | 36 | 642.6 | 17.85 | ||
| Total | 39 | 1469.0 |
| No. | Hypothesis | p-Value | Conclusion |
|---|---|---|---|
| H1 | 0.497 | Accept H0 | |
| H2 | 0.993 | Accept H0 | |
| H3 | 0.000 | Reject H0 | |
| H4 | 0.001 | Reject H0 | |
| H5 | 0.001 | Reject H0 | |
| H6 | 0.000 | Reject H0 |
| Predicted | EX | Poor | |
|---|---|---|---|
| Actual | |||
| EX | 61 | 32 | |
| Poor | 18 | 90 | |
| Algorithm | Case 1: EX-VG-G-AVG-Poor Classification | Case 2: EX-Normal-Poor Classification | Case 3: EX- Poor Classification |
|---|---|---|---|
| C5.0 | Father’s occupation Mother’s occupation Department Admission status Main source of living expenses | X | Mother’s occupations Main source of living expenses Admission status Department Family children ranking |
| CART | Father’s occupation Mother’s occupation Department Parent average income per month Fathers’ education | Father’s occupation Mother’s occupation Department Parent average income per month Main source of living expenses | Mother’s occupation Department Fathers’ occupation Main source of living expenses Admission status |
| RF | Father’s occupation Mother’s occupation Department Parent average income per month Fathers’ education | Father’s occupation Mother’s occupation Department Parent average income per month Main source of living expenses | Mother’s occupation Department Main source of living expenses Fathers’ occupation Admission status |
| No. | Rules |
|---|---|
| 1 | IF Admission status = On-the-job student THEN Learning performance = Excellent [0.909] |
| 2 | IF Main source of living expenses = Family provided AND Mother’s occupations = Housewife THEN Learning performance = Excellent [0.900] |
| 3 | IF On-campus accommodation = Yes AND Department = TF2 THEN Learning performance = Excellent [0.857] |
| 4 | IF Main source of living expenses = Family provided AND Mother’s occupations = Government employees THEN Learning performance= Excellent [0.850] |
| 5 | IF Student Loan = Yes AND Department = TD5 THEN Learning performance= Excellent [0.833] |
| 6 | IF Father’s occupations = Government employees THEN Learning performance = Excellent [0.800] |
| 7 | IF Main source of living expenses = Scholarships and grants inside and outside the school THEN Learning performance = Excellent [0.800] |
| 8 | IF Gender = Female AND Mother’s occupations = Housewife THEN Learning performance = Excellent [0.769] |
| 9 | IF Mother’s occupations = Education THEN Learning performance = Excellent [0.750] |
| 10 | IF Gender = Male AND Mother’s occupations = Housewife THEN Learning performance = Poor [0.889] |
| 11 | IF Student Loan = No AND Department = TD5 THEN Learning performance = Poor [0.857] |
| 12 | IF Main source of living expenses = Income from part-time job THEN Learning performance = Poor [0.850] |
| 13 | IF Admission status = Transfer student THEN Learning performance = Poor [0.800] |
Publisher’s Note: MDPI stays neutral with regard to jurisdictional claims in published maps and institutional affiliations. |
© 2021 by the authors. Licensee MDPI, Basel, Switzerland. This article is an open access article distributed under the terms and conditions of the Creative Commons Attribution (CC BY) license (https://creativecommons.org/licenses/by/4.0/).
Share and Cite
Huynh-Cam, T.-T.; Chen, L.-S.; Le, H. Using Decision Trees and Random Forest Algorithms to Predict and Determine Factors Contributing to First-Year University Students’ Learning Performance. Algorithms 2021, 14, 318. https://doi.org/10.3390/a14110318
Huynh-Cam T-T, Chen L-S, Le H. Using Decision Trees and Random Forest Algorithms to Predict and Determine Factors Contributing to First-Year University Students’ Learning Performance. Algorithms. 2021; 14(11):318. https://doi.org/10.3390/a14110318
Chicago/Turabian StyleHuynh-Cam, Thao-Trang, Long-Sheng Chen, and Huynh Le. 2021. "Using Decision Trees and Random Forest Algorithms to Predict and Determine Factors Contributing to First-Year University Students’ Learning Performance" Algorithms 14, no. 11: 318. https://doi.org/10.3390/a14110318
APA StyleHuynh-Cam, T.-T., Chen, L.-S., & Le, H. (2021). Using Decision Trees and Random Forest Algorithms to Predict and Determine Factors Contributing to First-Year University Students’ Learning Performance. Algorithms, 14(11), 318. https://doi.org/10.3390/a14110318