1. Introduction
Our society’s consumption of electrical energy is increasing worldwide. To help satisfy this demand, every year a big quantity of energy from non-renewable sources limited and harmful to the environment is generated [
1]. In Europe, the building sector has the most energy demand spending around 70% of the total demand [
2], making energy efficiency and renewable energy generation in buildings a hot topic.
The energy efficiency subject has been tackled by building energy standards, namely nZEBs (nearly Zero Energy Buildings), with the requirements for nZEBs in Europe being defined locally [
3] and also by associations such as Passivhaus [
4] and ASHRAE (American Society of Heating, Refrigeration and Air Conditioning Engineers) [
5], that develop guidelines and legislation in order to create more efficient buildings with adequate building envelope, that makes use of solar energy passively and to impose that the equipment installed is more energy efficient. With the energy efficiency in mind, renewable energy generation has been a target of research and development, namely the technologies related solar, wind, geothermal bio fuels and hydro power (mini hydro for local generation), which have the advantage of being clean and sustainable to the environment [
6]. Out of the many renewable sources, solar has attracted great attention, not only because of solar thermal technology for domestic hot water (primary use) and water heating, but also for electrical energy generation with the photovoltaic (PV) panels [
7]. However, due to the low energy efficiency of the PV panels (not higher than 23% [
8,
9]) and high installation costs [
10], much of the research centers around improving these points [
6].
The maximum power point tracking (MPPT) is one of the technologies studied in order to help improve the low energy efficiency of the PV panels, its main objective is to maximize the power generated by the PV system in continuously changing environment conditions. The PV characteristic are nonlinear and weather dependent, namely solar irradiation and temperature. Both in the I-V and P-V curves of a PV panel, there is a unique point for each set of environment conditions called the maximum power point (MPP), in which the generated power is maximized. Many researchers have studied different MPPT techniques to achieve the MPP, each with different efficiency values, complexities, speeds, costs and range of effectiveness [
11].
The most commonly used MPPT algorithm in commercial products is the Perturb and Observe (P&O), because it is easy to implement and enables a very high energy conversion [
12]. In this algorithm at a time “n” the power is measured and compared to the measured power in the previous measurement, if the power is increased the duty cycle will be affected so that the power continues to be increased in the same direction until MPP is reached, otherwise it is moving away from the MPP and the duty cycle will be affected in the opposite direction, unless it is equal and if it happens it is not changed. The Incremental Conductance is the most popular alternative and even offers lower oscillations at MPP, however it is more computationally intensive [
13]. This algorithm is based on the knowledge of the value of the incremental conductance
and its increment to reach the MPP, if the increment is greater than
the duty cycle is reduced, if the opposite is true the duty cycle is increased, if the increment isn’t changed the duty cycle remains the same. Due to their fixed step size there is a trade between steady state and dynamic weather conditions, a large step size leads to a faster response to changing environment conditions but bigger oscillations in the steady state, while low step size enables lower oscillations in steady state conditions but slower response to changing environment conditions. Another very documented drawback of this method is the multiple maxima, that occurs when they are partially shaded and multiple MPP are detected [
14].
Recently artificial intelligence (AI) techniques have been used to improve the efficiency of traditional methods, such as the P&O [
15]. These algorithms not only have a better energy performance [
16], they can also help to minimize the problems of the traditional algorithms such as the P&O and the Incremental Conductance, namely the multiple maxima when the panels are partially shaded [
17], the inaccurate responses when irradiation is suddenly increased [
18] or the overall performance in changing environment conditions [
19]. Since the relationship between the generated power of the PV panels and their output voltage is non-linear, fuzzy logic and artificial neural networks are suitable algorithms for the solution of the MPPT in PV panels [
20]. The fuzzy logic can be used together with traditional controllers such as the PID, for MPPT control resulting in a hybrid controller that combines the advantages of both methodologies [
21]. It can also be used to improve the performance of typical MPPT techniques, such as the Incremental Conductance [
22] and P&O [
13]. The fuzzy logic algorithms, can be used to improve the performance of artificial neural networks for the MPPT problem and can also be enhanced by other AI based solutions, such as genetic algorithms and particle swarm optimization [
23].
The fuzzy logic based MPPT control techniques enable an adaptative step size, allowing better performance and solving the main problems of the traditional methods, namely the multiple maxima and the trade off between the performance in steady state and dynamic environment conditions, improving the performance of the solar system in both conditions. In this work the main objective will be to study a fuzzy logic controller (FLC), with the error function based on the rules of which the P&O adjusts its duty cycle in accordance to a defined fuzzy rule set. In particular its performance will be compared to the traditional P&O under changing environment conditions (namely the solar irradiation, the ambient temperature or both), by how fast it adjusts and reaches the MPP and the oscillations steady state conditions.
The remainder of this paper is organized as follows: in
Section 2 a description is made of the system implemented in Matlab/Simulink; in
Section 3 both the more traditional P&O MPPT algorithm and the fuzzy logic enhanced P&O MPPT algorithm, are described and how they will impact the control of the PV system;
Section 4 briefs the results and discussions obtained for both methodologies and finally in
Section 5 the conclusions are presented.
2. System Description
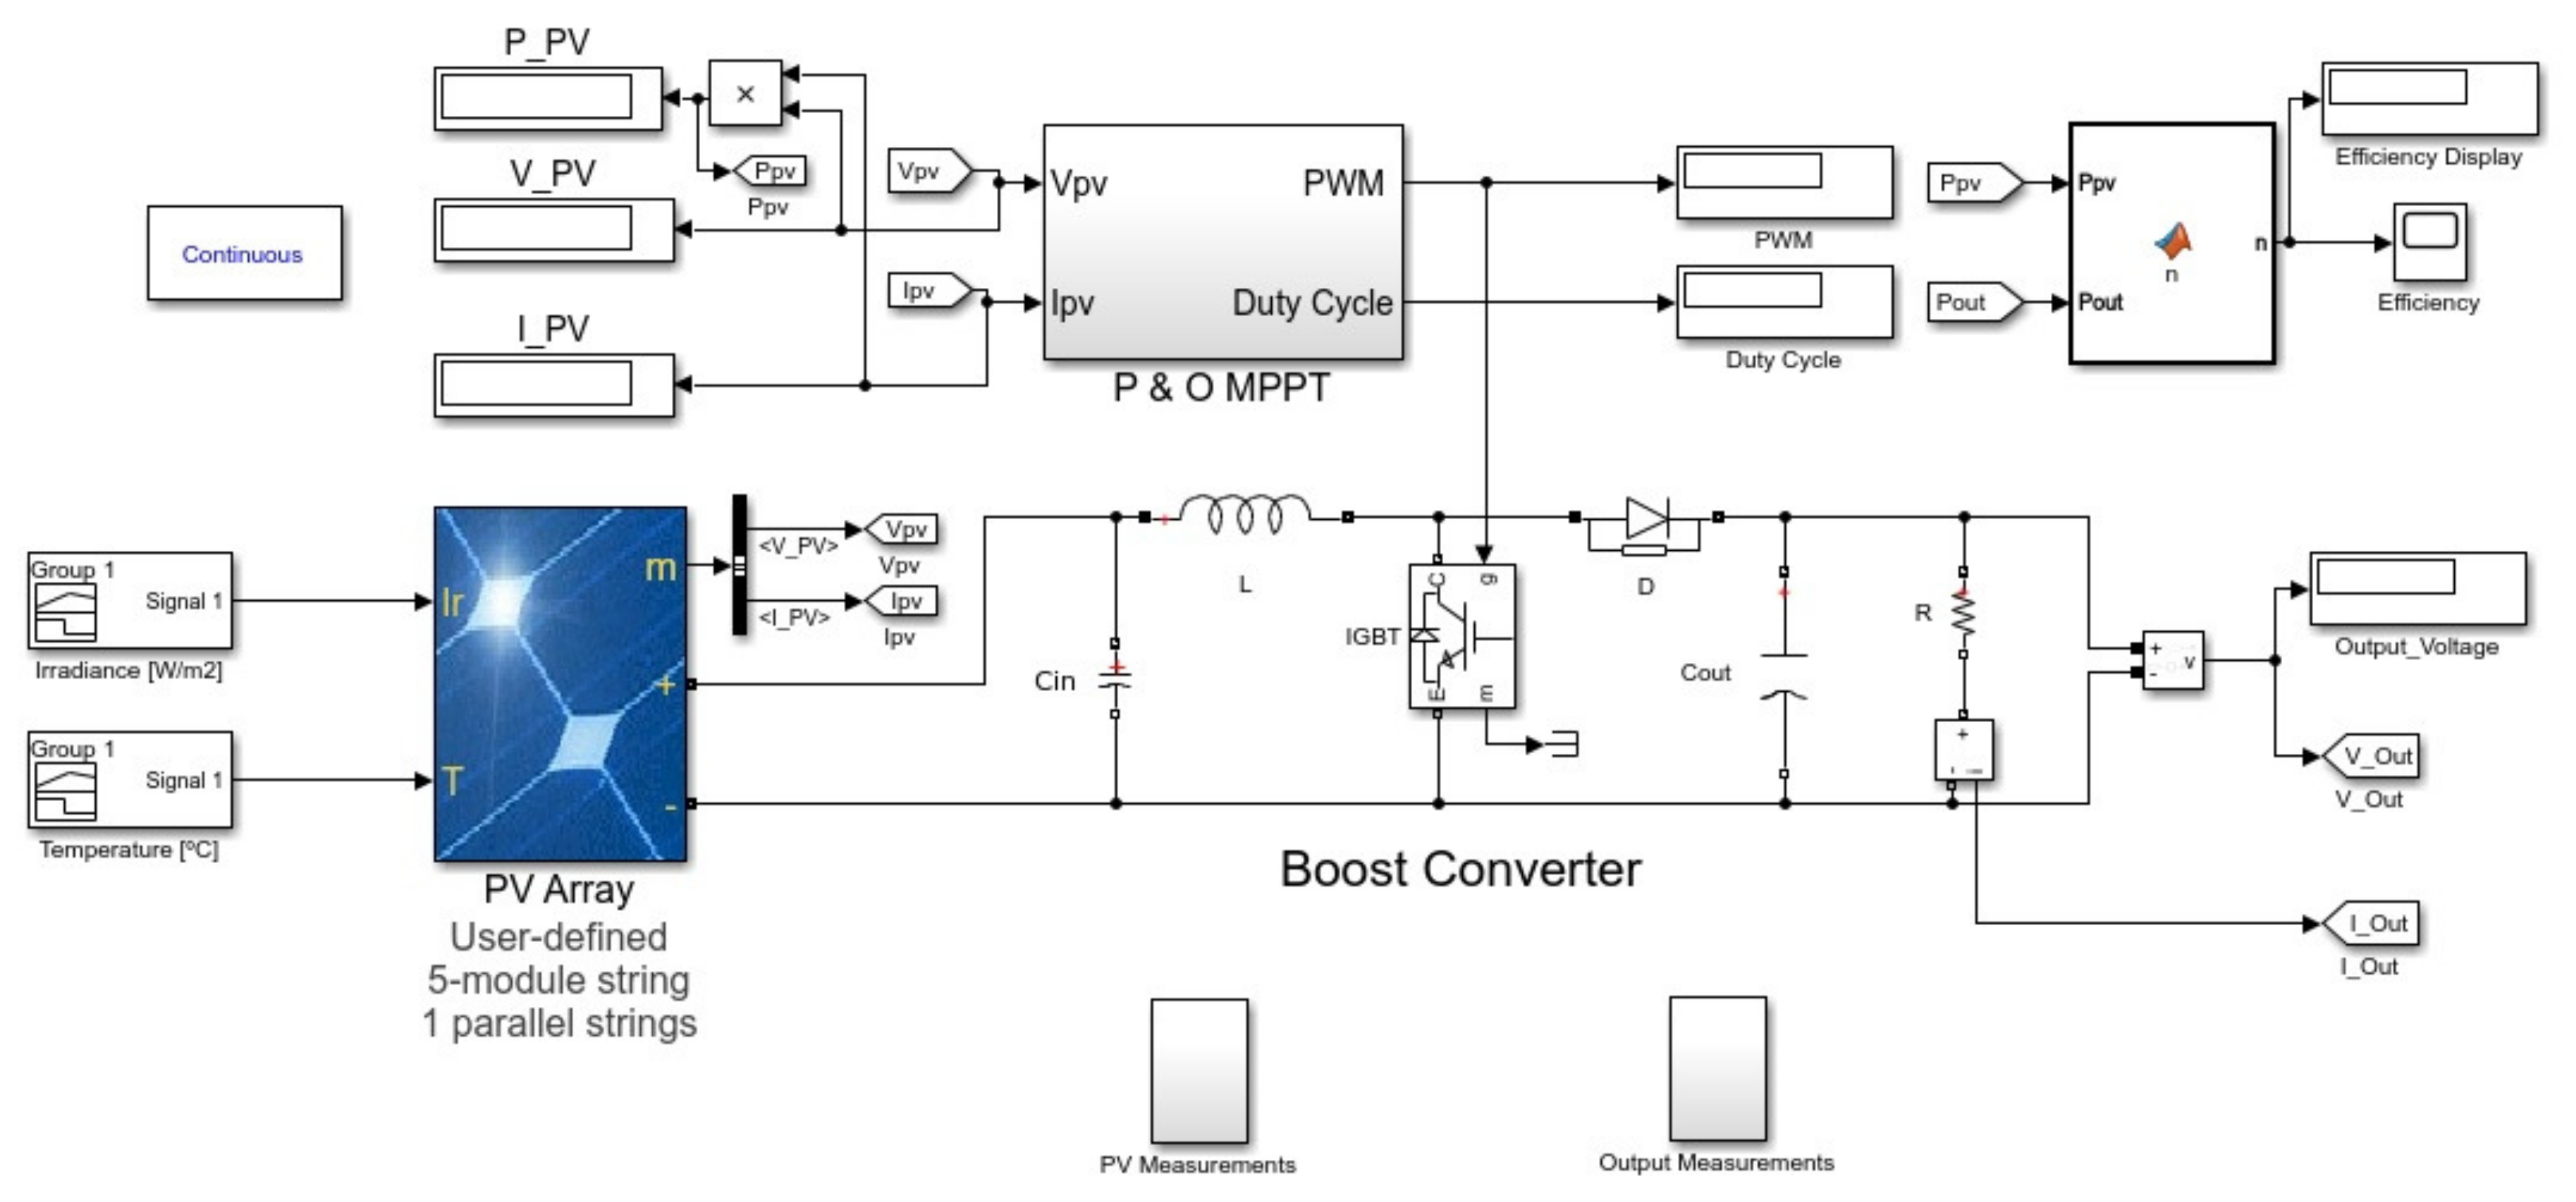
The dynamic simulation of the PV system, was carried out using the Simulink model presented in
Figure 1.
The block P&O MPPT contains the P&O algorithm in a function and a limiter block that limits the duty cycle to values between 0.2 and 0.7, which enables a better control of the boost converter gains. The solar panel model used was developed by NREL (National Renewable Energy Laboratory), and is available in the Simulink library.
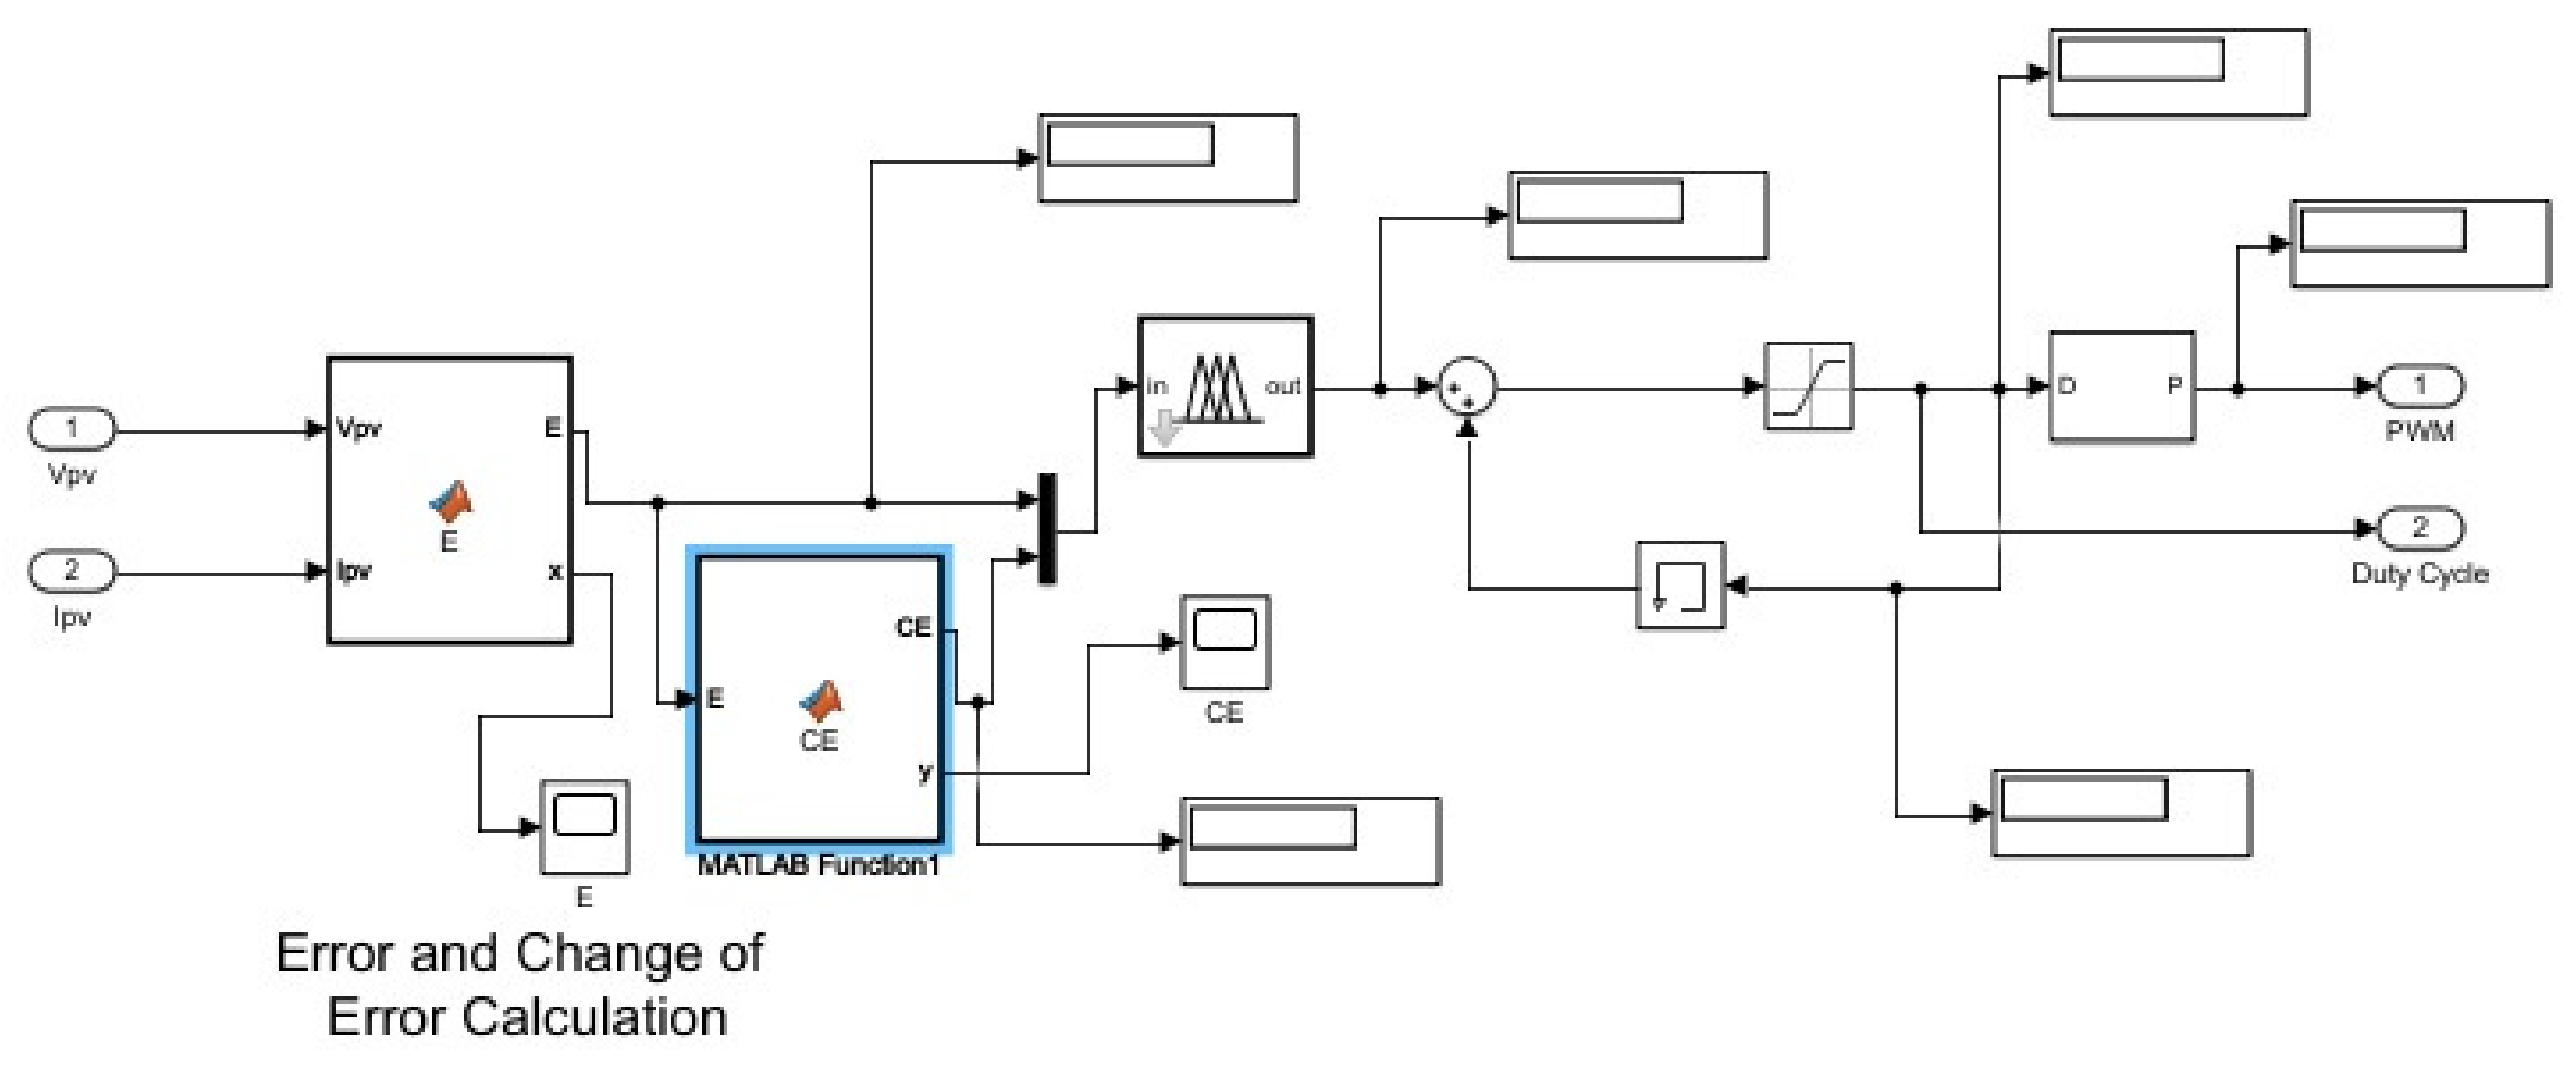
The Simulink model for the fuzzy logic enhanced P&O MPPT controller contains instead a block named Fuzzy MPPT, which is presented in
Figure 2.
This block contains two functions, one of them calculates the error and the other calculates the change of error between iterations. Like the model for the P&O MPPT controller, it also contains a limiter block that limits the duty cycle to values between 0.2 and 0.7.
The PV Array block, contains information regarding 5 solar PV panels connected in series. The PV panel used was the monocrystaline 315
solar PV panel, commercialized in Portugal by Zantia [
24]. The total number of PV panels in the simulation is half of the total dimensioned PV system, which was projected for a small office building (with a medium occupancy of four people) with three phase power, in order to produce and consume more than 50% of the building’s energy consumption without batteries, due to the fact that the chosen inverter [
25] contains two boost converters. The most important parameters of the selected PV panel, are listed in
Table 1.
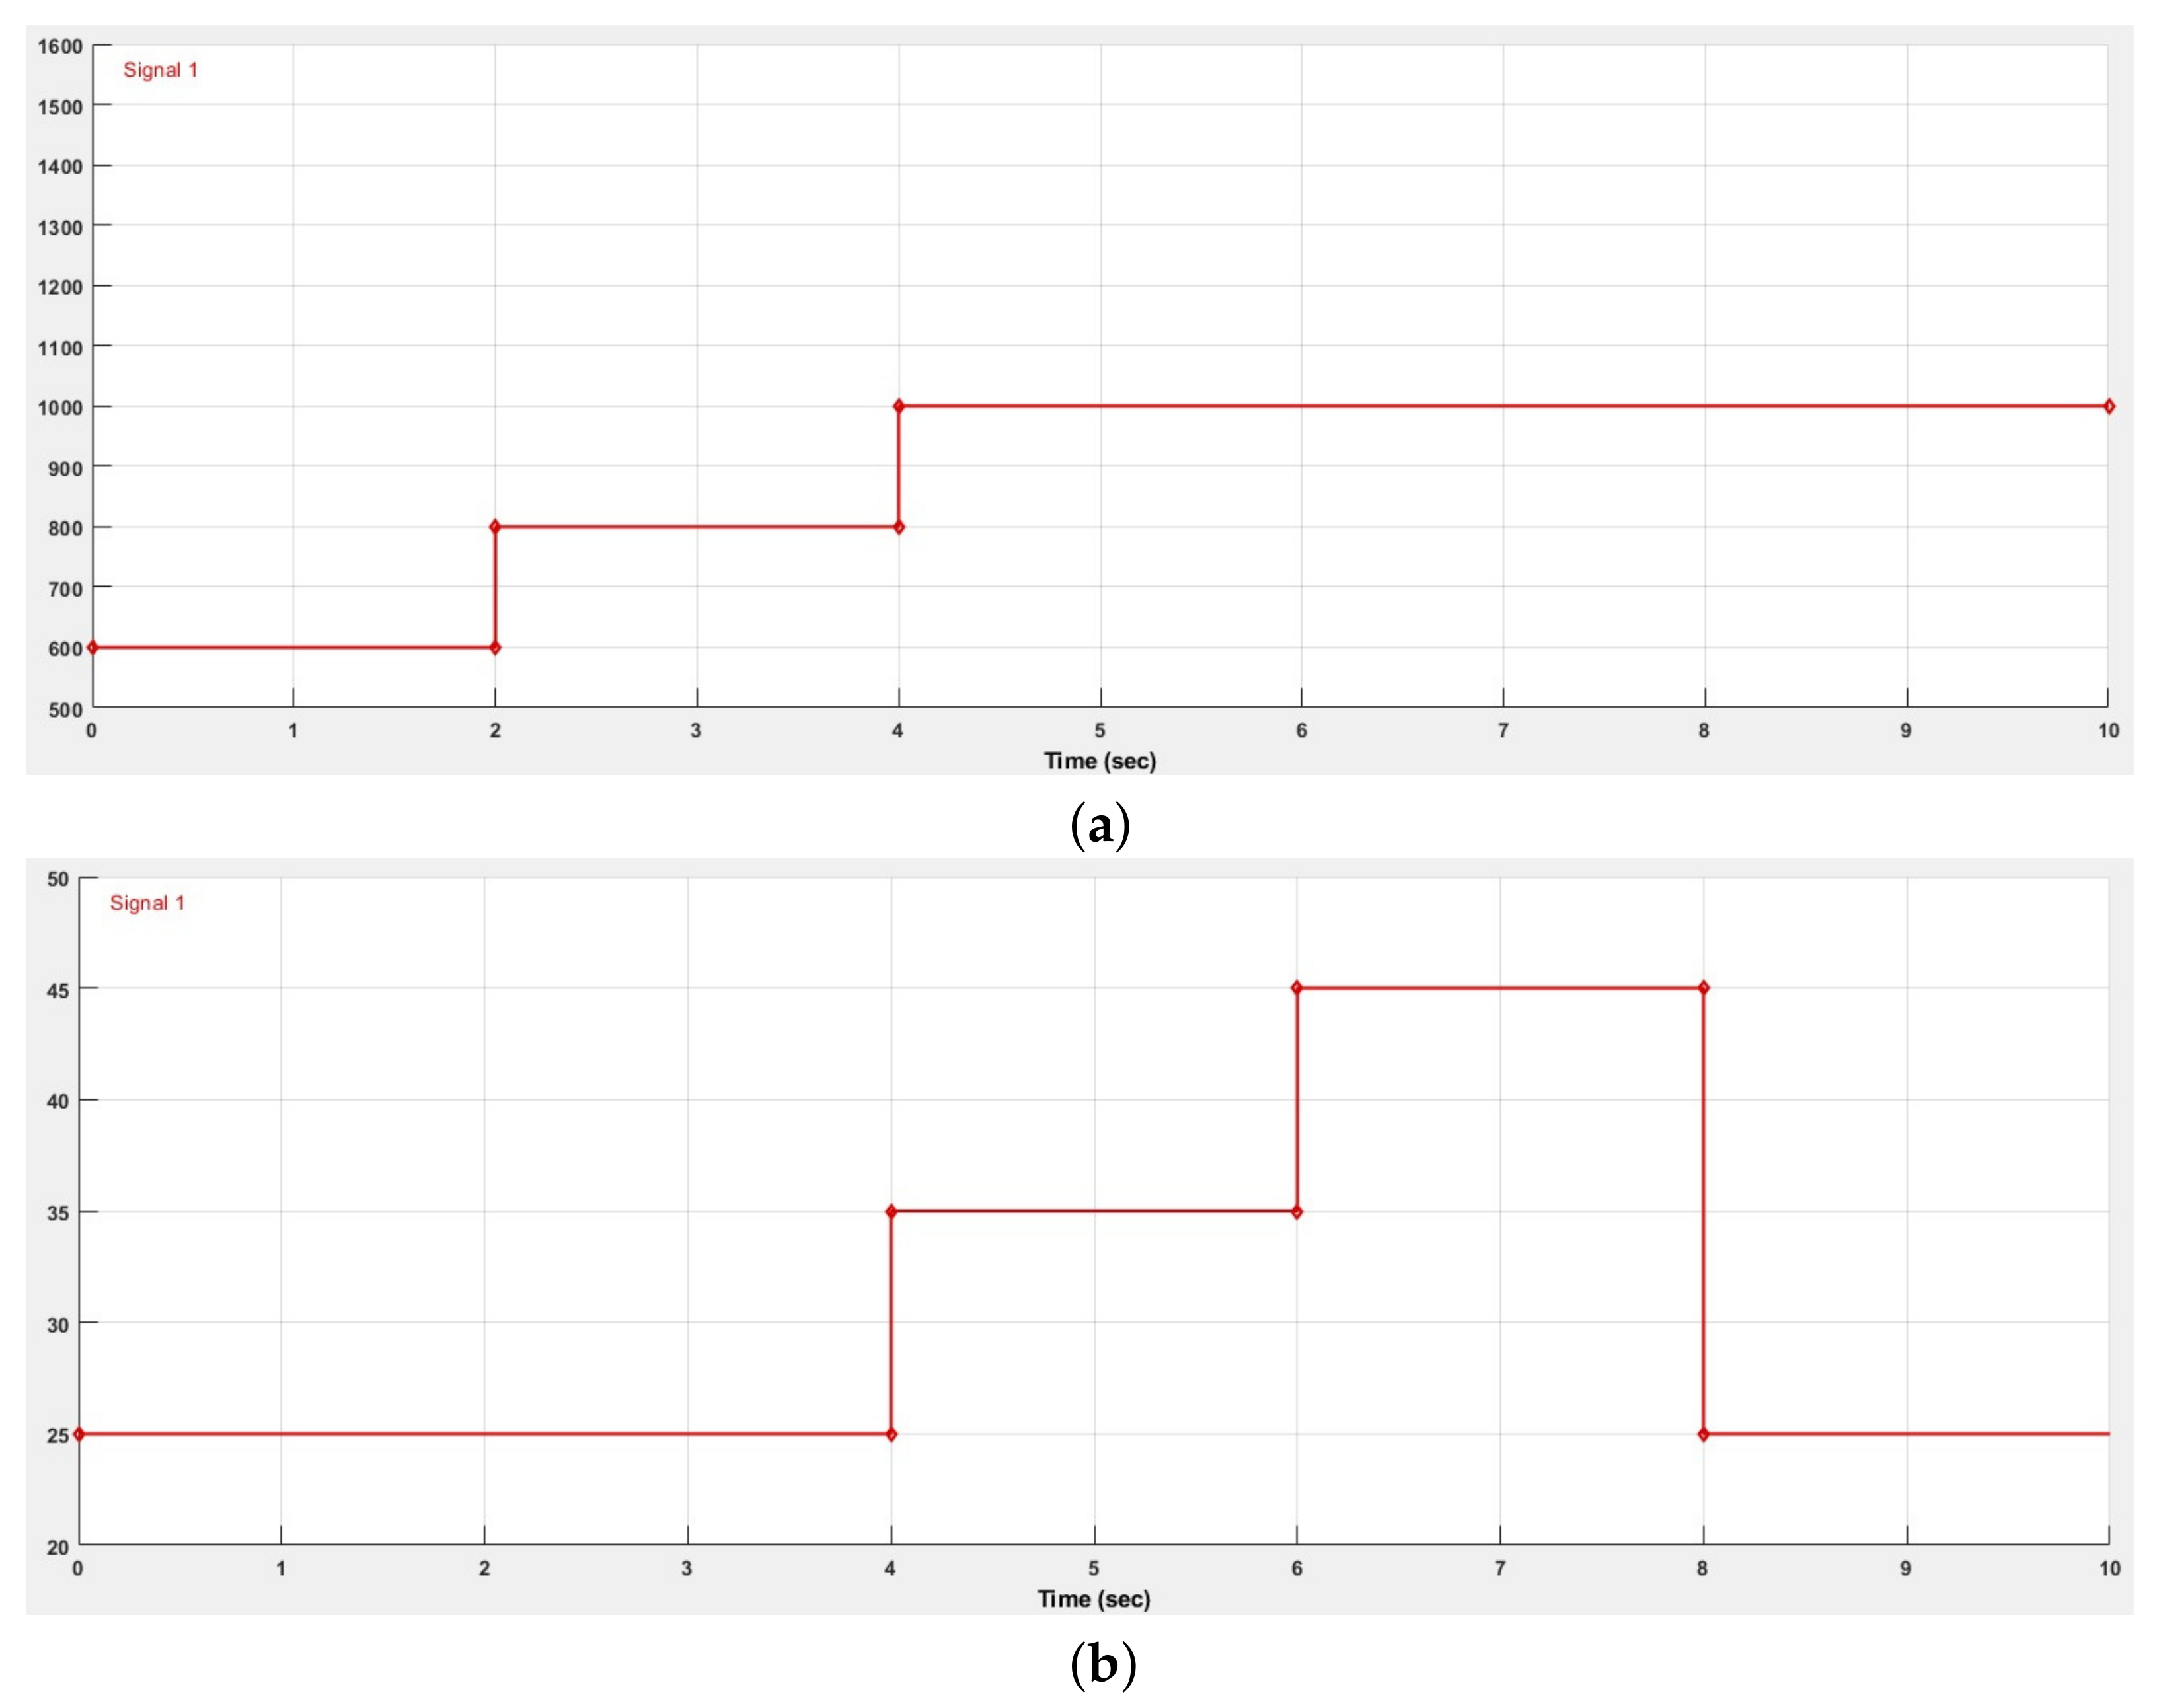
The PV Array block uses the solar irradiation (
) and ambient temperature (
), as input parameters. In order to obtain a better understanding of the solar PV array behavior, the environment conditions will change after 2 s as shown in
Figure 3, with the dynamic simulation having a total run time of 10 s.
The objective of the Simulink model is to study the parameters variation, related to the generated power of the PV system and the efficiency of the boost converters contained in a three phase inverter, in the changing environment conditions of the simulation. In order to better analyse the behaviour of the boost converters, in the next subsection it will be detailed how the values of the boost converter components were obtained.
2.1. Dimensioning of the Boost Converter
The boost converter is a DC-DC converter, that increases the input voltage value, in order to generate an output voltage higher than the input. It is one of the most used converters in the solar industry [
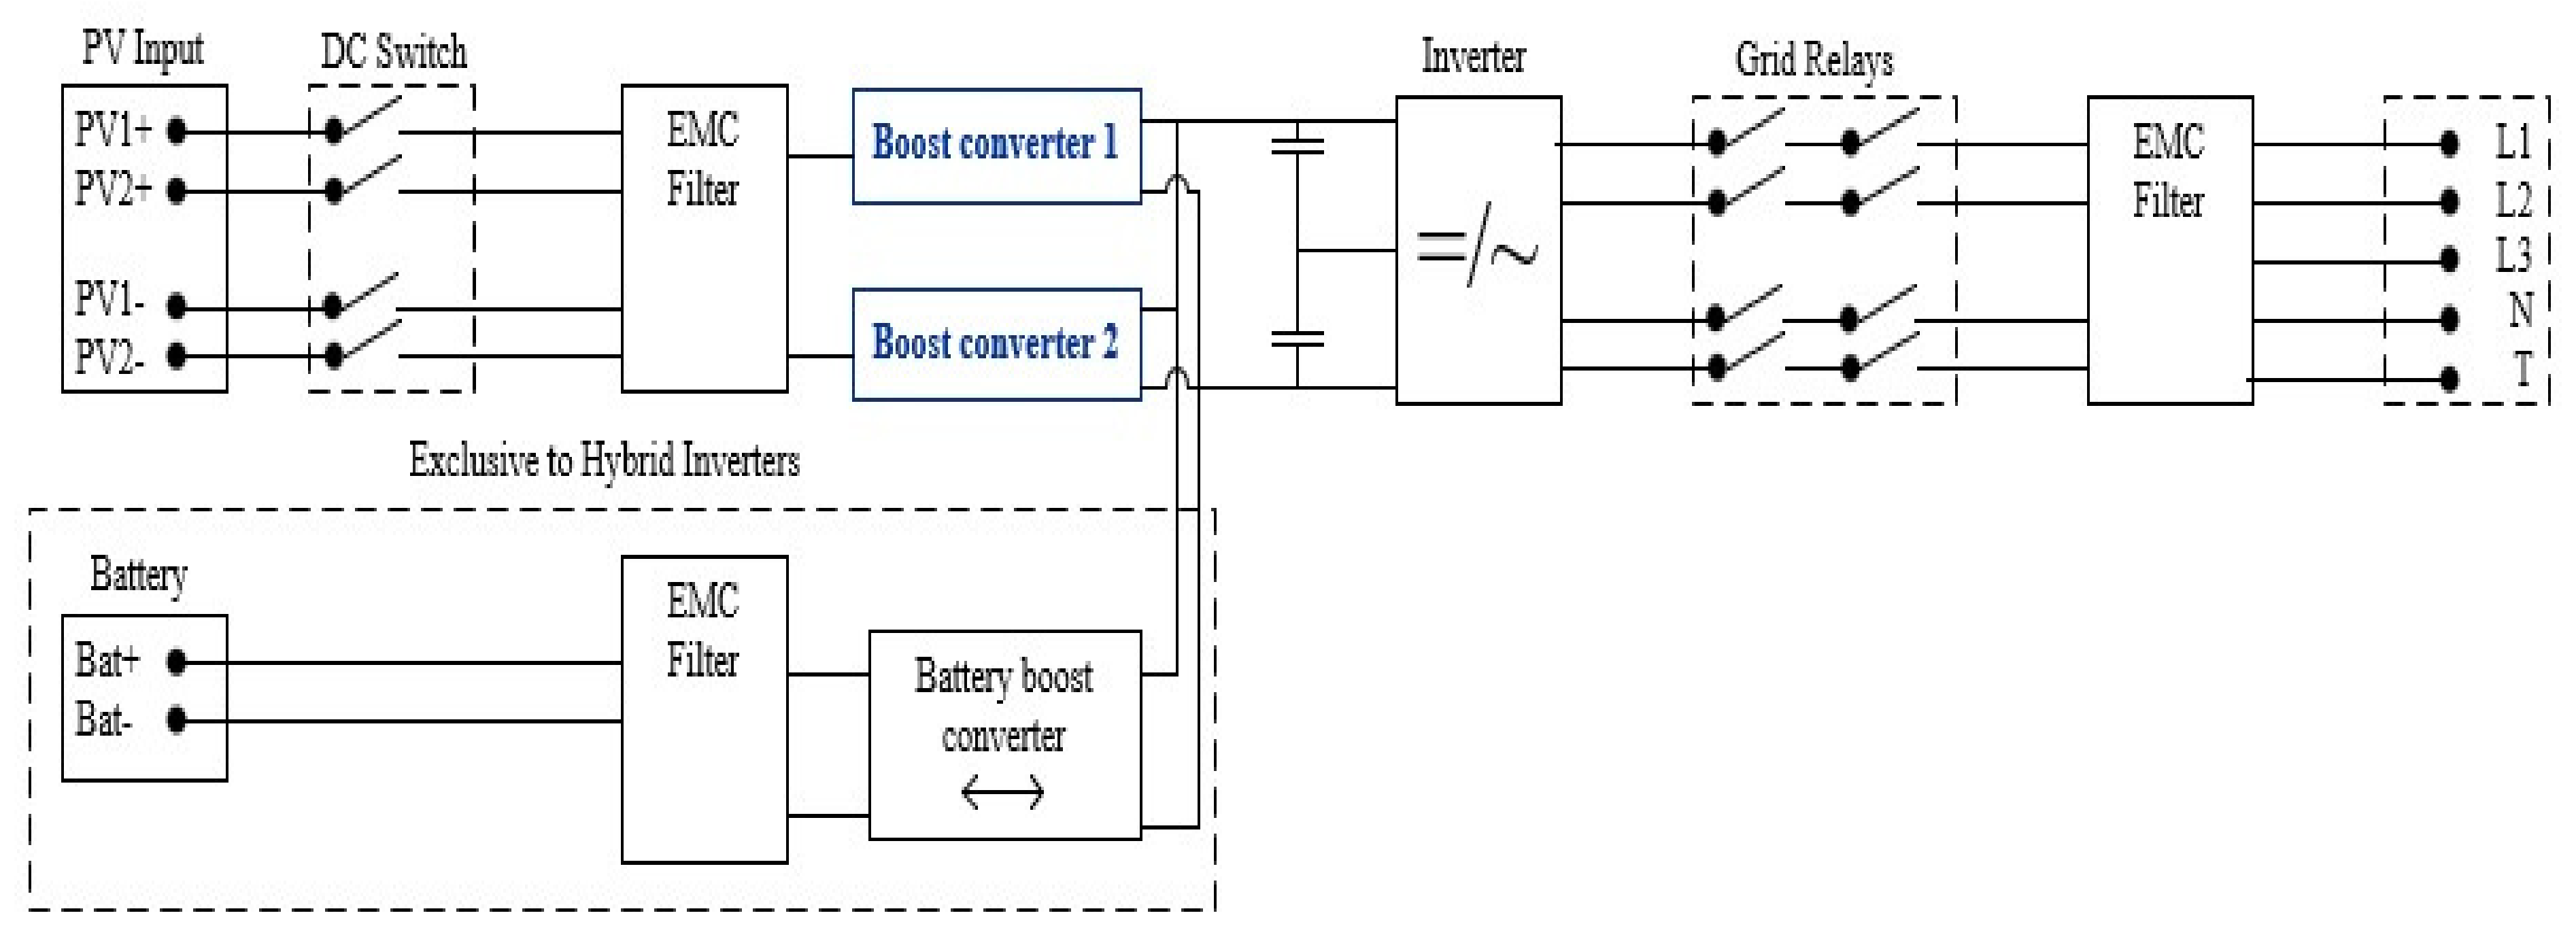
26]. In a solar PV system, it is either used individually, or coupled with a DC-AC converter, as seen in the three phase inverter used as reference for this study, which contains at least two boost converters in parallel, or the hybrid inverter as can be seen in
Figure 4.
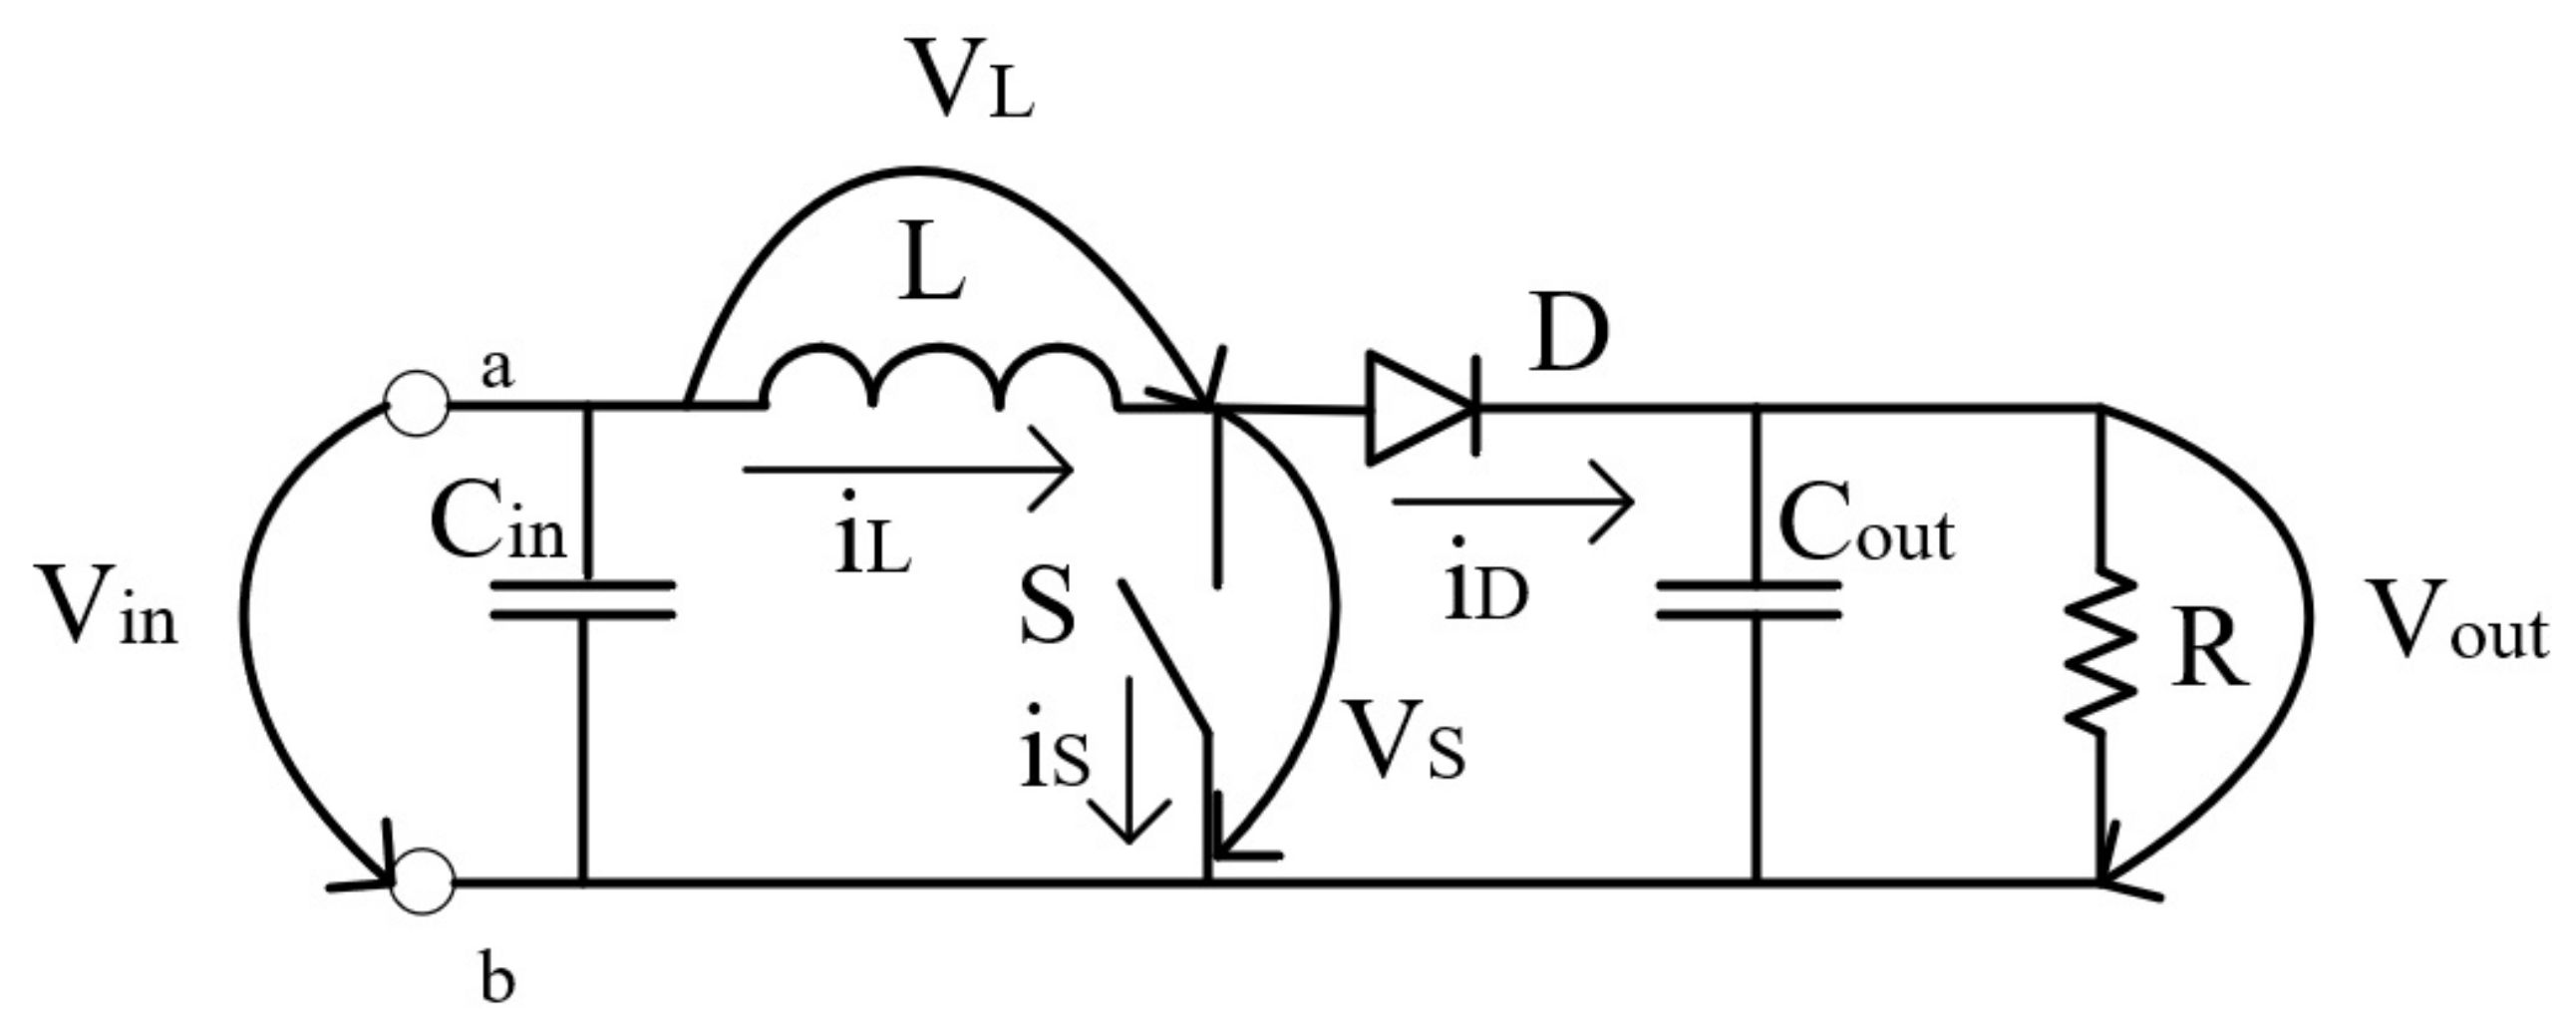
The only difference between a hybrid and a three phase inverter, is that a three phase inverter can’t be connected to a battery so it doesn’t have the additional buck-boost converter. In these inverters, the boost converter purpose is to increase the output voltage to a desired value which is afterwards converted from Direct Current (DC) to Alternate Current (AC), to the voltage value of the electric grid. The schematic of the boost converter element of the inverter, of the PV system in analysis is presented in
Figure 5.
In the boost converters, the output voltage and input voltage, depends on the duty cycle (
D) value, as can be seen in Equation (
1).
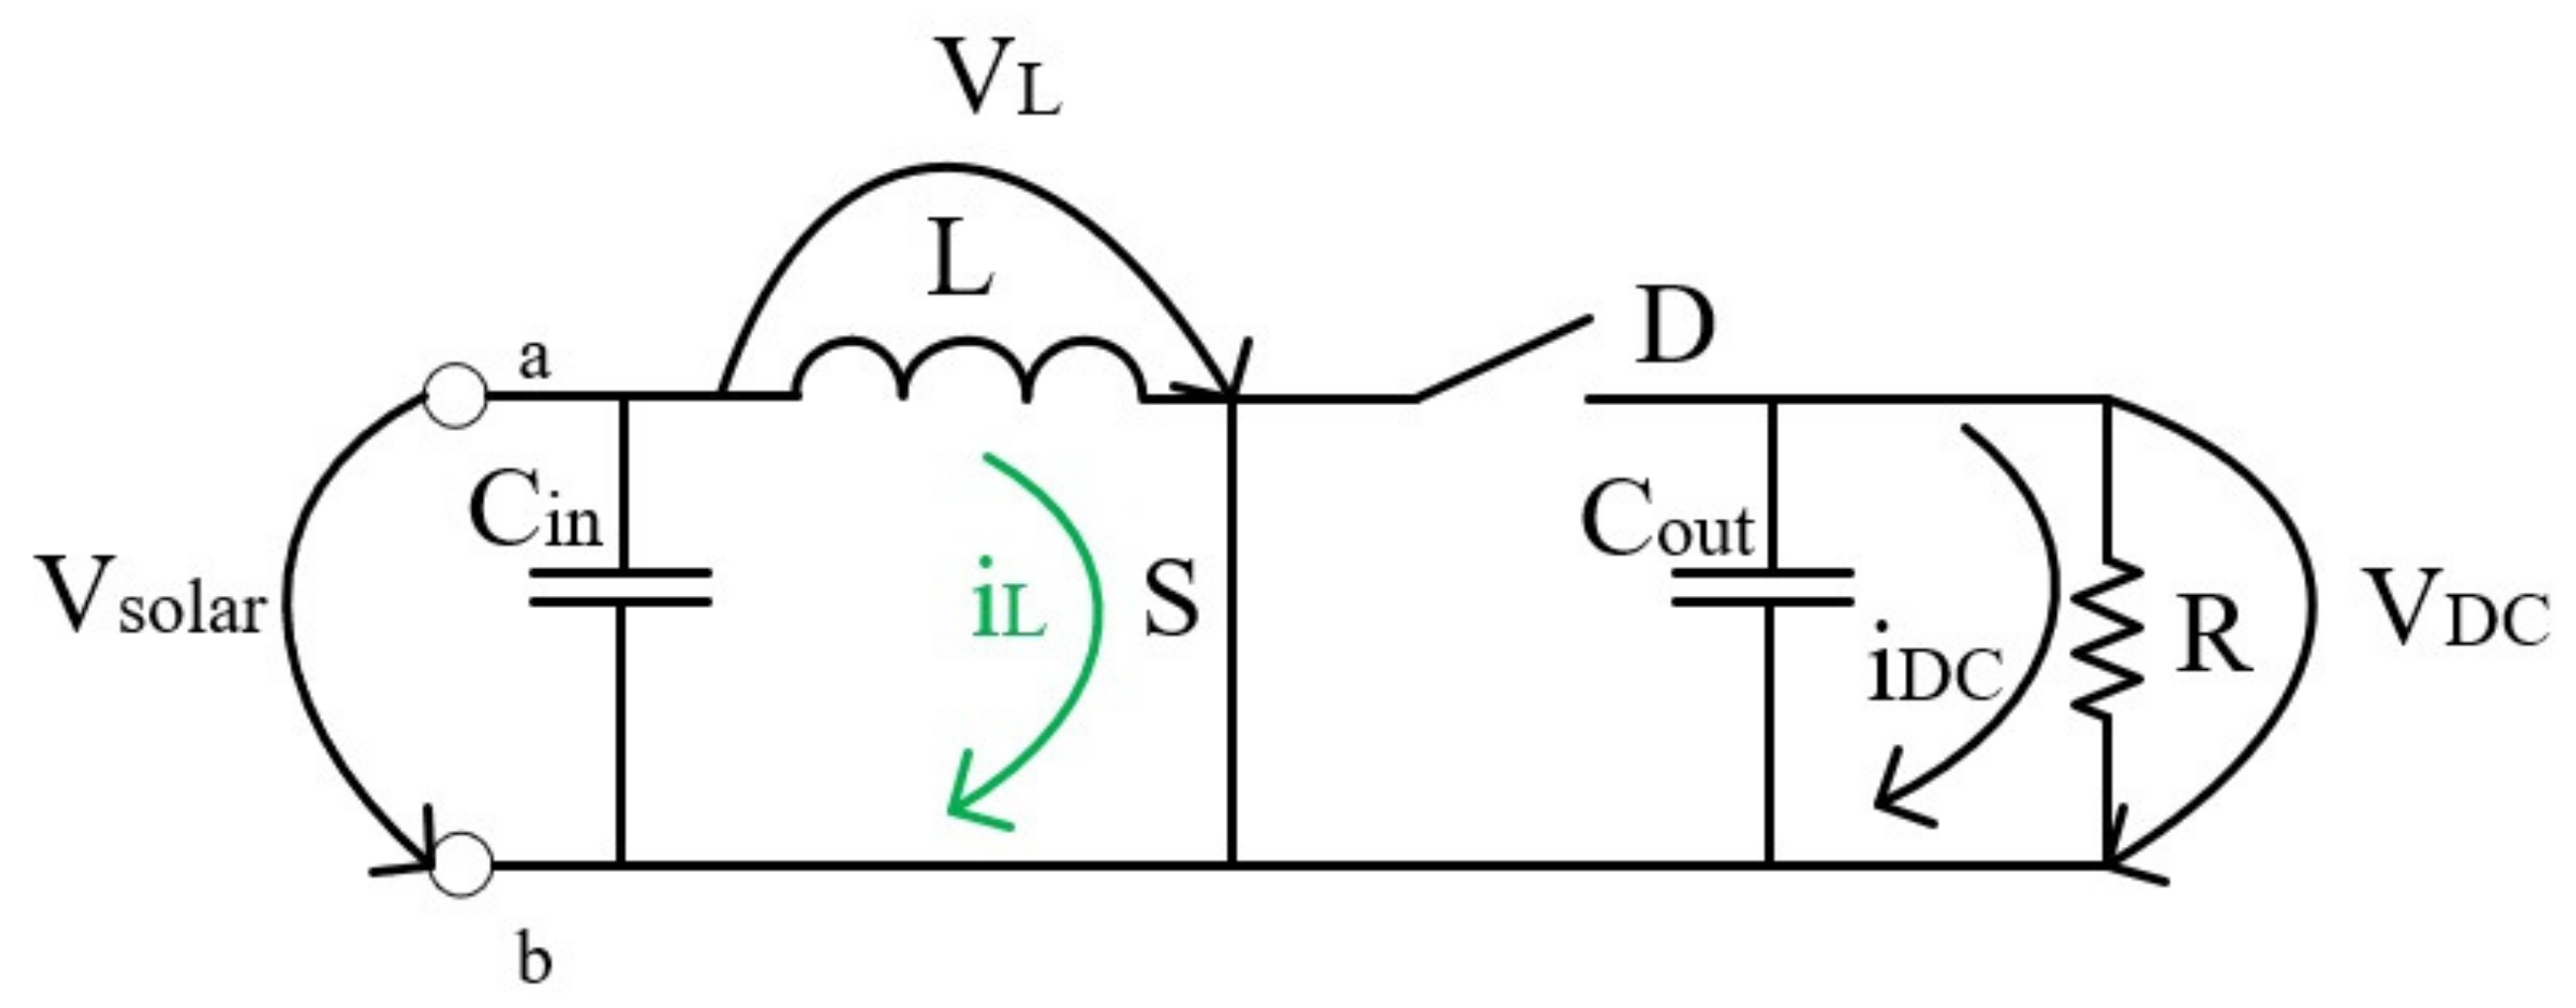
In this converter when the switch (S) is closed, the converter is in its on state, the current stored in the coil is increased while the energy stored in the capacitor is sent to the load, as can be seen in
Figure 6.
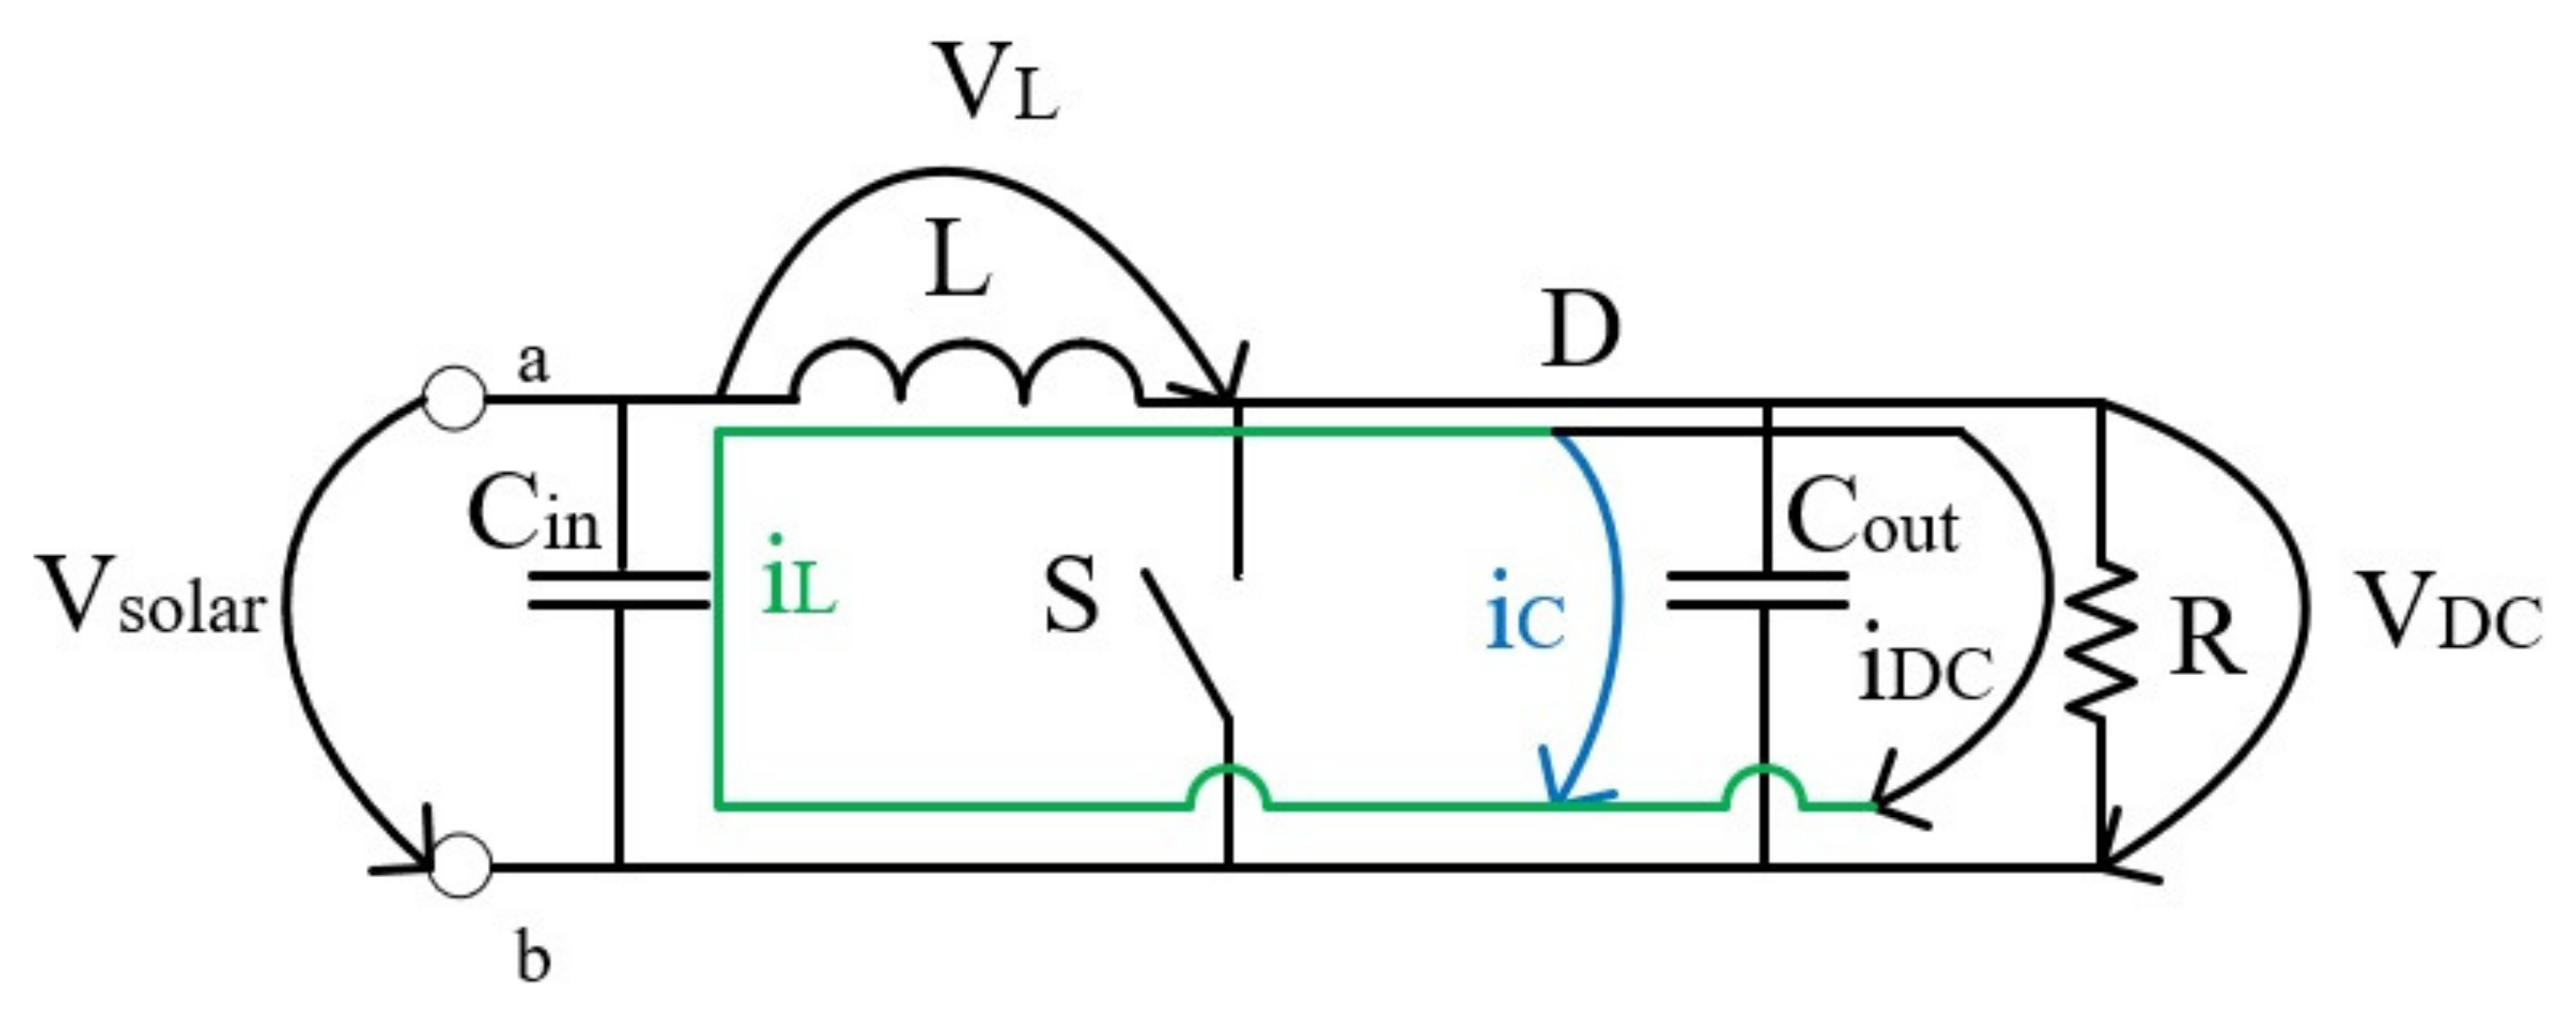
When the switch is open the converter is in its off state, the current stored in the coil in the previous state feeds both the condenser and the load, as can be seen in
Figure 7.
In this state, the output voltage (the voltage at the load) is bigger than the input voltage, which is given by the sum of the solar panels voltage in this system and the voltage drop in the coil. This happens because the coil inverts the polarity of its terminals in order to avoid the increase in current, since the output voltage is bigger than the input voltage this converter is named boost converter.
For this particular PV system the components such as diodes, capacitors, coils and the switch which is an IGBT (Insulated Gate Bipolar Transistor) have to at least support a maximum voltage of 1000 V and a maximum current of 11 A [
25]. The capacity of the input and output capacitors and the coil inductance, were calculated using Equations (
2)–(
4), respectively [
27].
The capacitors will be dimensioned for a ripple voltage (
) of 5 V. The input voltage will be 160 V and the output voltage will be 800 V (although the inverter nominal voltage is 600 V [
25]), which are the minimum and maximum possible values in the converter, this last value was obtained for a duty cycle of 0.80, this being the maximum recommended value for a boost converter as is explained in chart 1 of the Appendix of Switching Power Supplies A-Z [
27]. The chosen diode are two schottky diodes VS-15EVL06-M3 of Vishay in series, together they support a voltage higher than 1000 V and have a total voltage drop (
) of 1.96 V [
28]. The IGBT selected is IGW60T120 of Infineon, which has a voltage drop of 1.90 V [
29]. These components were selected, for a switching frequency (
f) of 20 kHz. The output current is 3.94 A and was determined by the division between the nominal power of one boost converter (1575 W) [
25] and the nominal output voltage considered for the inverter.
The coefficient
r is the ratio of the current ripple given by the division between the current variation and the medium value of the inductor current. Its target value is recommended to be 0.40 [
30,
31], although it is acceptable for the final value to be between 0.30 and 0.60 [
32].
The initial values implemented in the Simulink model and used for the calculations, are presented in
Table 2. The obtained values for the capacitors and the coil, through Equations (
2)–(
4), are presented in
Table 3, which were also implemented in the model.
The final value of the inductor used in the model, is based on the coil commercialized by KEMET, model SC-18-085J, with an inductance of 0.85 mH [
33]. The final
r value obtained fulfills its design condition, so the coil can be safely used in a prototype working under this conditions. The capacitors are based on the ones commercialized by LGN [
34], where the output is composed by two capacitors in series, which equivalent capacity is 110 µF, while the input is composed by two capacitors in series but with 28 µF. Each capacitor supports 600 V [
34] and when connected in series they support voltage higher than 1000 V. The capacitor’s capacity is much higher than the capacity needed to obtain a voltage ripple of 5 V considered in the design phase, so its voltage ripple is expected to be much lower, even below 1 V.
2.2. Experimental Procedure for the System Definition
In
Section 2, it was presented how the system that will be implemented in Matlab/Simulink was dimensioned. At the beginning, it was justified that the inverter and the solar PV panels, were chosen to enable an office building with a medium occupancy of four people and three phase power, to produce and consume renewable energy equivalent to more than 50% of the building’s energy consumption without batteries. It was also presented the diagrams that describing the variation of the parameters, that will impact the performance of the solar PV system, namely the solar irradiation and the ambient temperature values, that will be used in the dynamic simulation. Using the three phase inverter as a basis, the parameters of the inductors, the capacitors, the IGBT and the schottky diodes were determined, considering a target value of 0.40 for the coefficient
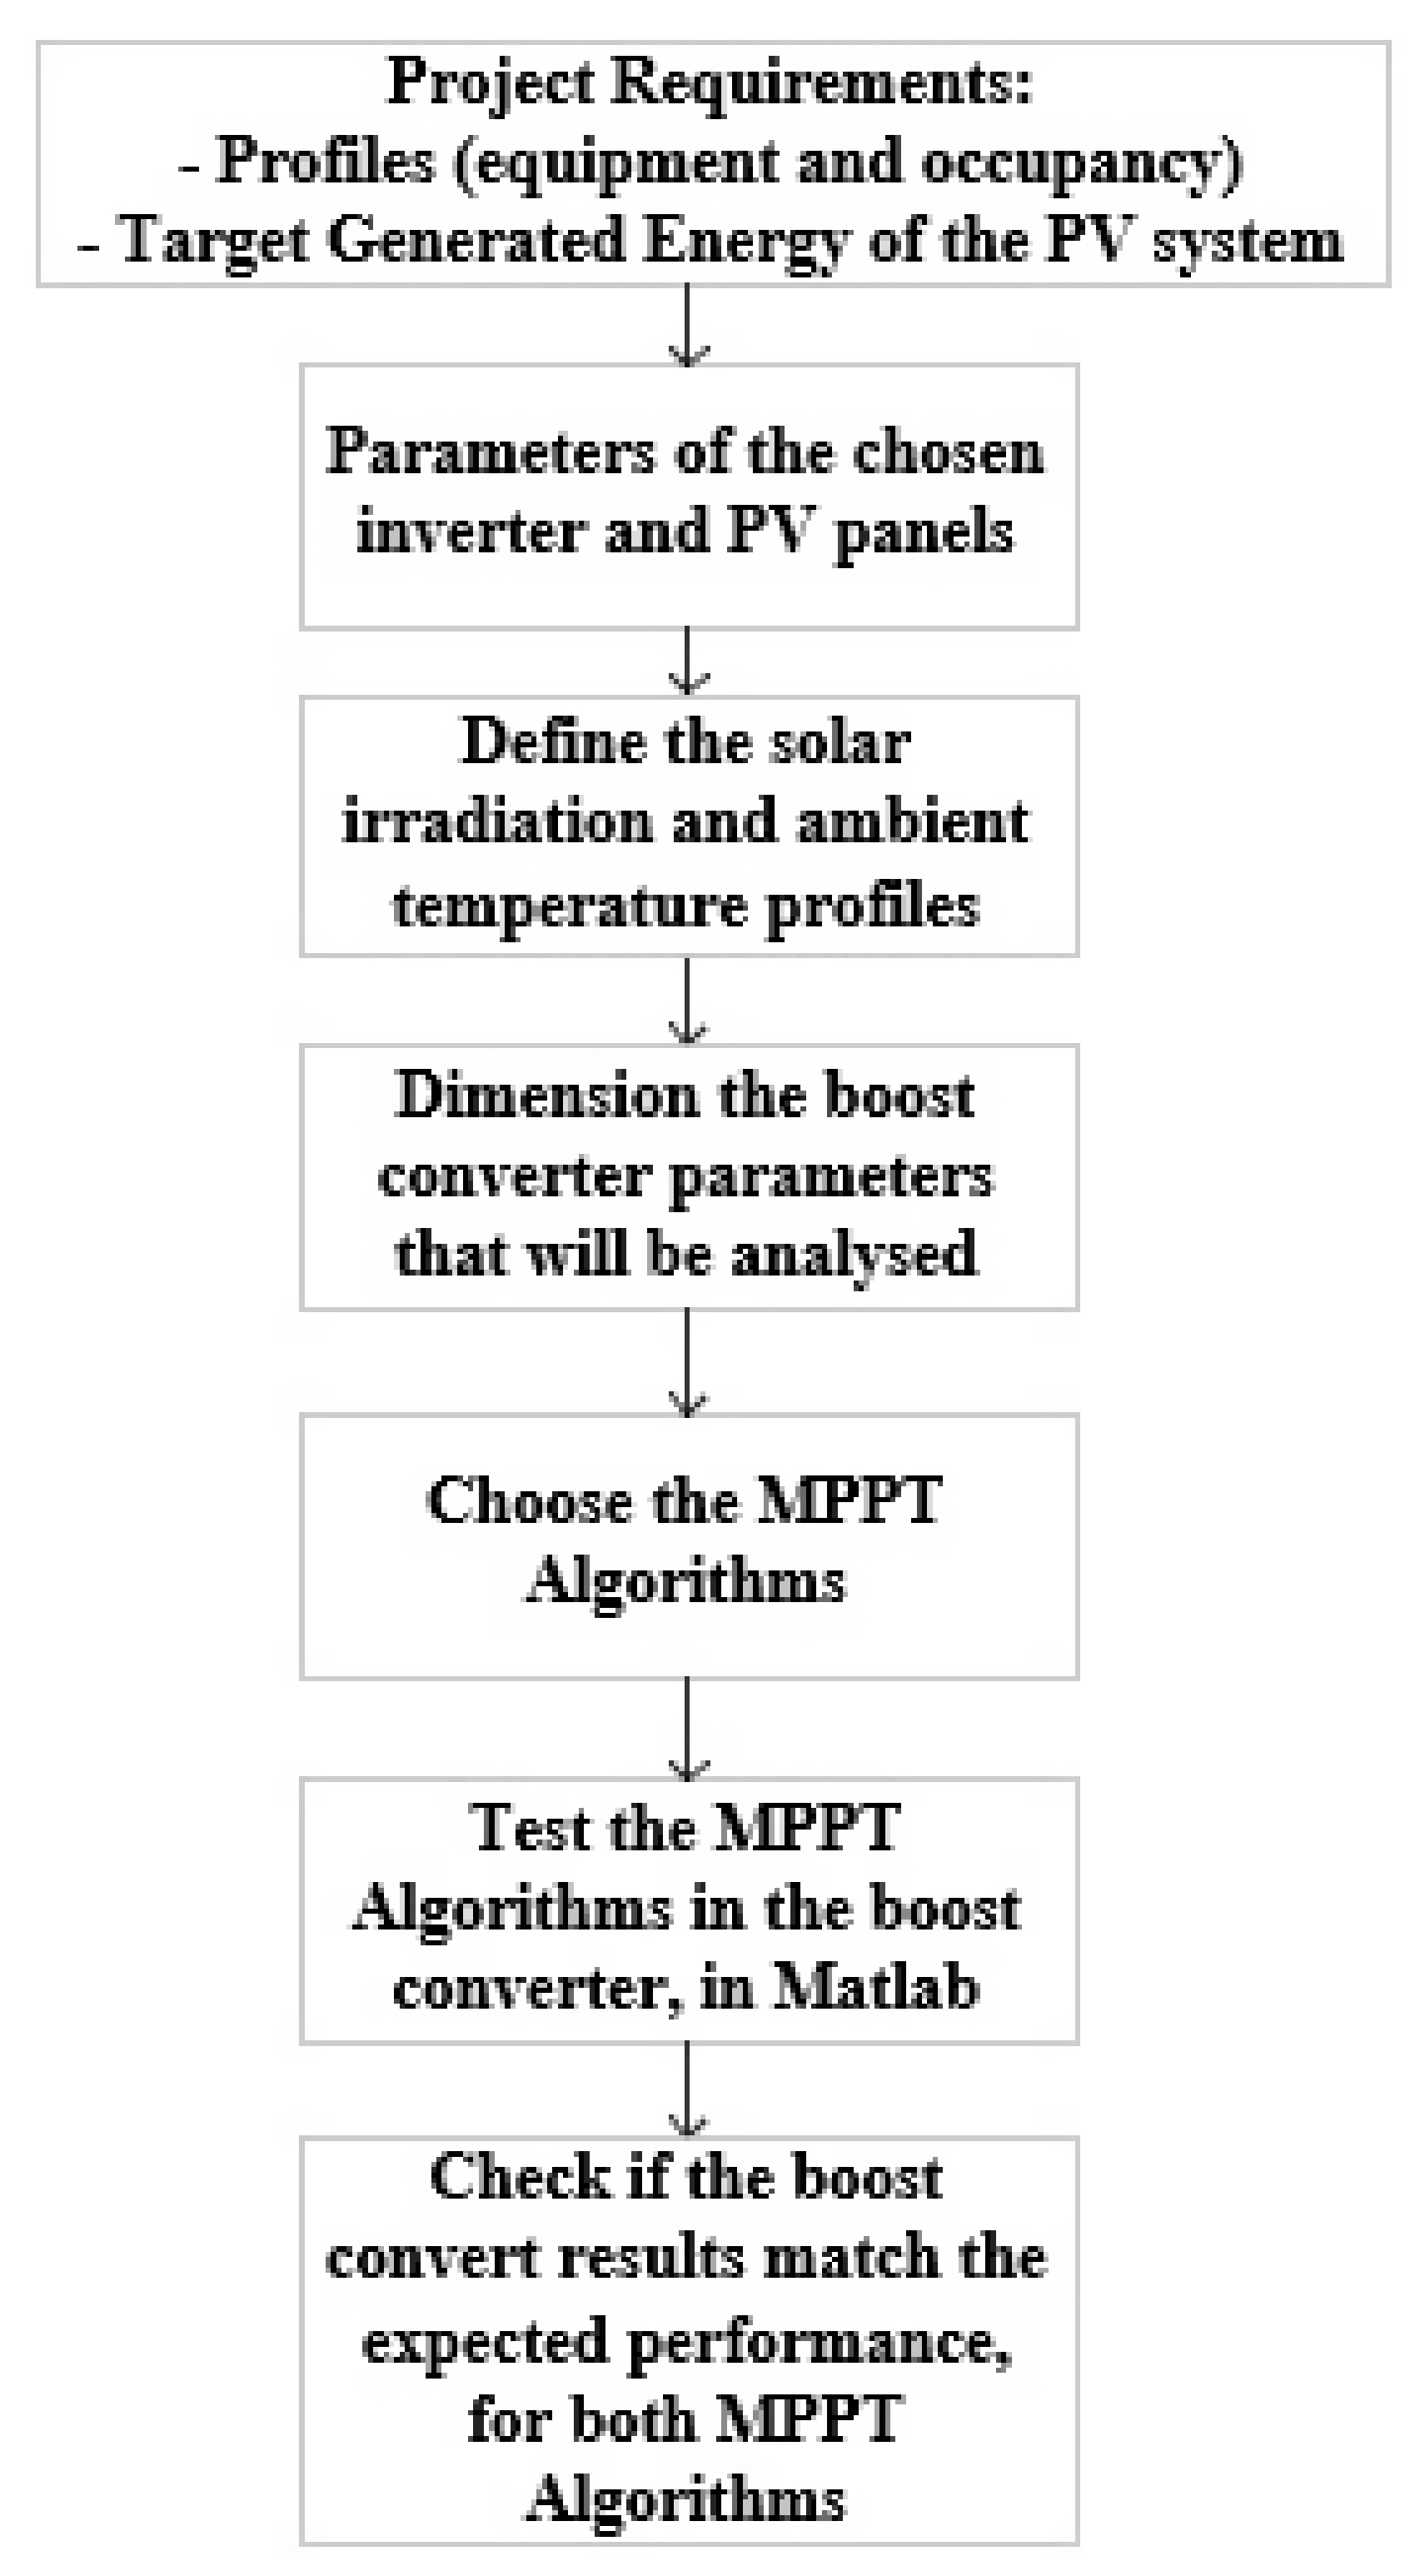
r, a voltage ripple of 5 V and a switching frequency of 20 kHz. The experimental procedure is resumed in
Figure 8.
As it can be seen in the figure above, it was already presented a detailed study of steps 2, 3 and 4. In the next section, the MPPT control algorithms that were chosen for this study, will be presented as well as the system’s expected behaviour for both algorithms and the last steps will be discussed and thoroughly analysed in
Section 4.
3. MPPT Control Algorithms
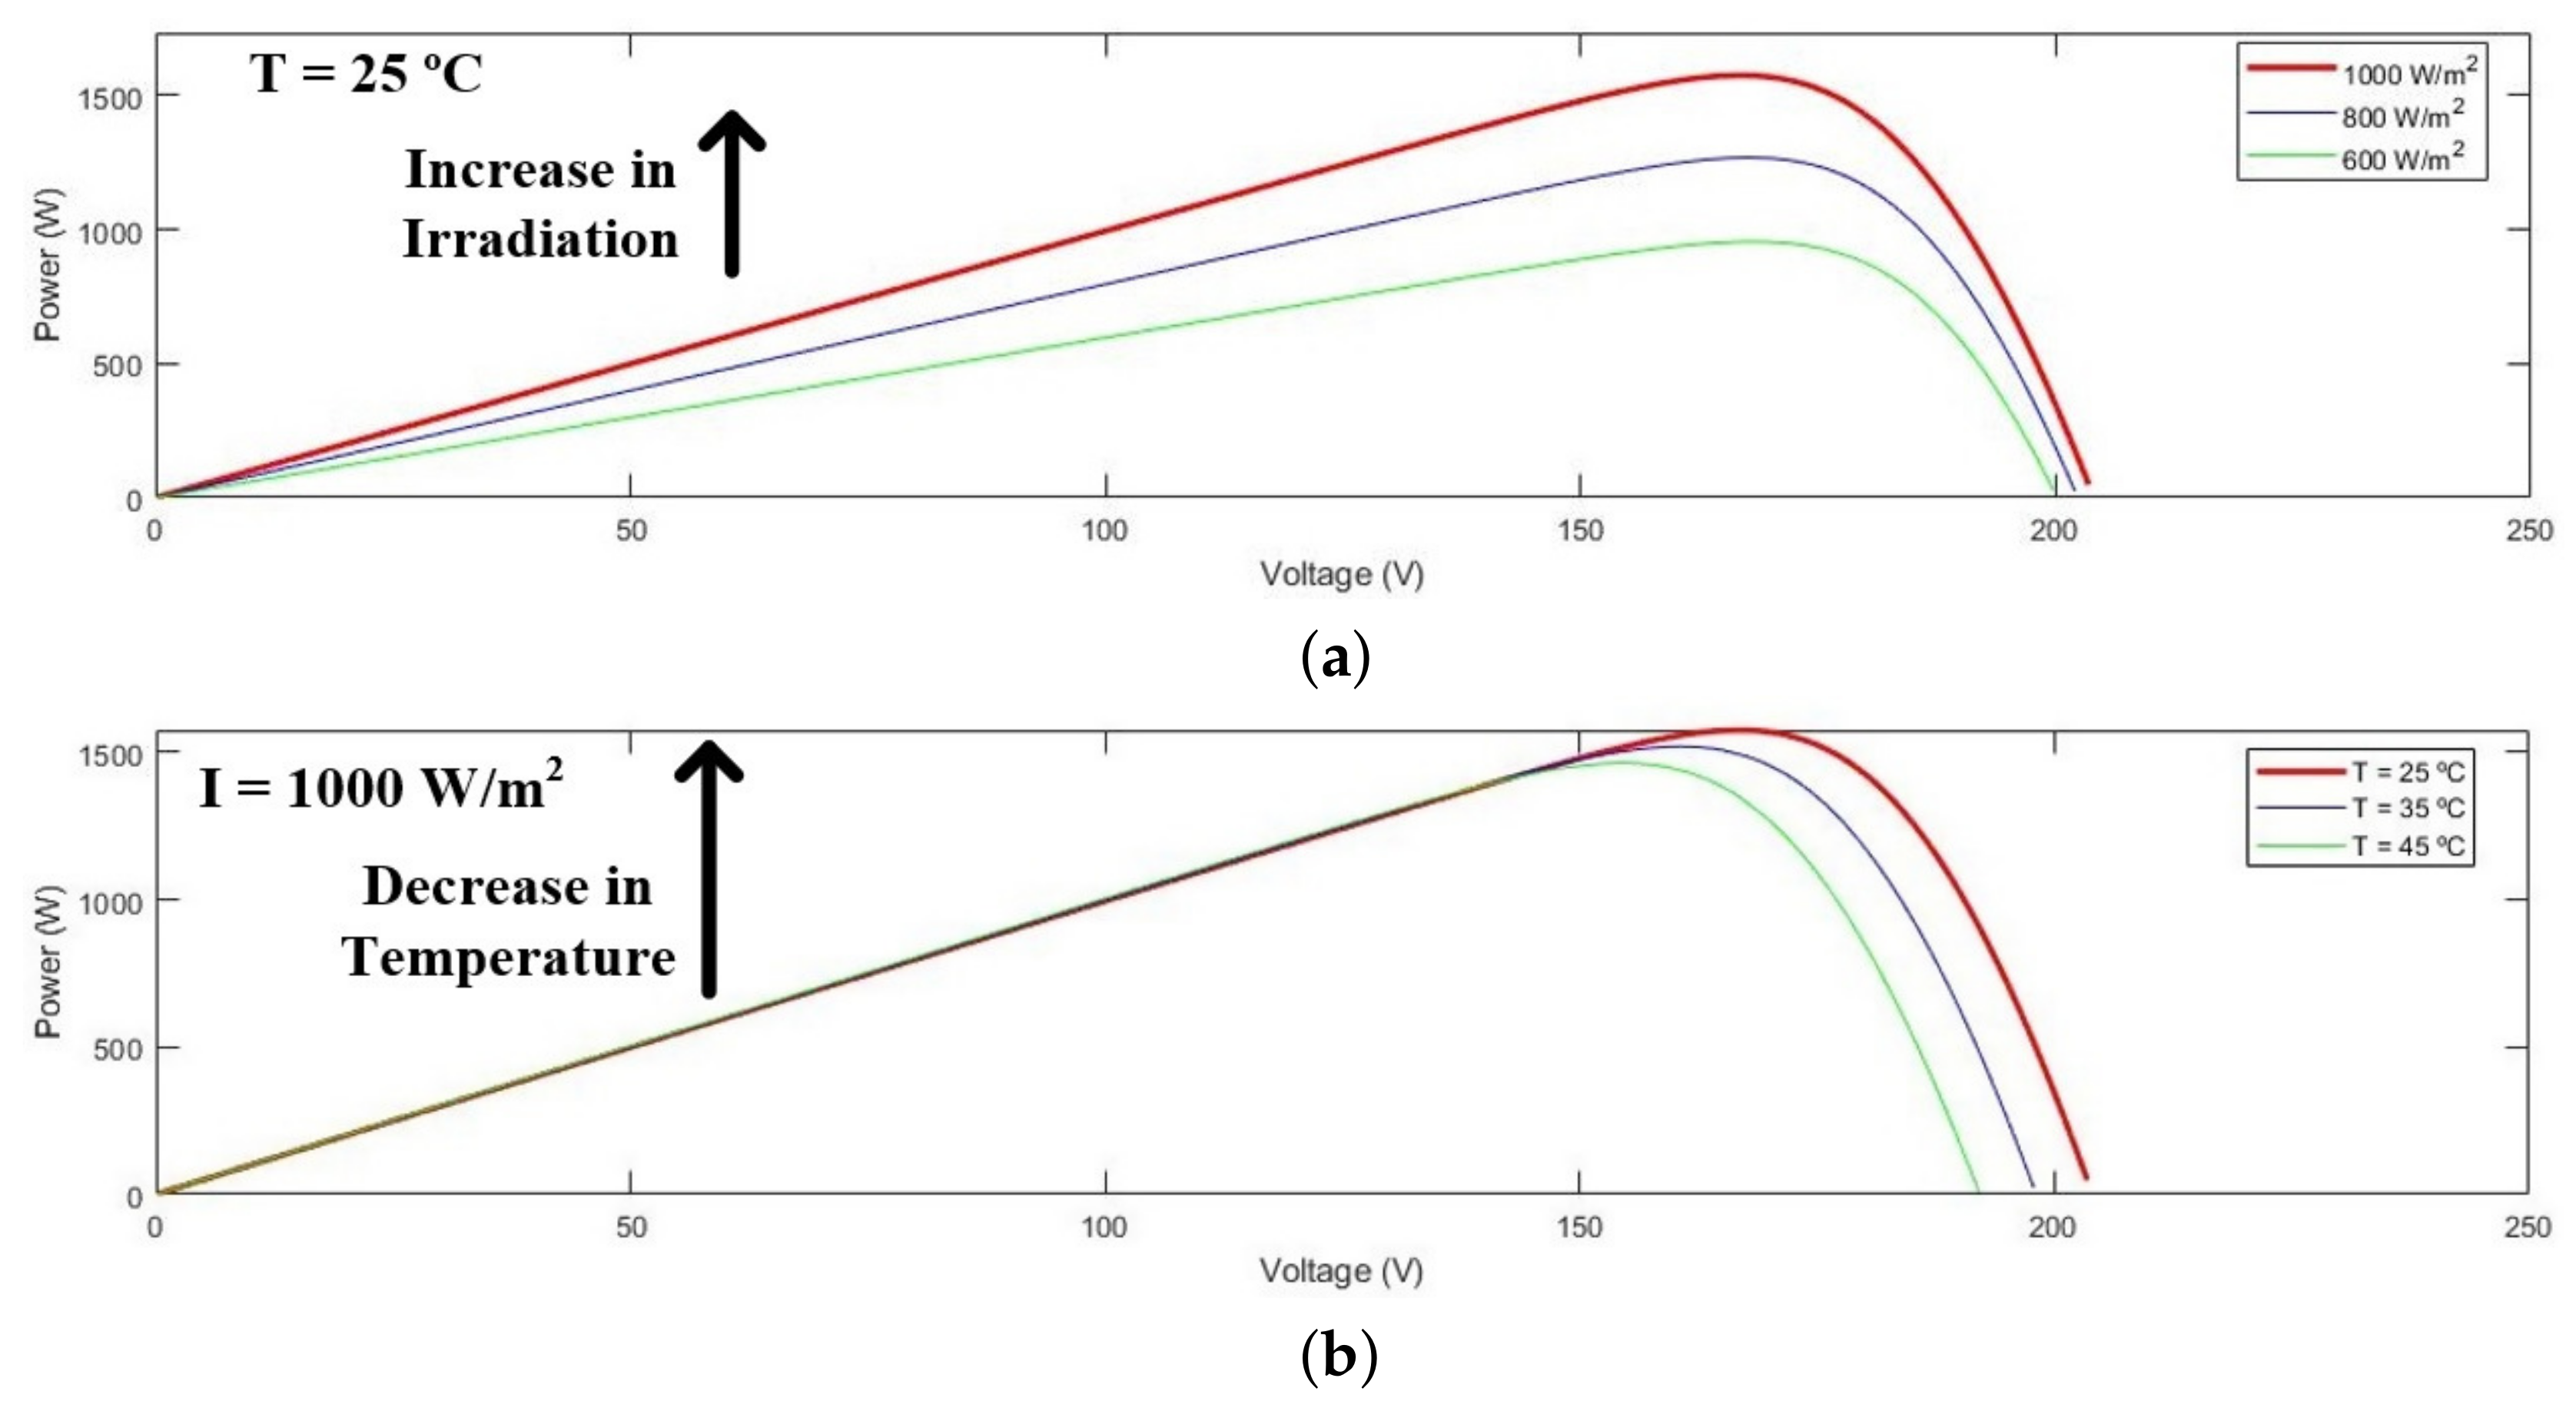
The MPPT is a technique typically used to enable certain electric equipment to generate electricity from renewable energy sources, such as solar PV panels or wind turbines. This control technique is used to maximize the generated power for the local environmental conditions. The MPP is the “knee” of the curve in the case of a I-V curve, or the maximum power point in a P-V curve. As can be seen in
Figure 9, the MPP has different values depending on the environmental conditions.
As can be seen in the figures above, a higher solar irradiation increases the power obtained at MPP, while lower temperatures also increase the power obtained at this point. Taking this into account, when analysing again the
Figure 3 of
Section 2, it is expected that the biggest value of the generated power at MPP will be obtained in the last 2 s, due to the fact that in this interval the solar irradiation is the highest and the ambient temperature is the lowest out of all the simulated values.
The most commonly used algorithms to achieve the MPP are the P&O and the Incremental Conductance, although there are other alternatives making use of a PID (proportional, integrative and derivative) or a PI (proportional and integrative), or other derivatives of the PID controller, but since they are programmed to achieve only a specific value regardless of the environment conditions, they won’t attempt to achieve the MPP for changing environment conditions [
35], except if supported by AI based MPPT methods [
23]. There are also AI based alternatives such as fuzzy logic and artificial neural networks, that can achieve even better results both on their own, or coupled with the traditional MPPT algorithms [
23]. Both the more traditional P&O approach and the AI enhanced approach using fuzzy logic, will be explained in more detail in the following subsections.
3.1. Perturb and Observe
The P&O algorithm is the most utilized MPPT algorithm for solar PV panels, due to its ease use and high conversion efficiency [
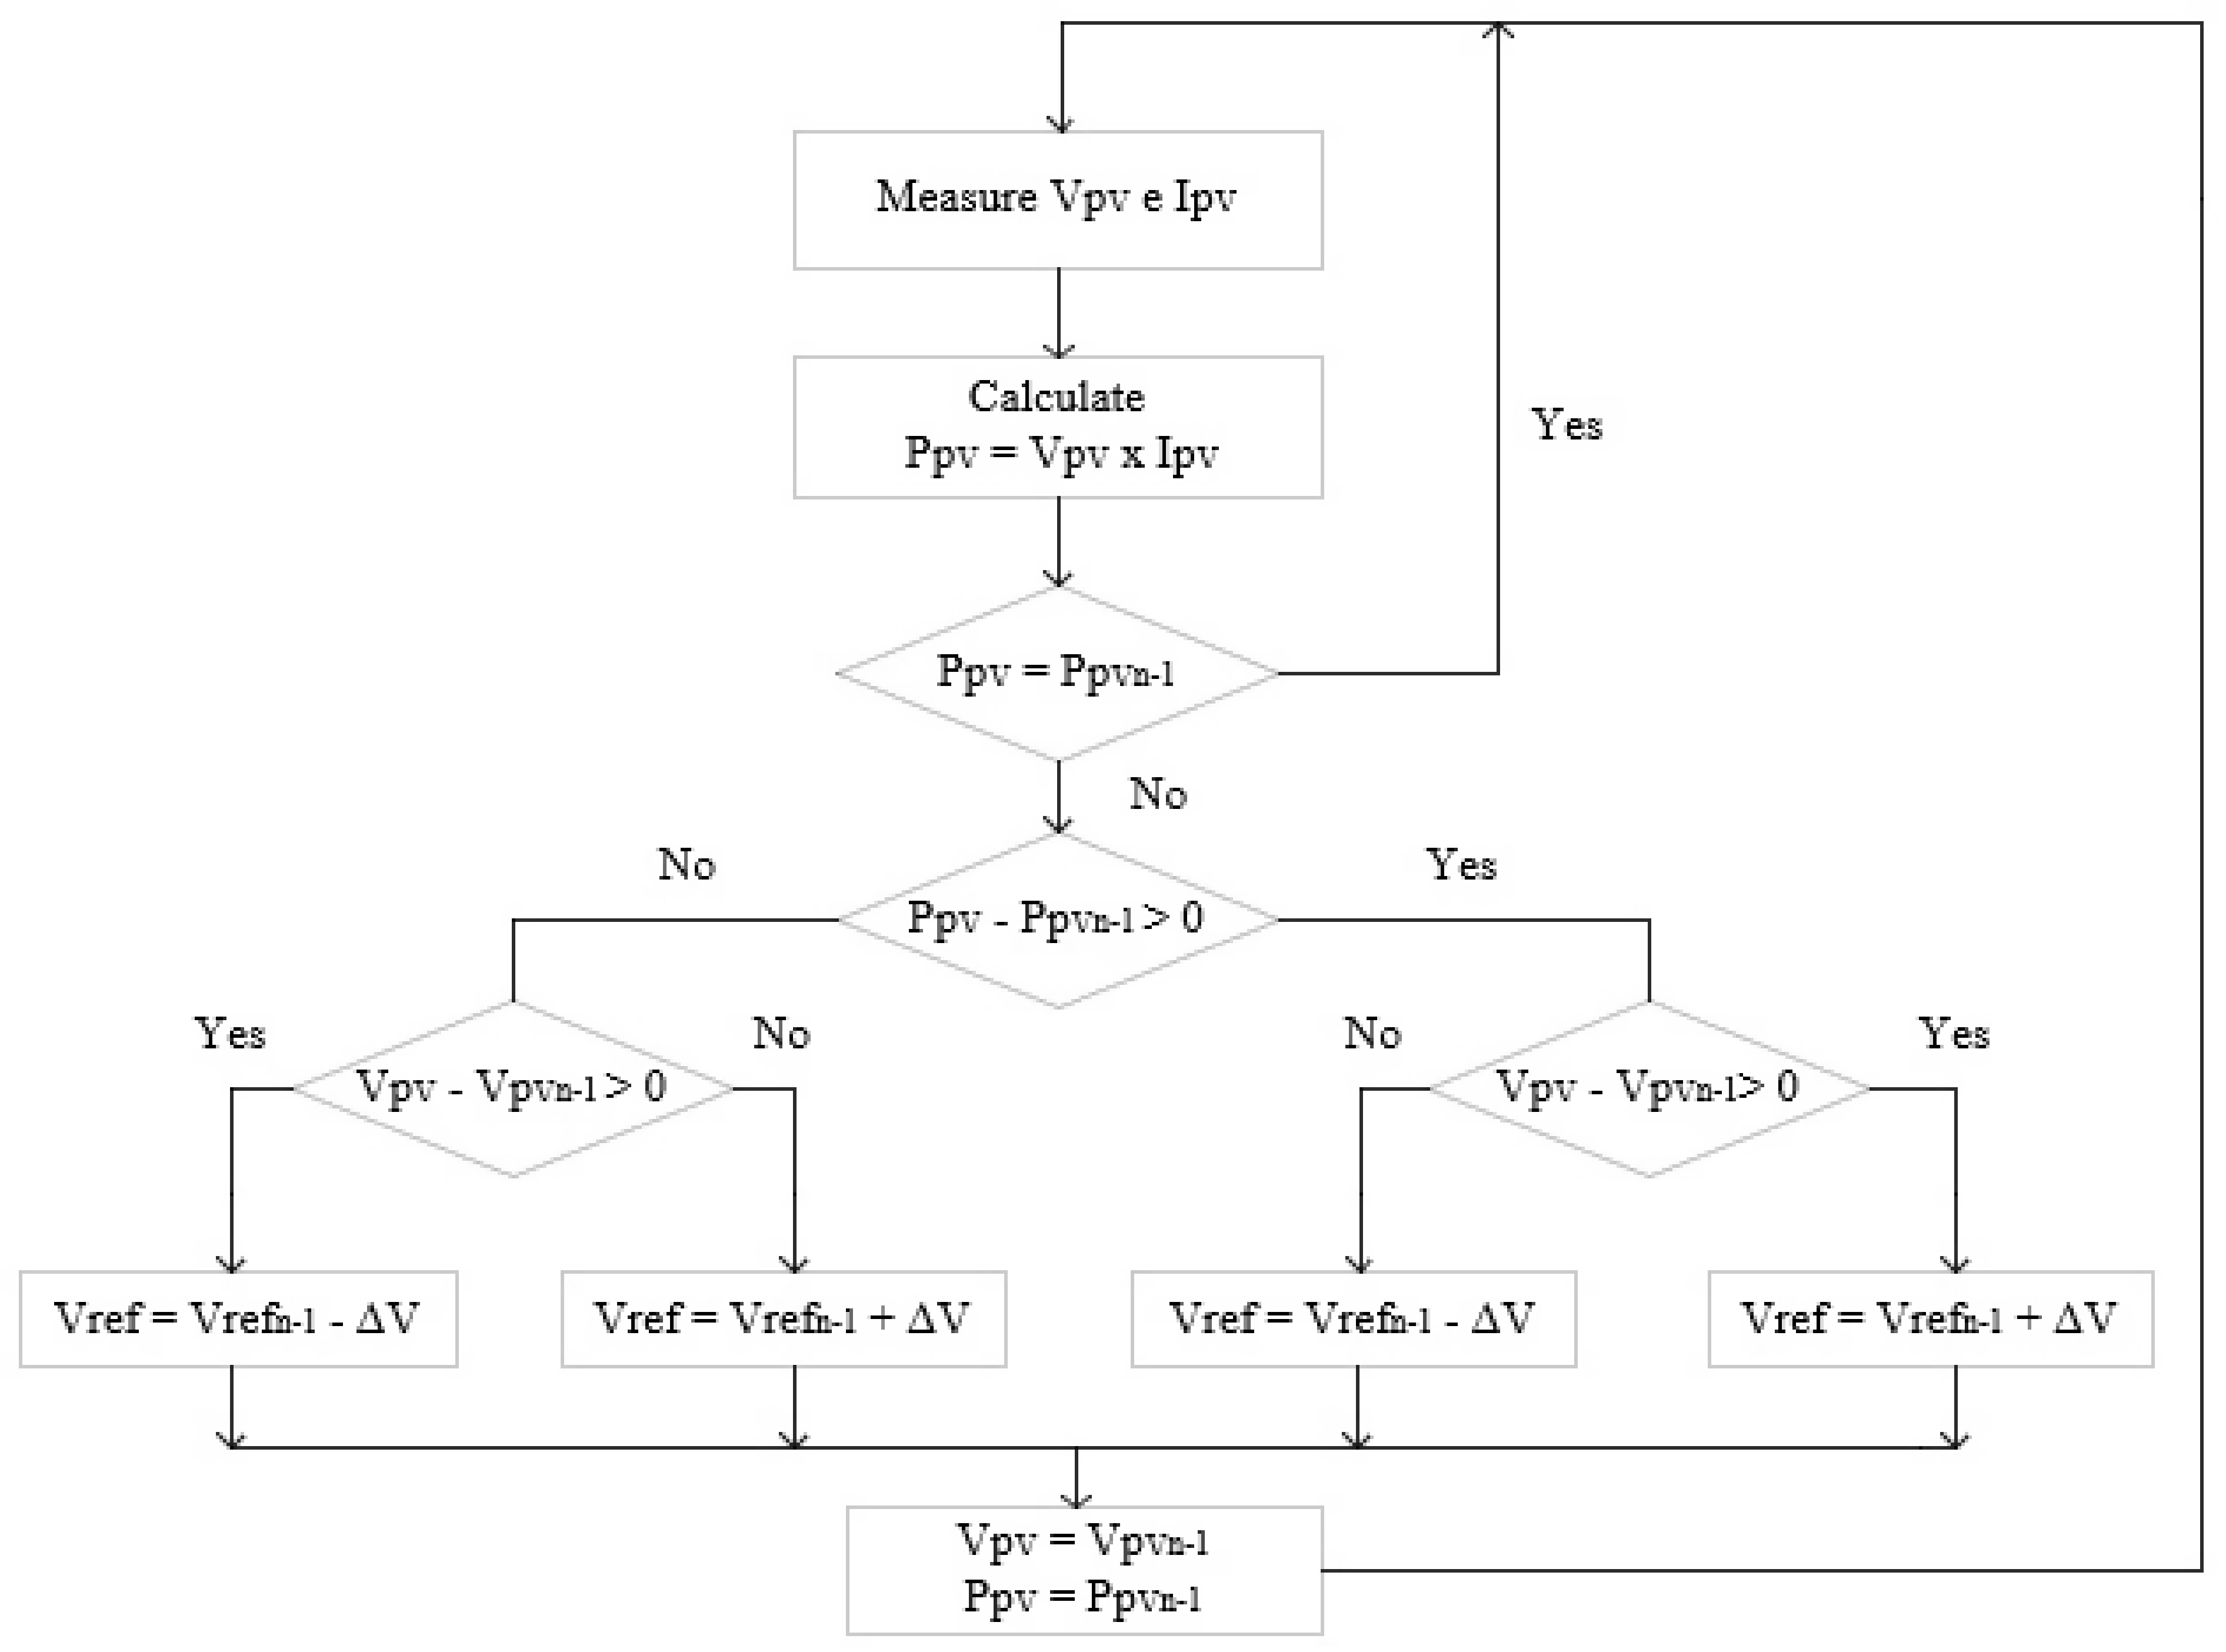
12], although compared to other MPPT algorithms such as the Incremental Conductance, the generated power and other parameters such as the output voltage of the PV are susceptible to bigger oscillations and take more time to achieve steady state. This algorithm is a hill climbing method, because the generated power increases when the voltage increases, until the MPP is reached, when MPP is reached the generated power decreases when the voltage increases. A flowchart of the algorithm implemented in the Simulink model for the P&O is presented in
Figure 10, while the
Figure 11 shows how the duty cycle changes regarding the voltage variation and power generated by the solar panel.
As
Figure 10 and
Figure 11 summarize, the P&O algorithm compares and measures the PV voltage and generated power between iterations and changes the duty cycle accordingly. If the generated power is equal between iterations the duty cycle is not changed, else the PV voltage is compared and the duty cycle will be decreased or increased, depending on the needs until it reaches MPP. In the Simulink model, when the duty cycle is changed its value can be increased or decreased by 0.00025, else it will remain unchanged between iterations. Due to this low value, it is expected that it will take a longer time to adapt to the changing environment conditions, but it will have low oscillations when the MPP has reached steady state conditions.
3.2. Fuzzy Logic for MPPT
As it was previously mentioned, fuzzy logic has been recently introduced for the MPPT of a PV system, being used to increase the performance of traditional MPPT methods (such as the P&O, Incremental Conductance or the PID) or together with other AI based methods such as Artificial Neural Networks or Genetic algorithms. The improved traditional MPPT algorithms are more robust and have the advantage of not requiring exact model information for their design procedure [
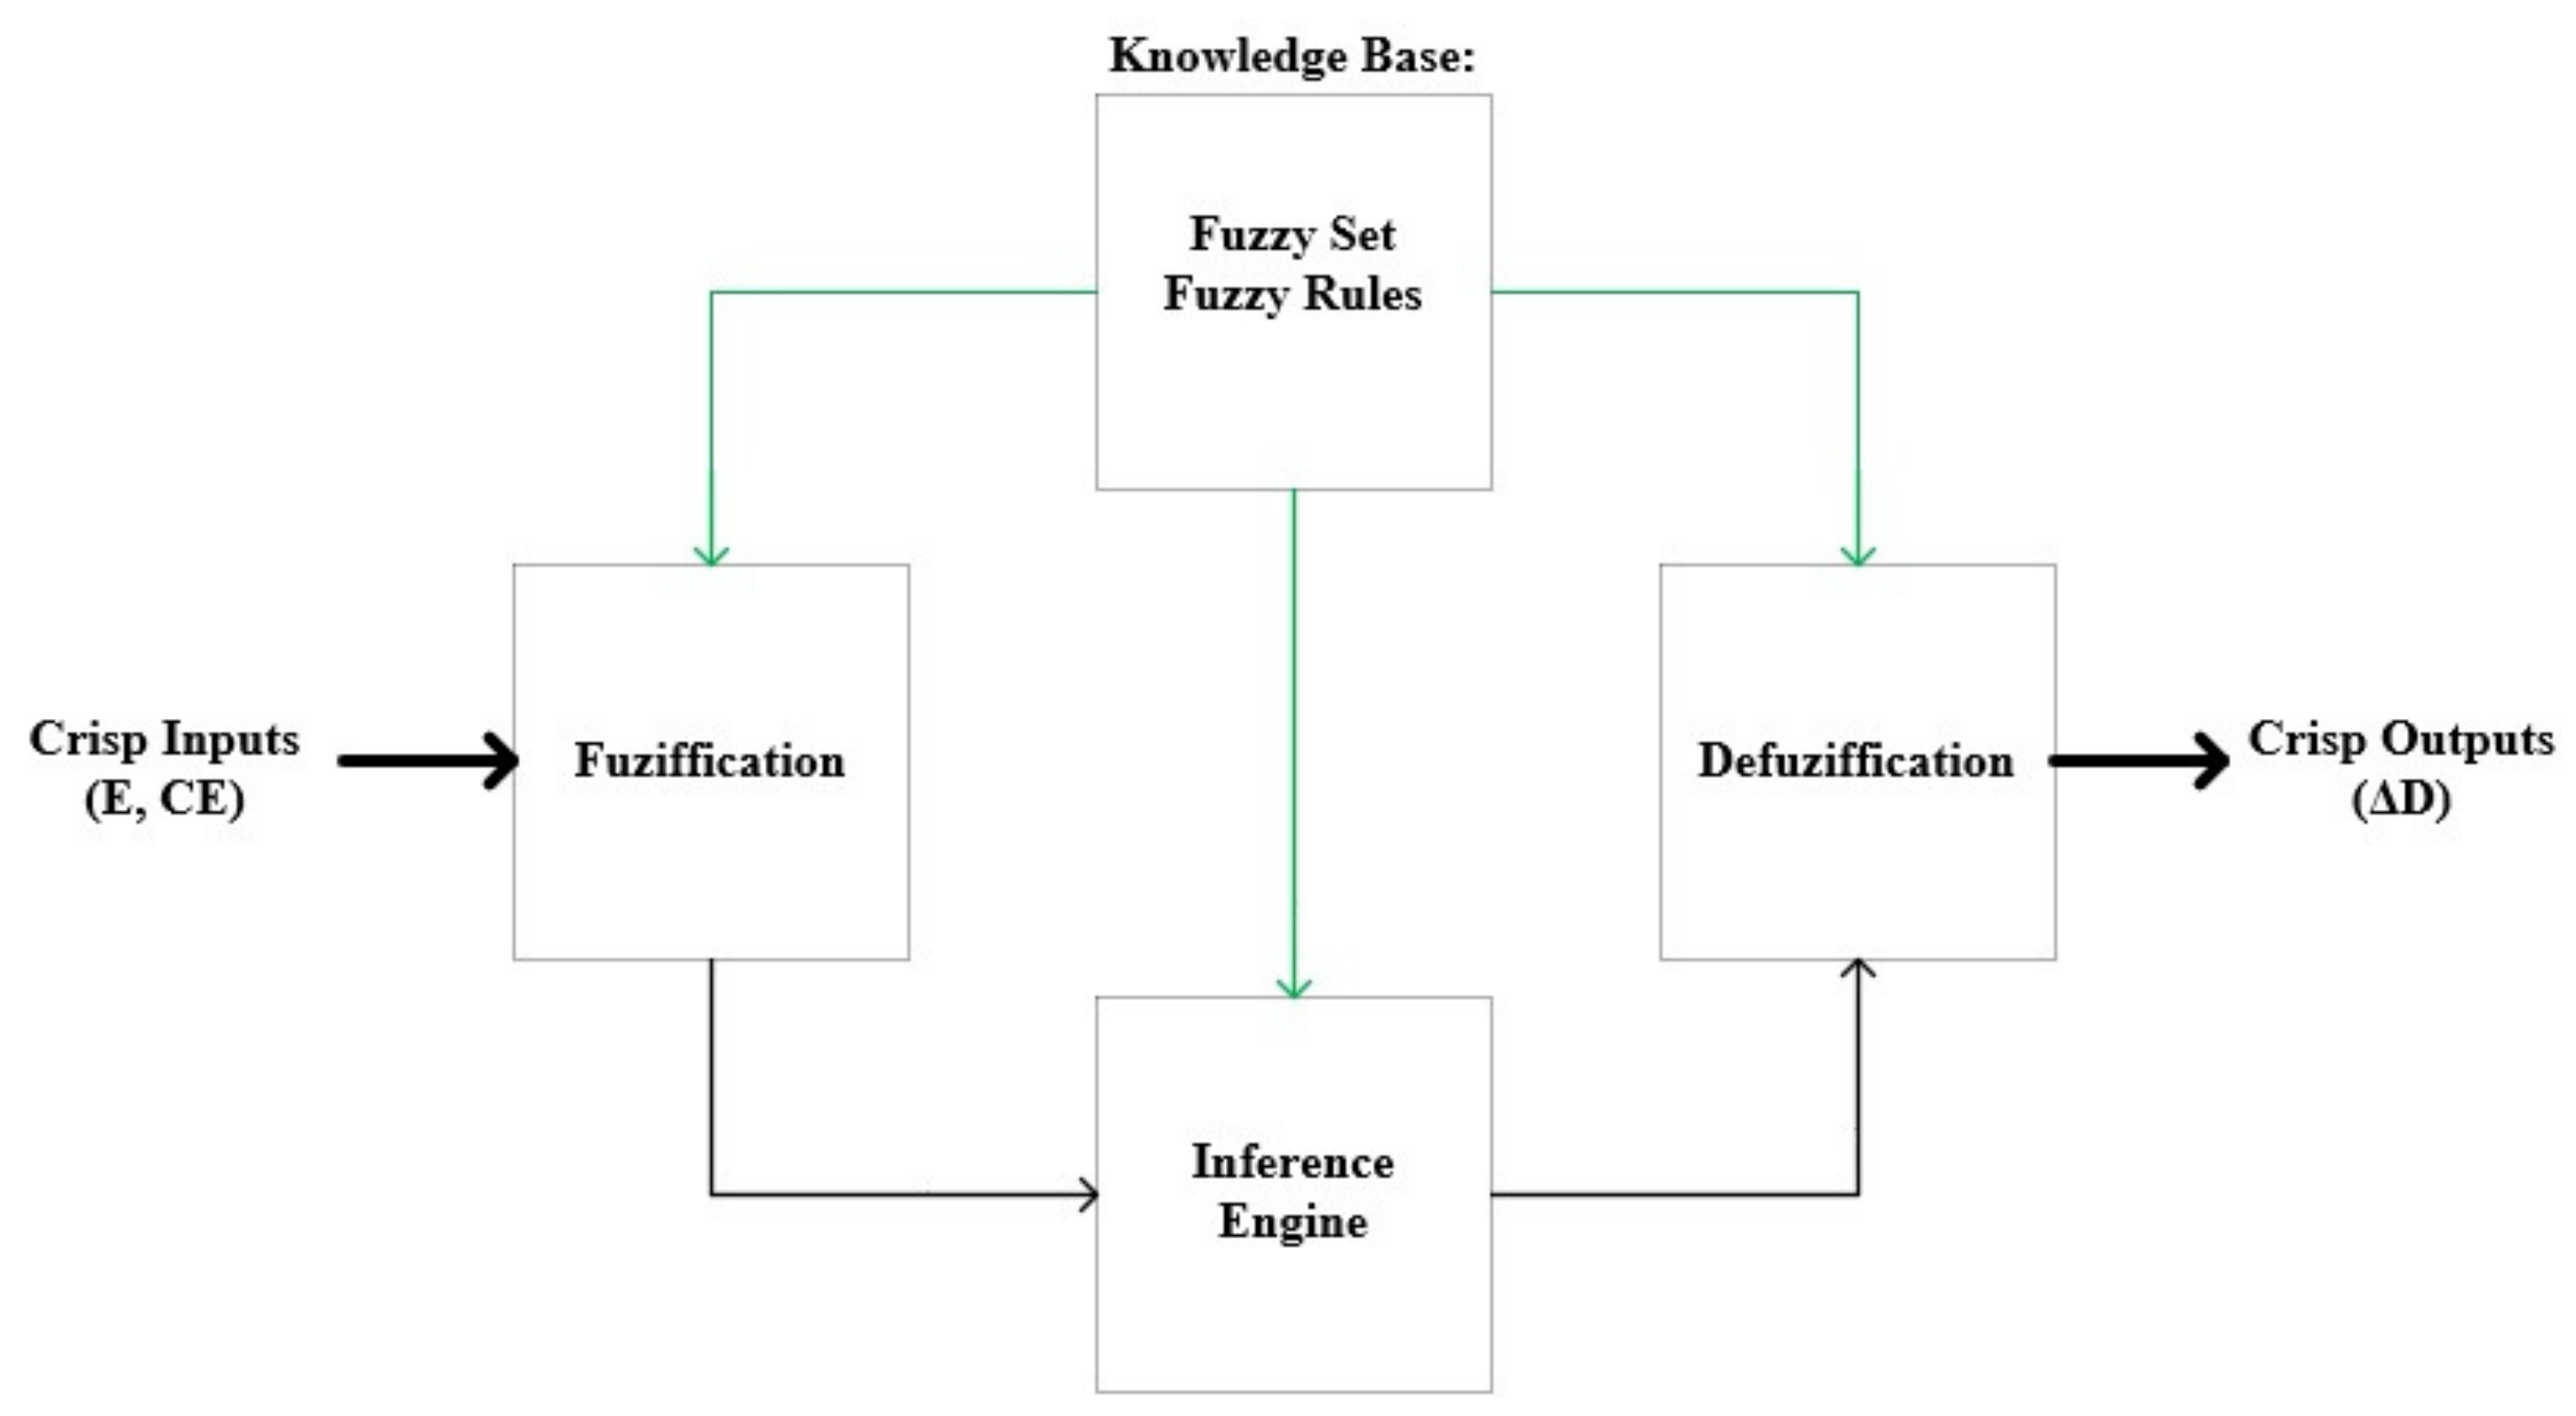
37]. The main steps of the FLC can be classified in three stages, fuzzification, inference rules and defuzzification. These steps and the general architecture of the controller are presented in
Figure 12.
The first step, named fuzzification, involves taking Crisp Inputs and combining them with stored membership functions, assigned to each input, to produce fuzzy inputs. After this step, the controller must take real time inputs and compare them with stored membership function information, in order to generate its input values. For the proposed FLC, the inputs are the error (
E) and change of error (
CE), at a moment
n, which are obtained by Equations (
5) and (
6).
To obtain
E, the change of the output voltage and output power of the
PV panel should be calculated through Equations (
7) and (
8), respectively.
where Vpv(
n) and Ppv(
n), are the measured output voltage and the power of the
PV panel at the sample time
n. At the first step simulation, both the output voltage and the power have an arbitrary value to initialize the system.
As it was explained in the
Section 3.1, the change of the output voltage and output power are used to determine if the duty cycle should be either increased, decreased or remain the same. In order to solve this limitation, the FLC will allow a variable value for the step size, that will be determined by the membership functions and the inference rules, which leads to a system performance increases, both in steady state conditions and in the response to the changing environmental conditions.
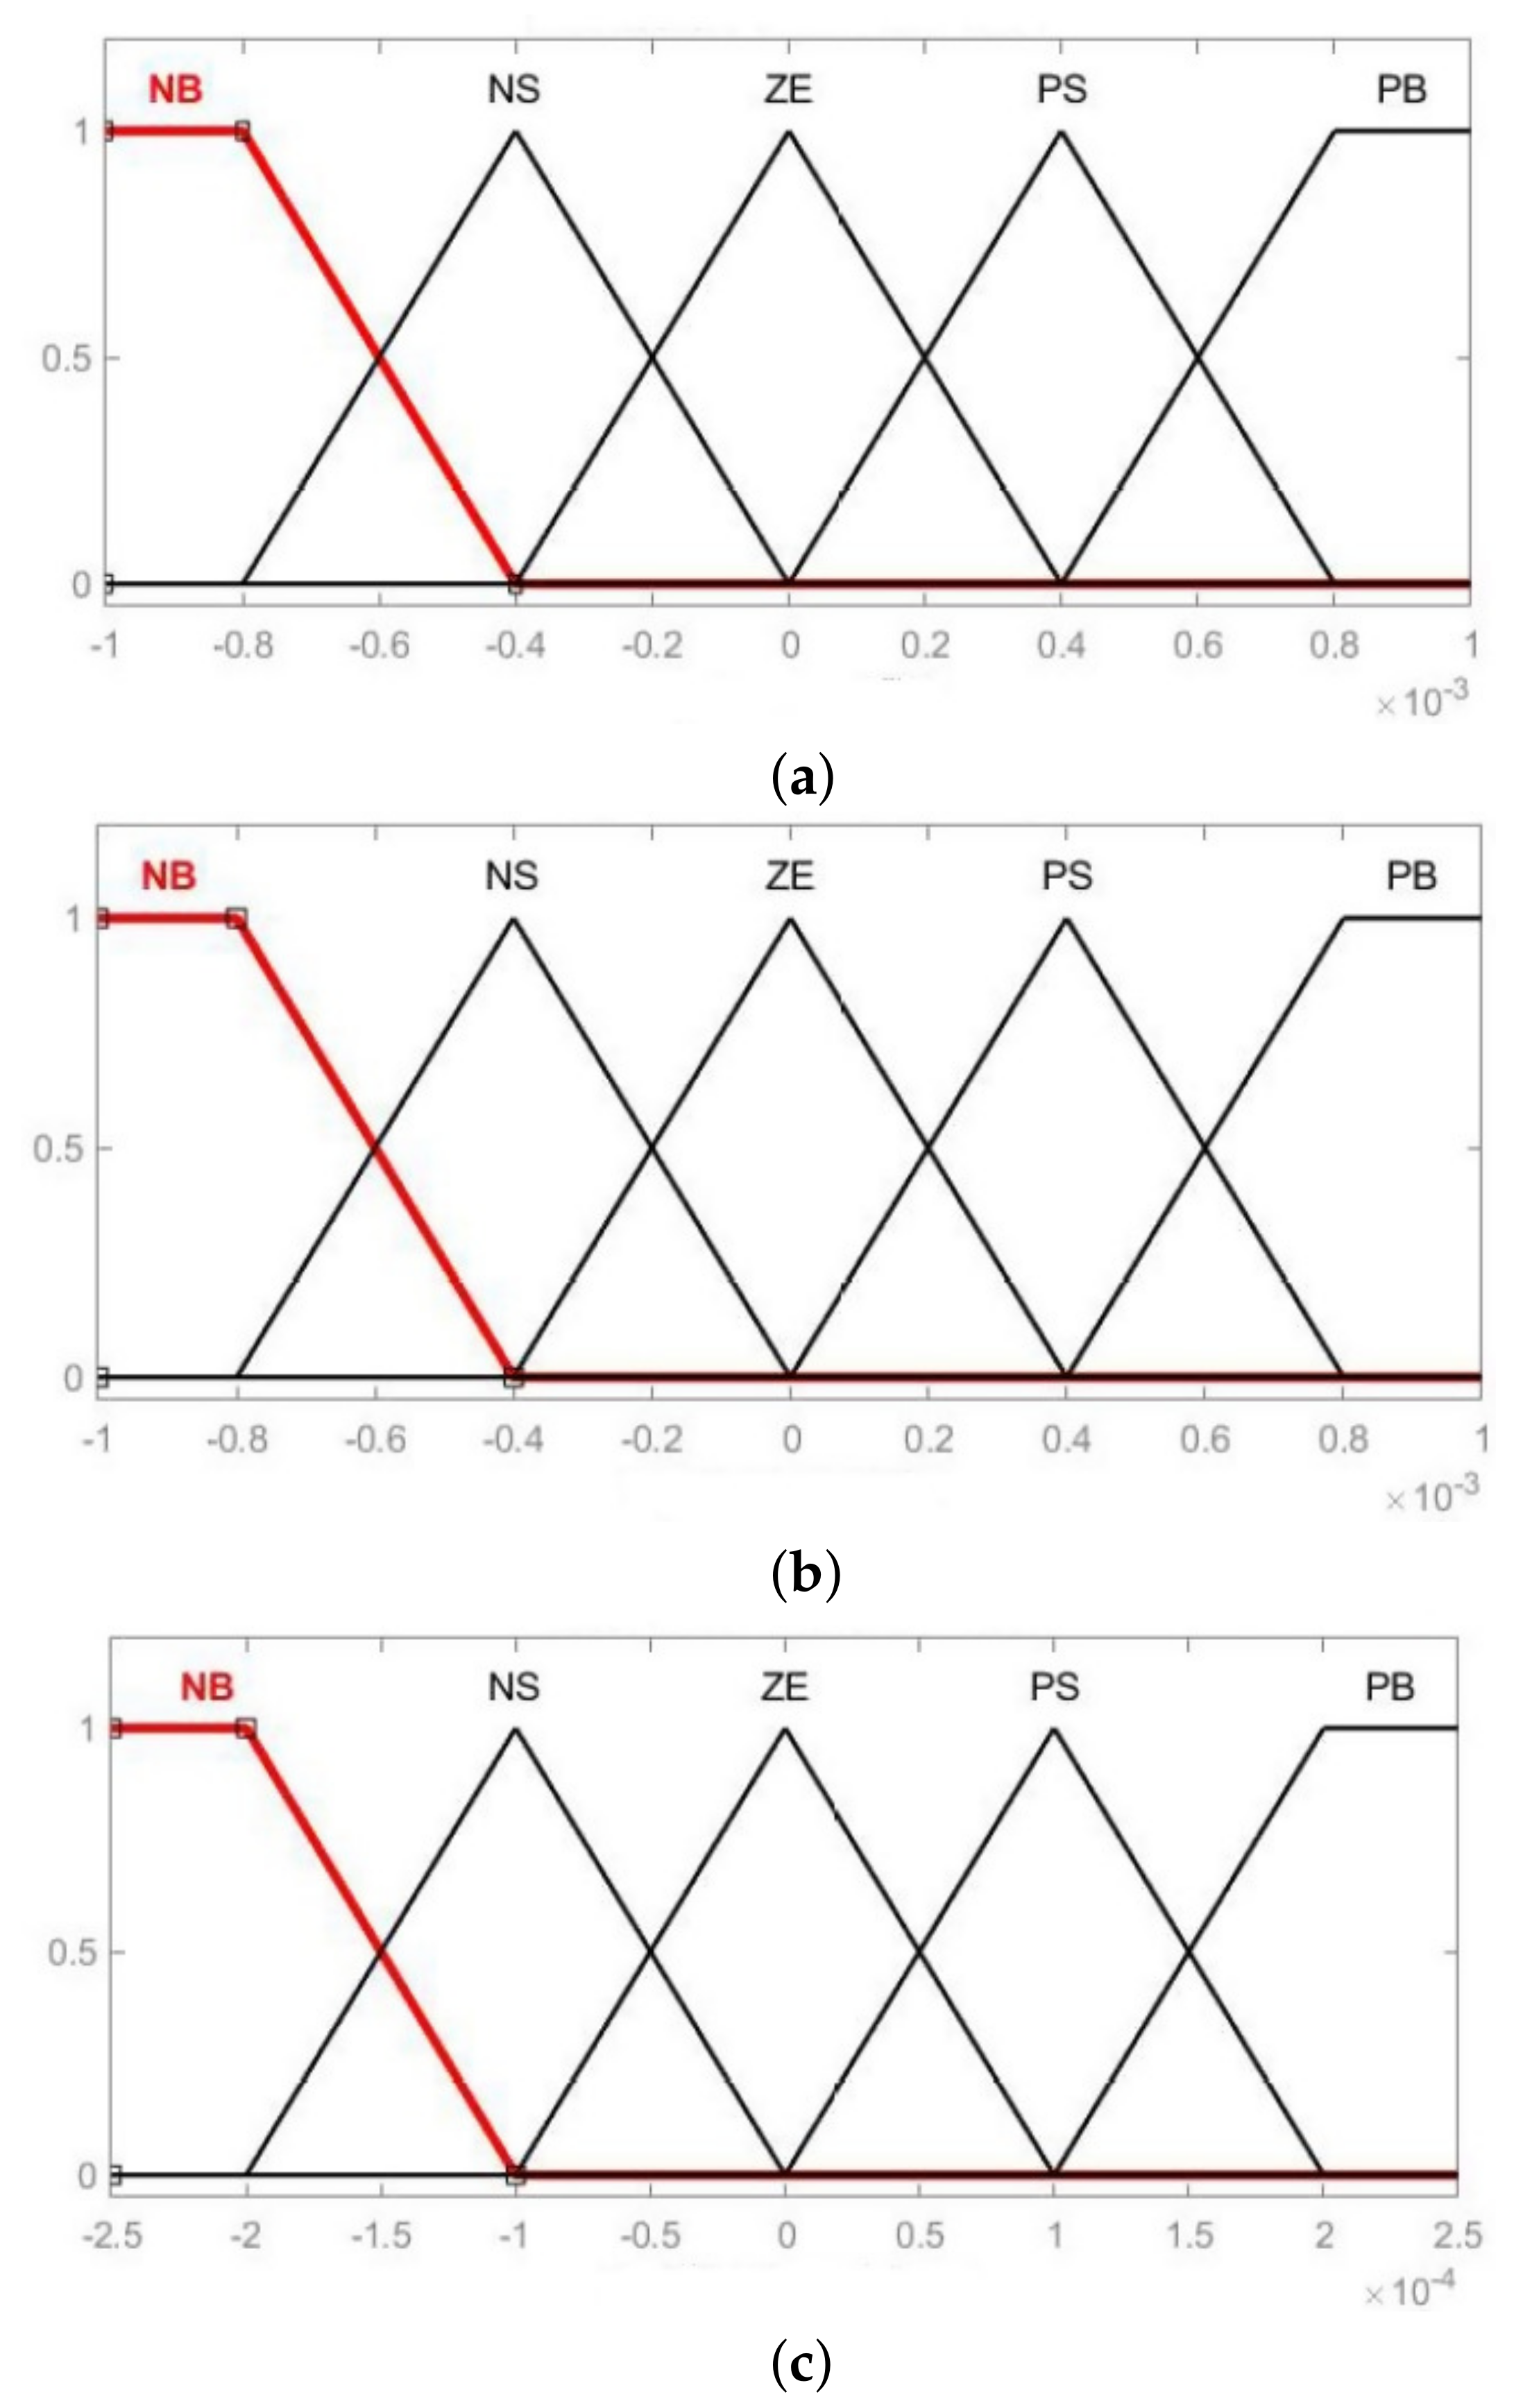
The values of the membership function are assigned to the linguistic variables, using five fuzzy subsets: NB (Negative Big), NS (Negative Small), ZE (Zero), PS (Positive Small), PB (Positive Big). The shape of the membership function and the partition of the fuzzy subsets, which can be adapted to appropriate the system, are shown in
Figure 13.
The second step is the inference rules, which can be divided in two components, the rule base and the inference engine. In this stage the fuzzy processor uses linguistic rules to determine which control action should occur, based on a set of input values. The rule base is a collection of if-then rules, that contain all the information for the controlled parameters, that are set according to both the operation system control and professional experience. The fuzzy logic algorithm that will be implemented, contains 25 rules that are listed in
Table 4.
The inference engine aims to reach a logical decision, based on the fuzzy rule setting and transforms the rule base into a fuzzy linguistic output. The fuzzy inference method used in this paper, will be Mandani’s fuzzy inference method [
38]. The result of this step, is a fuzzy output value adjusted for each type of needed action.
The last step is defuzification, when the fuzzy output values are modified by their membership function, resulting in Crisp Outputs. For this system the defuzification technique used is center of gravity method, resulting in the output duty cycle. This technique when applied to the already presented rule system, gives the duty cycle change based on equation results (
9).
The value of Equation (
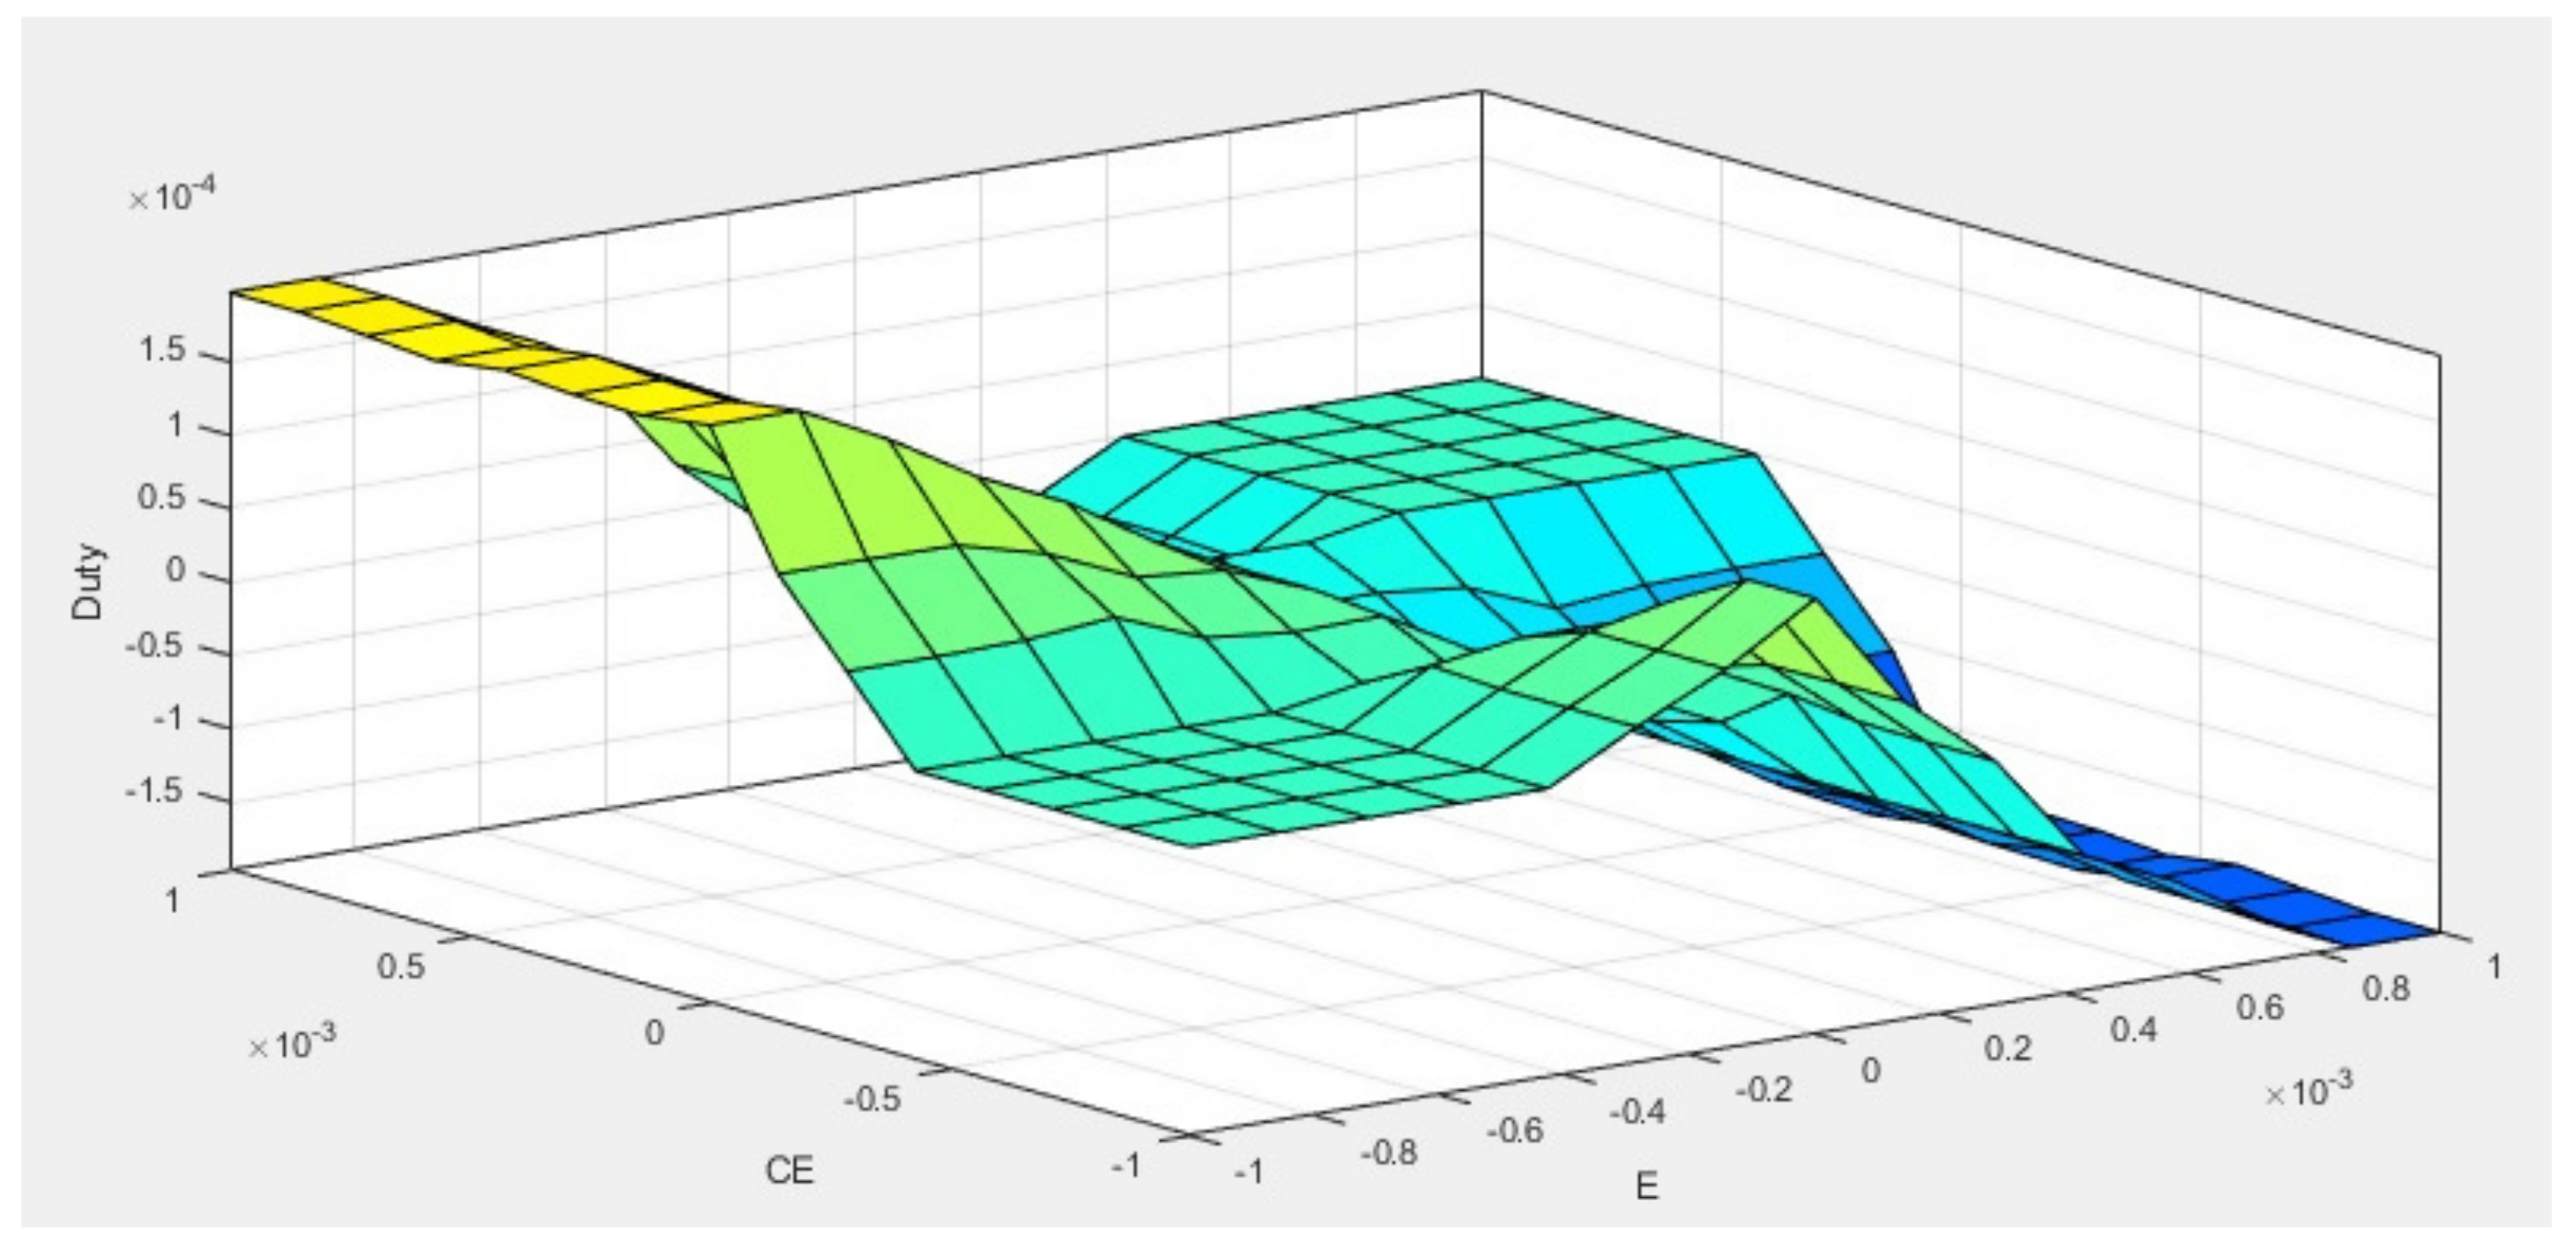
9) represents the change of the previous duty cycle, in order to adjust the duty cycle value according to the system needs. The final duty cycle will generate a PWM (Pulse Width Modulation) signal, to control the IGBT switch of the boost converter. The change of duty cycle values is more versatile compared to the traditional P&O, where the step size is fixed, so it is expected that this controller will adapt faster to the changing environment conditions and achieve more stable parameters at steady state conditions. A general control rules overview of the proposed FLC controller is presented in
Figure 14.
4. Results and Discussion
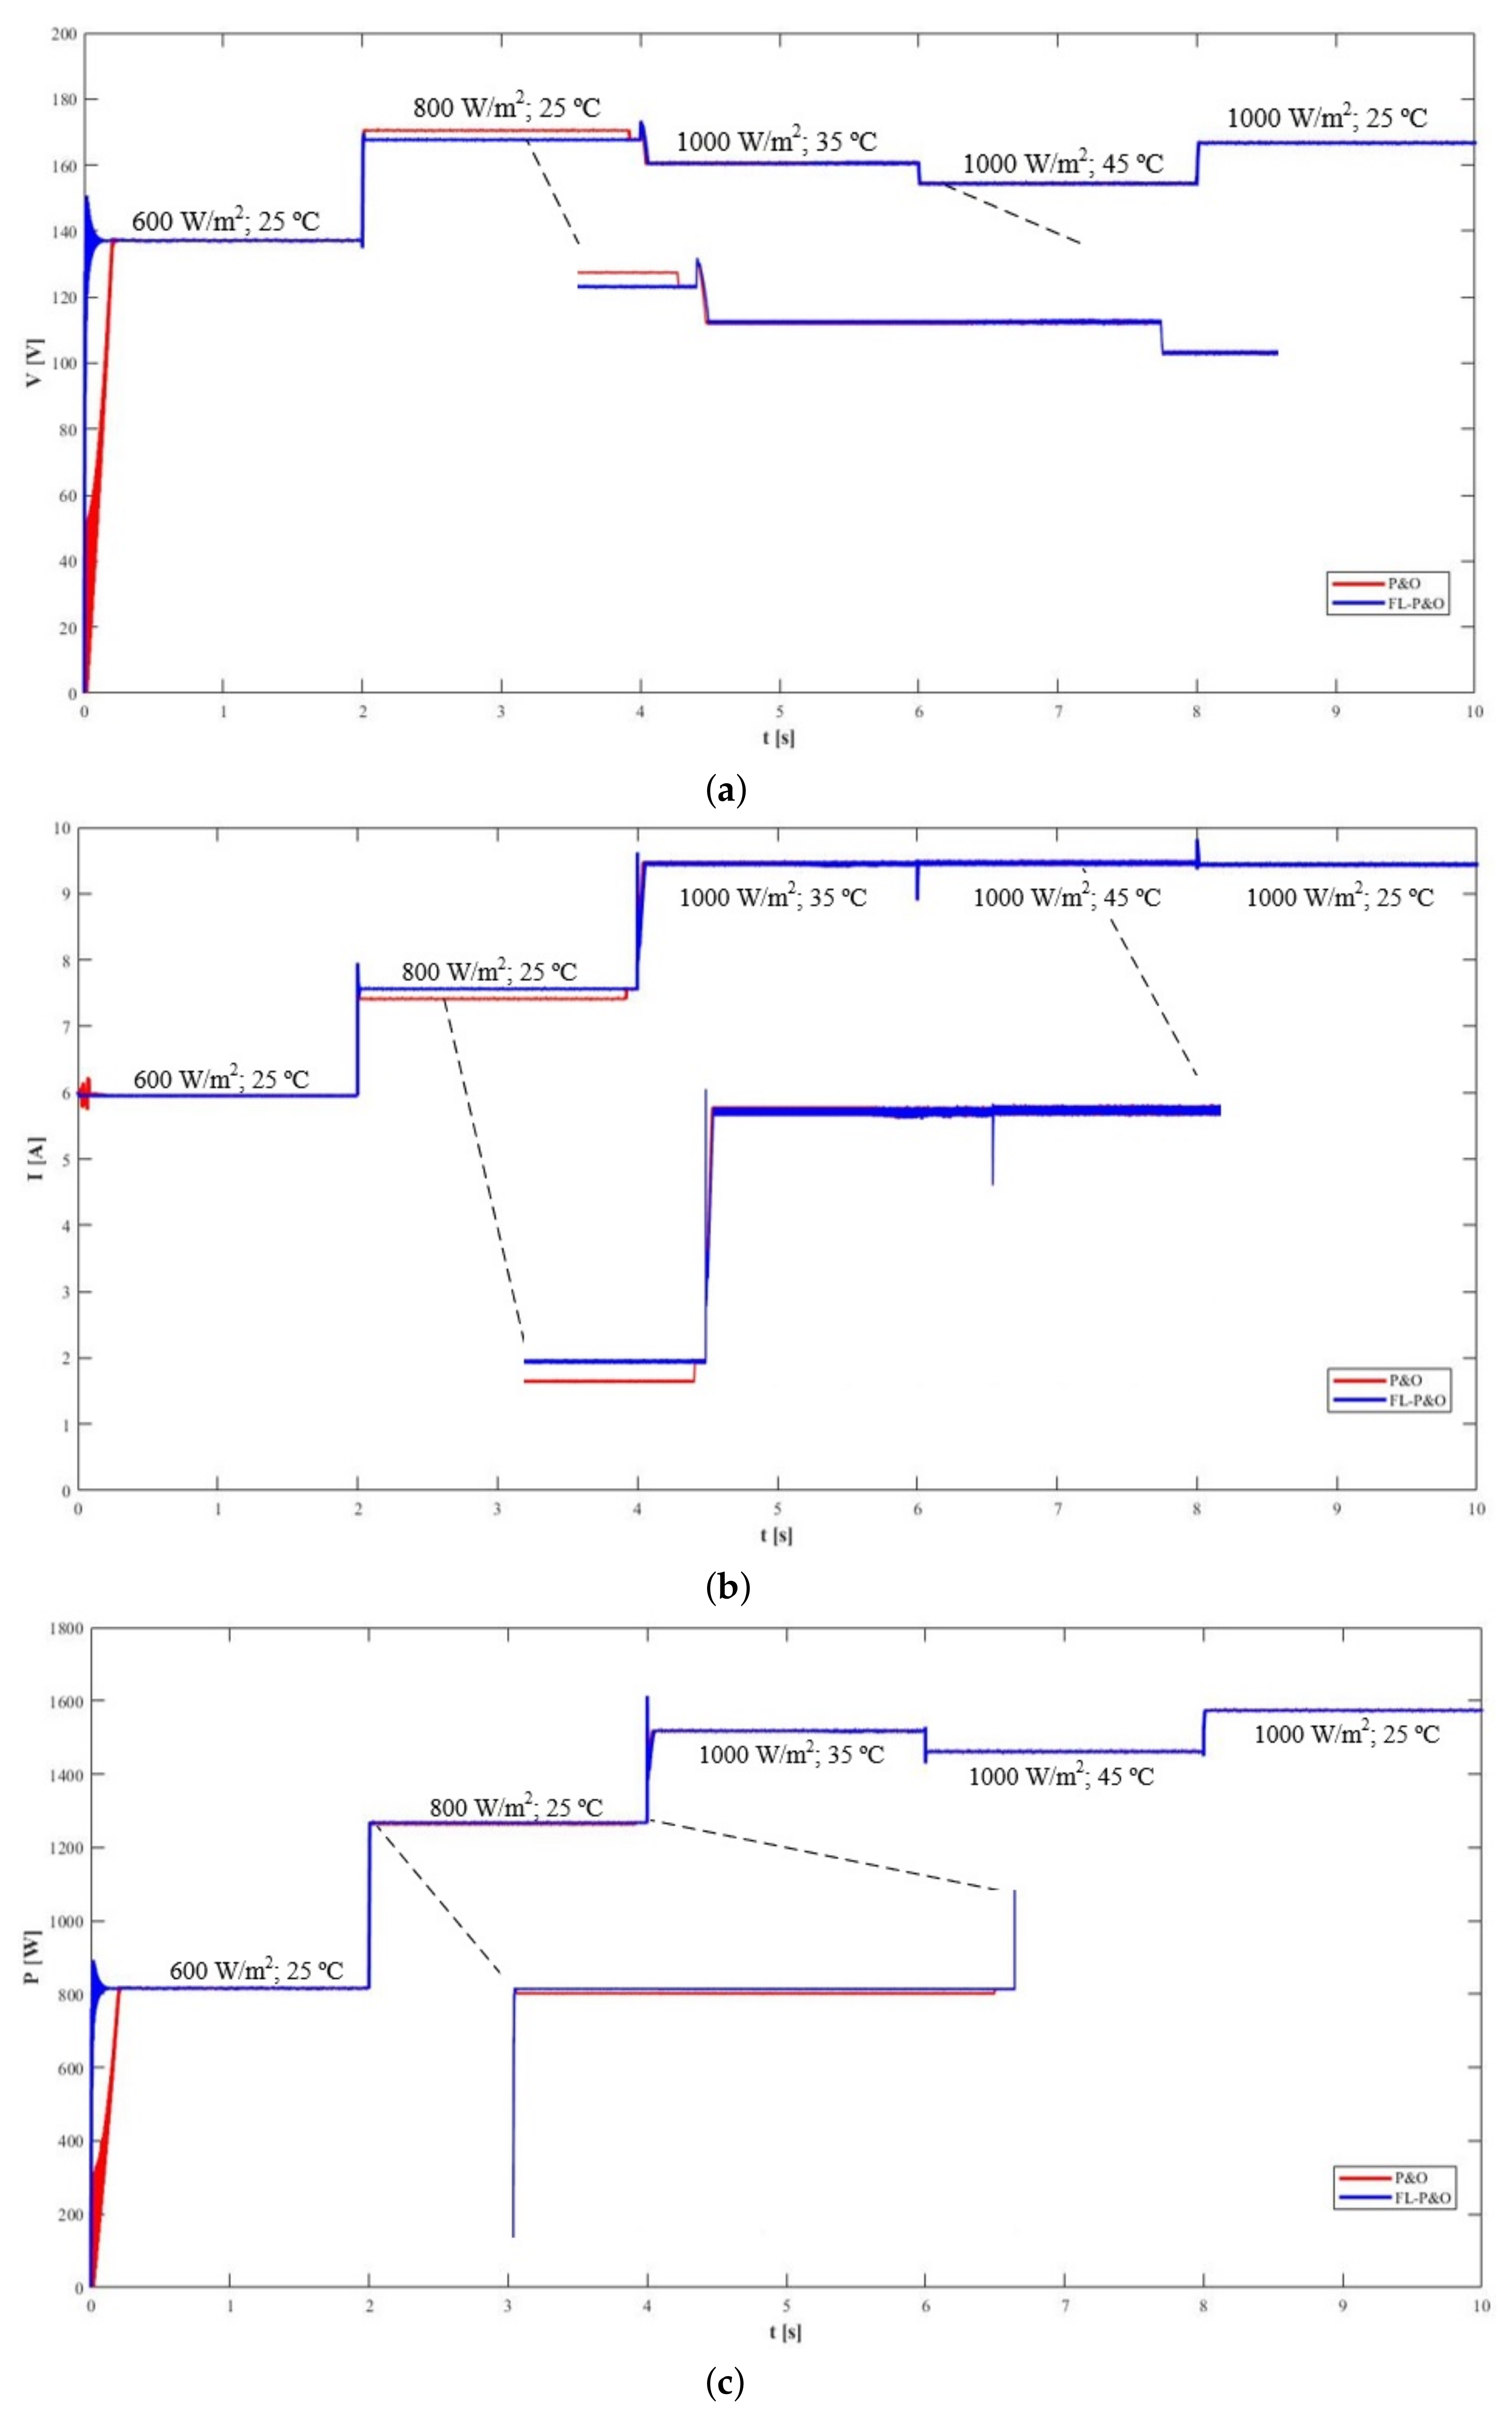
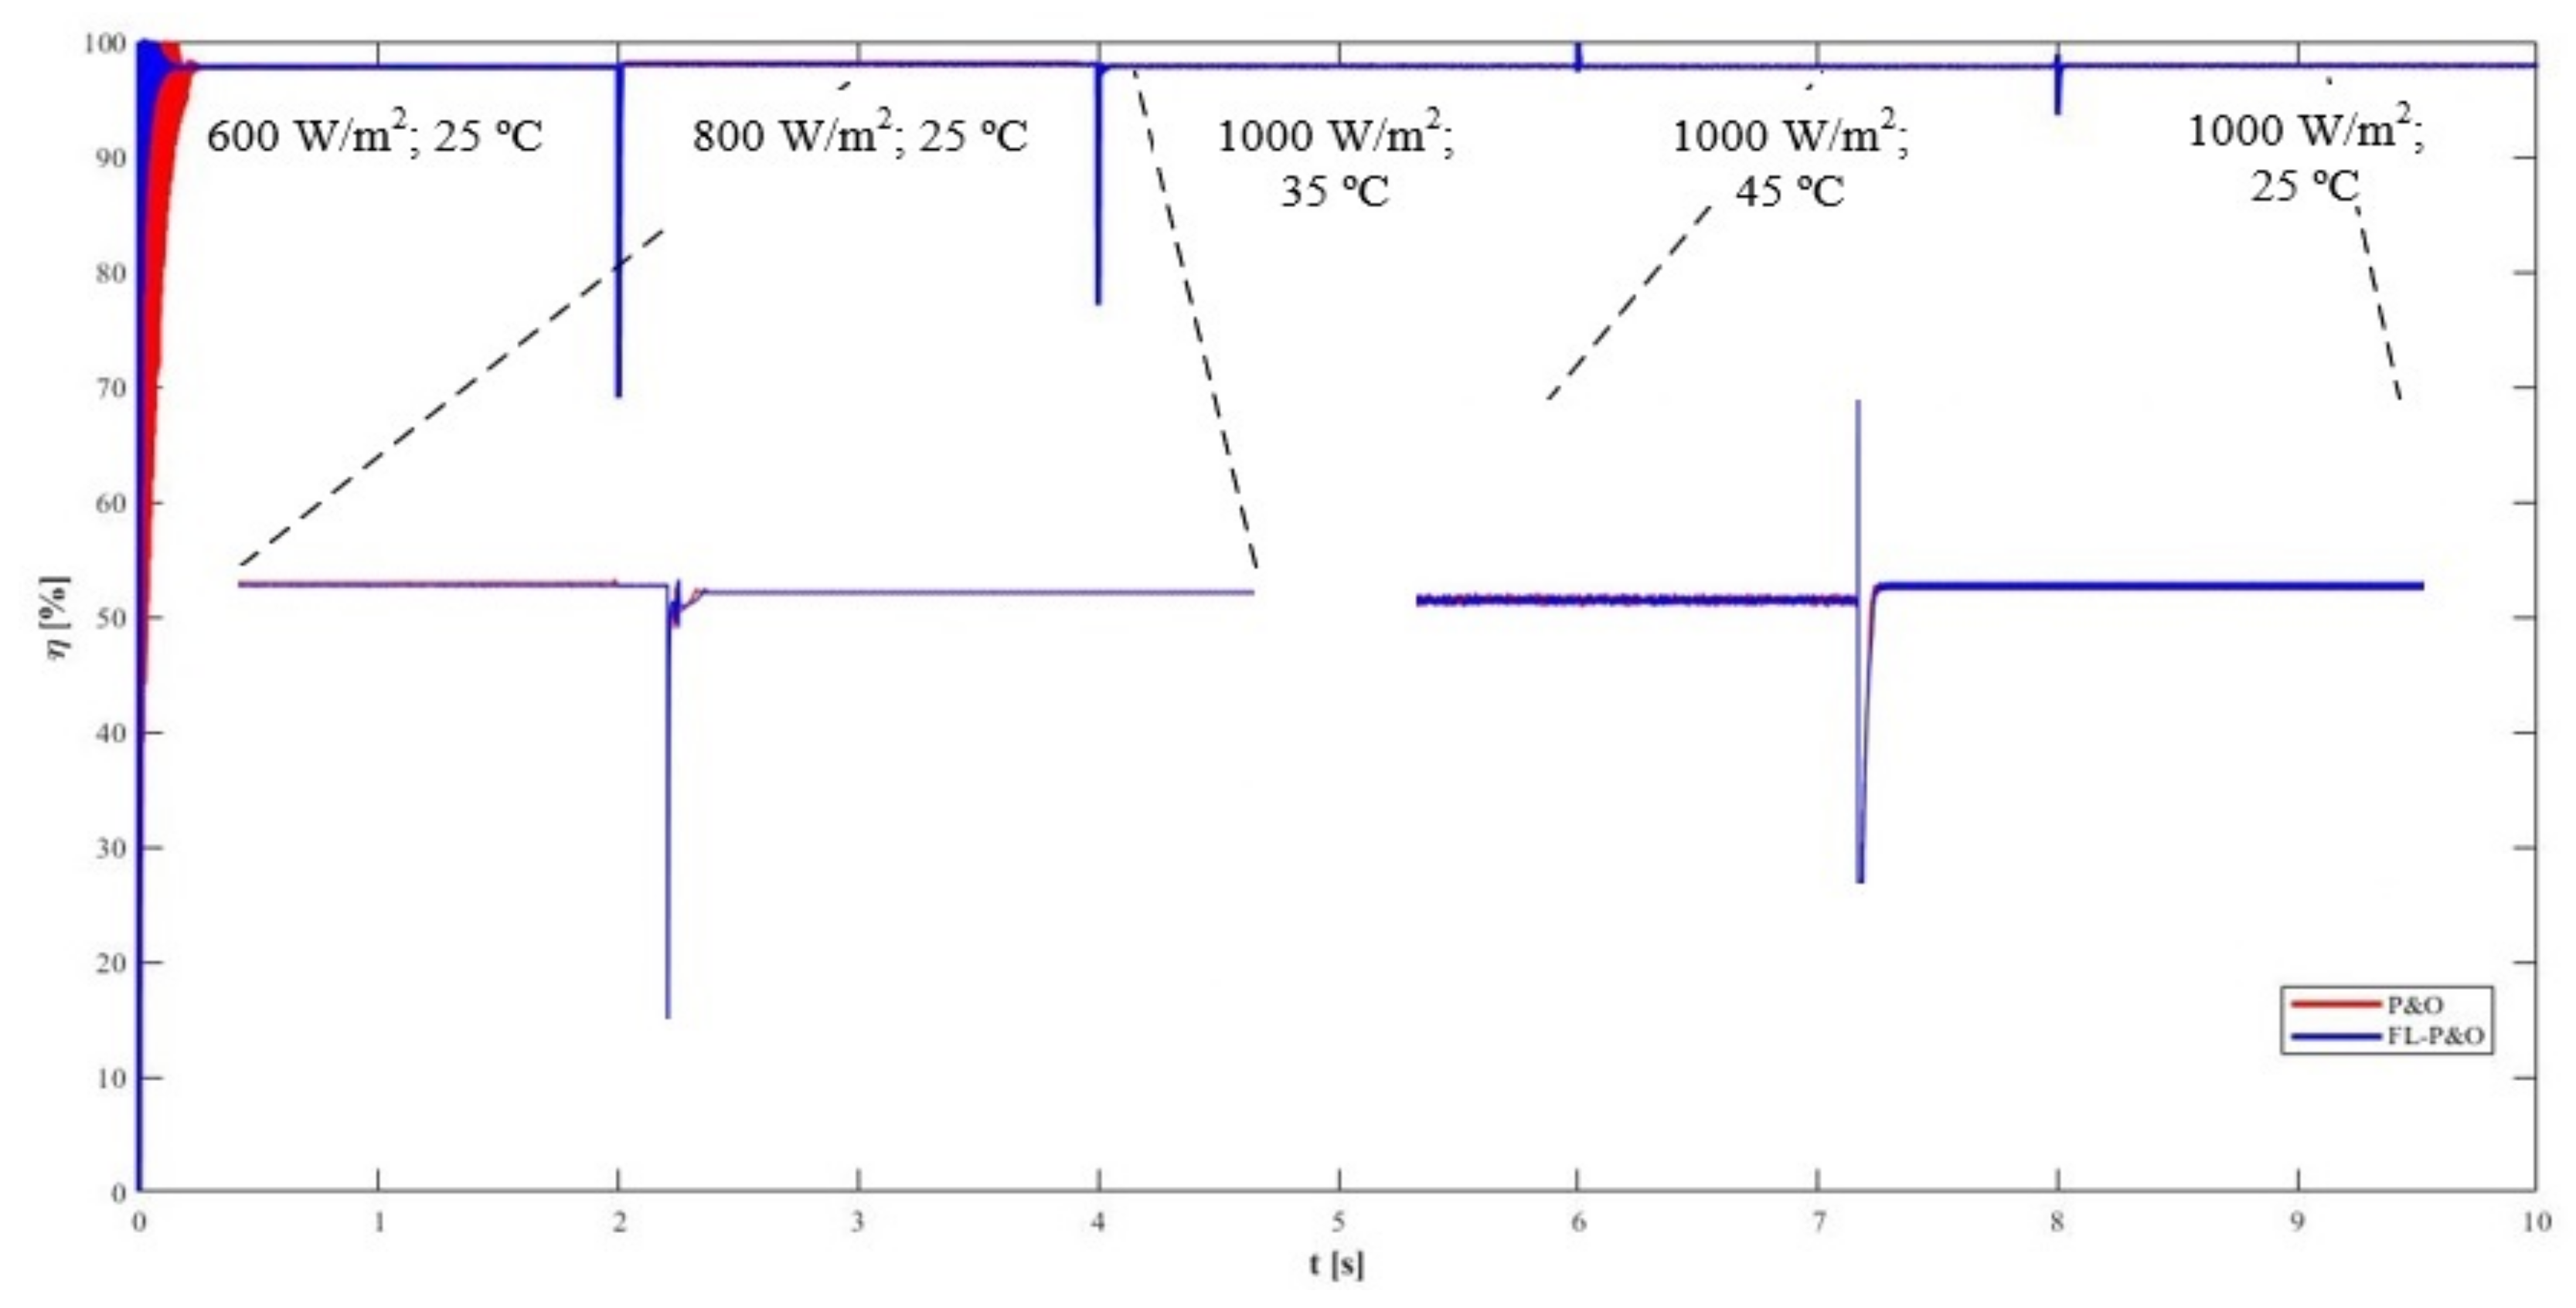
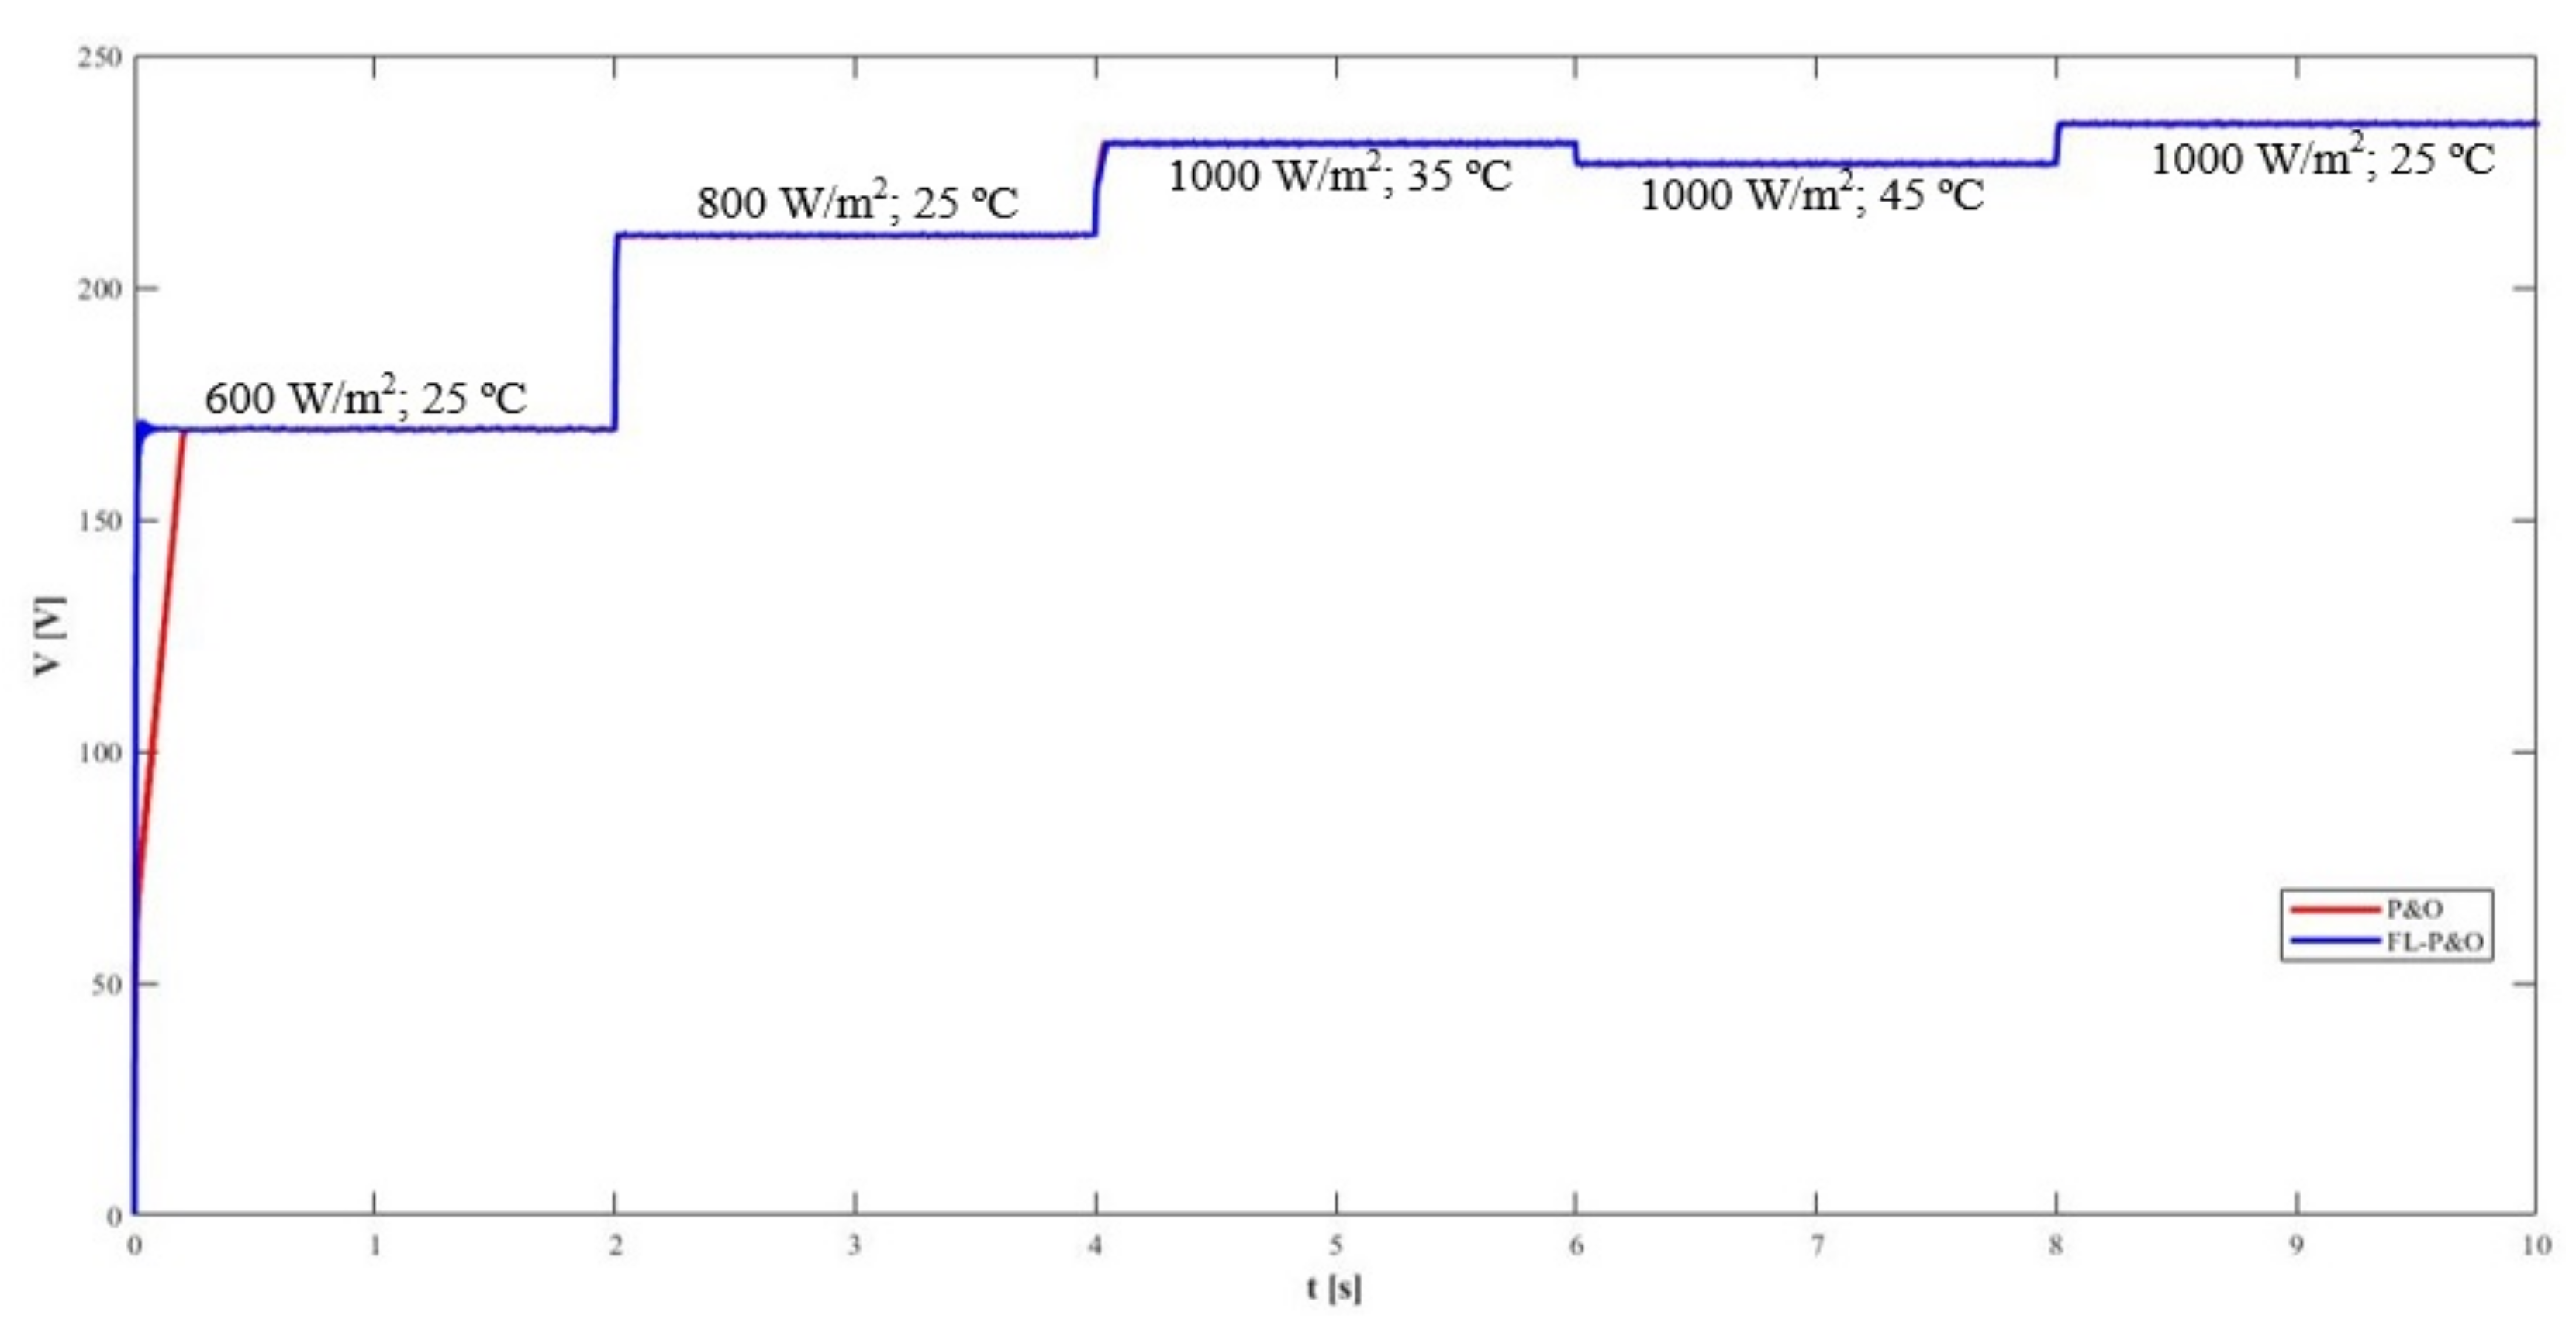
A dynamic simulation of a solar PV system using the traditional P&O controller and a PV system using the fuzzy logic enhanced P&O (FLP&O) controller, has been carried out to analyze the parameters: input voltage, current, power, efficiency and output voltage of the converter. The first three parameters were chosen to verify how close to the MPP values each algorithm is. The efficiency parameter was chosen to conclude, if an algorithm achieves a significantly higher efficiency and the output voltage was chosen to verify, visible oscillations exist at the output converter. The obtained results are presented in
Figure 15,
Figure 16 and
Figure 17.
As can be seen in the figures above, the P&O algorithm needs more time to stabilize at the beginning of the simulation. In the interval that starts at 2 s, this becomes clearer, as the FLP&O stabilizes in a point where the generated power is higher than the point where the P&O initially stabilizes, this means that this controller reached the correct MPP faster than the traditional algorithm. When both attain the MPP, the oscillations are the same or slightly lower for FLP&O as it can be seen mainly in
Figure 16, due to the efficiency value being more stable. A higher fixed step size should have been used, to more clearly show the improvements that FLP&O can present in reducing oscillations at MPP in the steady state conditions. These results show that the adaptive step size makes the proposed fuzzy logic enhanced P&O controller more stable at steady state conditions, faster to adapt to changing environment conditions and consequently more efficient, since less losses occur when trying to reach a new MPP, compared to the traditional P&O.
From the simulation results, it was possible to notice that the biggest peaks were obtained when only the solar irradiation was increased, which lead to greater difficulties in reaching the MPP when the environmental conditions reach the steady state. In the interval between 4 and 6 s, both solar irradiation and the ambient temperature changed and the traditional P&O algorithm had an easier time to adapt and achieve the correct MPP, compared to the previous intervals. Therefore, changing only the solar irradiation leads to a higher difficulty for the P&O controller to adapt and a more noticeable lower performance, when compared to the proposed fuzzy logic enhanced P&O controller, in addition to this, the fuzzy logic enhanced P&O controller found correctly the MPP almost immediately, leading to higher generated energy.
It was also noted that the current and the output voltage, always rise when the irradiation increases, and when the temperature increases, the value of the input and output voltage is lowered. The current value is unaffected by the temperature variation, leading to lower generated power since the voltage decreases when the temperature increases, which is justified by the lower convection losses due to higher temperatures, which negatively impact the PV system performance. In accordance to the observed patterns, as expected, the last interval that begins at second 8, which has the lowest simulated temperature and highest irradiation, produced the maximum generated power. The environment conditions of this specific interval, are the same as the test conditions for the PV panels, with a 1000 W/m
solar irradiation and an ambient temperature of 25
C, so the generated power, the input current and the voltage of the boost converter should be nearly equal to the MPP values presented in
Table 1 of
Section 2.1, which is corroborated by
Figure 15.
It is very hard to directly compare the results obtained for the proposed algorithms, to other works since each work has a converter with different parameters and studies the performance of the PV systems in different sets of ambient temperature and solar irradiation values. During this work it was noted that a capacitor with high value and an inductor with low value, positively impact the efficiency of the converter, so it is concluded that the best way to validate our results is to directly compare to the real model the converter is based on.
In both algorithms, the efficiency is always nearly the same except at the beginning when the values didn’t stabilize, for the traditional P&O the value is 97.71% and for the fuzzy logic enhanced variant the value is 97.82%, when in steady state both reach 97.90%. In both converters the value is almost equal to the 98% value, given by the manufacturer for the whole inverter [
25]. While the inverter also has a DC-AC converter after the boost converters as it can be seen in
Figure 4 of
Section 2.1, which means its efficiency must be slightly higher, but since it is close to 100%, any improvement in the model to reach a higher efficiency would be almost negligible and wouldn’t have a big impact in the obtained results. However, since the model performs almost equally according to the information given by the manufacturer, the model can be considered valid to study the parameters of a PV system, which adds further credibility regarding the results obtained for both controllers performances. In addition to this, the peak voltage and current values of the components (1000 V and 11 A, respectively), were never reached so the components of the converter can safely sustain the energy generated by the system.
The slightly higher efficiency obtained for the fuzzy logic algorithm, compared to the traditional P&O, is due to faster adaptability to changing environment conditions and better stability in steady state conditions. It is important to note, that the efficiency value doesn’t always translate to higher generated energy, as it can be seen in
Figure 15 and
Figure 16, in the interval between 2 and 4 s, the P&O controller reached the wrong MPP at first, while the fuzzy logic variant guessed it correctly immediately. Consequently the generated energy was noticeably higher in the system using the fuzzy logic enhanced P&O controller, despite the efficiency being nearly the same in this interval.
The proposed fuzzy logic enhanced P&O controller has improved the performance of the solar PV system both in steady state and in dynamic environment conditions, over the traditional P&O MPPT controller as summarized in
Table 5. These improvements lead to a higher generated energy, improving the system’s overall efficiency.
One of the biggest contributions to these results, is the fact that in the fuzzy logic enhanced P&O, the step size is not fixed unlike the traditional P&O, which enables the controller to more properly adjust the system to changing environment conditions (especially the solar irradiation change), reaches the faster correct MPP and also in improving the performance in steady state conditions, by minimizing the oscillations when MPP is achieved. This controller can thus reaches improvements in both dynamic and steady state conditions, contrary to traditional controllers using a fixed step size, in which it has to be done a trade-off between the performance in both conditions. While the traditional P&O study achieves a good performance in steady state conditions, thanks to its low fixed step size, due to this low fixed step size in dynamic conditions its performance is weaker compared to the fuzzy logic enhanced P&O, specially when only the solar irradiation value is changed. A working prototype of the converter must be built, to determine if the higher stability, faster adaptability and the higher generated power achieved by the fuzzy logic enhanced P&O variant, justify its use over the P&O considering other variables such as the ease of implementation, the cost of the prototype and computational resources needed.
5. Conclusions
This paper presents a study of the performance of a Solar PV system, using a controller with the traditional P&O and the proposed fuzzy logic enhanced P&O which is a P&O improved with fuzzy logic algorithm. The fuzzy logic increases the performance of the P&O algorithm, enabling the system to adapt faster to variable environmental conditions, leads to a MPP faster and an equal performance in steady state conditions when MPP is reached, leading to higher generated energy. This is mainly due to the duty cycle in the fuzzy logic enhanced P&O not having a fixed value, allowing the converter to have a smoother and faster adjustment to changing environment conditions and steady state conditions, fixing one of the problems of the traditional MPPT algorithms regarding the trade off between performance at steady state and changing environment conditions. The proposed traditional P&O achieves a similar performance in steady state conditions, due to its low fixed step size, but in dynamic conditions it takes a longer time to reach MPP and can guess it incorrectly, problems that were solved by the proposed FLC. This results in lower energy losses until the MPP is reached and consequently, higher generated energy.
The peak results obtained for the current and voltage, never reached the maximum of 11 A and 1000 V, respectively, defined by the dimensioned components and the r coefficient values which is between 0.3 and 0.6, as recommended by the state of the art.
It was concluded that a big increase in the solar irradiation value, creates the biggest peaks in the measured values and the system has a higher difficulty to reach the MPP. The increases in the ambient temperate, lowers the voltage output and input of the converter, while the solar irradiation increases, increases the input current, as such the biggest value of the generated power was obtained in the last interval, where the solar irradiation had the highest and the temperature the lowest simulated value, out of the analyzed conditions.
The sudden increase in solar irradiation is than the most critical environment condition, affecting the performance of the MPPT algorithms since every time there was only an increase of this parameter, the traditional P&O either had a slow response (first two seconds), or had an incorrect guess of the MPP value (second interval) and thus clearly showing how the proposed fuzzy logic enhanced P&O, can improve the performance of the solar PV system by effectively solving these problems.
Both algorithms achieved a converter efficiency around 98% for the boost converter, the same as the value given by the manufacturer for the complete inverter, which means the value should be higher. While since it is close to 100%, any improvement would be practically negligible so the model can be considered valid for the study of the PV system.
As a future study, the creation of a test prototype is recommended, to verify if adding variables such as ease of implementation and cost of the prototype, mean fuzzy logic enhanced P&O should be used, or just the traditional P&O. It is expected that the fuzzy logic enhanced P&O requires more programming knowledge and computational power, although it isn’t expected that the circuit board will be significantly changed, since both algorithms only directly control the voltage and power at the output of the PV panel. During this work it was also noted that the values of the inductor and the capacitors have a big influence on the results obtained for the performance of the boost converter such has its efficiency, so it is also recommended as a future study to analyze the impact different values of these parameters have on the overall performance of the PV system.
