Abstract
E-commerce has boosted in the last decades because of the achievements of the information and telecommunications technology along with the changes in the society life-style. More recently, the groceries online purchase (or e-grocery), has also prevailed as a way of making the weekly shopping, particularly, the one including fresh vegetables and fruit. Furthermore, this type of virtual shopping in supermarkets is gaining importance as the most efficient delivery system in cost and time. Thus, we have evaluated in this study the influence of the cooperation-based policies on costs and service quality among different supermarkets in Pamplona, Spain. Concerning methodology, first of all, we carried out a survey in Pamplona having the purpose of modelling the demand patterns about e-grocery. Second, we have developed an agent-based simulation model for generating scenarios in non-cooperative, limited cooperation, and full cooperation settings, considering the real data obtained from the survey analysis. At this manner, Vehicle Routing Problems (VRP) and Multi Depot VRPs (MDVRP) are dynamically generated and solved within the simulation framework using a biased-randomization algorithm. Finally, the results show significant reductions in distance driven and lead times when employing horizontal cooperation in e-grocery distribution.
1. Introduction
During the last decade, consumers’ shopping habits have drastically changed, not only because of the massive incorporation of new technologies into our lives but also because of a greater awareness of environmental and social sustainability, growing urbanization, and time pressures. The outcome is a challenging scenario mainly driven by the increment on demand for e-groceries (i.e., the online purchase of groceries, including fresh products) because of an exceptional development of e-commerce. As a consequence of this paradigm shift in consumption, companies have also adapted to this new order by adopting proactive sustainable strategies and developing sustainable supply chain management practices. However, and despite the complexity that features the growing demand, the existing literature does not demonstrate the challenges of the field, especially those related to the logistic process. Further, despite the promising development of the e-grocery business, the lack of interest in developing cost-effective operations is also evident in companies, since there are only a few e-grocers which have made progress on leading to profitable operations [1,2]. Thus, the challenges in e-grocery logistics include from a wide-range of food safety-related issues to differences in storage temperatures, including perishability over time [3]. In addition, environmentally responsible customer profiles must also be considered, who demand consumption of local products [4]. Note that, considering these consumer requirements, it is more than likely that consumers’ wishes differ from the seller’s desires. While consumers usually prefer products from a close origin with long date of expiry [5], sellers would benefit from shipping first items with shorter shelf lives in order to reduce food waste [6].
In fact, many researchers recognize the strategic importance of sustainability as an essential aspect in the supply chain management [7,8]. It is widely accepted that sustainability cannot be achieved by companies in isolation, and that requires the involvement of supply chain members [9]. Reinforcing the same idea, Soosay and Hyland [10] plead that supply chain members operate in more dynamic environments, characterized by globalization, rapidly evolving technologies, and increased customer responsiveness. Therefore, more integrative and cooperative efforts are required to reach the aforementioned supply chain characteristics. Likewise, horizontal cooperation may be paramount when meeting the requirements of demand and sellers in an efficient and sustainable way, for example, improving efficiency in logistics. Therefore, the partnering sellers aim at increasing productivity through close cooperation, for example, by optimizing vehicle capacity utilization, reducing empty mileage and cutting costs of non-core/supporting activities to increase the competitiveness of their logistics networks [11,12]. At this manner, Cruijssen et al. [13] have enumerated the potential benefits of cooperation as follows: (i) reduction of cost of transportation; (ii) improvement of service quality by reducing operation times and lost goods; (iii) diminution of environmental and social impacts; (iv) mitigation of risks; (v) and enhancement of market share. Consequently, extrapolating the previous benefits, horizontal cooperation might be particularly interesting for e-grocery, where a wide range of customers are widespread in big cities or in rural areas, which generates long empty backhauls after deliveries. In this regard, load factors can be improved by means of cooperation (i.e., supermarkets sharing their logistics operations) to reduce empty backhauls.
Accordingly, the main contributions of the this paper can be summarized as follows: (i) modeling the demand patterns about e-grocery (including ordering frequency, preference of supermarket, and delivery windows); (ii) an agent-based simulation model for generating scenarios in cooperative and non-cooperative settings, considering the real data obtained from the survey analysis, and (iii) the integration of Vehicle Routing Problems (VRP) and Multi Depot VRP within the simulation framework.
The remainder of the paper is organized as follows—Section 2 reviews concepts related to e-groceries, Horizontal Cooperation, and Agent-Based Simulation. Section 3 contains information about the geographical scope of our experiments, including the details of the survey and the main insights. Section 4 describes the simulation model, the cooperative protocols, and the routing algorithms. Section 5 presents the results of our simulation model. Finally, Section 6 summarizes the main findings of this paper and points out some future research lines.
2. Literature Review
This section presents an analysis of the literature regarding topics that are addressed in this work: e-groceries, Horizontal Cooperation, and Agent-Based Simulation.
2.1. e-Grocery
Nowadays, online shopping has become a key element for reaching the development and proper operation of our society. According to Fraser et al. [14], the electronic commerce (e-commerce) is the process of trading goods, information, or services via computer networks including the Internet. This concept is included within a wider concept (e-business), that refers to any business operation developed by means of information networks (i.e., customer services and knowledge sharing). Hence, this change in consumer habits has impulsed many traditional sellers to adapt their operations and business strategy to be adapted to more competitive scenarios. This situation has generated new challenges related to the e-commerce integration—the customization in order to be competitive enough, a sustainable logistic process (i.e., guarantee the optimum provisioning and delivery of goods), and a company internationalization [15]. Similarly, this change in the supply chain value needs to be accompanied by procedures and methodologies that help to: (i) reduce the transaction costs, (ii) facilitate just-in-time production strategies, (iii) boost short delivery-times, (iv) and improve information gathering and processing. Focusing on e-groceries, it refers to the purchase or acquisition of products by internet that provides relative convenience to the consumers, since they can obtain the required groceries from the comfort of their homes or offices and at a convenient time [16]. Regarding sellers, two types of retailers can be distinguished: the ones that have their own vehicle fleets for regional delivery, and the ones that ship nationwide via parcel delivery services. Furthermore, the first group of retailers presents the competitive advantage of having specialized vehicle fleets for different requirements and offering small time windows, although featuring local narrowness [17]. As a consequence, some sellers within this first group are not delivering any refrigerated food, making additional grocery shopping necessary (with the associated risk of losing clients). Therefore, it is in this context where horizontal cooperation plays an important role for survival of small retailers within the marketplace.
All this complex new system have led some authors, such as Wilson-Jeanselme and Reynolds [18], to study the preferences of consumers who demand these services. In particular, they find out that ordering, product quality, time, and reliability in the delivery process are the most important characteristics to know the client preferences to decide the purchase timing and the bought product. But, the design of a sustainable e-grocery service, in both economic and environmental terms, involves not only the consideration of those multiple attributes, but also a market segmentation based on the consumers’ preferences knowledge. Similarly, the development of a precise service offer, enhancing the quality service (i.e., punctual delivery) is another key aspect of the sustainable e-grocery distribution.Thus, Ellinger et al. [19] have highlighted the importance of collaboration between logistics and marketing. Reinforcing the same idea, Seidel et al. [20] and Boyer et al. [21] show that being able to balance the desires for short delivery time-windows, that are more attractive to consumers (marketing desire), with longer delivery windows, which produce more efficient routes (sellers desire), can improve the outcome performance of the e-grocery service and foster the positioning of the seller within the marketplace.
As a result, some authors, such as Fikar et al. [22], have designed and implemented a simulation and optimization-based Decision Support System (DSS) that can help decision-makers in developing e-grocery sustainable operations and proper service offers (e.g., perishability management or safety related issues). For addressing this topic, the most common methodology is the Vehicle Routing Problem (VRP) and its variations (e.g., the Capacity Vehicle Routing Problem (CVRP) or the Vehicle Routing Problem with Backhauls (VRPB)). For example, Emeç et al. [16] designed a mathematical program for efficient delivery services of online groceries to fulfill a diverse consumer demand without incurring in additional inventory costs. That model is based on a distribution network in which the goods are acquired from an external set of vendors, sited at multiple locations within the supply network, and delivered to consumers in a single visit in an e-grocery environment. Furthermore, Hornstra et al. [23] introduced the VRP with simultaneous pickup and delivery, and managerial costs. In this work, the fleet of vehicles operates from a single depot for serving all the orders, which considers a delivery and a pickup demand such that all delivery items originate from and all pickup items go to the depot. Finally, it is important to mention that the increment in the popularity of this new type of good consumption has helped to reduce the carbon footprint in urban areas [24]. Note that, this is one of the reasons of its success along with its excellent results when it is managed by means of horizontal cooperation [25].
2.2. Horizontal Cooperation
Recently, new characteristics related to the current economic status quo, such as strong competition in global markets, introduction of products with shorter life cycles, or heightened customers expectations, have forced companies to invest in developing stronger and mutually beneficial relationships between them. This collaborative-sharing process usually involves multiple companies or autonomous business entities engaging in strategic relationships. Consequently, they can share improved outcomes and benefits [10] in supply chain in inter-organizational and inter-functional stages [26]. In this context, Bahinipati et al. [27] refers to horizontal cooperation as a set of actions developed by the partnership of several companies within the same supply chain level and oriented to improve their outcome in economic and sustainable terms. Lambert et al. [28] defined horizontal cooperation as a business-oriented relationship that is based on mutual trust, commitment, and openness, in which the main goal is to foster competitive advantage in the marketplace (i.e., assuming that the cooperative outcome would be greater than the one achieved in solitary, promoting the positioning within the market).
The partnering aims at increasing productivity through close cooperation, that is, small and medium enterprises could act as large enterprise, and consequently, would increase their benefits from economies of scale. For example, optimizing vehicle capacity utilization, reducing empty mileage, and cutting costs of non-core/supporting activities to increase the competitiveness of logistic networks [11]. According to Cao and Zhang [29], the main cooperative advantages and the most desired synergic outcomes are the strategic benefits gained over competitors through partnership, that enables inventory centralization and ordering. In the same line, Nooteboom [30] depicted that some of the expected results of the cooperative process are: (i) efficiency in the exploitation of resources; (ii) development of new competencies along with strengthening of the production capacity; and (iii) better positioning in markets.
However, some problems are expected to may arise in the process [31]—inequality in power distribution, where less powerful partners are likely to feel discriminated against; or the appearance of opportunism and dysfunctional disputes, because partnering firms are competing for the same customers. Nevertheless, as Rindfleisch [32] pointed out, these problems emerged within the same supply chain level are supposed to be lower in intensity, since companies usually do not rely on the output of partners for developing their core activity.
2.3. Agent-Based Simulation
Agent-based models (ABMs) are computational simulations in which artificial entities interact over time within customized environments [33]. That means, ABMs try to reproduce individual processes of movement, behavior, birth, growth, and death according to a set of information, such as genotype, history, and location of agents (i.e., crucial components of the analysis). Furthermore, ABMs permit an unequaled control and some statistical power by allowing to specify the behavior of any number of agents and observe their interactions over time. In this scenario, an agent is considered an actor who plays a role within a given environment and who functions independently (i.e., according to the nature and behavior of other agents, responses can vary too) from other agents (i.e., settlements, people, political entities or companies, among others). In order to be able to respond to this dynamic system, agents have protocols or mechanisms that describe how they interact with other agents, having themselves their own characteristic idiosyncrasies [34]. Moreover, an agent is an identifiable, discrete individual with a set of characteristics or attributes, behaviors, and decision-making capability which can be considered as a particular individual [35]. Also, agents are adaptive in that they respond to their environment through learning and evolution and are autonomous in that they control their own goals, states, and conducts [36].
In addition, ABMs present an ideal framework for social simulation that helps to specify causal mechanisms, that is, models that simulate not only individual behavior but also social interaction that characterizes society development and criterion [37]). Considering the aforementioned approach, ABMs are present in the literature in a wide variety of fields, such as economics [38], sociology [39], political science [40], or artificial intelligence [41]. Their use is widespread in modeling human social and organizational behavior and individual decision-making [42,43], where individual and group behavior, social interaction, and collaboration, among others, are main actors. This trend seems likely to continue in the same line, so their implementation will become frequent in geography and in urban and regional planning [44].
According to Macal and North [45], the main reasons for popularity in the use of agent-based modeling are: (i) the current systems that need to be analyzed and modeled have become in complex systems in terms of interdependencies, and accordingly, traditional modeling tools may not be as applicable as they once were; (ii) ABMs present an answer for those systems that always have been too complex to be represented (i.e., economic models); (iii) the collection process is finer now (i.e., individual-based simulations); and (iv) computational power is advancing rapidly. Nowadays, it is possible to compute large-scale microsimulation models that would not have been plausible just a few years ago.
3. The e-Grocery Demand Analysis in the City of Pamplona (Spain)
The interest of analysing the e-grocery demand in a medium sized city is three-fold. Firstly, the e-grocery penetration is lower and customers’ characteristics heavily differ from those in large cities [46]. Secondly, the transportation infrastructure is usually poorer than in large cities, which makes transportation activities less efficient [47]. Thirdly, the literature review has revealed a lack of research focused on small and medium cities, being large cities the center of attention in most of the research. Therefore, the geographical scope of our experiment is Pamplona area in Northern Spain, which includes a population of about 250,000 inhabitants. Figure 1 shows the location of the city in Spain and demand and supply points, where purple dots stand for demand locations and hexagon marks stand for the selected supermarkets for the experiments.
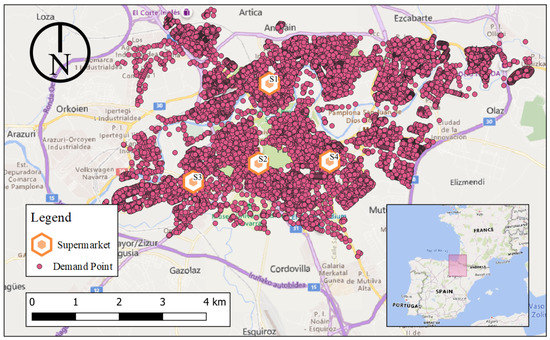
Figure 1.
Survey geographical scope, customer and supermarket agents, and Pamplona location in Spain.
A survey was distributed in the area for gathering e-grocery demand information in the time period from 1 February 2020 to 31 March 2020. The questionnaire was compounded by three blocks of questions. An introductory section, aimed at collecting socio-economic information such as age, gender, and economic status, among others. This section is particularly interesting because it introduces the topic to analyse and focuses the survey on e-groceries. Therefore, the main objective of that section is to clarify what we refer to the e-grocery demand. The second section is intended to gather the e-grocery information. It contains questions related to the supermarket preference, the type of product, the frequency of shopping online groceries, and the expense made on e-grocery. Finally, the third section is focused on the logistic part of the e-grocery service. Therefore, the questions here referred to the day of the week, as well as the preferred time window for the delivery. The selection procedure was based on simple random sampling using the e-mail. For this purpose, different mail distribution lists, for example, from the Council and the Public University of Navarra, were used for reaching the participants. All in all, we accounted for 182 observations.
Analysing carefully the survey, we can highlight the main aspects related to the e-grocery demand patterns in Pamplona. Firstly, there are four main supermarkets for ordering online. They are detailed in Table 1. Thus, we will use these four supermarkets for our simulation model. Secondly, most of the participants do not usually order groceries online. About a 25% of the total order e-groceries at least once a month. The frequency of ordering is provided in Figure 2. Third, delivery preferences are basically during the weekdays at the 19-22 h time window. The detailed delivery preferences are provided in Figure 3.

Table 1.
Preference for e-grocery supermarkets.
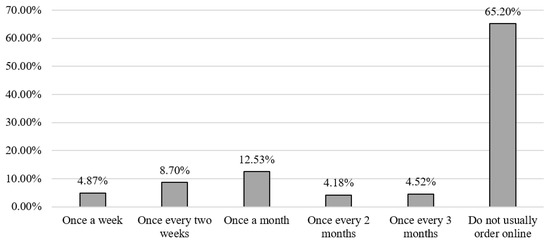
Figure 2.
E-groceries frequency ordering.
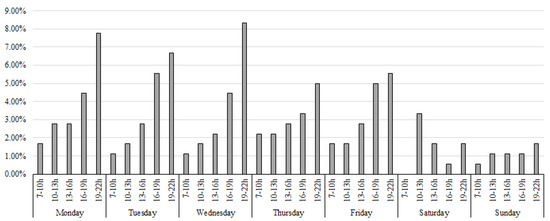
Figure 3.
E-grocery delivery preferences per day of the week.
With the information previously obtained, we can estimate the expected demand, that is, number of orders, for the considered supermarkets. These estimations, shown in Table 2, are the main input for our simulation model. In particular, we first computed the expected weekly demand at the last row. These figures were obtained by using the information in Table 1 and Figure 2. Since those computations and experiments have been calculated on a weekly basis, we use a discrete random variable, for computing weekly demands, associated to the customers ordering frequency as it is shown in Figure 2. The possible values of that random variable are: 1 for purchasing once a week, for purchasing once every two weeks, for purchasing once a month, for purchasing once every two months, for purchasing once every three months, and 0 for not ordering online. Additionally, we assume the study area accounts for households. We consider this a good approximation due to the fact that the Pamplona metropolitan area has around inhabitants and the average household size is around people [48]. Therefore, the expected weekly demand for any supermarket is obtained as the product of the random variable, its probability distribution function, and the number of households. Afterwards, the expected weekly demand is distributed among the time windows according to estimated probabilities drawn from the information in Figure 3.

Table 2.
Expected demand (number of orders) per time window and day of the week.
4. Methodology
For analyzing the impacts of horizontal cooperation on the urban e-grocery distribution we have developed an agent-based simulation model. This simulation model accounts for two populations of agents (i.e., the and the ) who interact in the Pamplona metropolitan physical environment. Additionally, the coalition of supermarkets is also included as an agent. This coalition agent includes the supermarket agents and the different cooperative protocols, including the non cooperative setting in which the supermarkets act independently. Thus, each generated entity, as agent in the simulation model, has its own parameters, variables and rules that describe its behavior in the environment. Actually, we chose an agent-based simulation approach because it allows to easily deal with complexity and interdependencies between and in cooperative and non cooperative settings [45]. As it is described in forthcoming subsections, the idea behind the simulation model is that place orders to their preferred choosing the time to receive their products inside a . Afterwards, the have to fulfill the orders using the cooperative policies or not, depending on the running settings. This simulation model takes the backbone of the previous work performed by Serrano-Hernandez et al. [49] and Serrano-Hernandez et al. [50] and adapts it to our research requirements. Thus, Serrano-Hernandez et al. [49] test horizontal cooperation for a number of geographical distribution settings for last-mile urban distribution in the city of Vienna (Austria). Similarly, Serrano-Hernandez et al. [50] investigate some trust-related issues when some coalitions between supermarkets chains are created. The main differences of our work in relation to the previous papers lie on the geographical scope, the real-life based input data, the definition of horizontal cooperation policies, and the solving algorithms for the resulting Vehicle Routing Problems.
The rest of this section is organised as follows. The key performance indicators for our simulation are described in Section 4.1. The particularities of the agent are further described in Section 4.2 and Section 4.3 for and , respectively. Section 4.4 describes the rules for the cooperative settings and Section 4.5 shows the simulation flow.
4.1. Key Performance Indicators
We used a bidimensional performance for evaluating the impact of horizontal cooperation. The first dimension is an economic indicator whereas the second one is related to service quality. They are further described in Figure 4.

Figure 4.
Key Performance Indicators for evaluating horizontal cooperation.
4.2. The Customer Agents
are represented by the cadastral information in the area using a geographical information system (GIS). They are the purple dots in Figure 1, which provide the location for each building of the constructions in the metropolitan area of Pamplona (Spain). Knowing the population of the city and the size of each household (its average is [48]), we assume that each building lodges 8 households. Therefore, in our simulation model, each demand point is replicated 8 times. Parameters and variables associated to each of the roughly demand points in the simulation model are related to the nature of the buyer, that is, whether it is an e-grocery buyer, and, if so, the preferred supermarket, the preferred time windows and day of the week for e-grocery deliveries, and the lead time from the beginning of the selected time window and the moment at which the products are delivered. Additionally, we assume that each customer has a service time of 3 min, where this time is considered as the temporal interval of making the physical delivery between the last mile distribution vehicle and the customer home.
4.3. The Supermarket Agents
We consider the top four e-grocery in Navarre, region where Pamplona is located in Spain, for our experiments, that is, Eroski (), Mercadona (), Carrefour (), and Dia (). Recall Table 1 for additional details. They are popular supermarket chains in Spain and offer a wide range of online groceries, including fresh vegetables and fruits. The locations of these supermarkets are shown in Figure 1. The parameters and variables associated to each supermarket consist in the list of customers to serve each day and time window, distance driven, and available fleet. The fleet is a critical part in the logistics performance of the company. At this manner, we assumed that each supermarket owns an homogeneous fleet with a capacity of 20 orders. Likewise, the size of the fleet has been determined with the expected weekly demand per time window, which is shown in Table 2. Considering all the submitted orders to the supermarkets per day, we have obtained an average value of , , , and orders for the supermarkets , , , and , respectively. Hence, knowing the aforementioned demand values, we assume that the fleet size is 4 vehicles for , 2 for and , and 1 for . The purpose behind this assumption is to have a fleet size correlated to the number of orders at each supermarket.
4.4. The Cooperative Protocols and the Routing Algorithms
We consider three scenarios based on the degree of cooperation. Each of them features an algorithm to solve the problem. They are described in the following subsections.
4.4.1. No Cooperation Scenario
If cooperation is not enabled, each supermarket will serve its customers in an independent way. Consequently, each supermarket has to solve as many Vehicle Routing Problems (VRP) [51] as time window slots it offers to design the orders distribution plans. We have implemented a heuristic algorithm to solve each VRP, which is based on a biased randomization solution procedure of Clarke and Wright’s Savings algorithm [52,53]. Thus, we have followed the instructions given in Grasas et al. [54] and Juan et al. [52] to design our own algorithm to solve the corresponding VRP. In this sense, we use the value for the skewed distribution (a truncated geometrical distribution) mentioned by Grasas et al. [54] with 1000 iterations as stopping criterion. The flowchart of the proposed algorithm is shown in Figure 5.
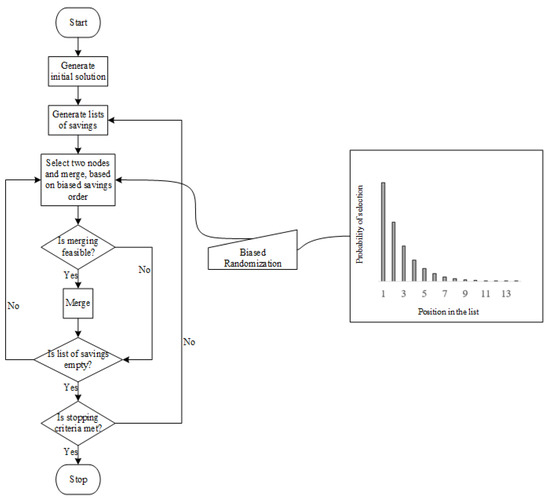
Figure 5.
Flowchart of the proposed algorithm for solving the Vehicle Routing Problems (VRPs).
4.4.2. Limited Cooperation Scenario
In the intermediate scenario of limited cooperation, companies in the coalition are allowed to share a given proportion of their customers for each logistic service, that is, each time window and day. The cooperative mechanism consists of creating a pool of customers that may be served from other companies in the coalition. We fix the quota for transferring customers to a 50%. Note that, it is based on time-distance (time to make the delivery in the real situation of traffic in a fixed time) to the chosen supermarket. Then, the customers are iteratively assigned to the closest supermarket until the pool of customers is empty. This process is illustrated in Figure 6 for a given time window, where companies transfer a total of 30 customers to the common pool. The initial contributions of each company in the example are 3 customers from , 15 from , 4 from and 8 from . Then, customers are transferred at different rounds until the pool of customers is empty. In this case, there are 3 rounds for assigning the customers. In the first round, the percentage of customers the biggest contributor (supermarket having the greatest number of orders in one day) may pick is bounded by the percentage corresponding to the smallest contributor. Since there are 3 rounds, the smallest contributor is assigned a 33% of customers per round, which means that each company should receive a 33% of their given customers per round. That gives 5 customers to the first picker, that is, . Recall that customers assignment is based on time-distance. Therefore, the 5 closest customers in the pool are assigned to . If the aforementioned proportions do not produce an integer number, as it is the case for and , then the number of assigned customers is rounded up. This process is repeated until all the customers are assigned in forthcoming rounds. Then, the resulting VRP is solved using the biased randomization procedure described in Figure 5. Finally, when customers are served, they are reassigned to the chosen supermarket and this process is restarted for the next time window.
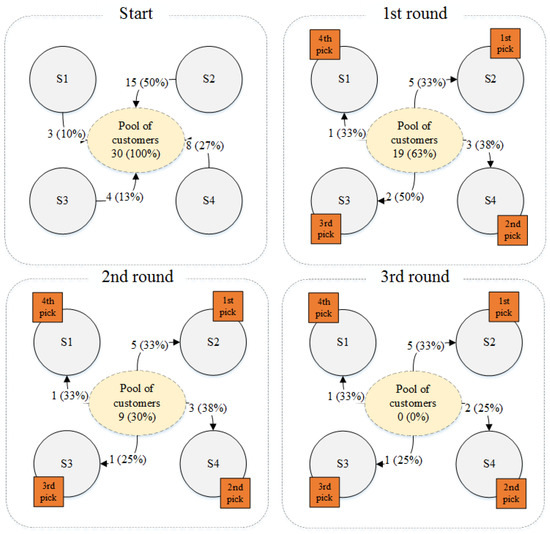
Figure 6.
Example of the limited cooperation mechanism.
4.4.3. Full Cooperation Scenario
In full cooperative settings all serve conjointly all . That is, the four supermarket chains make a coalition which sets a delivery problem for the demanded orders. This problem must be solved considering a number of Multi Depot Vehicle Routing Problems (MDVRP) [55] according to the time window slots we have. Consequently, we implemented a heuristic MDVRP following the recommendations described in Juan et al. [56]. The solution procedure starts sorting the to each based on time-distances. Then, each customer is randomly assigned to a supermarket using a biased randomization procedure [56]. That is, closer supermarkets to the customers have greater probabilities to be chosen. Once all customers are assigned, the same biased-randomization procedure previously described in the VRP is applied to obtain a complete solution (see Figure 5). Finally, this solution is saved and a percentage of customers (50% in our experiments) are unassigned from their supermarkets and reassigned using the biased-randomized assignment procedure. Then, the MDVRPs are again solved. This process is repeated a number of iterations (150 in our case study) and the best solution so far is reported. The flowchart of the proposed algorithm for the MDVRP is shown in Figure 7.
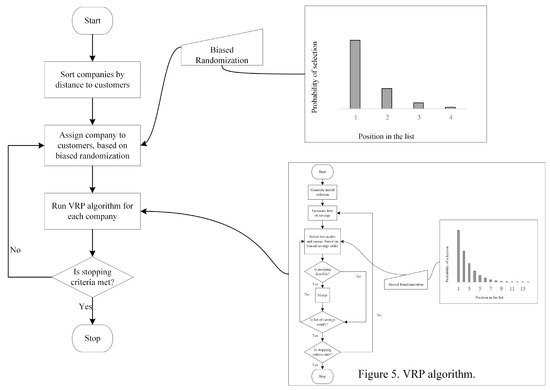
Figure 7.
Flowchart of the proposed algorithm for solving the Multi Depot VRPs (MDVRP).
4.5. Dynamics of the Simulation
All parameters related to and agents are set at each simulation replication. That is, according to the input data, the place their e-groceries orders to their preferred to be served at a specific time window on a day-week. Note that customers are randomly assigned to a supermarket following the probability distribution function (that is, the preferences) given in Table 1. Then, the three cooperation settings are tested, following the next protocol: firstly, the non-cooperative settings; secondly, the limited cooperation protocol; and finally, the full cooperation policy. The simulation model starts on with the non-cooperative settings. Orders are delivered following a sequential policy according to time windows. That is, all the supermarkets start their deliveries at using the solution reported by the VRP algorithm described in Figure 5. Note that, the routes finish once all customers have been served, which implies that violating a time window will delay the starting time for the deliveries in the following time windows. This is repeated for the rest of the week. Once the non-cooperative scenario is solved, the key performance indicators are returned, and the limited cooperation protocol is evaluated following the procedure described in Section 4.4.2. Notice that, we maintain the parameters set at the beginning of the replication for these settings. Similarly, once limited cooperation is evaluated, the process is repeated for the full cooperation policy and the KPIs are reported. In total, we run 100 simulation replications. This simulation dynamics overview is shown in Figure 8.
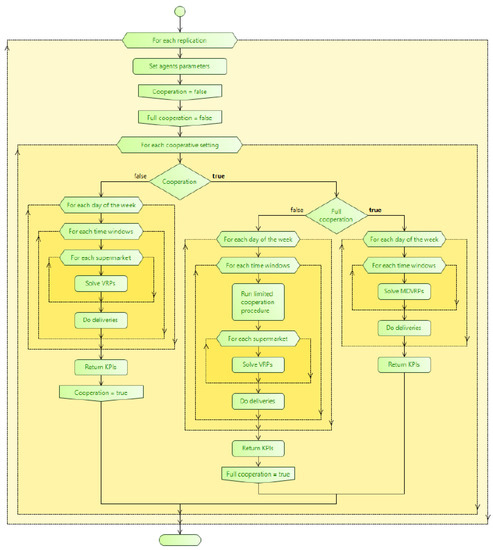
Figure 8.
Simulation dynamics overview.
5. Experimental Results
The simulation model and the algorithms were implemented in AnyLogic 8.6.0 [57] software, and run in a standard desktop with an Intel® Core™ i7- 9700K CPU @3.60 GHz and 16 GB RAM. This section firstly describes the main results when running the simulation for different cooperation settings. Secondly, we analyse the general effects of an unexpected increase on demand figures.
The main results are depicted in Figure 9 and Figure 10. They show the boxplots of average distances driven and lead times (which are defined as the temporal distances between the minimum value of the time window and the time when the customer received his or her order) of the 100 simulation replications, respectively. Table 3 and Table 4 display average distance driven (in km) and average lead times (in minutes), respectively, for each supermarket and cooperation settings. They also show the percentage variation in the averages for non- and limited cooperation and limited and full cooperation strategies. Note that the last row in Table 3 shows the total distance driven by all supermarkets during a week, whereas the last row in Table 4 shows the average lead time a customer has to be waiting, independently from the chosen supermarket.
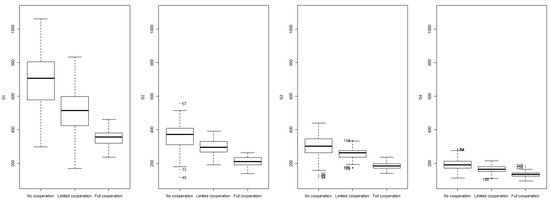
Figure 9.
Boxplots for the average distance driven in the 100 replications for non-, limited, and full cooperation settings for each supermarket.
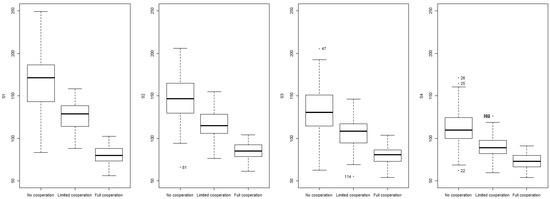
Figure 10.
Boxplots for the average lead times in the 100 replications for non-, limited, and full cooperation settings for each supermarket.

Table 3.
Average distance driven (km) in the 100 replications for non-, limited, and full cooperation settings for each supermarket.

Table 4.
Average lead times (minutes) in the 100 replications for non-, limited, and full cooperation settings for each supermarket.
As it can be observed, horizontal cooperation significantly improves the logistics performance of the e-grocery distribution. First of all, the total distance driven is reduced by a 20.25% when the limited cooperation mechanism is activated; and by a 42.96% when full cooperation is achieved, on average. Nevertheless, this effect clearly depends on the size of the supermarket (in terms of expected demand). Reductions are greater for large supermarkets (up to 49.27%) and much lower for smaller supermarkets (up to 30.58%). Secondly, service quality, measured as the lead time, is also benefited from the application of horizontal cooperation in a similar way. Actually, average lead time is reduced by a 22.54% and a 46.21%, on average, for limited and full cooperation, respectively. Here, the size of the supermarket also determines the horizontal cooperation impacts amplitude. Finally, we can observe how boxplots ranges and interquartile ranges clearly get reduced for all supermarkets when cooperation is implemented. Therefore, the KPIs, that is, distances and lead times, gain stability while uncertainty is mitigated.
Furthermore, additional scenarios have been analysed in order to demonstrate the robustness of the presented approach, featuring increases on the demand figures. Our aim is showing that the horizontal cooperation benefits are kept when we depict a wide range of scenarios. We consider three demand scenarios. Firstly, the base scenario, which has been already analysed and whose demand is estimated in Section 3. Secondly, a scenario featuring an increase of a 25% on demand figures. Finally, a scenario in which the number of orders increase a 50%. The fleet size is kept fixed for all the scenarios according to the description made in Section 4.3. Table 5 and Table 6 show the KPIs obtained from the results in the mentioned scenarios, that is, distance driven and lead times, respectively. The first row in the tables show the scenarios to be addressed, the second one the cooperative strategy to be employed, the next four rows show the average results for each of the four supermarkets, and the last row the overall average results. As expected, an increase on demand levels produces increments on both the distance driven and the lead times. Nevertheless, it must be highlighted that those increments feature different patterns depending on the cooperation settings. Actually, as it can be observed in Figure 11, the greater the increase on demand figures is, the greater the positive effects on distances are. This is particularly noticeable in the no cooperation settings, where the distance driven increases a 29% and a 65% when demand increases a 25% and a 50%, respectively. However, these increments are lower in the full cooperation environment, a 20% and a 51%, respectively. That is, the slope (i.e., the negative effects) is softer when cooperation is implemented, which leads to a better response to unexpected demand increases. Similar insights can be obtained when analysing the effects on leading times in Figure 12.

Table 5.
Average distance driven (km) in the 100 replications for non-, limited, and full cooperation settings for each supermarket by demand increase scenario.

Table 6.
Average lead times (minutes) in the 100 replications for non-, limited, and full cooperation settings for each supermarket by demand increase scenario.
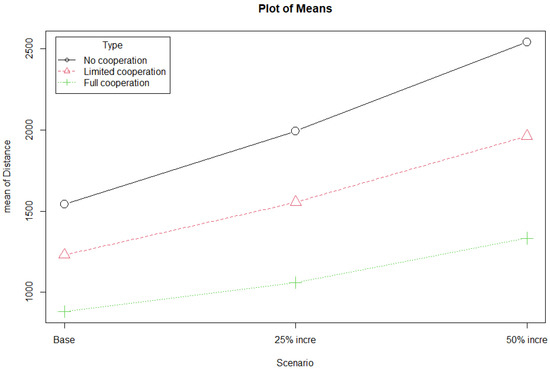
Figure 11.
Mean plots by demand scenario and cooperative setting for total distances.
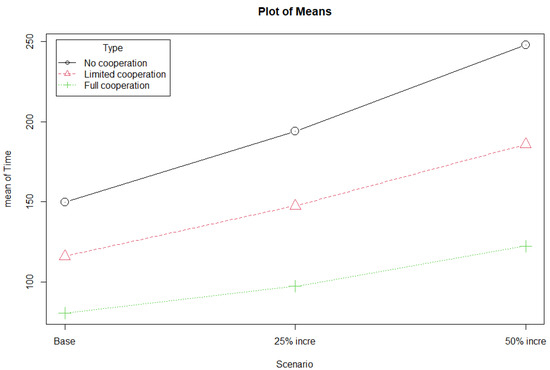
Figure 12.
Mean plots by demand scenario and cooperative setting for average lead times.
6. Conclusions, Limitations, and Future Research
This work presents the use of horizontal cooperation as a way to gain competitiveness in the e-grocery delivery sector. For testing the convenience of using horizontal cooperation, we develop an agent-based simulation model in the city of Pamplona (Spain). We evaluate the effects on the economic and service quality sides of the logistics operations for different scenarios which consist on distribution of online demand orders at supermarkets. Two degrees of horizontal cooperation for performing the deliveries are tested, while distribution plans are determined by the implementation of a biased randomization algorithm. As a result, the use of horizontal cooperation clearly improves the economic and service quality performance of the e-grocery distribution. Furthermore, the distribution becomes more robust to unexpected demand increases when the coalition is able to absorb the new demand more efficiently than the actors independently.
Nevertheless, there are a number of assumptions made during the modeling process that imply some limitations to our work. Firstly, we assume all the orders contain products available at all supermarkets. Therefore, we are assuming that customers order products that are identical in the different supermarkets in the coalition, such as top brand products and fresh vegetables and fruits. Nonetheless, note that in our simulation experiments, the customers do not change the preferred supermarket, they still order to their preferred supermarket but it is the coalition that internally makes efficient assignments and then the order is supplied, or not, by a different supermarket or, even, by a third party logistic service provider. Secondly, we are considering that supermarkets will accept all orders they receive. That means there are no limitations for dispatching any order at any time window. Thirdly, we are assuming each supermarket owns an homogeneous fleet. This means that all the fleets are composed of vehicles of identical capacity, which does not resemble reality, as many different vehicle types may exist in a flotilla. Finally, we assume there are cooperation agreements as exposed. Actually, horizontal cooperation may adapt many different forms in terms of time frame, amplitude, stamina, and the involved organizational levels [58].
Regarding future research, two new clear scopes can be considered. On the one hand, there are opportunities to develop more complex simulation models. This involves the access to high resolution data to better estimate demand patterns and supermarket characteristics. Additionally, the ad-hoc definition of horizontal cooperation policies that are currently running on logistics-related services would allow the calibration and validation of forthcoming simulation-based researches. On the other hand, practical issues should be analysed and integrated in the optimization models. This refers to the way in which benefits and risks are shared in the coalition; as well as how the coalition should evolve during time.
Author Contributions
Conceptualization, A.S.-H. and J.F.; methodology, A.S.-H.; writing–original draft preparation, A.S.-H. and R.d.l.T.; writing—review and editing, L.C. and J.F. All authors have read and agreed to the published version of the manuscript.
Funding
This work has been partially supported by the Spanish Ministry of Science, Innovation, and Universities (RED2018-102642-T; PID2019-111100RB-C22/AEI/10.13039/501100011033) and the SEPIE Erasmus+ Program (2019-I-ES01-KA103-062602). We also want to acknowledge the support received from the CAN Foundation in Navarre, Spain (Grant ID 903 100010434 under the agreement LCF/PR/PR15/51100007).
Institutional Review Board Statement
Not applicable.
Informed Consent Statement
Not applicable.
Data Availability Statement
Data are available upon reasonable request to the corresponding author.
Conflicts of Interest
The authors declare no conflict of interest.
References
- Kämäräinen, V.; Punakivi, M. Developing cost-effective operations for the e-grocery supply chain. Int. J. Logist. 2002, 5, 285–298. [Google Scholar] [CrossRef]
- Olsson, J.; Hellström, D.; Pålsson, H. Framework of last mile logistics research: A systematic review of the literature. Sustainability 2019, 11, 7131. [Google Scholar] [CrossRef]
- Fredriksson, A.; Liljestrand, K. Capturing food logistics: A literature review and research agenda. Int. J. Logist. Res. Appl. 2015, 18, 16–34. [Google Scholar] [CrossRef]
- Williams, J.; Memery, J.; Megicks, P.; Morrison, M. Ethics and social responsibility in Australian grocery shopping. Int. J. Retail. Distrib. Manag. 2010, 38, 297–316. [Google Scholar] [CrossRef]
- Teller, C.; Holweg, C.; Reiner, G.; Kotzab, H. Retail store operations and food waste. J. Clean. Prod. 2018, 185, 981–997. [Google Scholar] [CrossRef]
- Fikar, C. A decision support system to investigate food losses in e-grocery deliveries. Comput. Ind. Eng. 2018, 117, 282–290. [Google Scholar] [CrossRef]
- Rodríguez, S.V.; Plà, L.M.; Faulin, J. New opportunities in operations research to improve pork supply chain efficiency. Ann. Oper. Res. 2014, 219, 5–23. [Google Scholar] [CrossRef]
- Sawik, B.; Faulin, J.; Pérez-Bernabeu, E. Multi-criteria optimization for fleet size with environmental aspects. Transp. Res. Procedia 2017, 27, 61–68. [Google Scholar] [CrossRef]
- Schaltegger, S.; Burritt, R.; Varsei, M.; Soosay, C.; Fahimnia, B.; Sarkis, J. Framing sustainability performance of supply chains with multidimensional indicators. Supply Chain. Manag. Int. J. 2014, 19, 242–257. [Google Scholar] [CrossRef]
- Soosay, C.A.; Hyland, P. A decade of supply chain collaboration and directions for future research. Supply Chain. Manag. Int. J. 2015, 20, 613–630. [Google Scholar] [CrossRef]
- Wang, X.; Kopfer, H. Collaborative transportation planning of less-than-truckload freight. OR Spectrum 2014, 36, 357–380. [Google Scholar] [CrossRef]
- Arlbjørn, J.S.; Wallenburg, C.M.; Raue, J.S. Conflict and its governance in horizontal cooperations of logistics service providers. Int. J. Phys. Distrib. Logist. Manag. 2011, 41, 385–400. [Google Scholar]
- Cruijssen, F.; Dullaert, W.; Fleuren, H. Horizontal cooperation in transport and logistics: A literature review. Transp. J. 2007, 46, 22–39. [Google Scholar]
- Fraser, J.; Fraser, N.; McDonald, F. The strategic challenge of electronic commerce. Supply Chain. Manag. Int. J. 2000, 5, 7–14. [Google Scholar] [CrossRef]
- da Silveira, G.J. Towards a framework for operations management in e-commerce. Int. J. Oper. Prod. Manag. 2003, 23, 200–212. [Google Scholar] [CrossRef]
- Emeç, U.; Çatay, B.; Bozkaya, B. An adaptive large neighborhood search for an e-grocery delivery routing problem. Comput. Oper. Res. 2016, 69, 109–125. [Google Scholar] [CrossRef]
- Hübner, A.H.; Kuhn, H.; Wollenburg, J.; Towers, N.; Kotzab, H. Last mile fulfilment and distribution in omni-channel grocery retailing: A strategic planning framework. Int. J. Retail. Distrib. Manag. 2016. [Google Scholar] [CrossRef]
- Wilson-Jeanselme, M.; Reynolds, J. Understanding shoppers’ expectations of online grocery retailing. Int. J. Retail. Distrib. Manag. 2006, 34, 529–540. [Google Scholar] [CrossRef]
- Ellinger, A.E.; Keller, S.B.; Hansen, J.D. Bridging the divide between logistics and marketing: Facilitating collaborative behavior. J. Bus. Logist. 2006, 27, 1–27. [Google Scholar] [CrossRef]
- Seidel, S.; Mareï, N.; Blanquart, C. Innovations in e-grocery and logistics solutions for cities. Transp. Res. Procedia 2016, 12, 825–835. [Google Scholar]
- Boyer, K.K.; Prud’homme, A.M.; Chung, W. The last mile challenge: Evaluating the effects of customer density and delivery window patterns. J. Bus. Logist. 2009, 30, 185–201. [Google Scholar] [CrossRef]
- Fikar, C.; Mild, A.; Waitz, M. Facilitating consumer preferences and product shelf life data in the design of e-grocery deliveries. Eur. J. Oper. Res. 2019. [Google Scholar] [CrossRef]
- Hornstra, R.P.; Silva, A.; Roodbergen, K.J.; Coelho, L.C. The vehicle routing problem with simultaneous pickup and delivery and handling costs. Comput. Oper. Res. 2020, 115, 104858. [Google Scholar] [CrossRef]
- Figliozzi, M.; Saenz, J.; Faulin, J. Minimization of urban freight distribution lifecycle CO2e emissions: Results from an optimization model and a real-world case study. Transp. Policy 2020, 86, 60–68. [Google Scholar] [CrossRef]
- Zissis, D.; Aktas, E.; Bourlakis, M. Collaboration in urban distribution of online grocery orders. Int. J. Logist. Manag. 2018. [Google Scholar] [CrossRef]
- Calleja, G.; Corominas, A.; Martínez-Costa, C.; de la Torre, R. Methodological approaches to supply chain design. Int. J. Prod. Res. 2018, 56, 4467–4489. [Google Scholar] [CrossRef]
- Bahinipati, B.K.; Kanda, A.; Deshmukh, S. Horizontal collaboration in semiconductor manufacturing industry supply chain: An evaluation of collaboration intensity index. Comput. Ind. Eng. 2009, 57, 880–895. [Google Scholar] [CrossRef]
- Lambert, D.M.; Emmelhainz, M.A.; Gardner, J.T. Building successful logistics partnerships. J. Bus. Logist. 1999, 20, 165. [Google Scholar]
- Cao, M.; Zhang, Q. Supply chain collaborative advantage: A firm’s perspective. Int. J. Prod. Econ. 2010, 128, 358–367. [Google Scholar] [CrossRef]
- Nooteboom, B. Inter-Firm Collaboration, Learning And Networks: An Integrated Approach; Routledge, Taylor and Francis Group: New York, NY, USA, 2004. [Google Scholar]
- Tidström, A. Causes of conflict in intercompetitor cooperation. J. Bus. Ind. Mark. 2009, 27, 506–518. [Google Scholar] [CrossRef]
- Rindfleisch, A. Organizational trust and interfirm cooperation: An examination of horizontal versus vertical alliances. Mark. Lett. 2000, 11, 81–95. [Google Scholar] [CrossRef]
- Jackson, J.C.; Rand, D.; Lewis, K.; Norton, M.I.; Gray, K. Agent-based modeling: A guide for social psychologists. Soc. Psychol. Personal. Sci. 2017, 8, 387–395. [Google Scholar] [CrossRef]
- Garcia, R. Uses of agent-based modeling in innovation/new product development research. J. Prod. Innov. Manag. 2005, 22, 380–398. [Google Scholar] [CrossRef]
- Macal, C.M.; North, M.J. Agent-based modeling and simulation. In Proceedings of the 2009 Winter Simulation Conference (WSC), Austin, TX, USA, 13–16 December 2009; pp. 86–98. [Google Scholar]
- Macy, M.; Flache, A. The Oxford Handbook of Analytical Sociology; Chapter Social Dynamics from the Bottom Up: Agent-Based Models of Social Interaction; Oxford University Press: Oxford, UK, 2002; pp. 245–268. [Google Scholar]
- Macal, C. Everything you need to know about agent-based modelling and simulation. J. Simul. 2016, 10, 144–156. [Google Scholar] [CrossRef]
- Tesfatsion, L.; Judd, K.L. Handbook of Computational Economics: Agent-Based Computational Economics; Elsevier: Amsterdam, The Netherlands, 2006. [Google Scholar]
- Bruch, E.; Atwell, J. Agent-based models in empirical social research. Sociol. Methods Res. 2015, 44, 186–221. [Google Scholar] [CrossRef] [PubMed]
- Cederman, L.E. Computational models of social forms: Advancing generative process theory. Am. J. Sociol. 2005, 110, 864–893. [Google Scholar] [CrossRef]
- Wooldridge, J.M. Cluster-sample methods in applied econometrics. Am. Econ. Rev. 2003, 93, 133–138. [Google Scholar] [CrossRef]
- Liu, R.; Jiang, D.; Shi, L. Agent-based simulation of alternative classroom evacuation scenarios. Front. Archit. Res. 2016, 5, 111–125. [Google Scholar] [CrossRef]
- Bonabeau, E. Agent-based modeling: Methods and techniques for simulating human systems. Proc. Natl. Acad. Sci. USA 2002, 99, 7280–7287. [Google Scholar] [CrossRef] [PubMed]
- O’Sullivan, D.; Haklay, M. Agent-based models and individualism: Is the world agent-based? Environ. Plan. A 2000, 32, 1409–1425. [Google Scholar] [CrossRef]
- Macal, C.; North, M. Introductory tutorial: Agent-based modeling and simulation. In Proceedings of the Winter Simulation Conference 2014, Savanah, GA, USA, 7–10 December 2014. [Google Scholar]
- Mkansi, M.; de Leeuw, S.; Amosun, O. Mobile application supported urban-township e-grocery distribution. Int. J. Phys. Distrib. Logist. Manag. 2019, 50, 26–53. [Google Scholar] [CrossRef]
- Alvarez, P.; Serrano-Hernandez, A.; Faulin, J.; Juan, A. Using Modelling Techniques to Analyze Urban Freight Distribution. A Case Study in Pamplona (Spain). Transp. Res. Procedia 2018, 33, 37–74. [Google Scholar] [CrossRef]
- Spanish Institute of Statistics. Continuous Household Survey. 2019. Available online: https://www.ine.es/dyngs/INEbase/en/operacion.htm?c=Estadistica_C&cid=1254736176952&menu=ultiDatos&idp=1254735572981 (accessed on 20 April 2020).
- Serrano-Hernandez, A.; Hirsch, P.; Faulin, J.; Fikar, C. The role of horizontal cooperation to improve service quality in last-mile distribution. Int. J. Simul. Process. Model. 2018, 13, 299–309. [Google Scholar] [CrossRef]
- Serrano-Hernandez, A.; Faulin, J.; Hirsch, P.; Fikar, C. Agent-based simulation for horizontal cooperation in logistics and transportation: From the individual to the grand coalition. Simul. Model. Pract. Theory 2018, 85, 47–59. [Google Scholar] [CrossRef]
- Mor, A.; Speranza, M. Vehicle routing problems over time: A survey. 4OR 2020. [Google Scholar] [CrossRef]
- Juan, A.; Faulin, J.; Ruiz, R.; Barrios, B.; Caballé, S. The SR-GCWS hybrid algorithm for solving the capacitated vehicle routing problem. Appl. Soft Comput. Journal 2010, 10, 215–224. [Google Scholar] [CrossRef]
- Juan, A.A.; David Kelton, W.; Currie, C.S.M.; Faulin, J. Simheuristics Applications: Dealing with Uncertainty in Logistics, Transportation, and other Supply Chain Areas. In Proceedings of the 2018 Winter Simulation Conference (WSC), Gothenburg, Sweden, 9–12 December 2018; pp. 3048–3059. [Google Scholar] [CrossRef]
- Grasas, A.; Juan, A.; Faulin, J.; de Armas, J.; Ramalhinho, H. Biased randomization of heuristics using skewed probability distributions: A survey and some applications. Comput. Ind. Eng. 2017, 110, 216–228. [Google Scholar] [CrossRef]
- Ramachandiran, R.; Suresh Joseph, K.; Ravisasthiri, P.; Victer Paul, P. A comprehensive study on the recent variants of the VRP and its solving methodologies. Int. J. Appl. Eng. Res. 2015, 10, 43635–43644. [Google Scholar]
- Juan, A.; Pascual, I.; Guimarans, D.; Barrios, B. Combining biased randomization with iterated local search for solving the multidepot vehicle routing problem. Int. Trans. Oper. Res. 2015, 22, 647–667. [Google Scholar] [CrossRef]
- AnyLogic. Available online: https://www.anylogic.com/1 (accessed on 20 September 2020).
- Serrano-Hernández, A.; Juan, A.; Faulin, J.; Perez-Bernabeu, E. Horizontal collaboration in freight transport: Concepts, benefits, and environmental challenges. Stat. Oper. Res. Trans. 2017, 41, 1–22. [Google Scholar]
Publisher’s Note: MDPI stays neutral with regard to jurisdictional claims in published maps and institutional affiliations. |
© 2021 by the authors. Licensee MDPI, Basel, Switzerland. This article is an open access article distributed under the terms and conditions of the Creative Commons Attribution (CC BY) license (http://creativecommons.org/licenses/by/4.0/).