1. Introduction
Protective structures from hazard vibrations may save lives and resources. There are three main vibration mitigation approaches: active, passive, and semi-active vibration devices [
1]. Among these three methods, semi-active vibration devices have received attention because they have advantages of lower power cost and better fail-safe than active devices, and adaptability over passive systems [
2]. In recent years, semi-active vibration devices based on smart materials has been paid increased attention [
3,
4,
5].
Magnetorheological elastomer (MRE) is a kind of smart materials, which is composed of rubber matrix and iron particles [
6]. Due to the tunable stiffness, MRE-based devices can operate in a wide range of frequencies [
7]. MREs also have advantages of fast response time, in milliseconds. Previous studies have shown that MREs are potential candidates in vibration control. For example, Opie [
8] designed an MRE based vibration isolator, and the experimental results show that MRE isolator and semi-active controller system reduce resonances and payload velocities by 16–30%. Behrooz [
9] developed an MRE-based semi-active/passive stiffness and damping isolator in a scaled building system; with Lyapunov control strategy, the motion of the building system under earthquake is largely reduced. Du [
10] studied a continuously variable stiffness control of vehicle seat suspension using an MRE isolator; by a sub-optimal H controller, the driver body acceleration responses under bump and random road conditions are well controlled.
To make full use of MRE-based device for vibration mitigation applications, a reliable and accurate model should be developed first for well capturing its nonlinear performances. To date, only a few relative studies have been published. Two main kinds of model are parametric and nonparametric model [
11]. The parametric model includes several elements (e.g., spring, dashpot, slippery element, and hysteresis element) with physical meanings for describing the force–displacement curves [
6,
12,
13,
14,
15], which is phenomenon model for better explaining the nonlinear performances of MRE-based devices. However, for parametric models, complicated parameter identification processes cannot be avoided. In some cases, the identified parameters are negative which is unrealistic for parametric modeling. Additionally, some parametric models (e.g., Bouc–Wen model, hyperbolic model, LuGre model) including nonlinear differential equations, which may bring the inconvenience for implementation of feasible controller design [
16].
Compared with parametric models, nonparametric models may establish nonlinear force–displacement loops without parameter identifications, and has high accuracy and adaptability [
16]. It is noted that the non-parametric model is not able to be solved by a mathematical model, and hence unrealistic parameters sometimes arise in parametric modeling method may be not existing. Nonparametric model is mainly based on artificial intelligence methods, in which neural network model is one of the most typical models. By neural network nonparametric model, the input and output responses are linked by mapping structure. Based on the training process, a neural network model could portray nonlinear relationships between loading conditions and output control force of MRE-based device, which has advantages of fast convergence and precision. However, only a few studies have been reported on this issue [
16,
17].
In this work, for improving adaptability and reducing complexity of neural network nonparametric modeling, a back-propagation artificial neural network (BPANN) structure is utilized for modeling MRE isolator. BPANN model is a feed-forward neural network using an algorithm of error reverse transfer training. This model has several hidden layers between input layers and output layers, and makes the mapping results approximately to the output force of MRE isolator by adjusting the weight of the neural network. The detailed organization of the paper is presented as follows.
Section 2 introduces the design and working principle of MRE isolator. A series of experimental tests for characterizing MRE-based device are conducted under various dynamic loadings in
Section 3. Field-dependent and displacement amplitude-related force–displacement loops are observed. In
Section 4, a BPANN model is developed and utilized for capturing nonlinear hysteresis loops of MRE isolator. The comparison of predicted results and experimental results is discussed. Finally, the summary and main conclusions are drawn in
Section 5.
2. Design and Working Principle of MRE Isolator
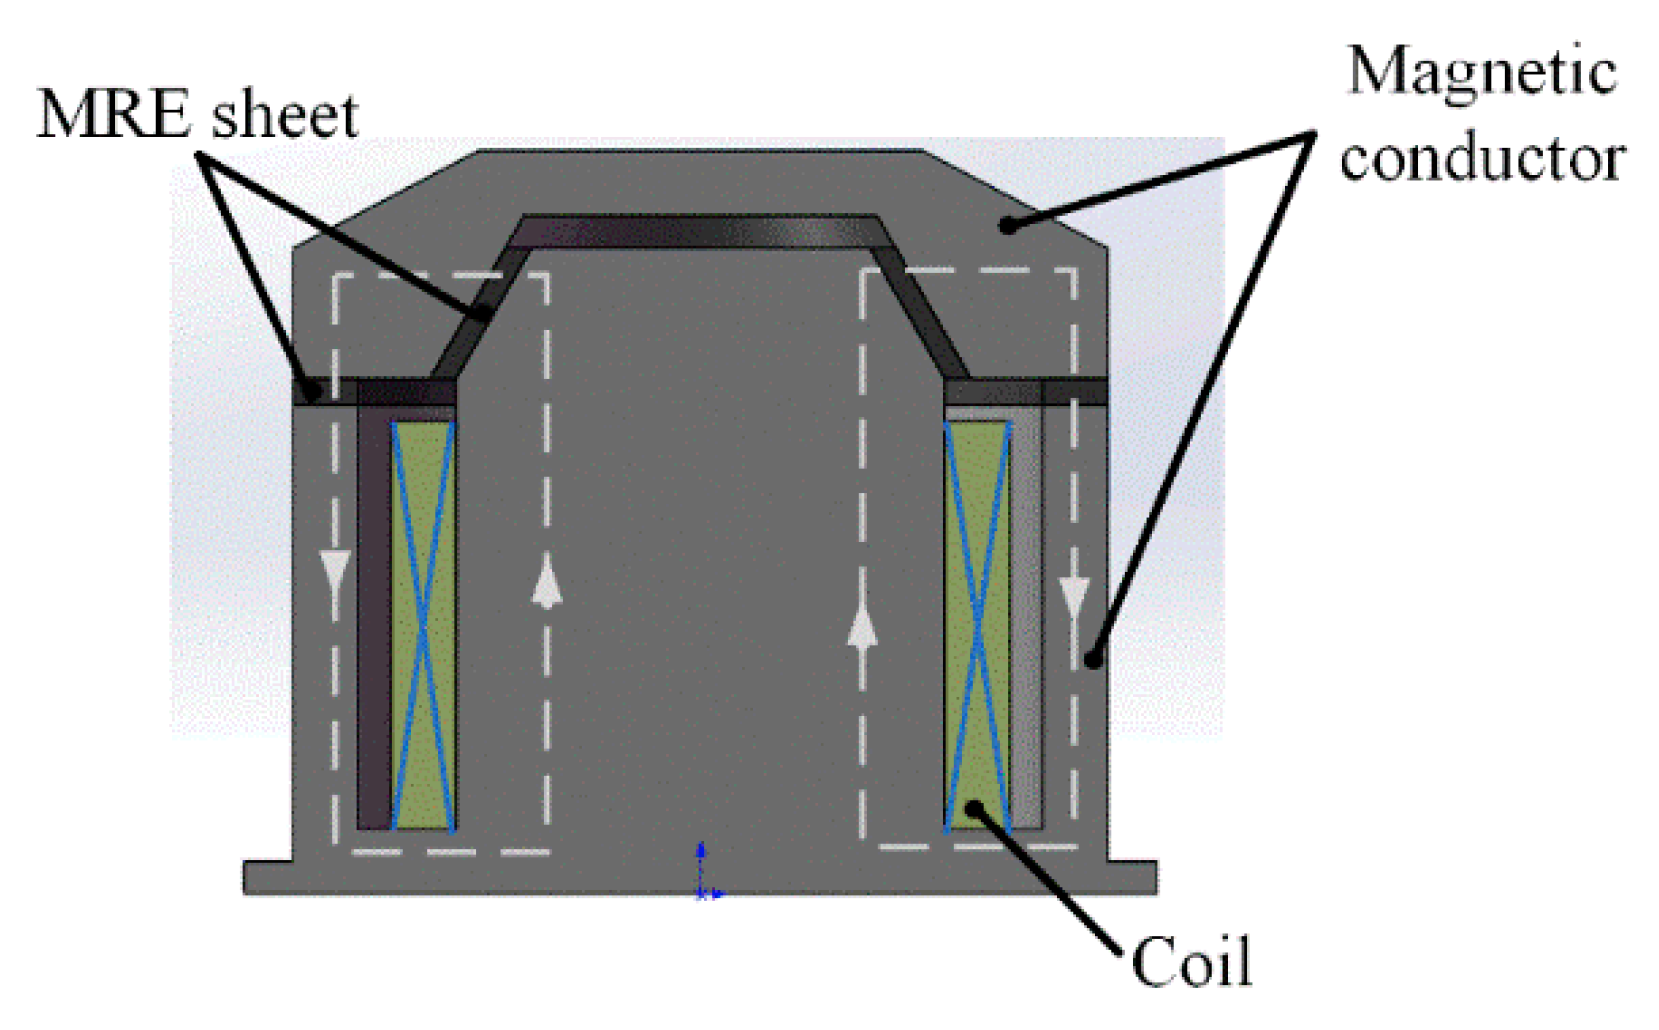
Figure 1 shows a cross section view of the proposed variable stiffness MRE isolator. It includes MREs layer, magnetic coil, and iron cores. MREs work in compression mode and shear–compression mixed mode. It is known that MRE working in mixed mode may present better vibration mitigation effects than in a single mode. The size of MREs in compression mode is outer diameter 110 mm and inner diameter 90 mm. The size of MREs in shear mode is a cone-like sheet with outer diameter 45 mm, inner diameter 37 mm, and conical degree 60°. By magnetic field analysis, the total winding number of the coil is determined as 600. Other detailed information can be found in [
18]. As shown in
Figure 1, the perpendicular magnetic field is in the same direction as the particle chains in MREs working in compression mode. Due to the special geometry of the MRE layer working in shear–compression mixed mode (conical shape), it is cured without a magnetic field, and it is an isotropic MRE. The MRE layers, magnetic coil, and iron cores form a complete magnetic circle.
By magnetic analysis in finite element method [
18], the corresponding values between applied currents (I) and magnetic field strength (B) are developed, as listed in
Table 1. When the applied current is 2 A, MRE achieves a magnetic field saturation, 0.65 T.
Silicone MRE was synthesized using silicon rubber, silicon oil, and iron particles with average diameters of 2–4 µm. The three components were mixed at a volume ratio as 15%, 77.3%, and 7.3%, respectively, and they were mixed completely for 120 min. Then, the pre-cured mixer was degassed at room temperature for 180 min to remove the bubbles. MRE layer in compression mode in proposed isolator is cured under an applied magnetic field. Since the formation of chainlike structures of iron particles within MRE is significant to its performance, the pre-cured silicone MRE in a permanent magnet in 1.0 Tesla for 120 min. Thus, the chain-like structure is formed. By size limitation, MRE layer in shear–compression mode (the conical sheet) is not cured within an applied magnetic field, and it is an isotropic MRE.
3. Testing and Results Analysis
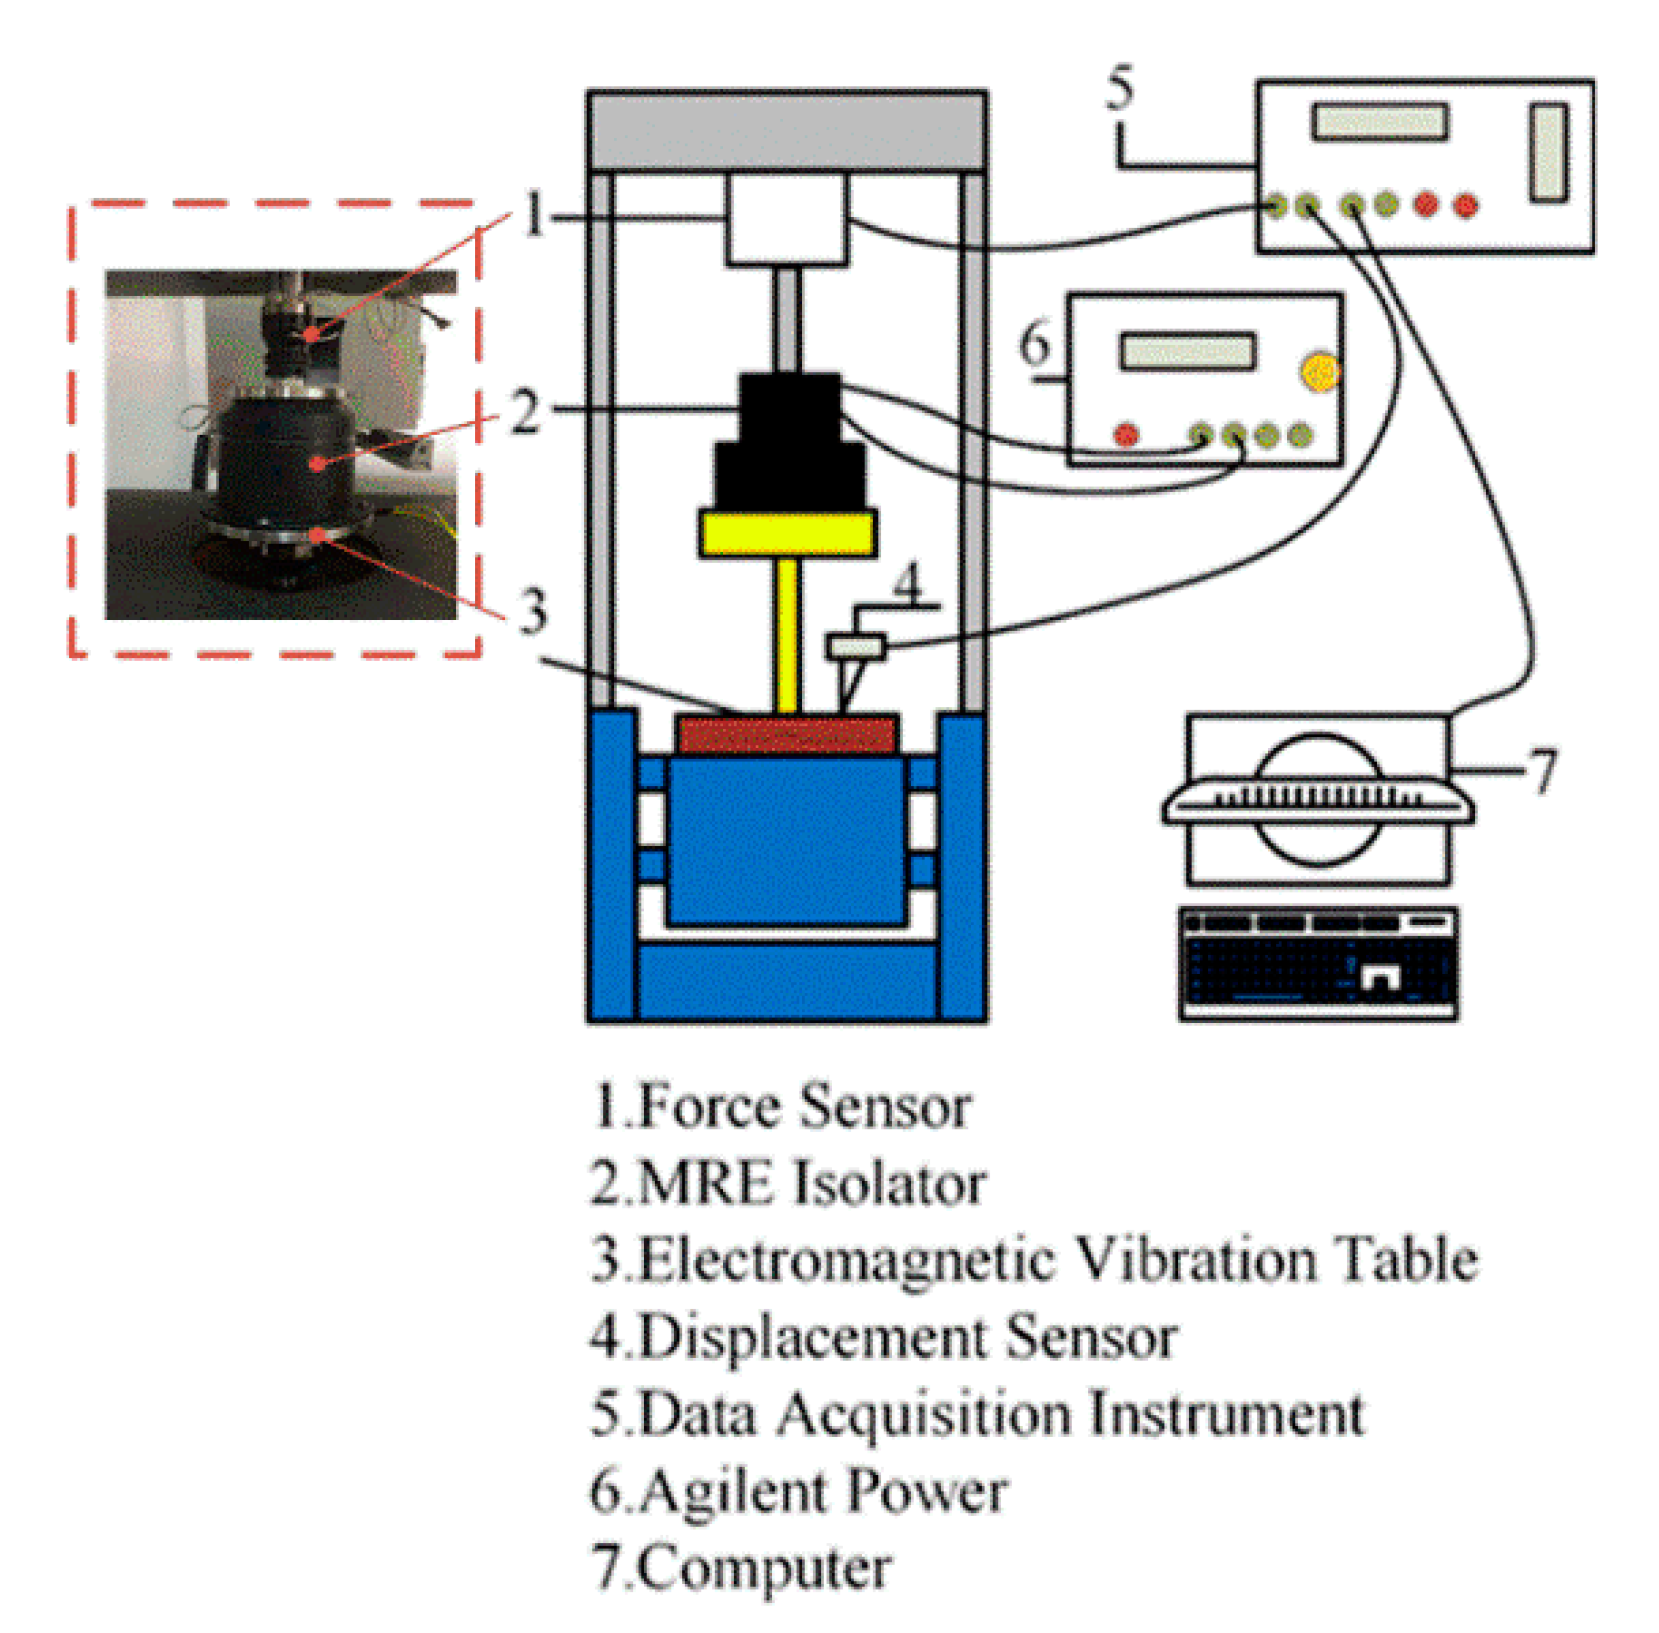
To characterize the MRE isolator, a dynamic compression test is conducted on MTS testing system, as shown in
Figure 2. The top and the bottom of MRE isolator are connected to the load cell and actuator. The force and displacement are measured directly by the MTS load cell and a LVDT, respectively. For obtaining the influence of magnetic field on the dynamic performances (e.g., equivalent stiffness and damping properties) of proposed MRE isolator, the variable applied current from 0.0 A to 2.0 A is applied. The applied frequency is 0.5 Hz. The reason for selecting such frequency is that MRE is suitable for applied in low-frequency vibration [
13]. A pre-compression deformation as 0.5 mm is set initially, and the balance position is set to be zero. The displacement amplitudes for testing are 0.05 mm and 0.15 mm, respectively. In fabrication process, the thickness of MRE sample is 4 mm. The strain of MRE is respectively 13.75%, 15%, and 16.25%. In some previous work, Fu [
17] conducted micro-vibration experiments for setting the strain of MRE as 2.3%, 4.5%, and 6.5%; Yu [
15] conducted experiments for setting the strain of MRE as 16%. The strain of MRE may be below 20% for avoiding fracture and failure. Hence, in the manuscript, the displacement amplitude is limited.
In the future work, the authors will consider other displacement and frequency amplitudes.
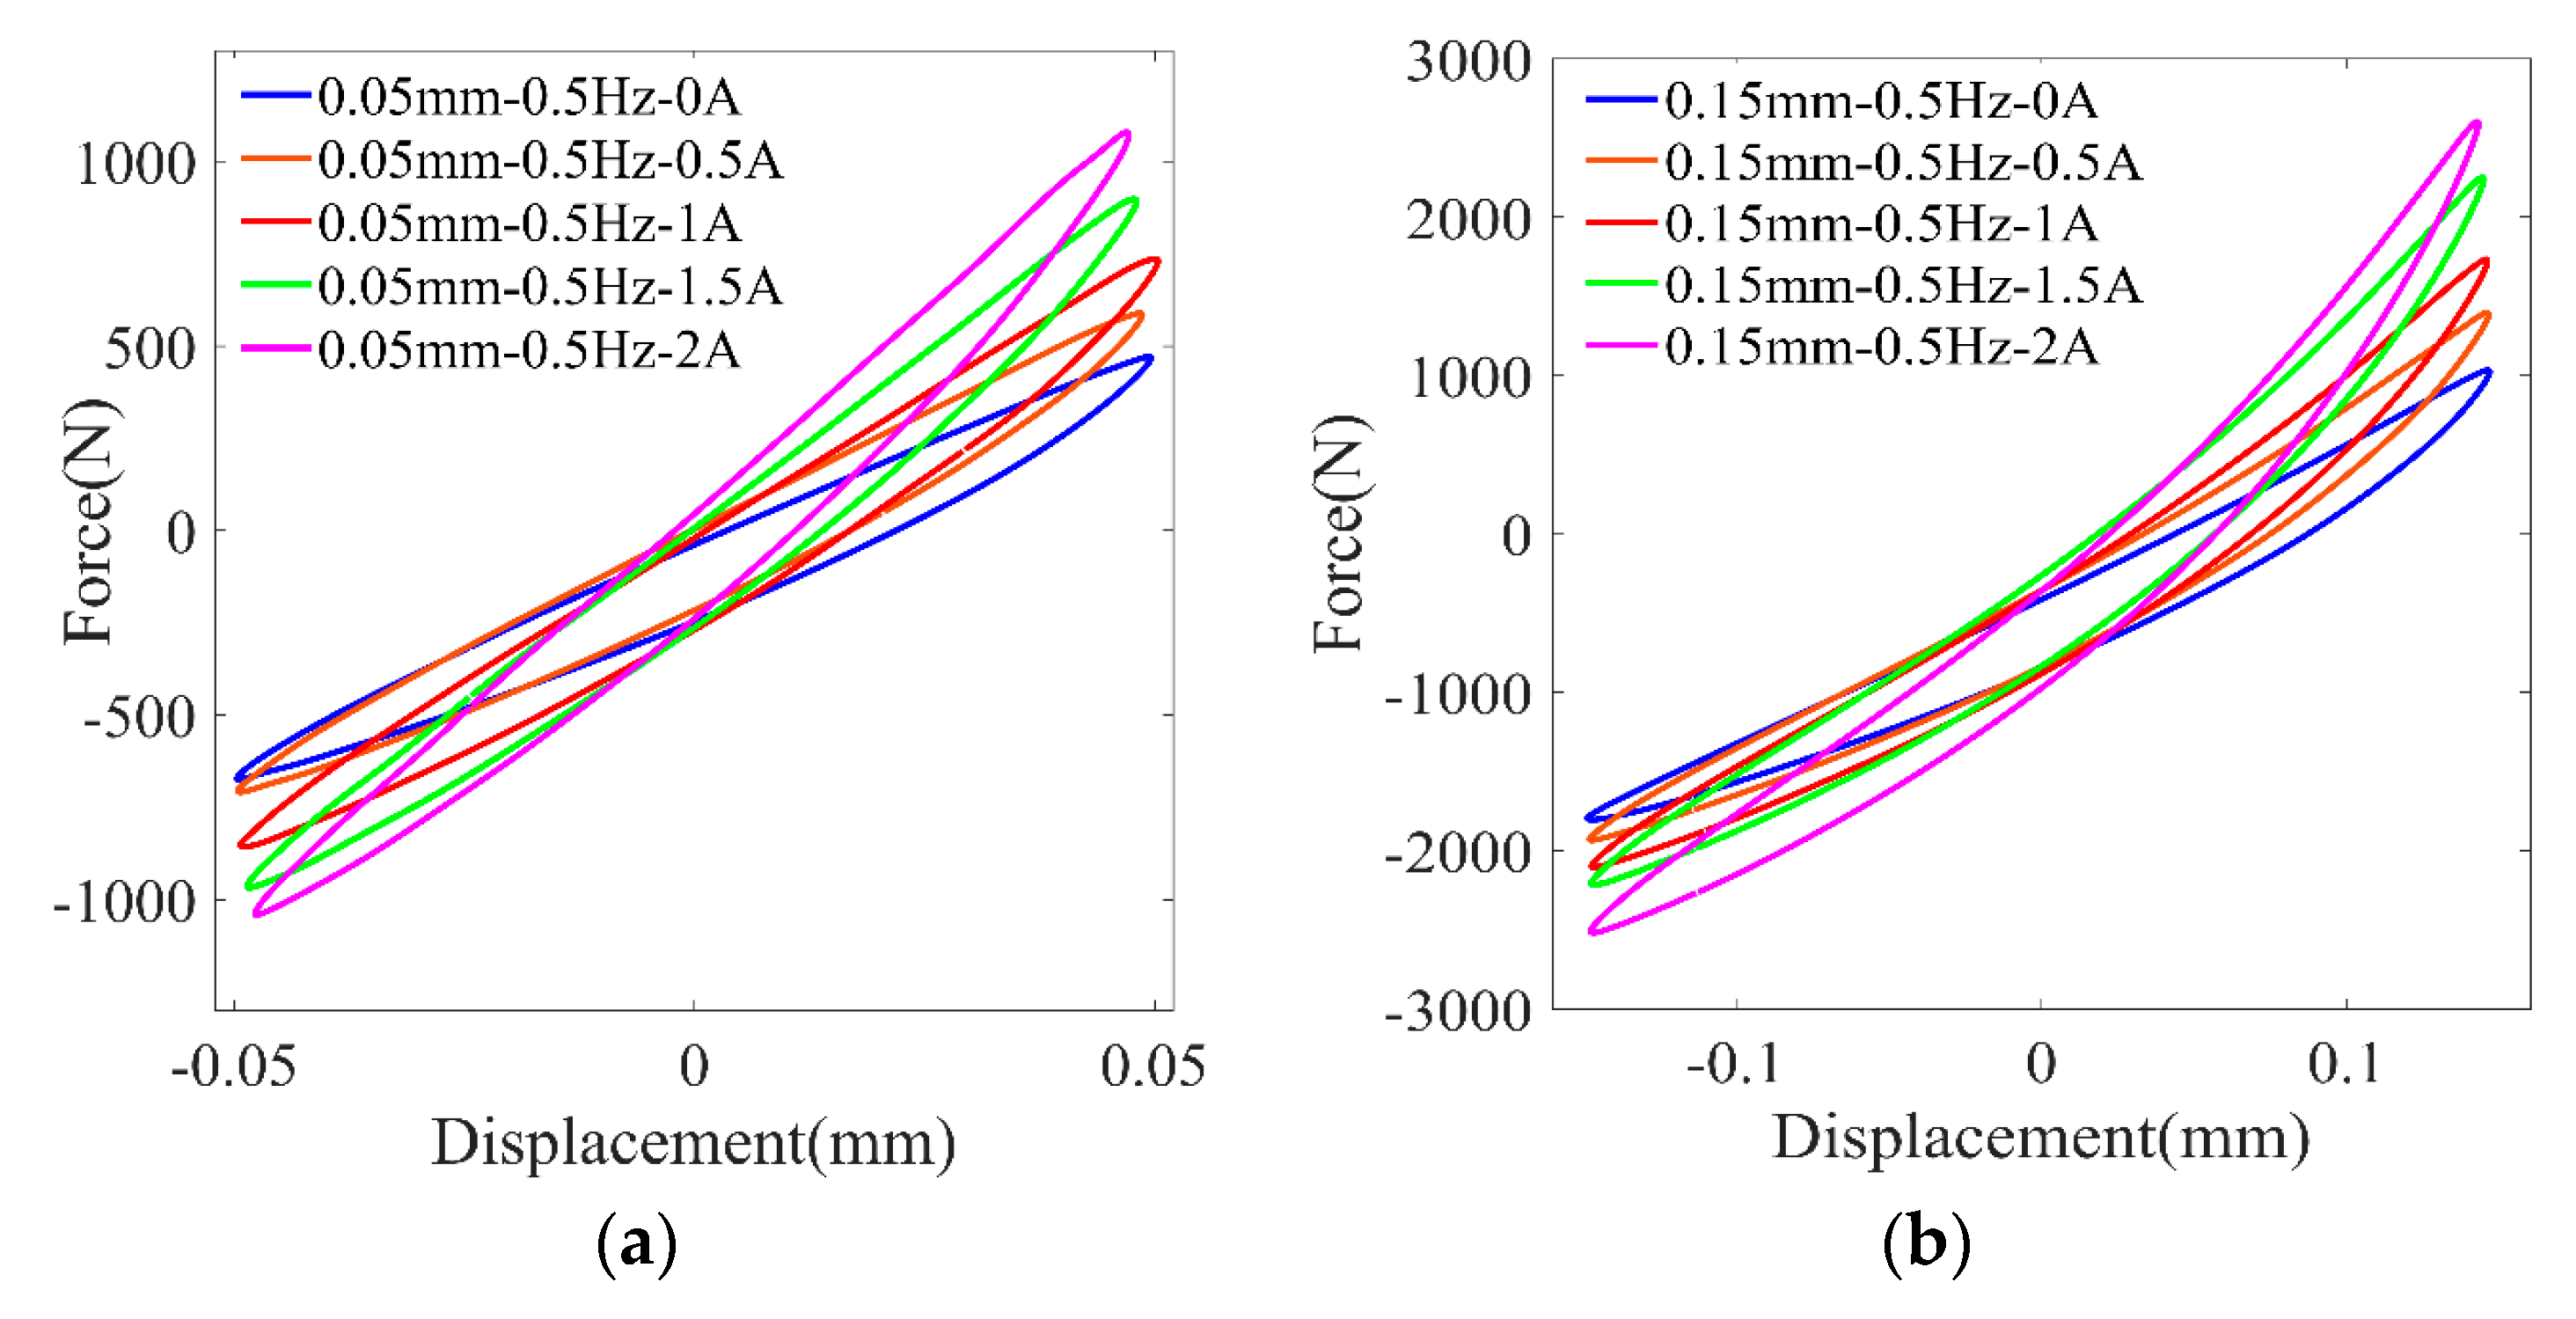
Figure 3 shows the force–displacement results of an MRE isolator for different applied currents and the maximum displacement of 0.05 mm and 0.15 mm. It is seen that, with the increasing input of electric current, the slope of the curves increases. This phenomenon demonstrates that the stiffness of the MRE isolator is altered by the applied currents. Also, the area within the force–displacement curves slightly increases as the applied current increases, which indicates that the damping capacity is also enhanced by the external magnetic field.
4. Back-Propagation ANN Model
To make full use of proposed MRE isolator for a vibration control system, its dynamic behavior should be modeled in terms of force–displacement hysteresis loops. In the present work, a back-propagation artificial neural network (BPANN) is utilized for modeling nonlinear performance of MRE isolator. BPANN model has many advantages—e.g., the characteristics of self-learning, strong robust, generalization, and adaptability [
19]. The basic principle of BPANN is to put input data through a series of hidden layers and then builds the nonlinear relationship between input and output data [
20]. The forward transmission of inputs and the reverse transmission of output error data form the cycles of BPANN. To develop an accurate nonlinear model, the weights in BPANN are optimized based on output error of neurons [
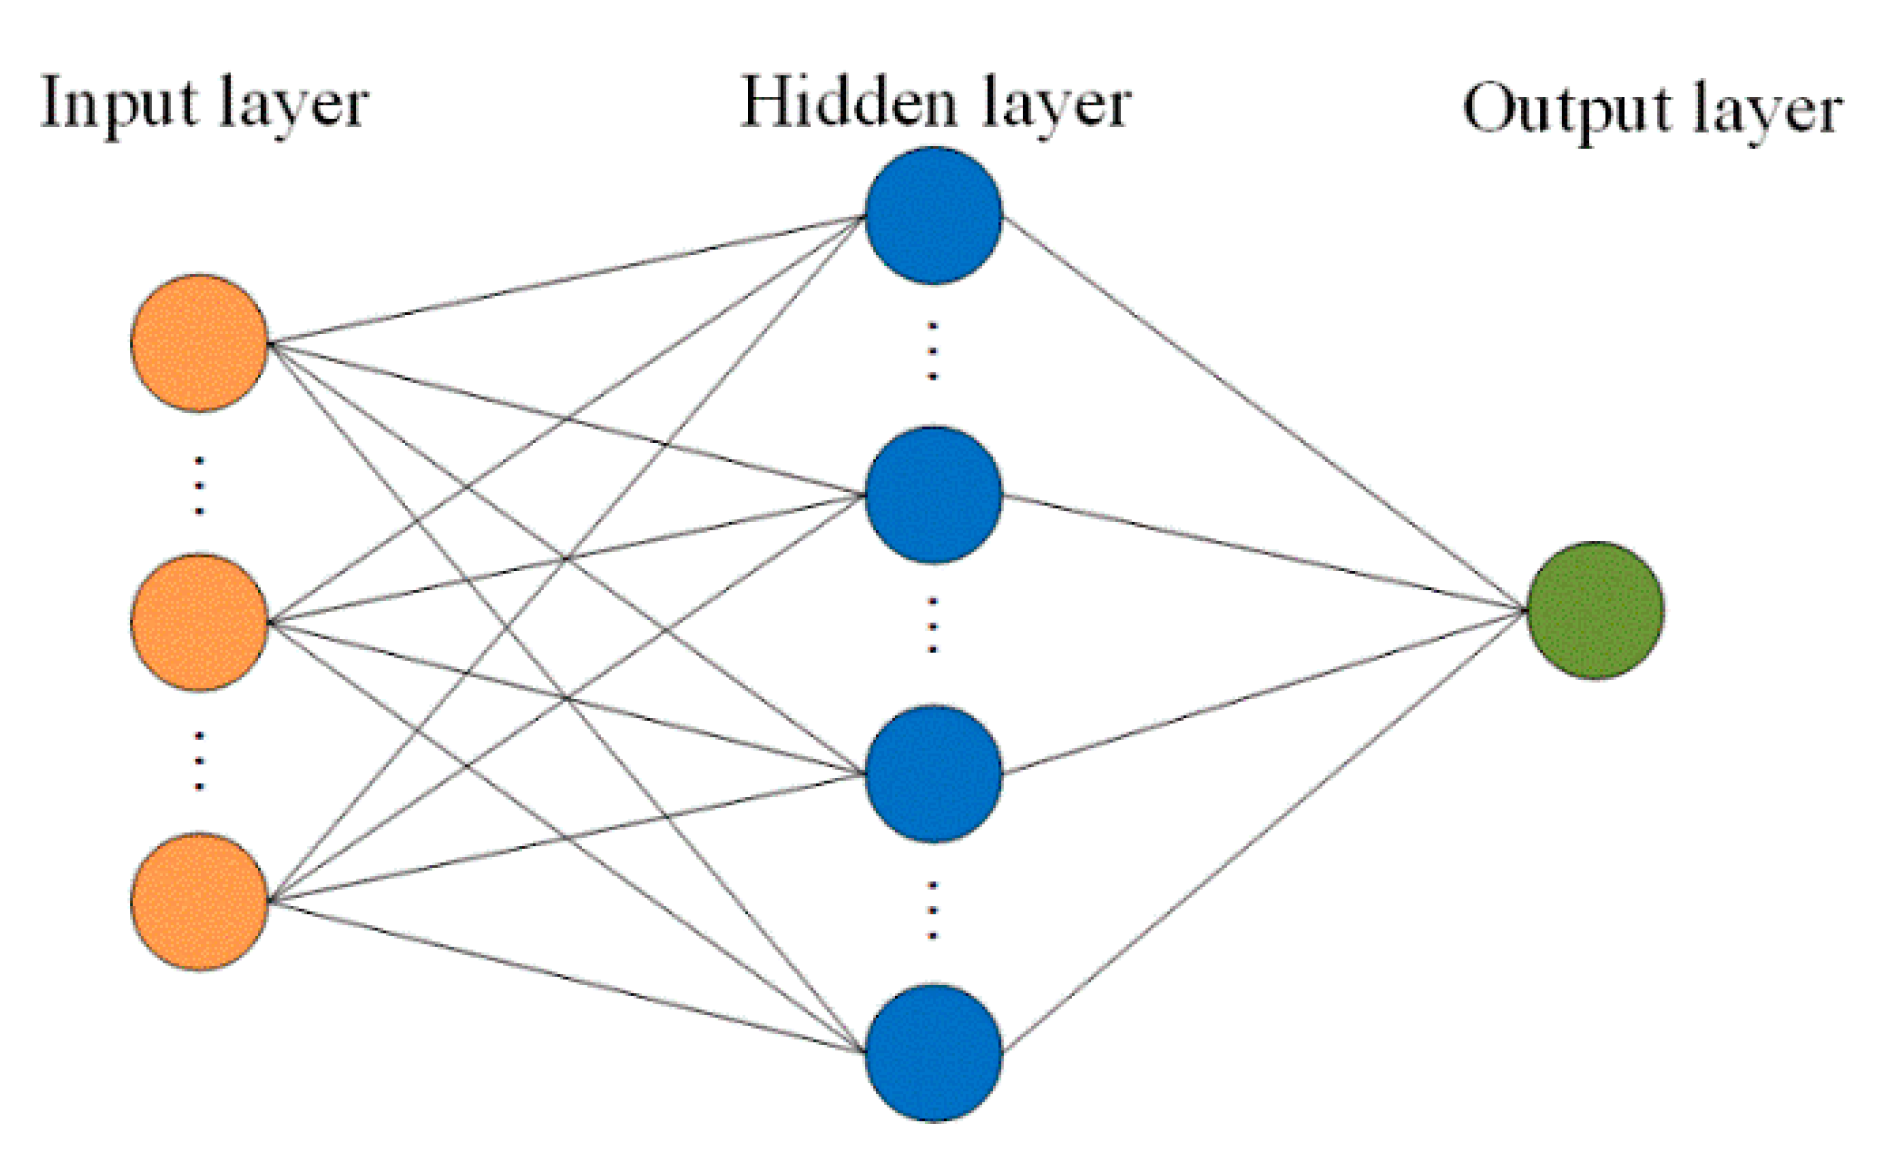
21]. For mapping dynamic hysteresis loops of MRE isolator, the input data of BPANN is deformation, velocity, current, and the output data is the force. It is known that velocity is calculated by deformation and applied frequency. The neuron number in hidden layer is optimized to eight [
17]. The BPANN structure is shown in
Figure 4.
The algorithm of back-propagation neural network [
22] is described as follows:
Firstly, the weights and the threshold are randomly initialized.
Secondly, the output of all layers,
, is iteratively computed by Equation (1) after feeding the prepared training samples including input dataset and the output dataset to the neural network.
Thirdly, in each layer, the square error is computed. The square root errors of the output layer (
) and the hidden layer (
) are respectively calculated by Equations (2) and (3).
Then, the change in the weights between the input and the output are calculated based on Equations (4) and (5).
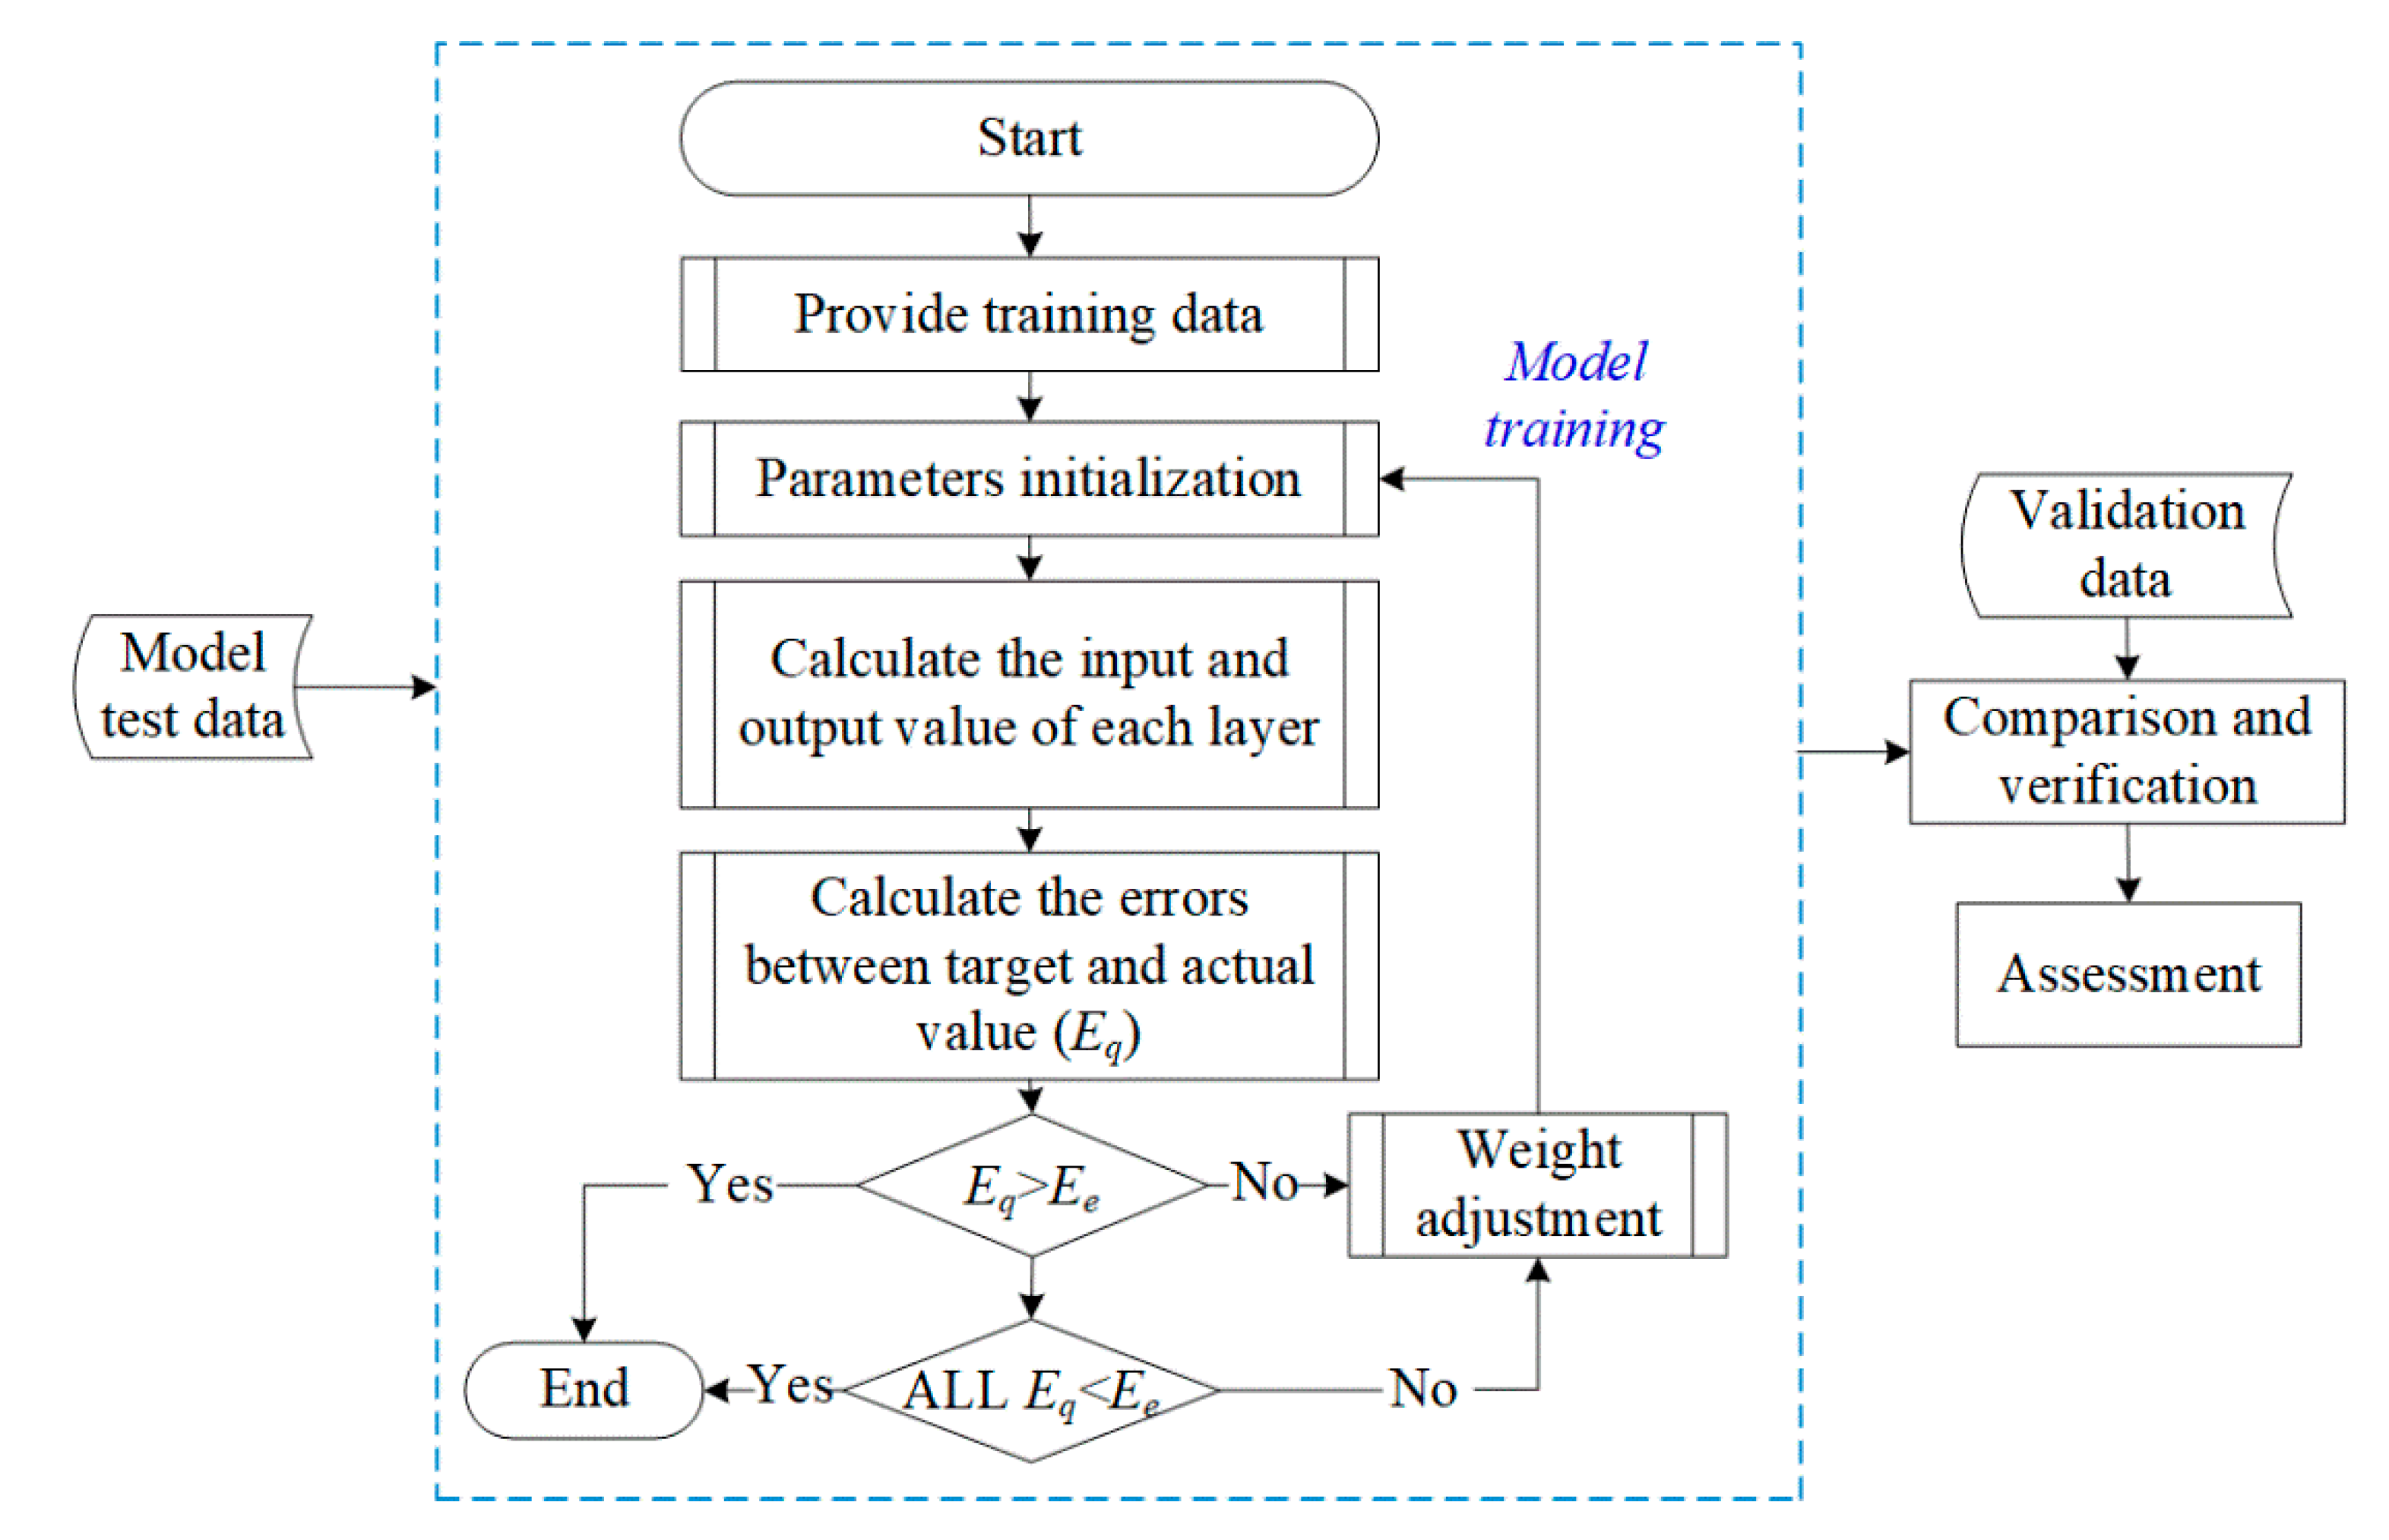
The above procedures are repeated until the mean-squared error is less than the threshold value; otherwise, the weight value is stopped iteration and the training procedure of BPNN model is finished. In the NN model, many neuron activation functions are utilized, and the sigmoidal function was used [
22].
The overall framework is summarized in flowchart, as shown in
Figure 5.
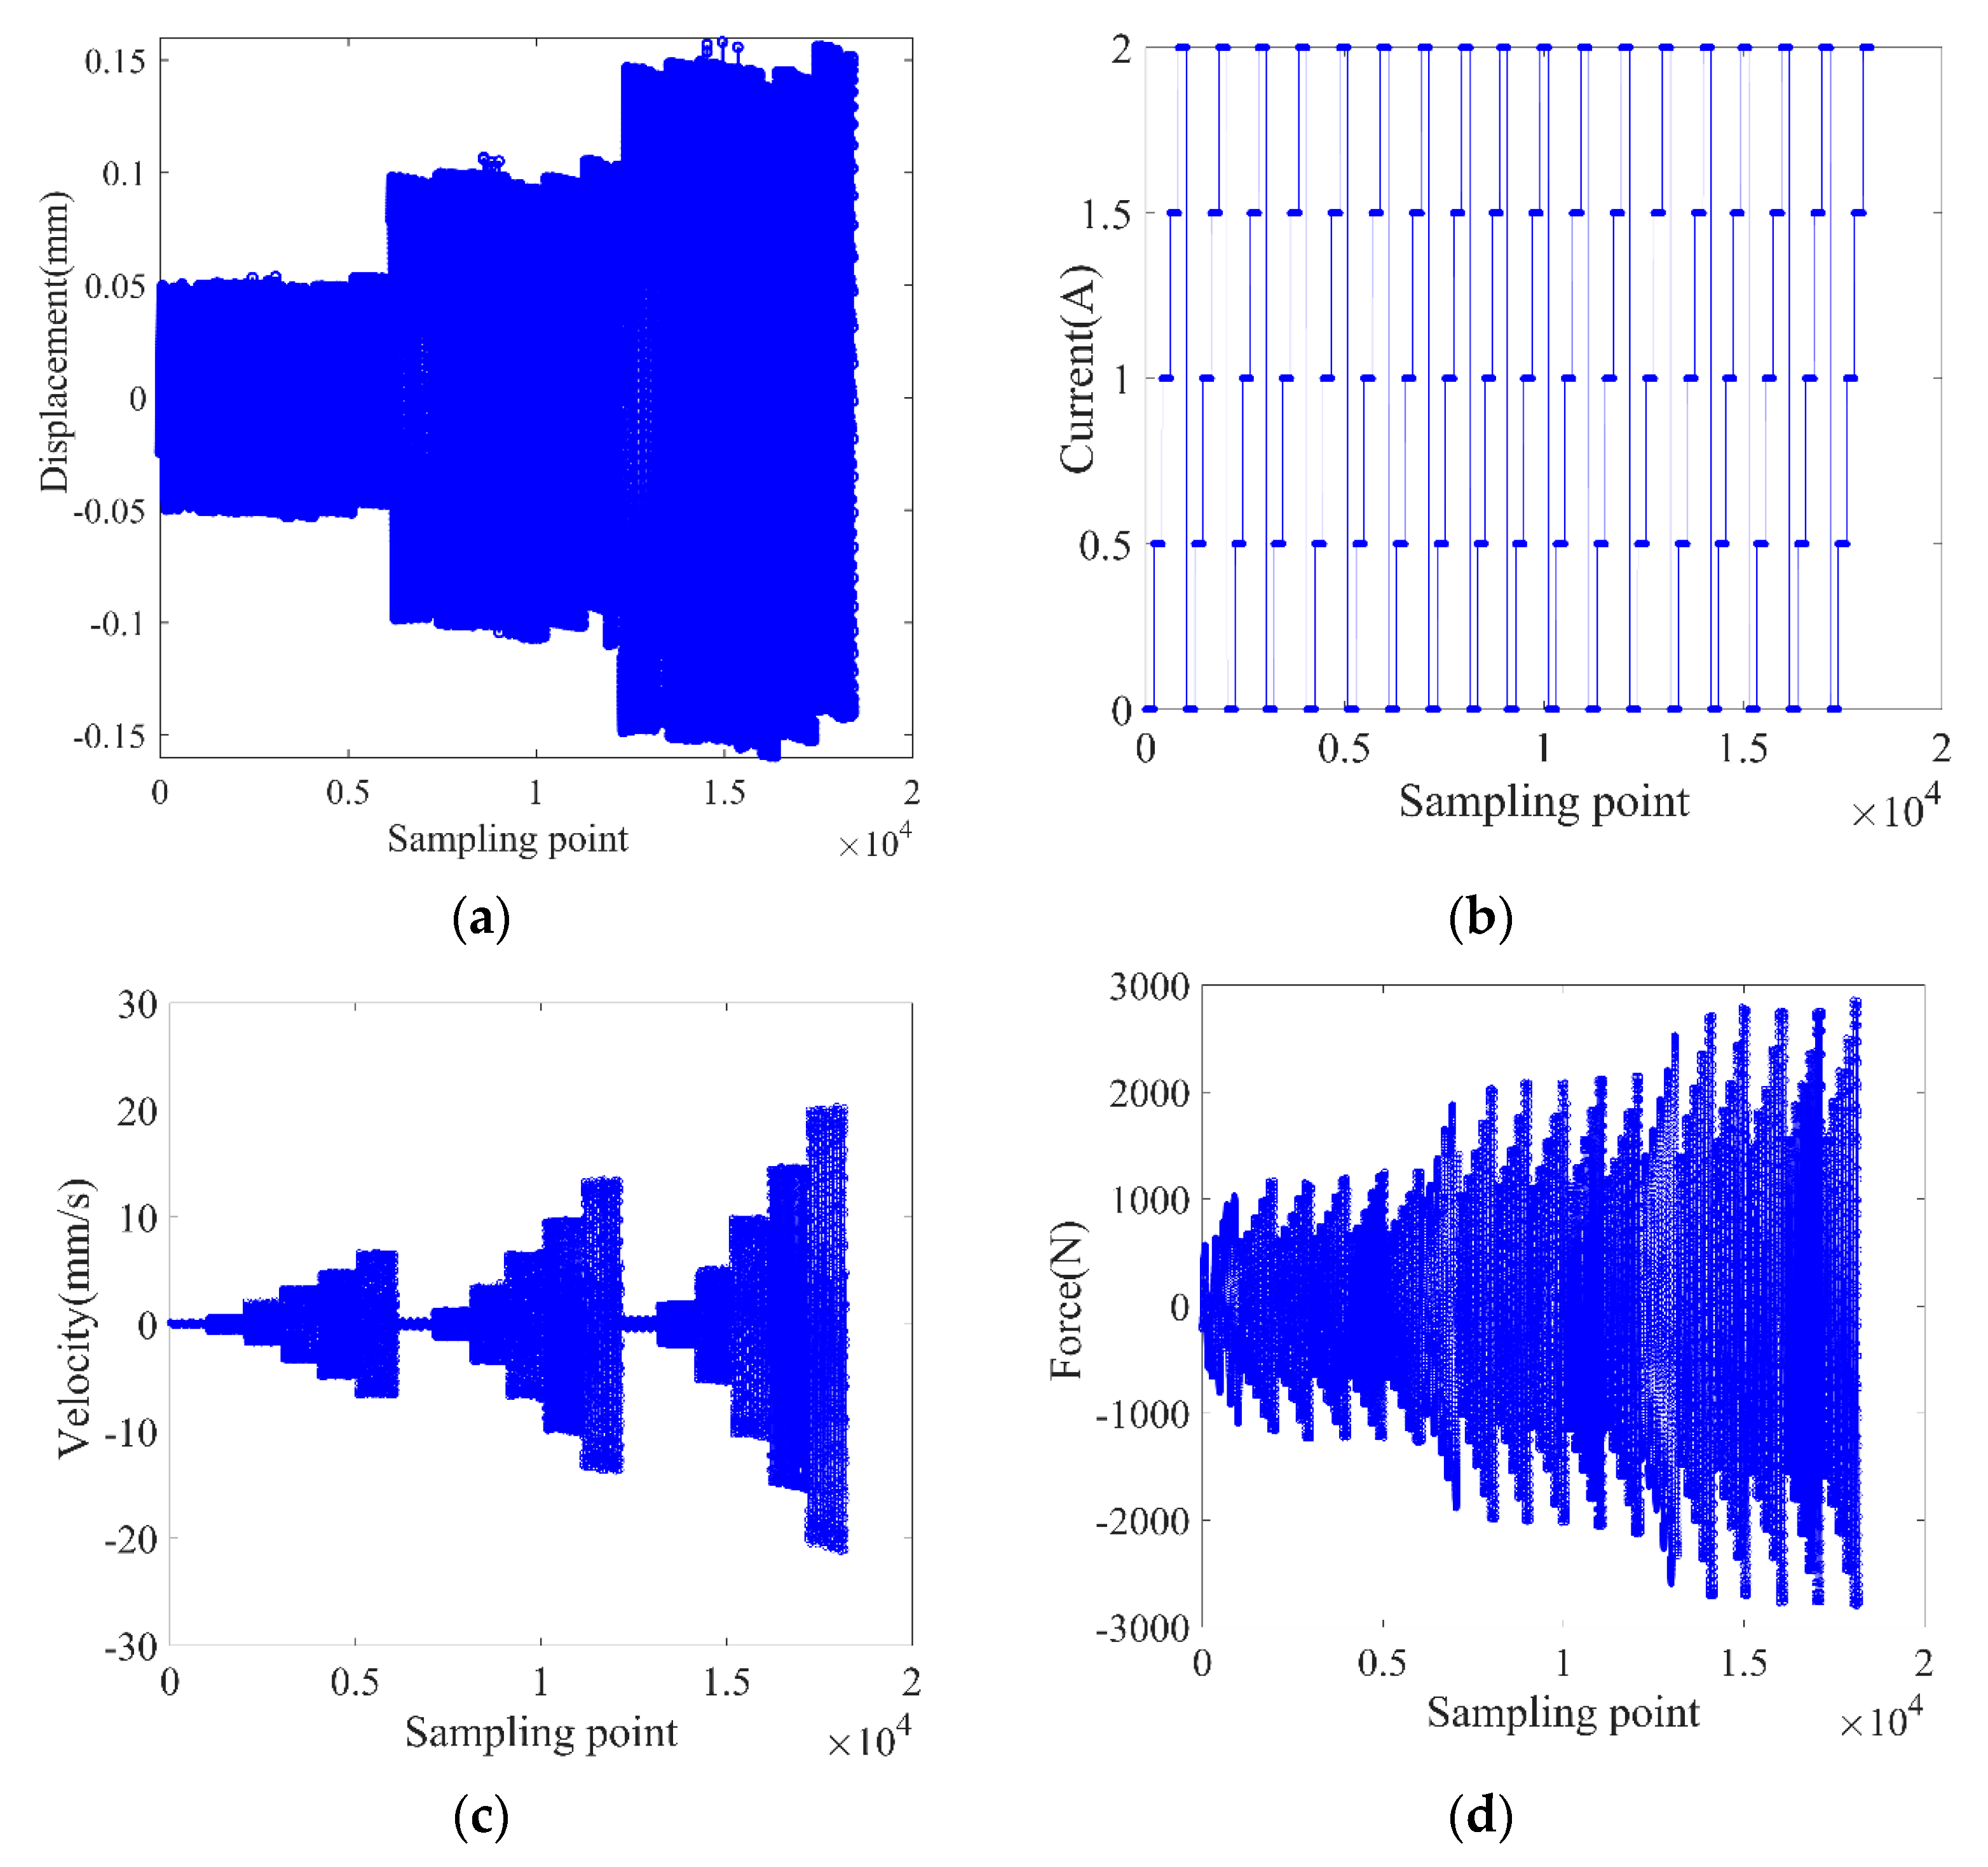
The experimental data is divided into two groups, one is the training data of BPANN, and the other is testing data. By referring to Fu’s work [
17], the training data are one cycle samples in each excitation case (various amplitude and current) as shown in
Figure 6; and the testing data are one-cycle samples in a specified condition (one amplitude and current).
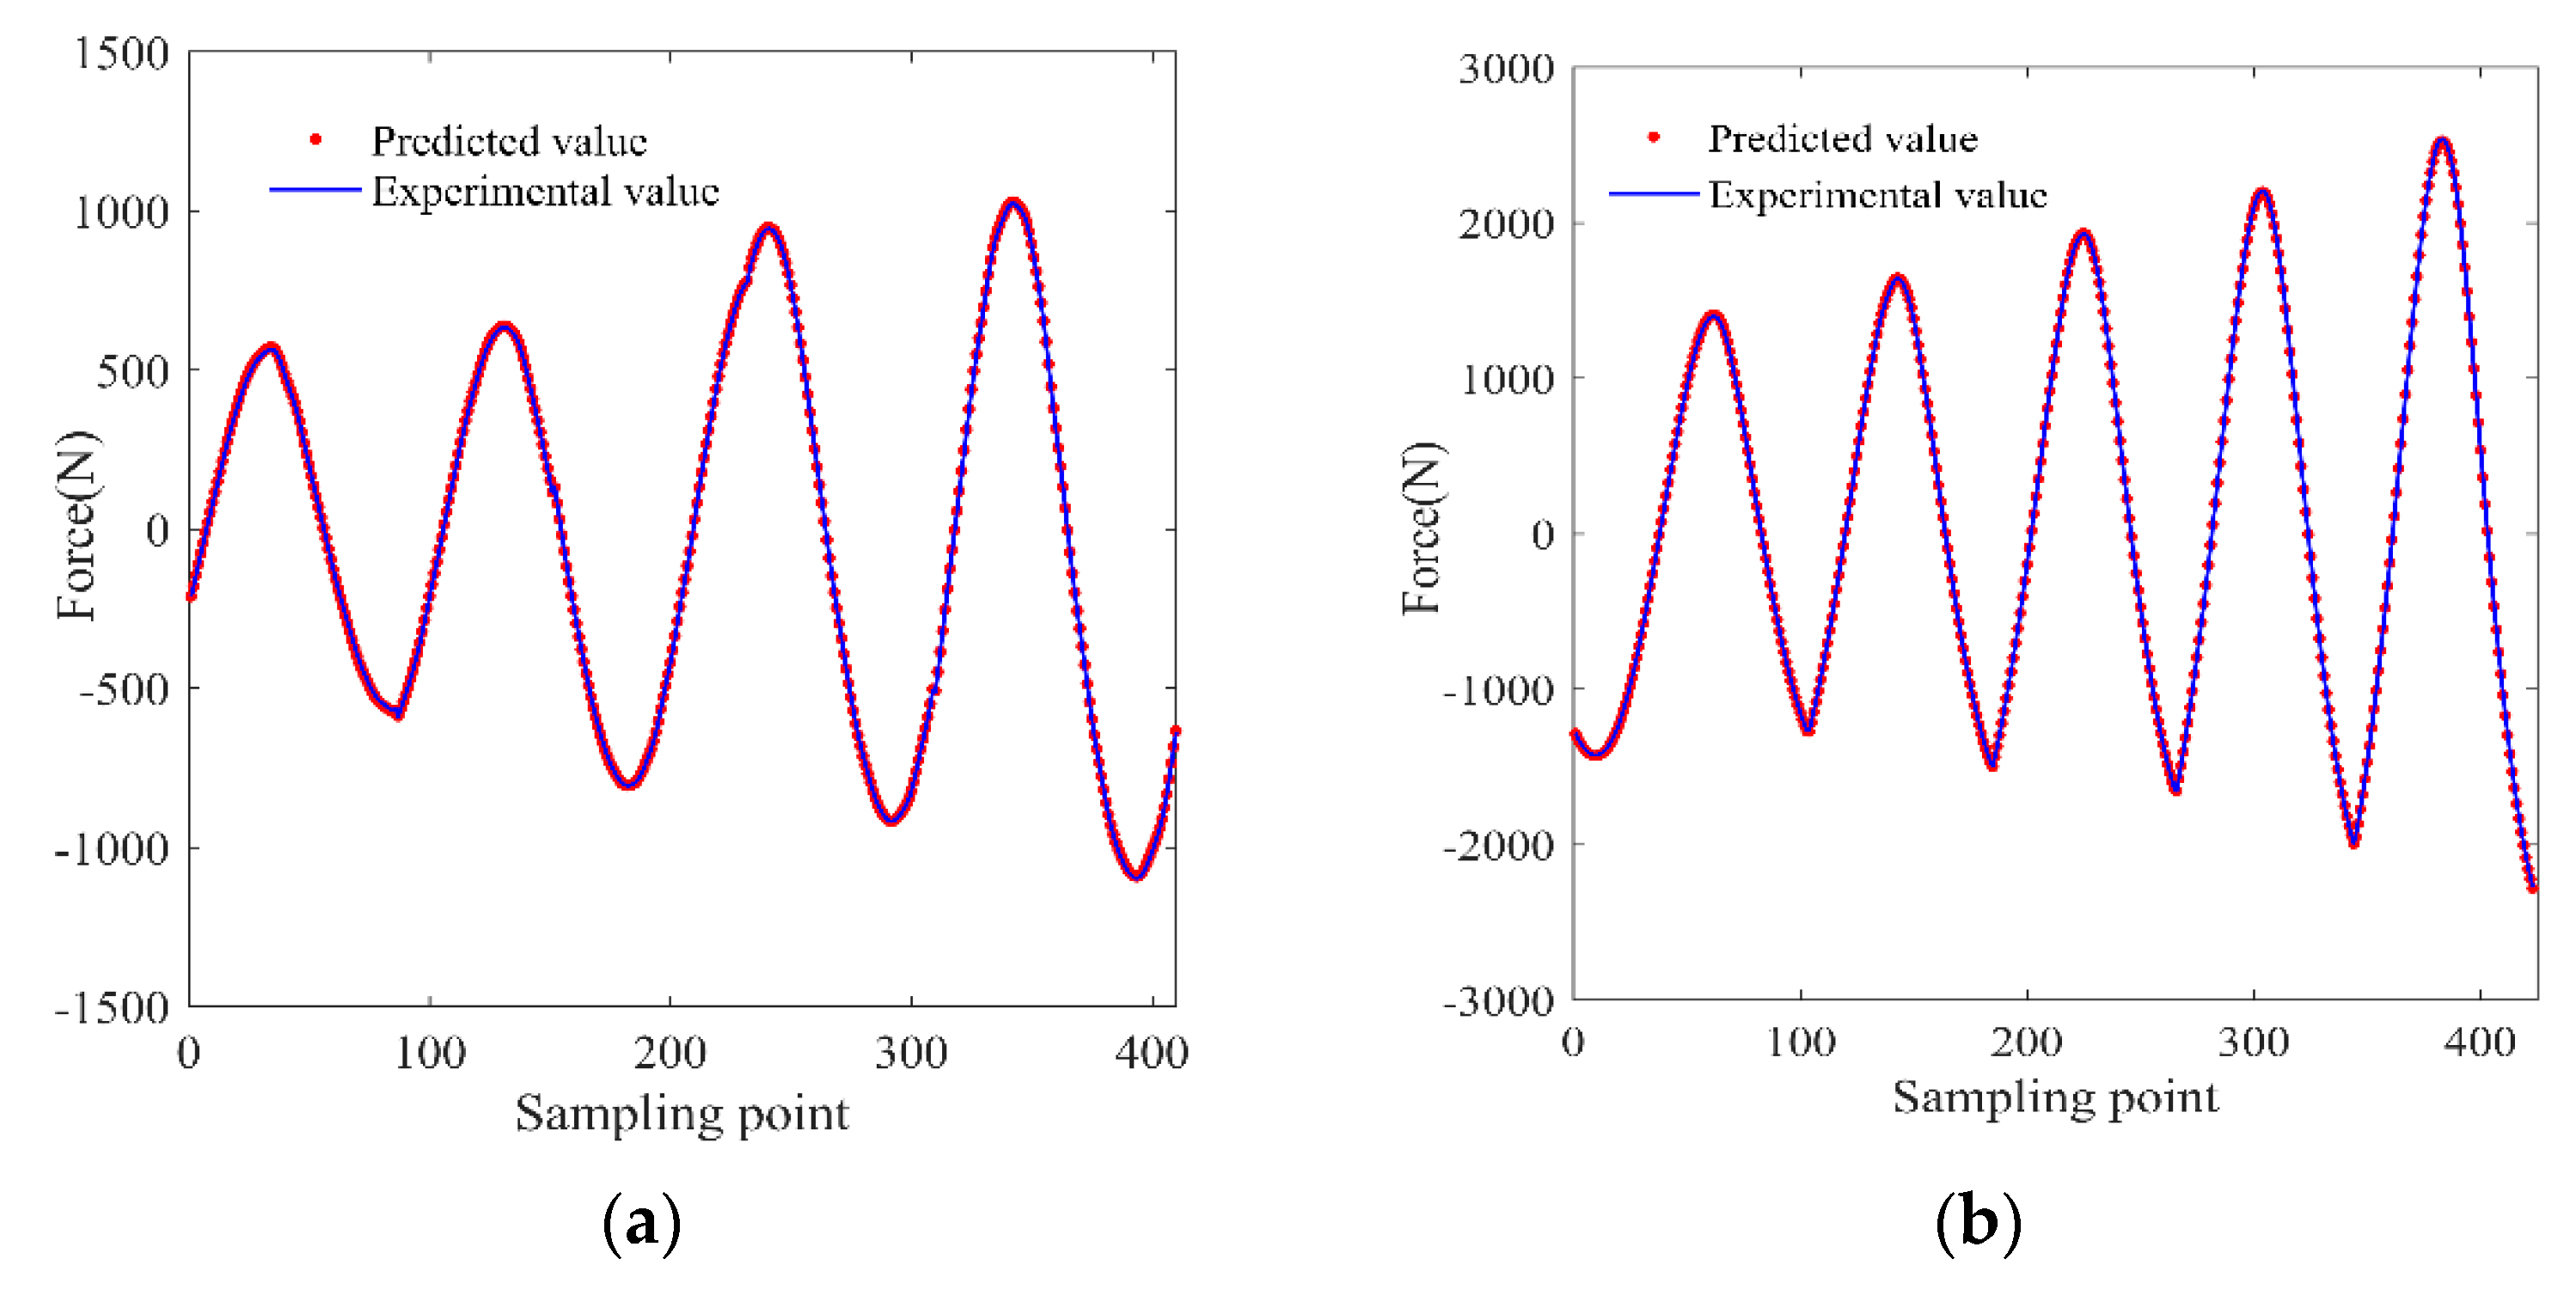
The training results of BPANN model are compared with experimental results as shown in
Figure 7. At minimum displacement amplitude (0.05 mm), the comparison of output force of MRE isolator in all currents is presented in
Figure 7a, and
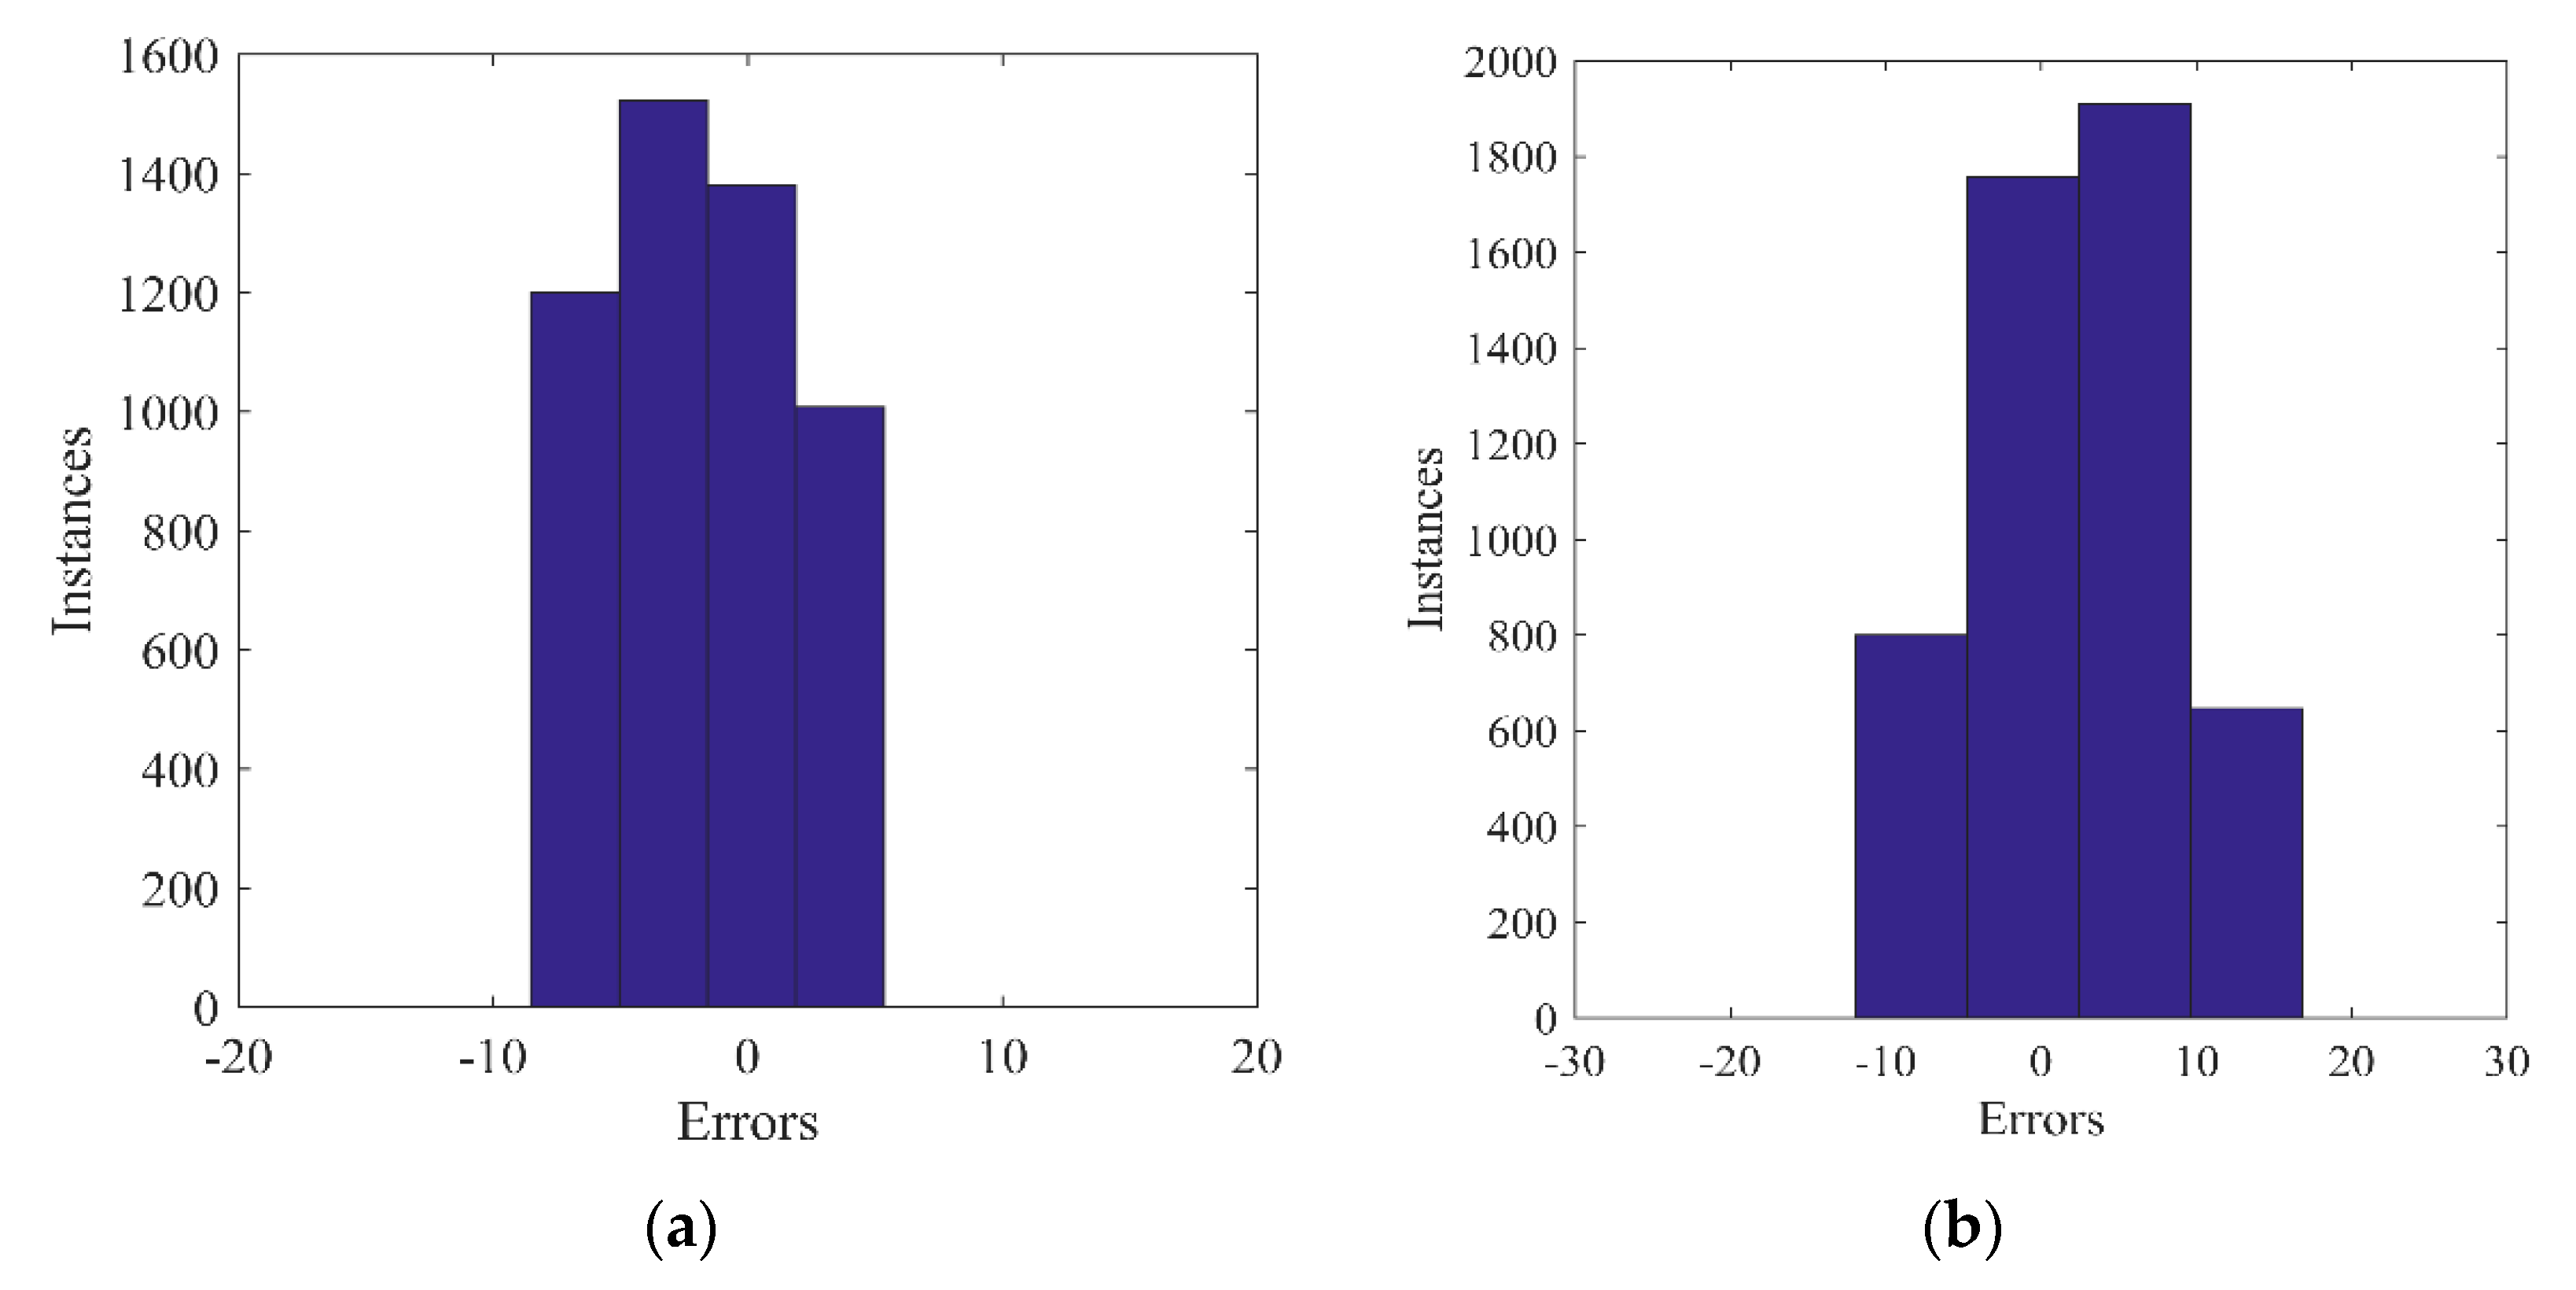
Figure 7b illustrates the compared results at maximum displacement amplitude (0.15 mm) under all currents. Their corresponding error distributions are shown in
Figure 8.
In
Figure 7, it is observed that the predicted output force of BPANN model could well trace the experimental force under different loading conditions.
Figure 8 shows the error distribution of training results is in the range of [−7.6, 5.5] in minimum loading amplitudes and in the range of [−10.6, 17.5] under maximum loading amplitude. Hence, it is obvious that the error range of predicted force by the BPANN model is quite low and most of the error distributes in the vicinity of zero. Based on these figures, it is known that the trained BPANN model could well depict the responses of MRE isolator under different loadings, which verifies its validation.
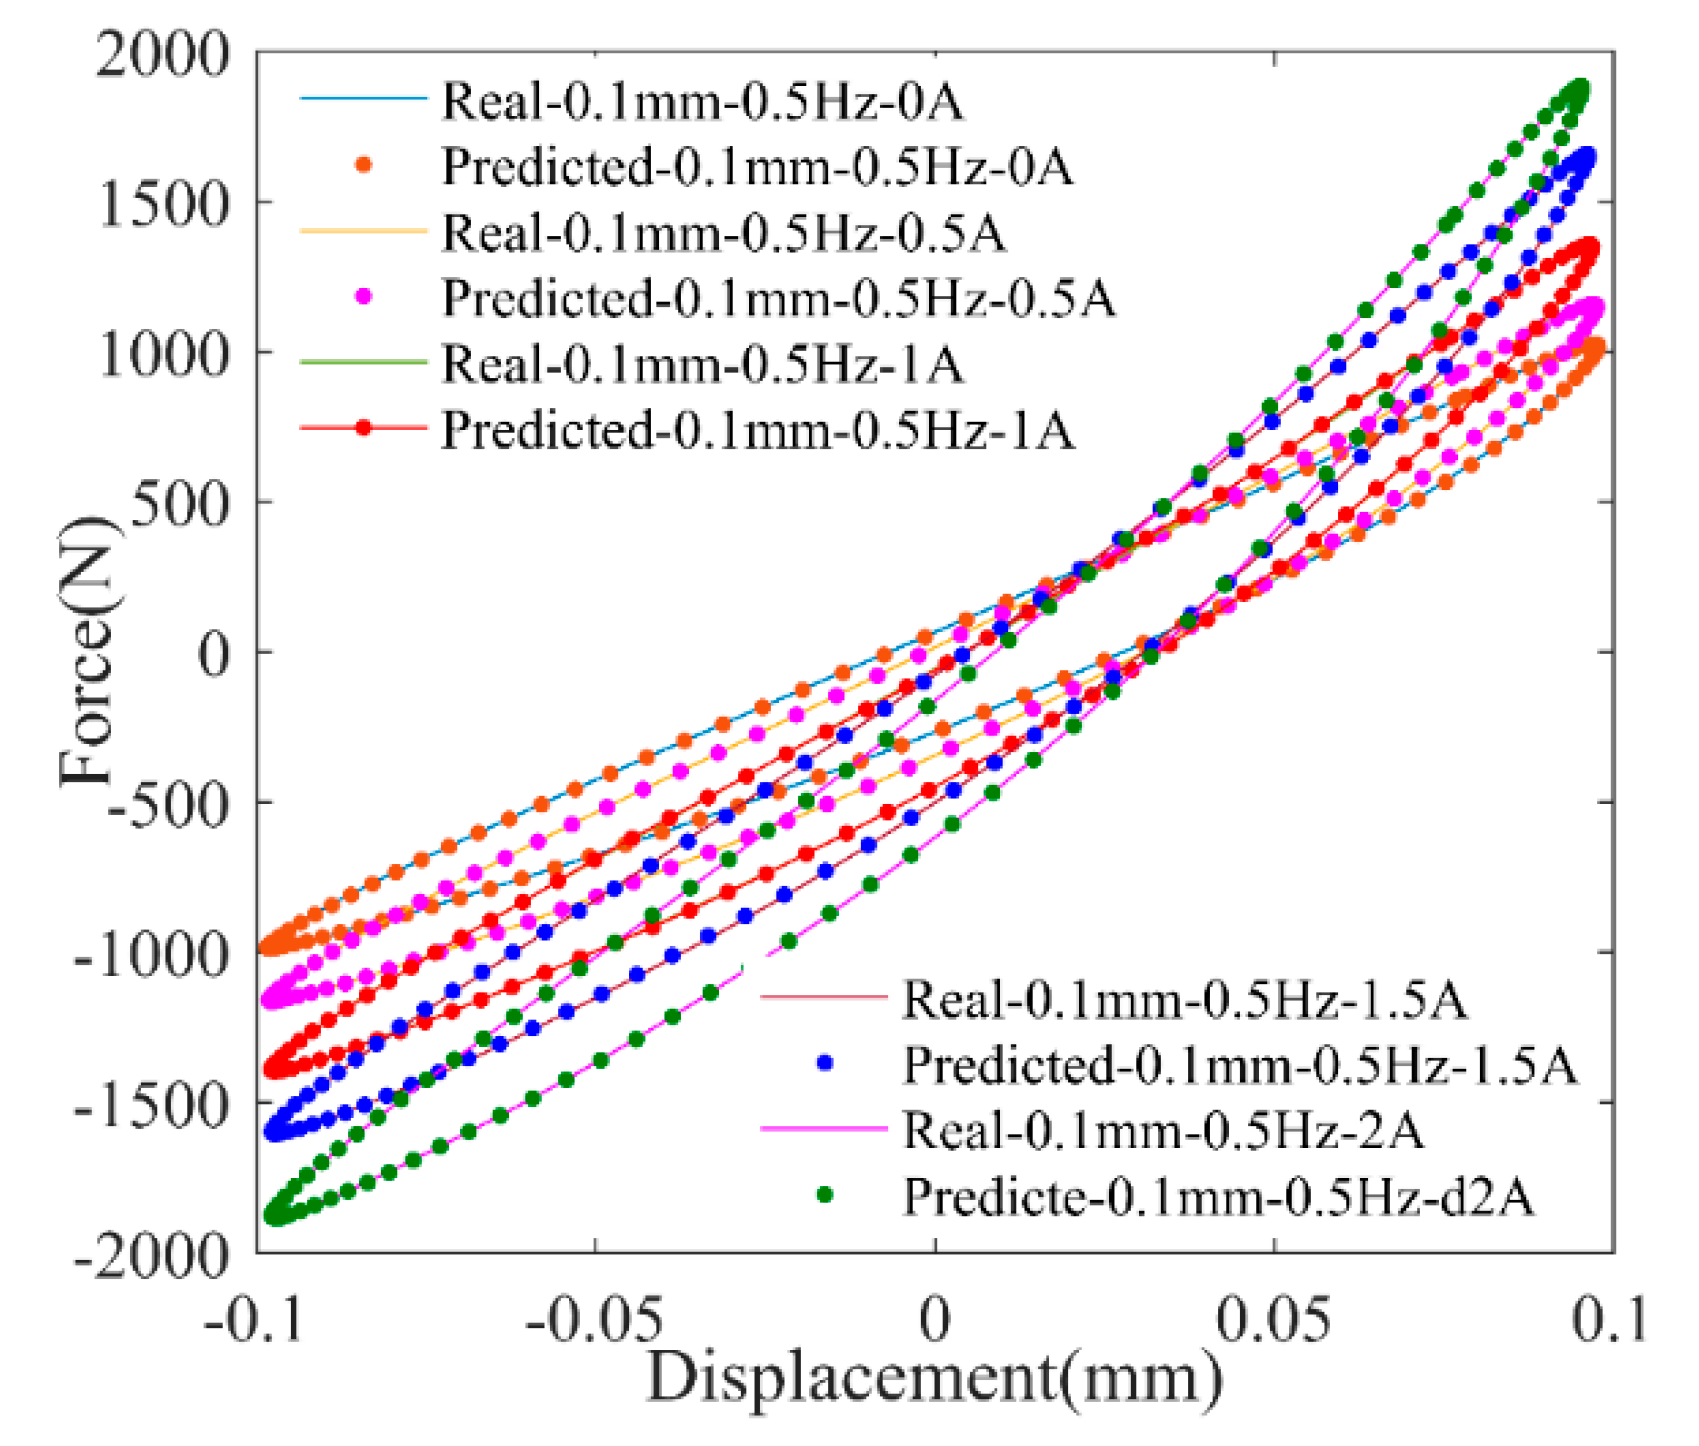
Figure 9 shows the comparisons of force–displacement curves of MRE isolator between experimental results and BPANN predicted results. For evaluating the prediction error, the index of the MSE (mean square error) in Equation (6) is utilized.
where
s is the sum of sample data;
Fp and
Fe are predicted force and experimental force, respectively.
As shown in
Figure 9, the proposed BPANN model could portray the nonlinear relationship between force and displacement in correspondence of experimental results, and the variable stiffness, damping properties are also well described with different applied currents. Additionally, by calculation, the forecasting results of BPANN on MSE is less than 8%, which quantitatively demonstrates the model’s accuracy.
