Fingerprints Classification through Image Analysis and Machine Learning Method

Abstract
:1. Introduction
2. Related Work
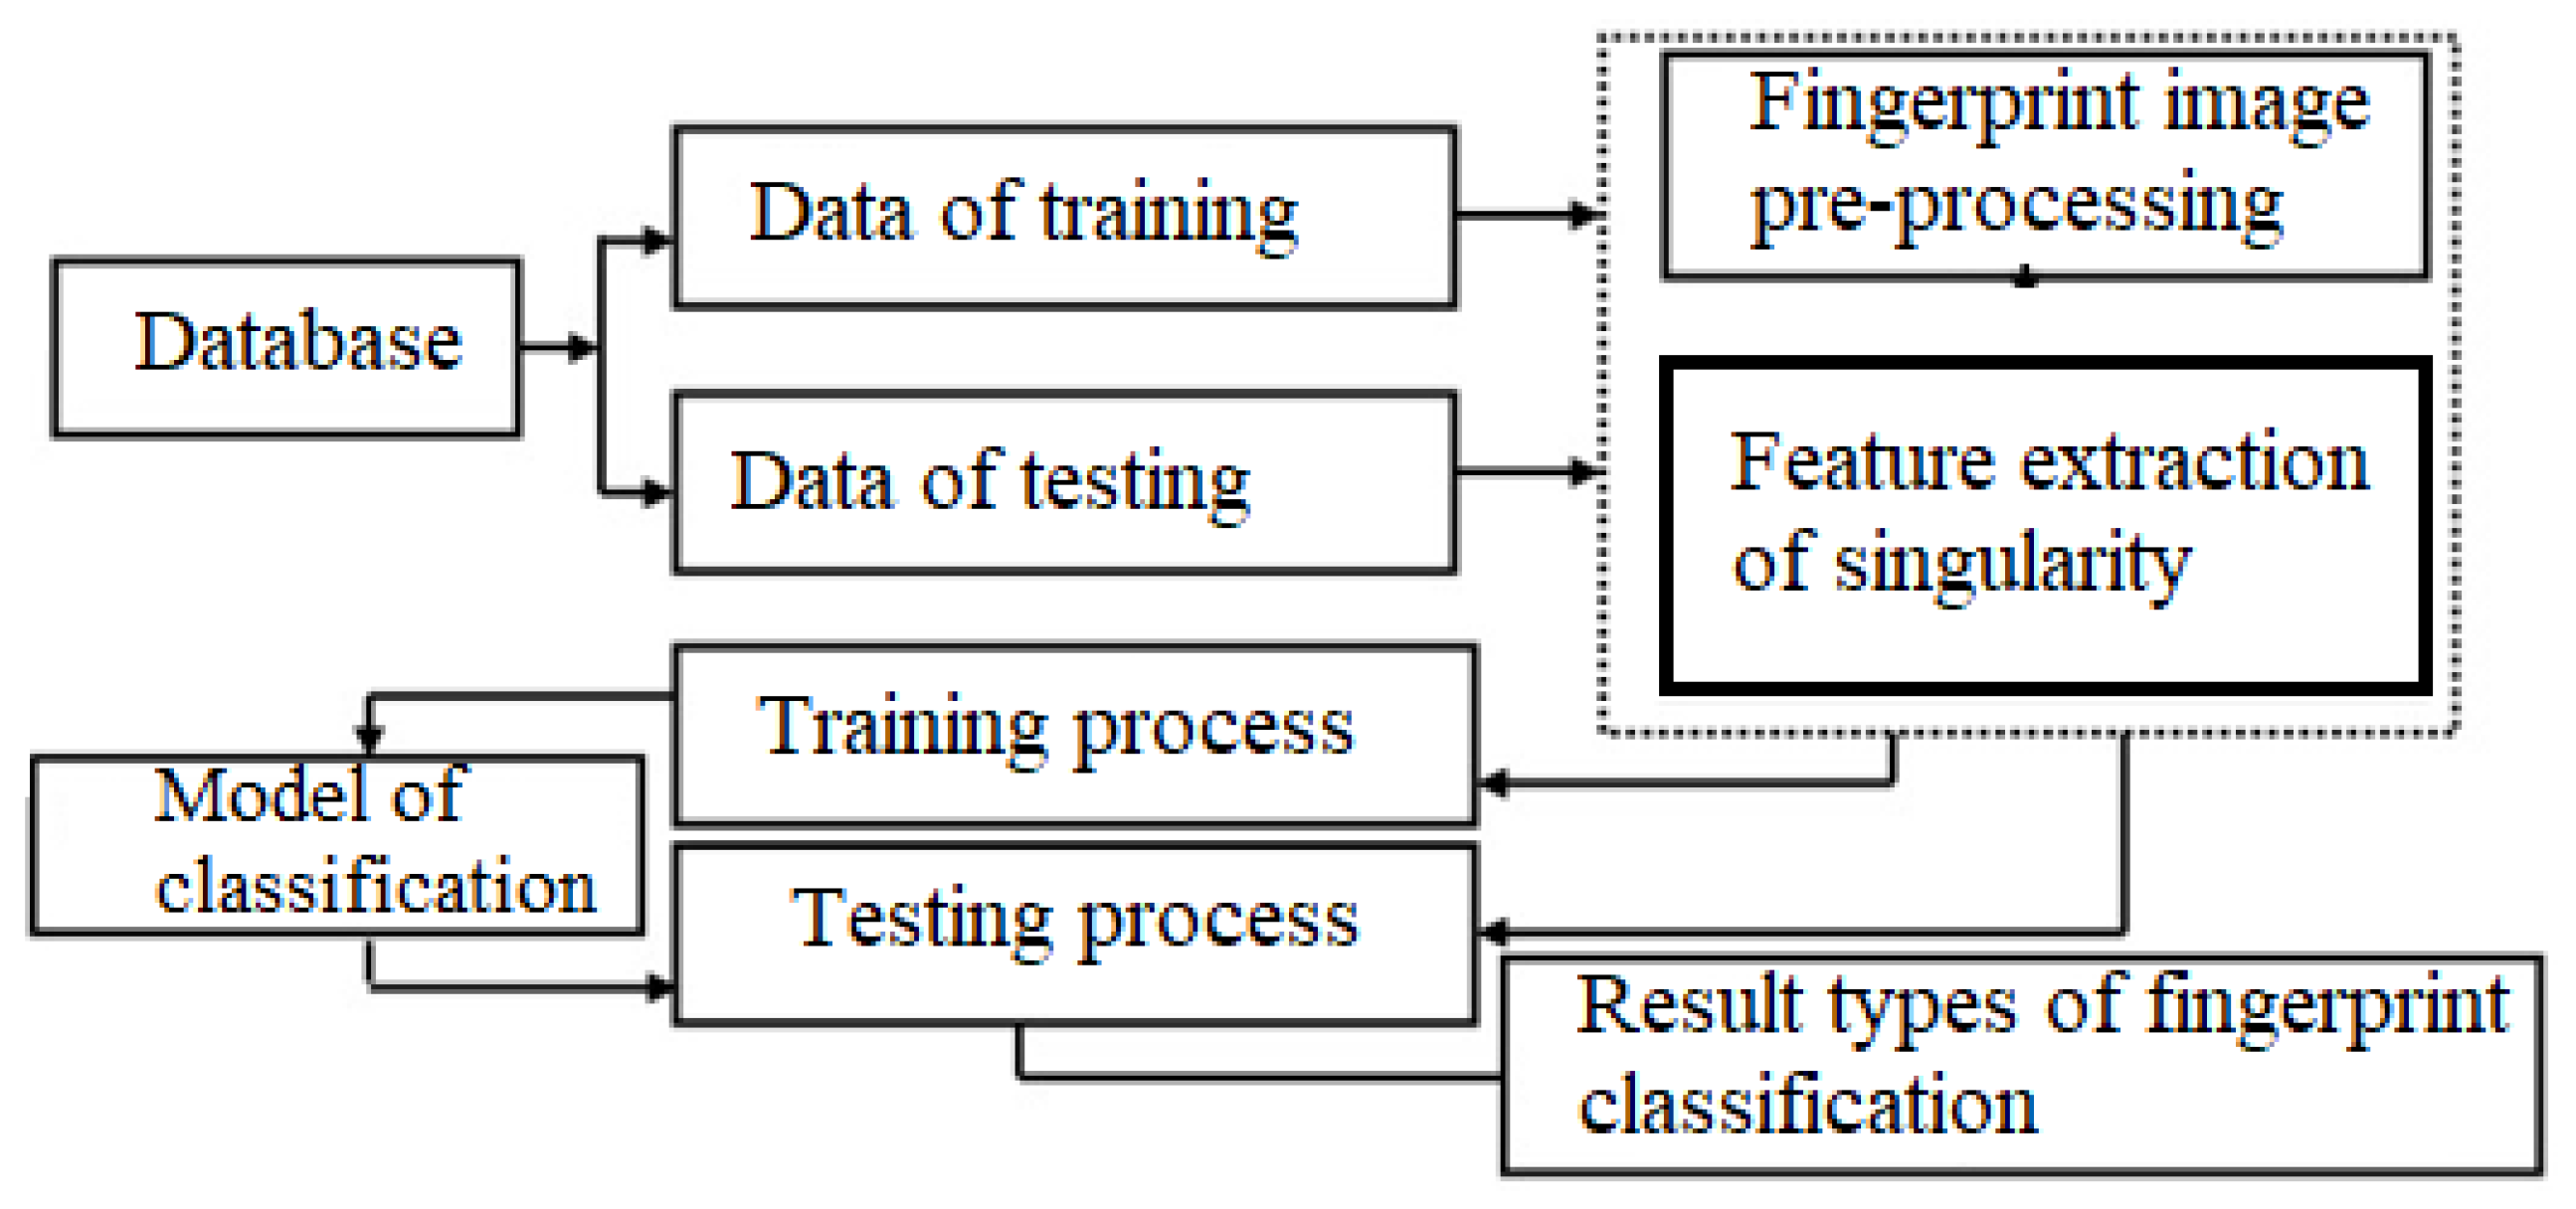
3. Proposed Method
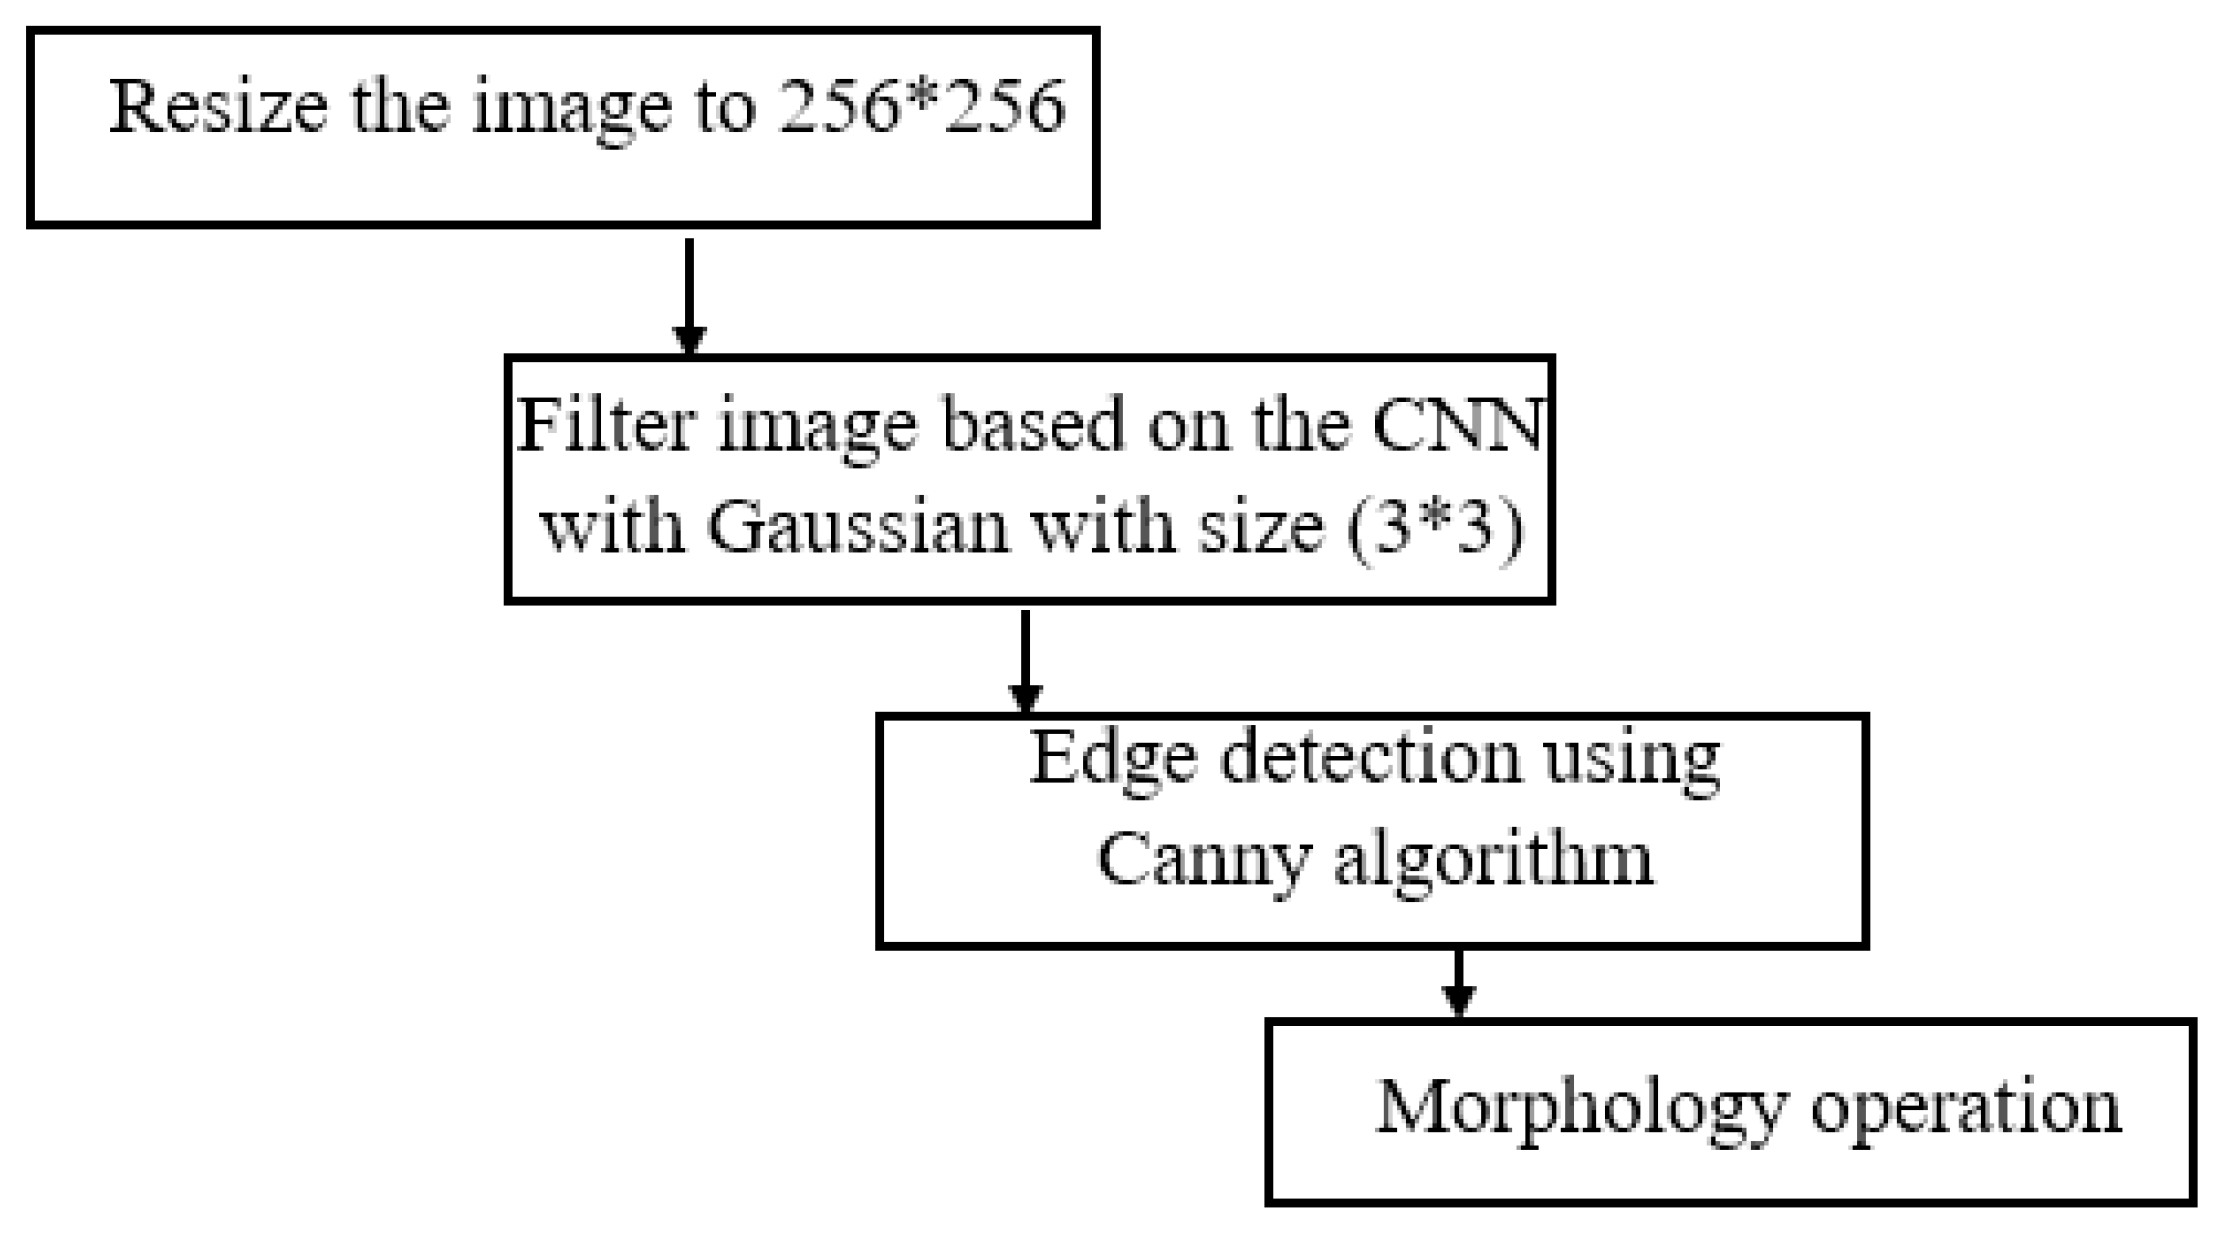
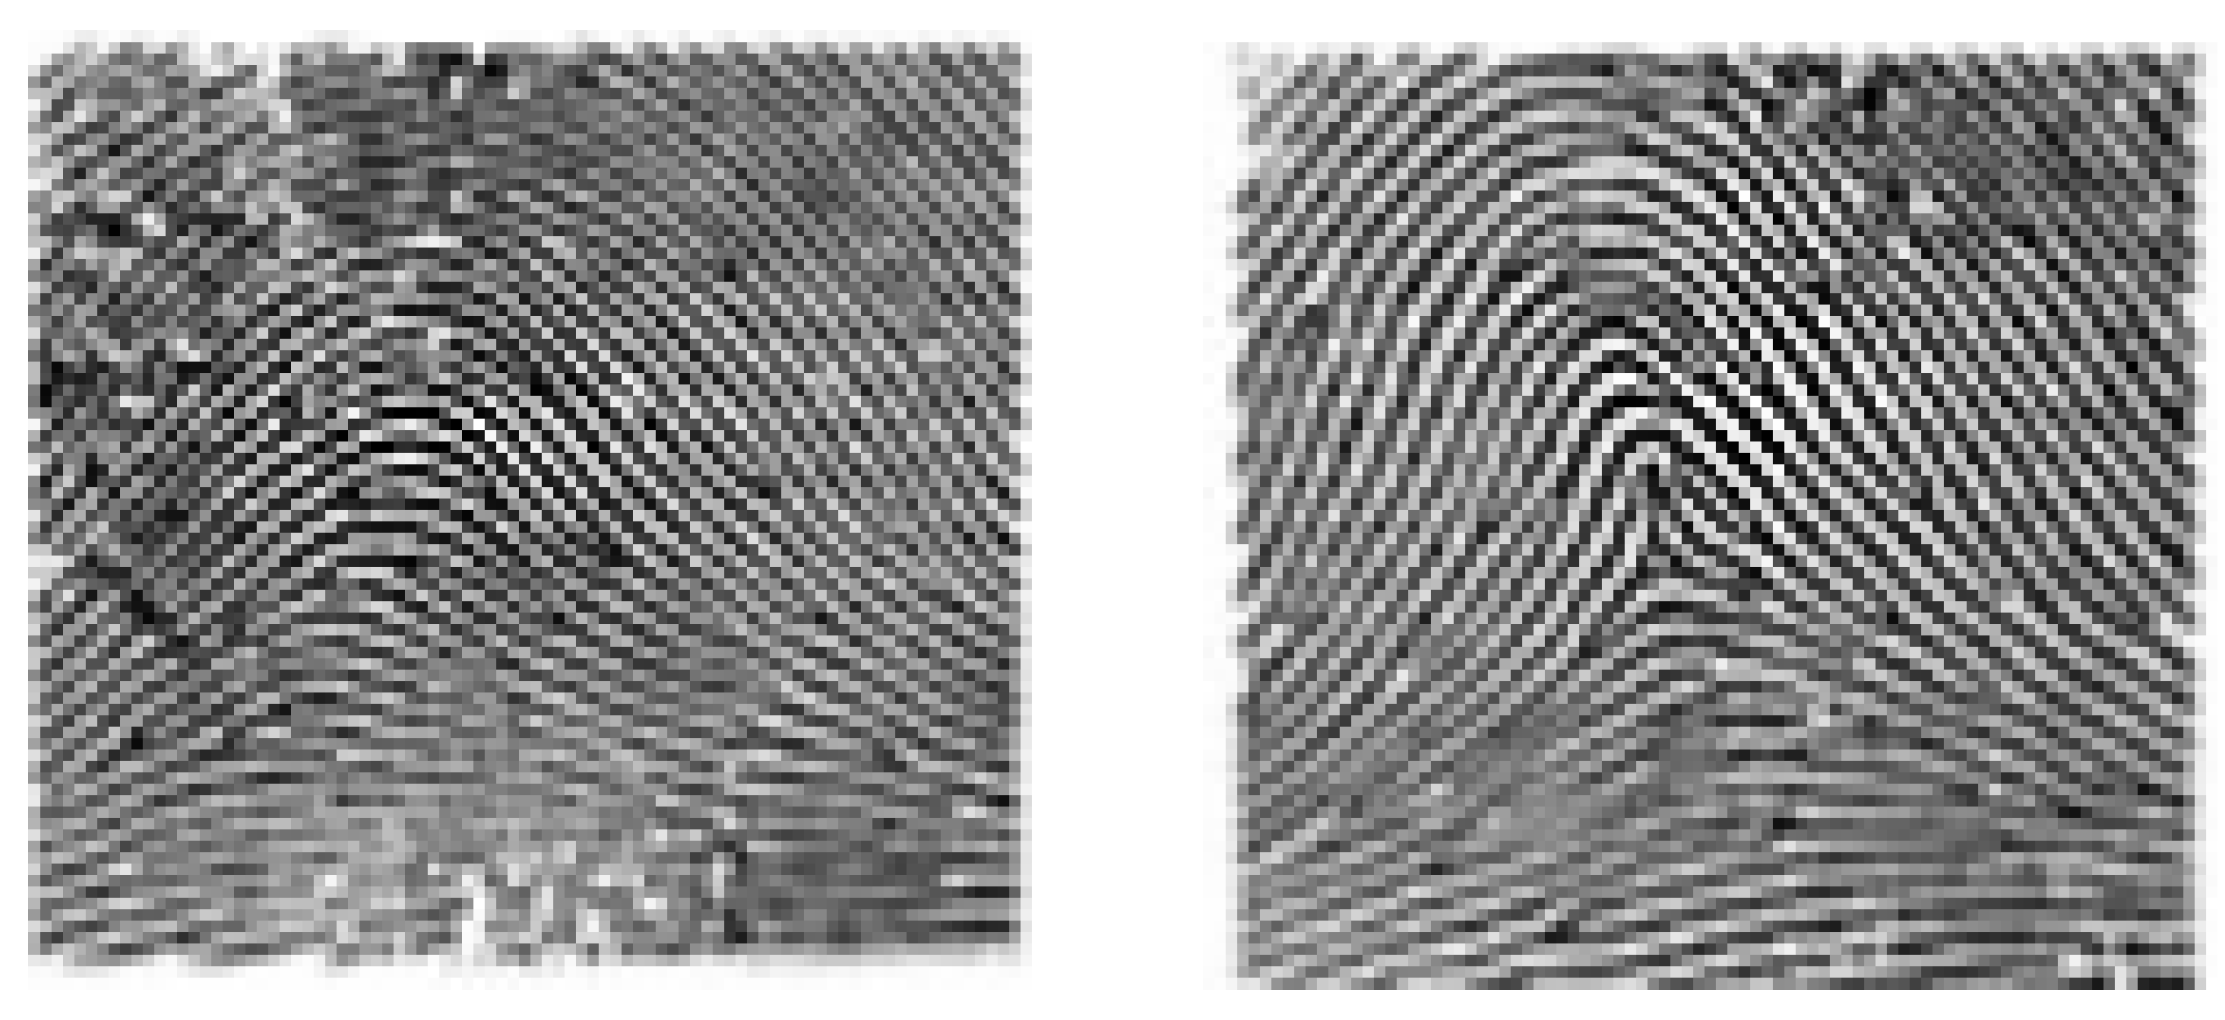
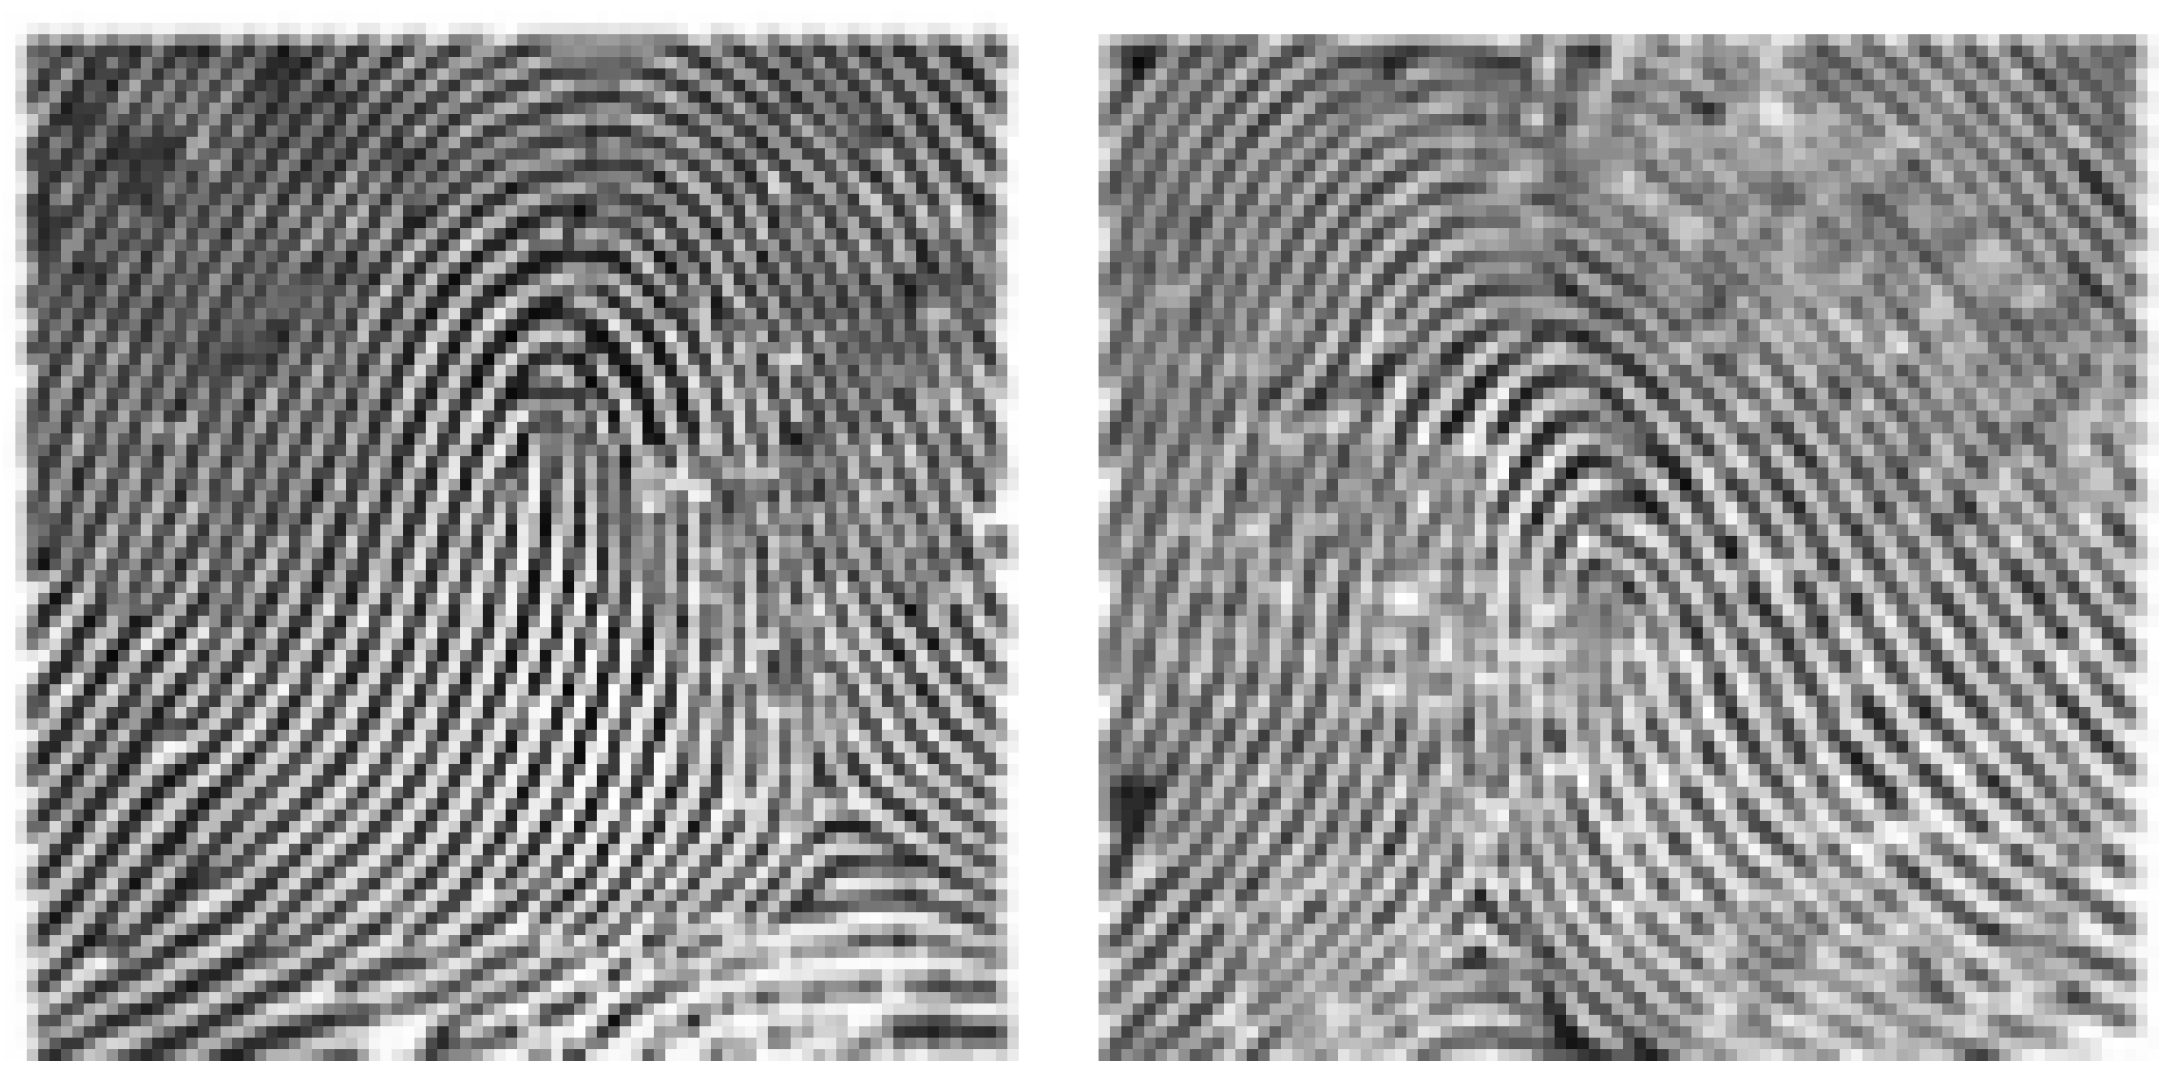
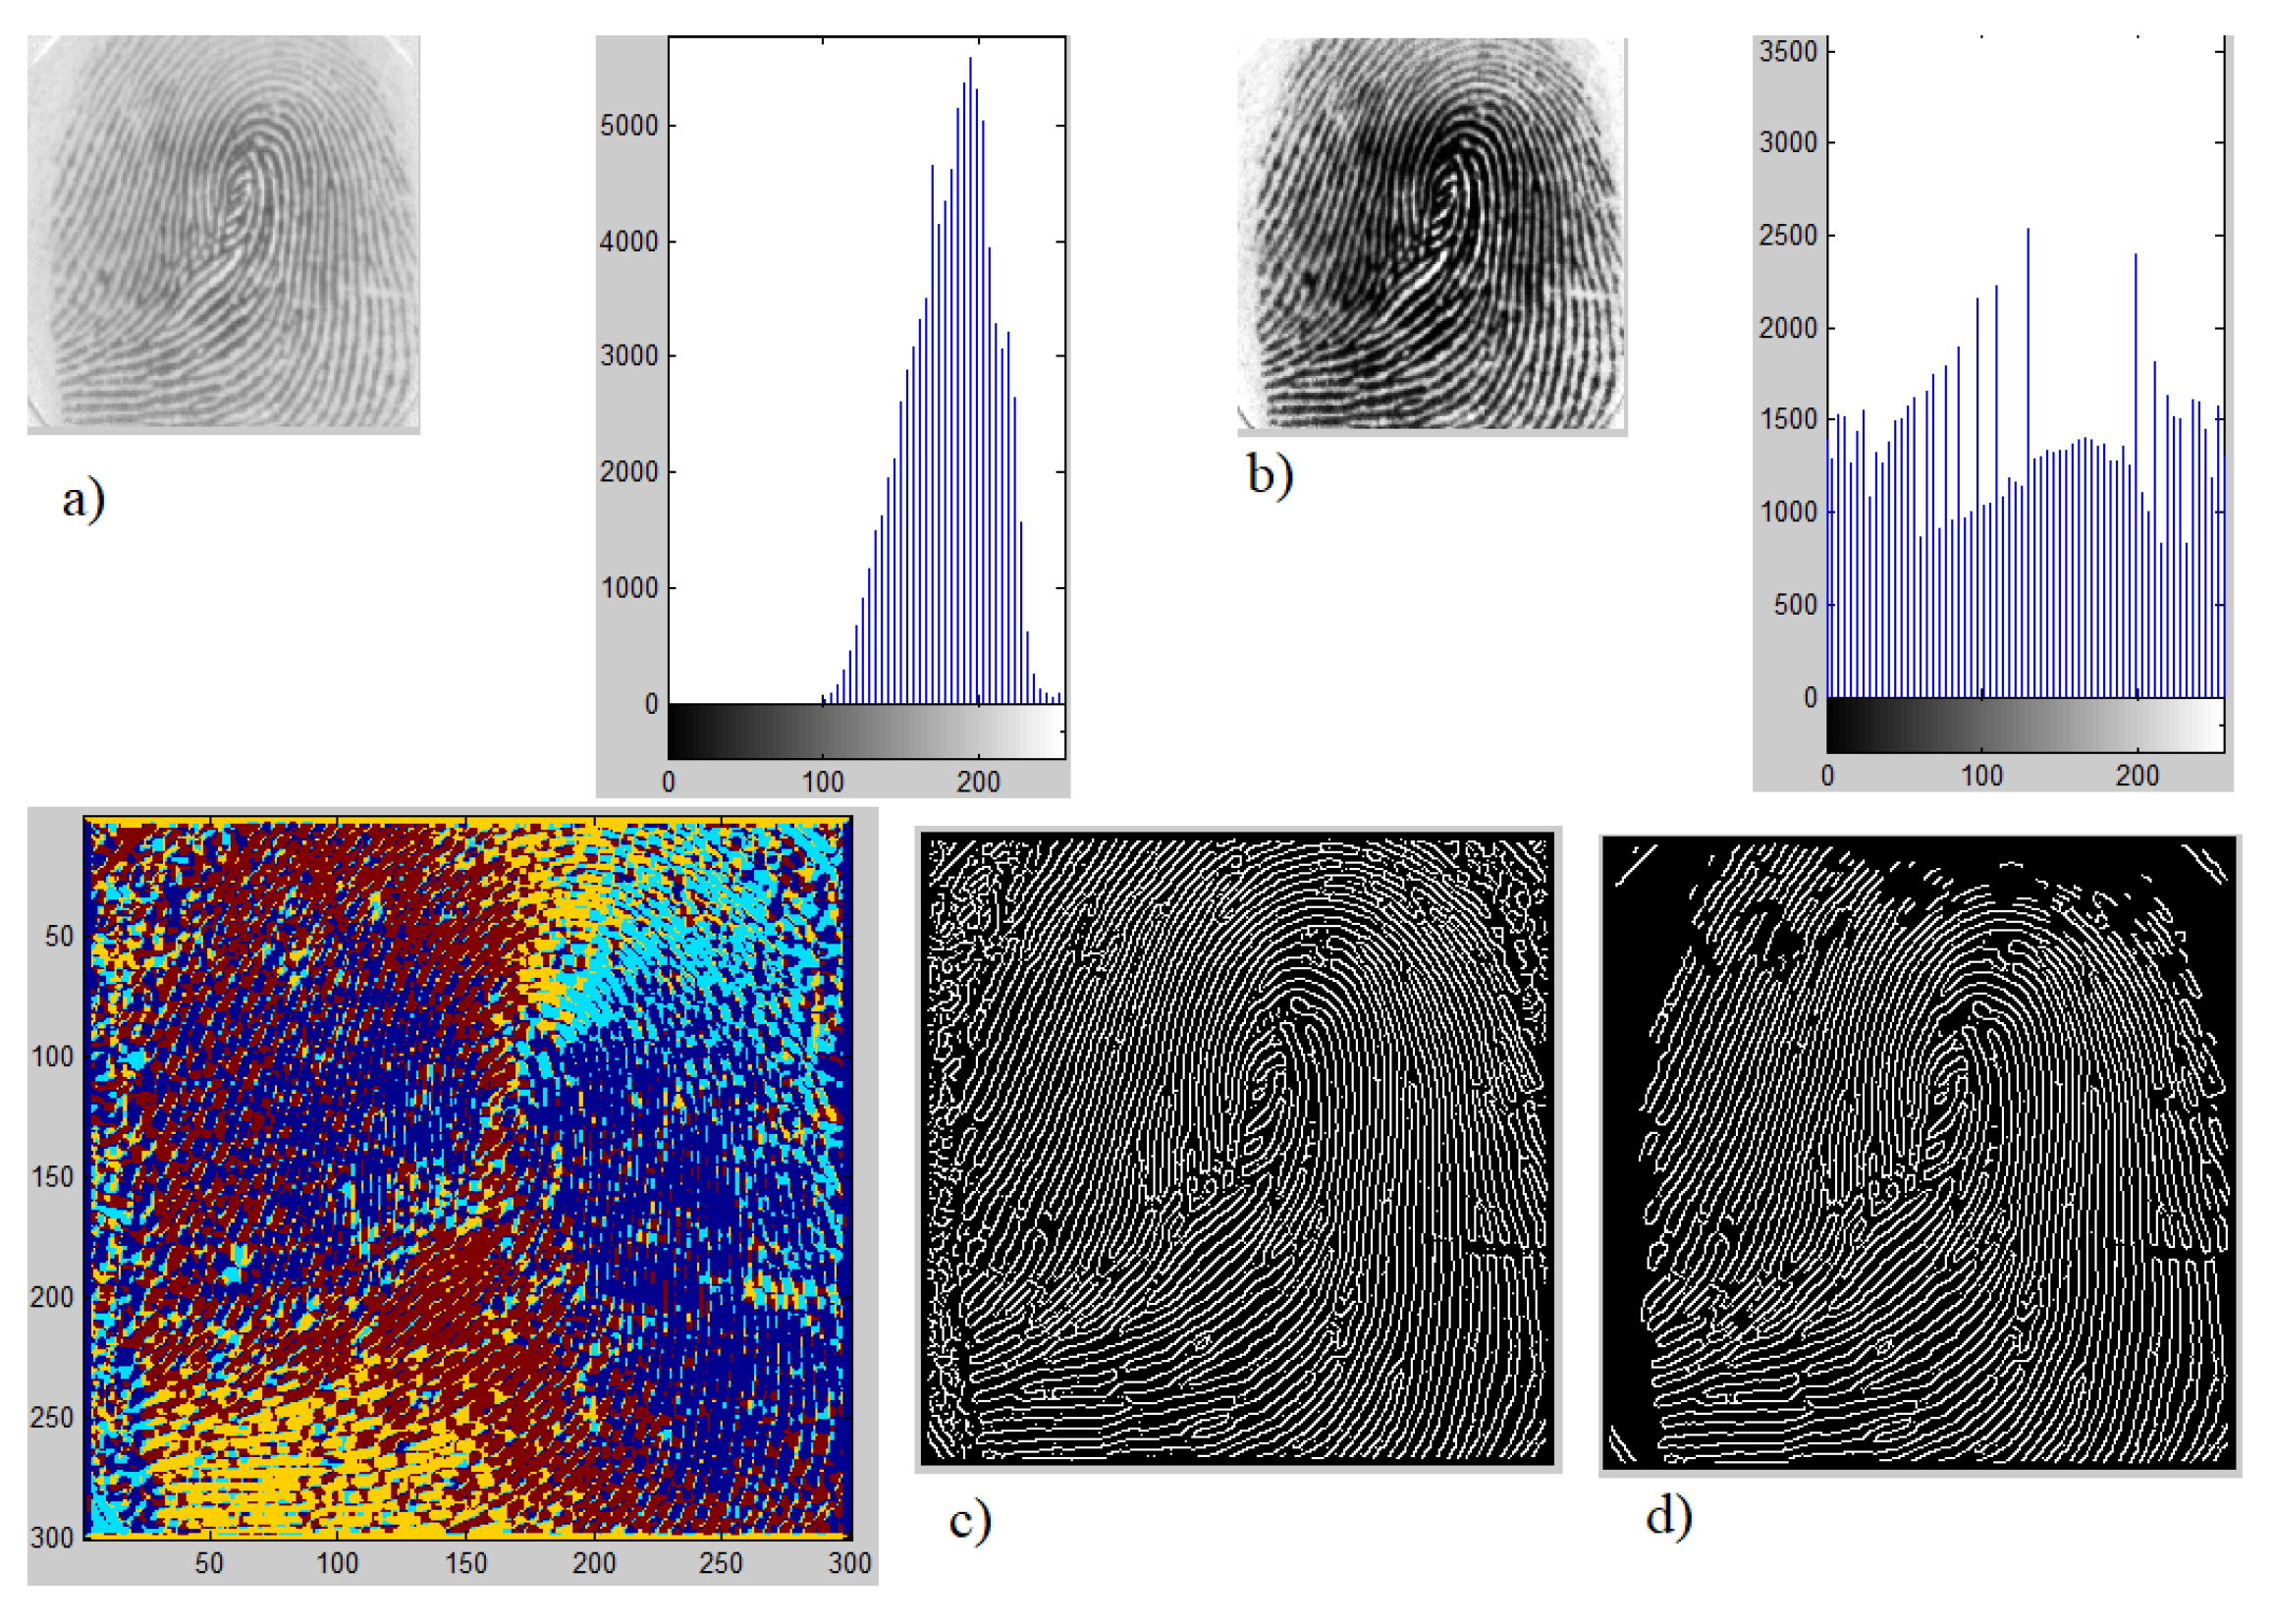
3.1. Fingerprint Image Pre-Processing and Enhancement
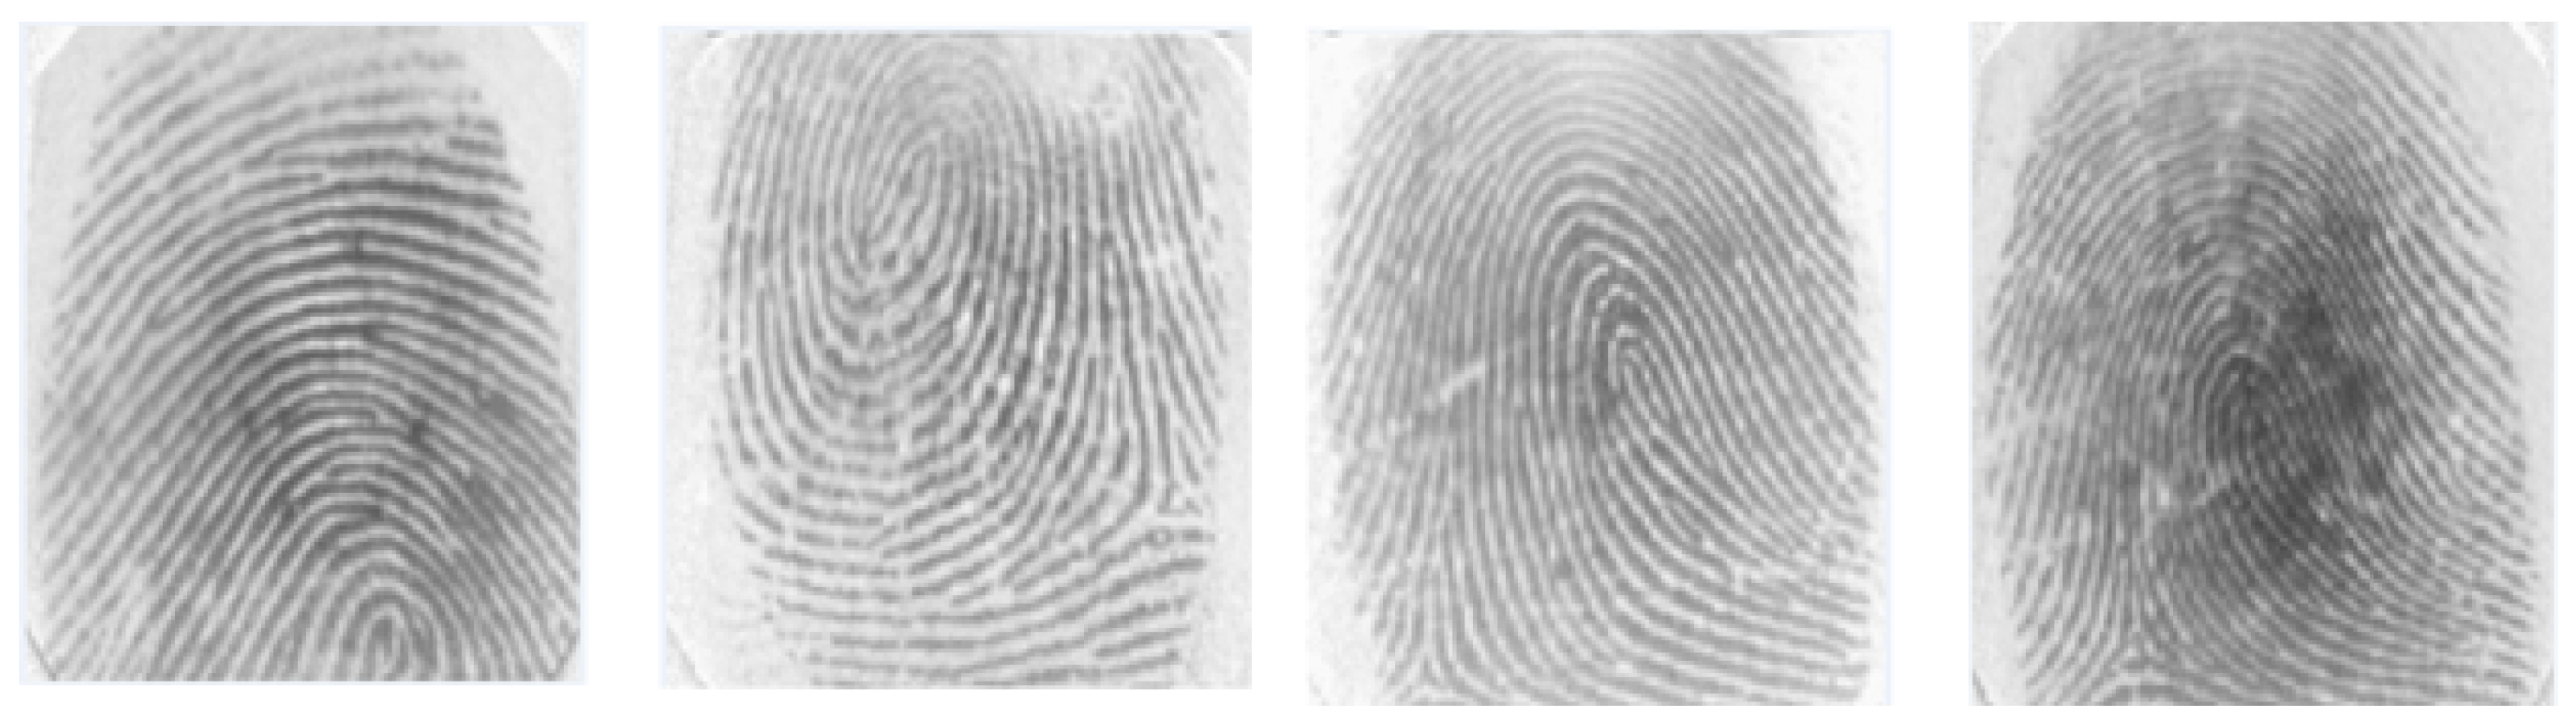
3.2. Types of Fingerprint and Features Extraction
- Arch: These occur in about 5% of the encountered fingerprints. The identifying features of this arch are that the fingerprints have overlapping shapes that form layers and have a mountain-like peak. Arch of fingerprints are divided into several categories—AS (the lines are stacked on top of each other, unconcerned, no intersection.), AE (a combination of whorl and arch group, the distance from the center to the intersection of eagles is less than 5 veins), AU, AR (the combination of the loop group with arch, the distance from the center to the intersection is less than 5 fringe lines) as shown in Figure 3.
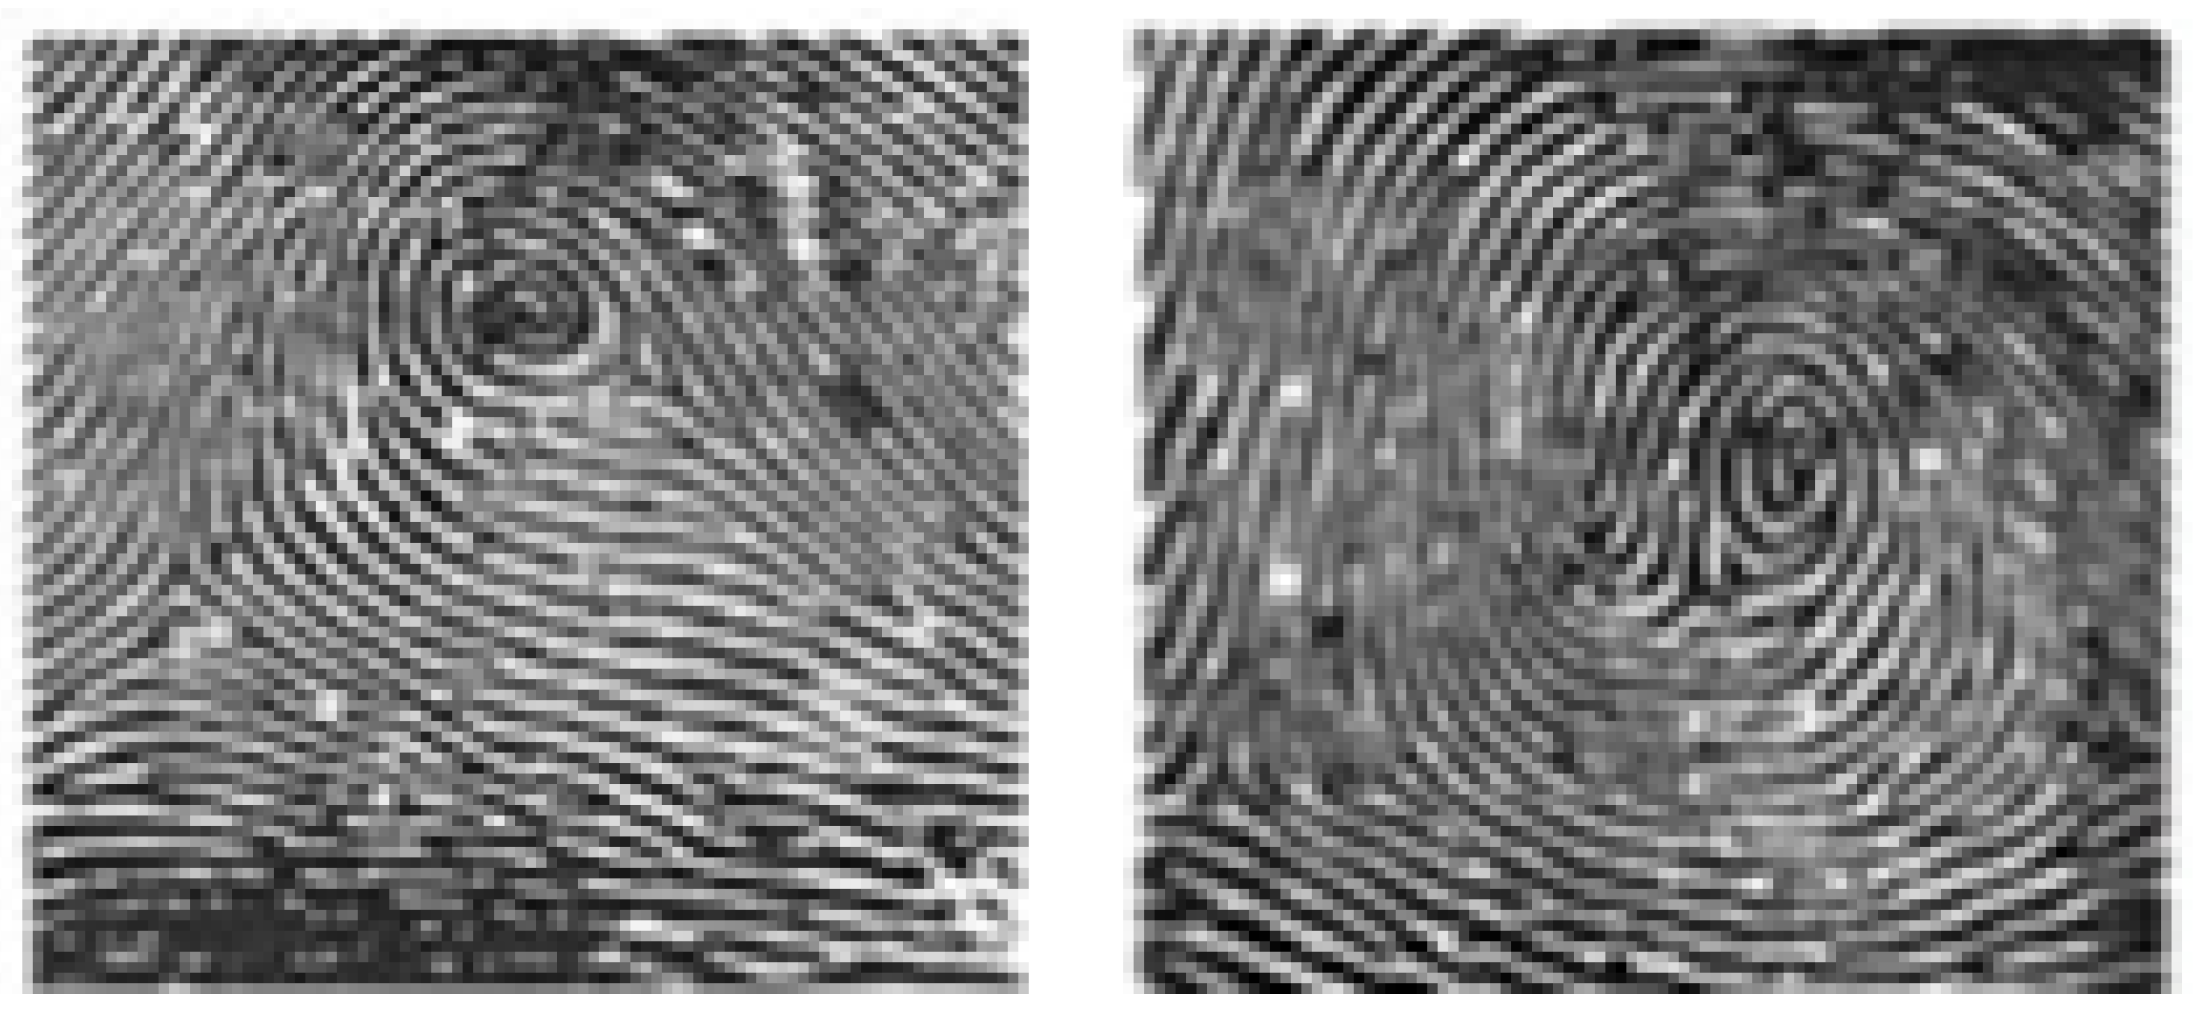
- Loop: It is called the loop (can be seen in almost 60% to 65% of fingerprints worldwide) fingerprint because it is shaped like a water wave with the following features—the ridges make a backward turn in loops, triangular with a center and an intersection. Divided into two types: RL—Radial Loop: Top of the triangle facing the pinky finger. It looks like a stream of water flowing downwards (on the little finger). This type accounts for about 6% of fingerprints worldwide. UL—Ulnar Loop: The top of the triangle faces the thumb. It is shaped like a stream of water flowing backward (thumb direction). This form only accounts for 2% of fingerprints worldwide. A loop pattern has only one delta as shown in Figure 4.
- Whorl: This fingerprint only accounts for about 25% to 35% of fingerprints worldwide. Whorl pattern identification is that they have one circuit and 2 Delta (intersection) as shown in Figure 5.
- Step 1. Input image then resize image to
- Step 2. Fingerprint pre-processing and enhancement
- Step 3. At each pixel, the gradient is calculated in two directions x and y are and based on the Formula (1):
- Step 4. Identify singularity points using the Pointcare index [15]. Pointcare index at the pixel with coordinates is the sum of the deviations of direction of adjacent points, calculated as follows in Equation (2):where is the gradient at pixels in two directions.Based on the Pointcare index, we can identify singularity points as follows in Equation (4):
- Step 5. Save and create fingerprint features vector.
4. Classification Fingerprint Based on Random Forest and Decision Tree with Singularity Features
- The number of trees to train model = 2000.
- The function to measure the quality of a split - Gini Impurity.
- Bootstrap samples = True.
- Penalty parameter to measure error term = 1.0.
- Kernel: basis functions.
- Shrinking heuristic = True.
5. Result of Experimentation
5.1. Database
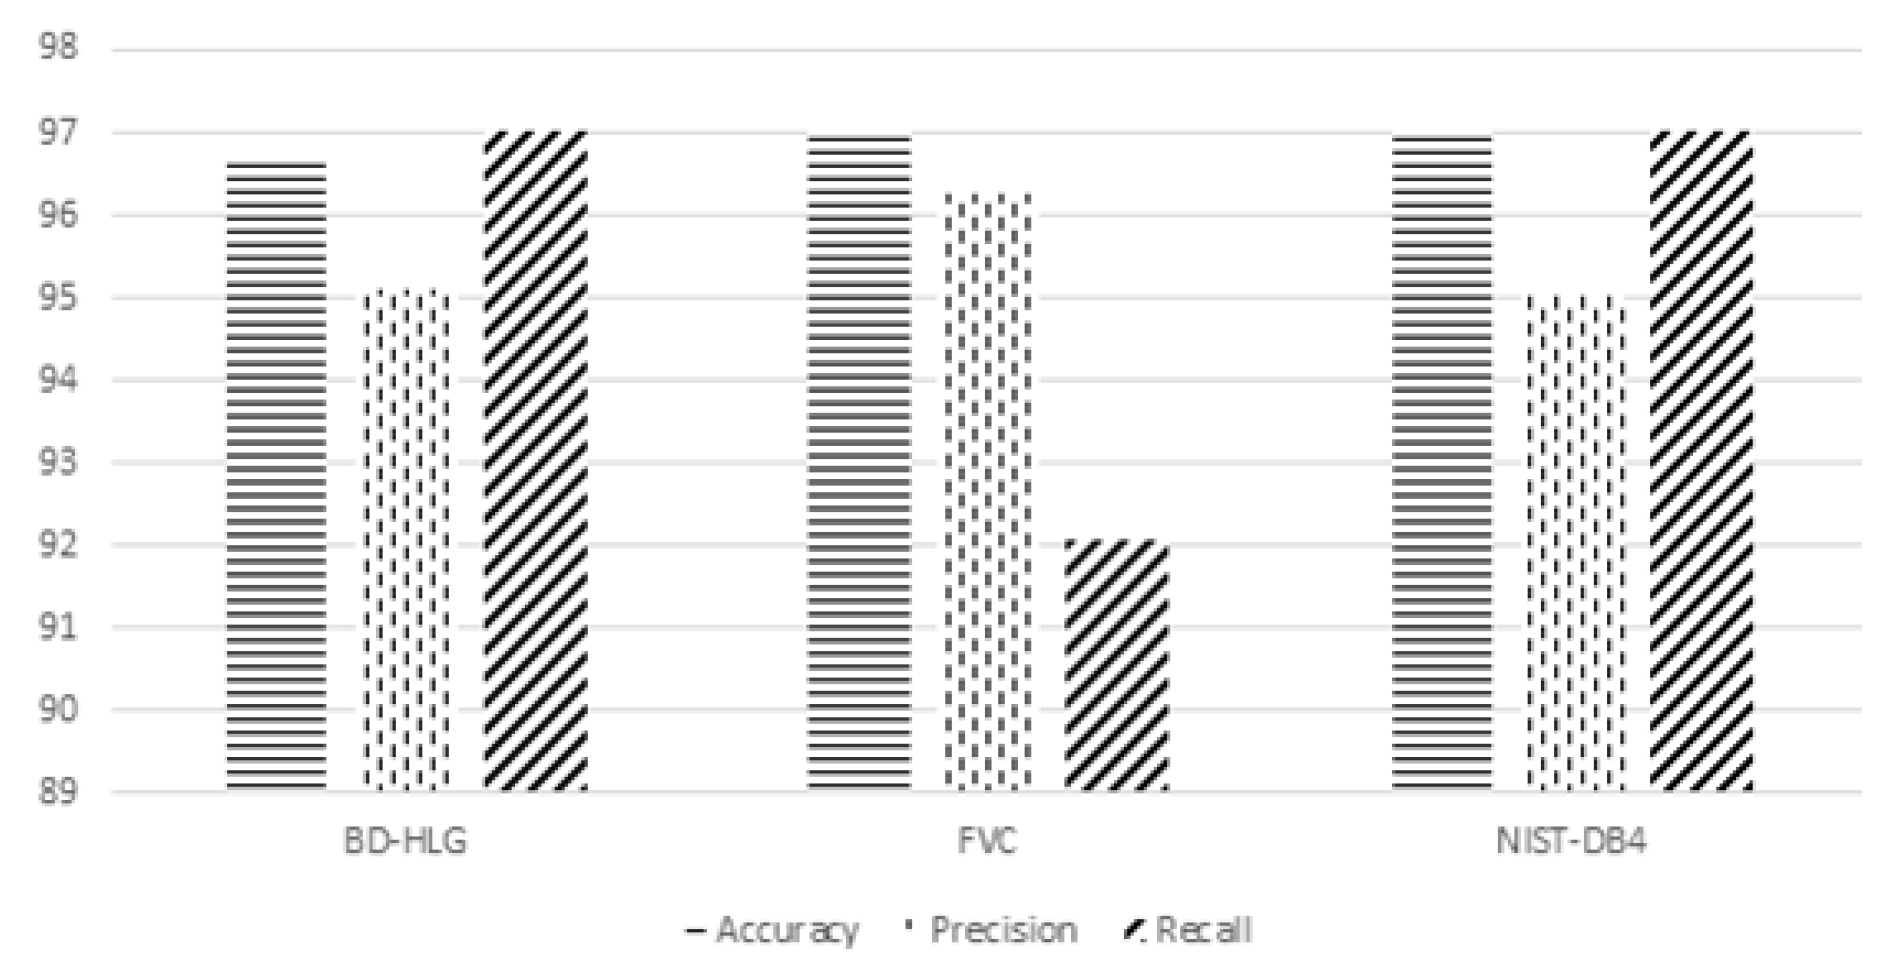
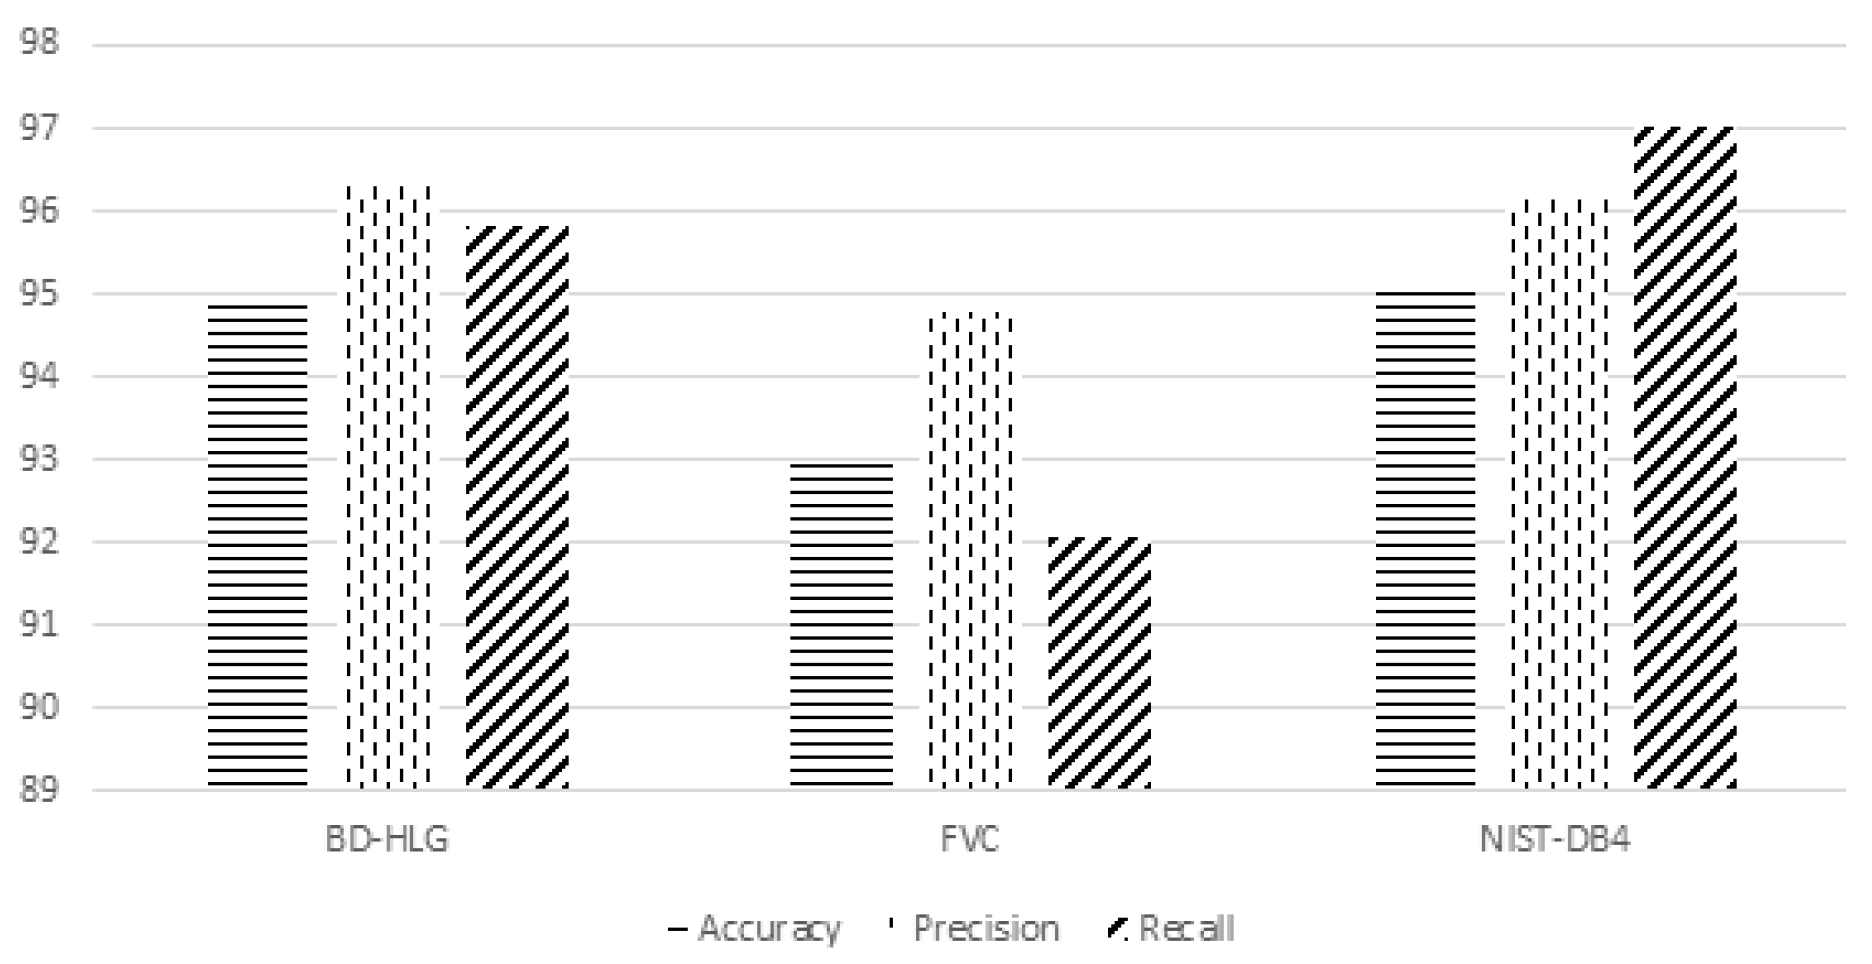
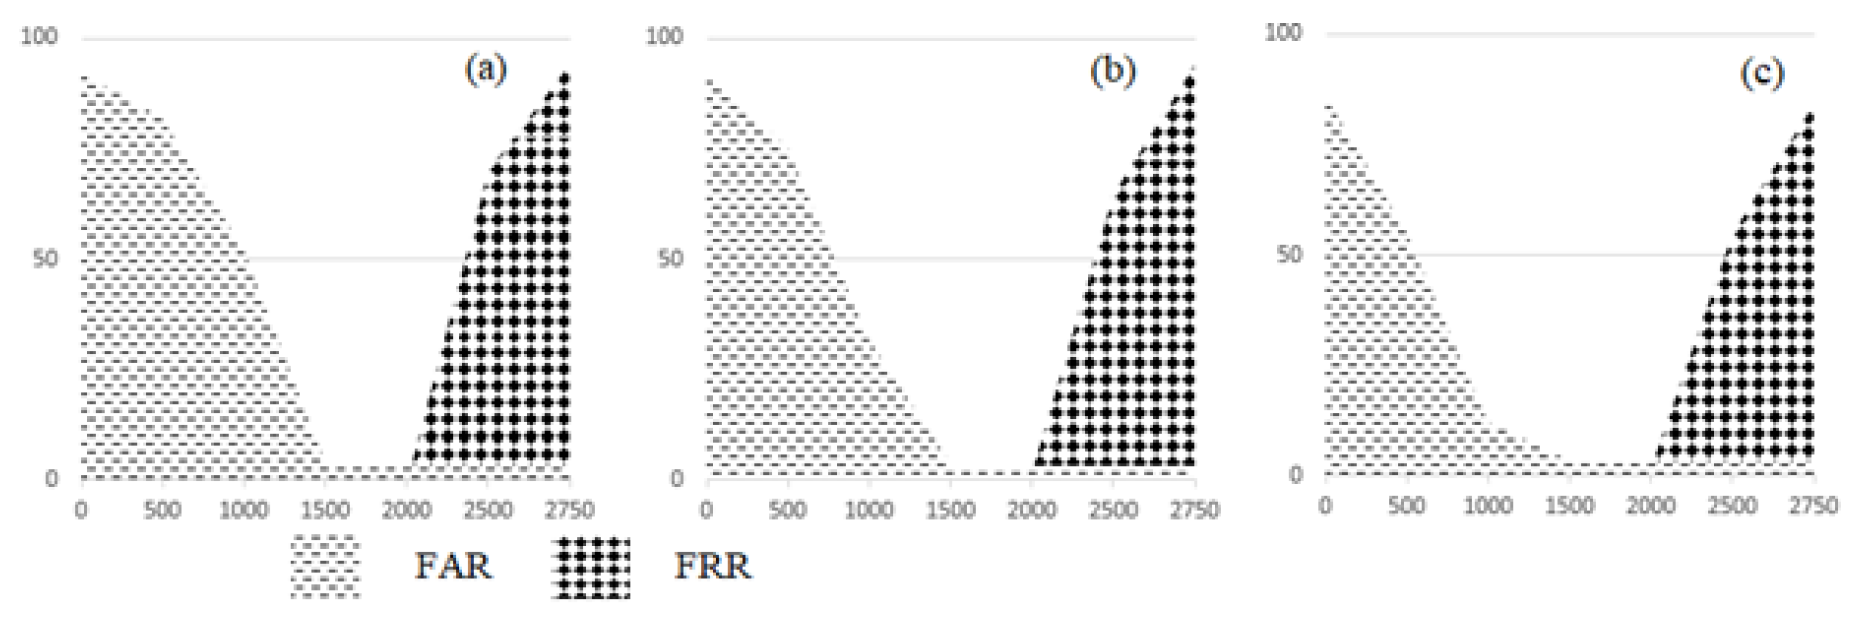
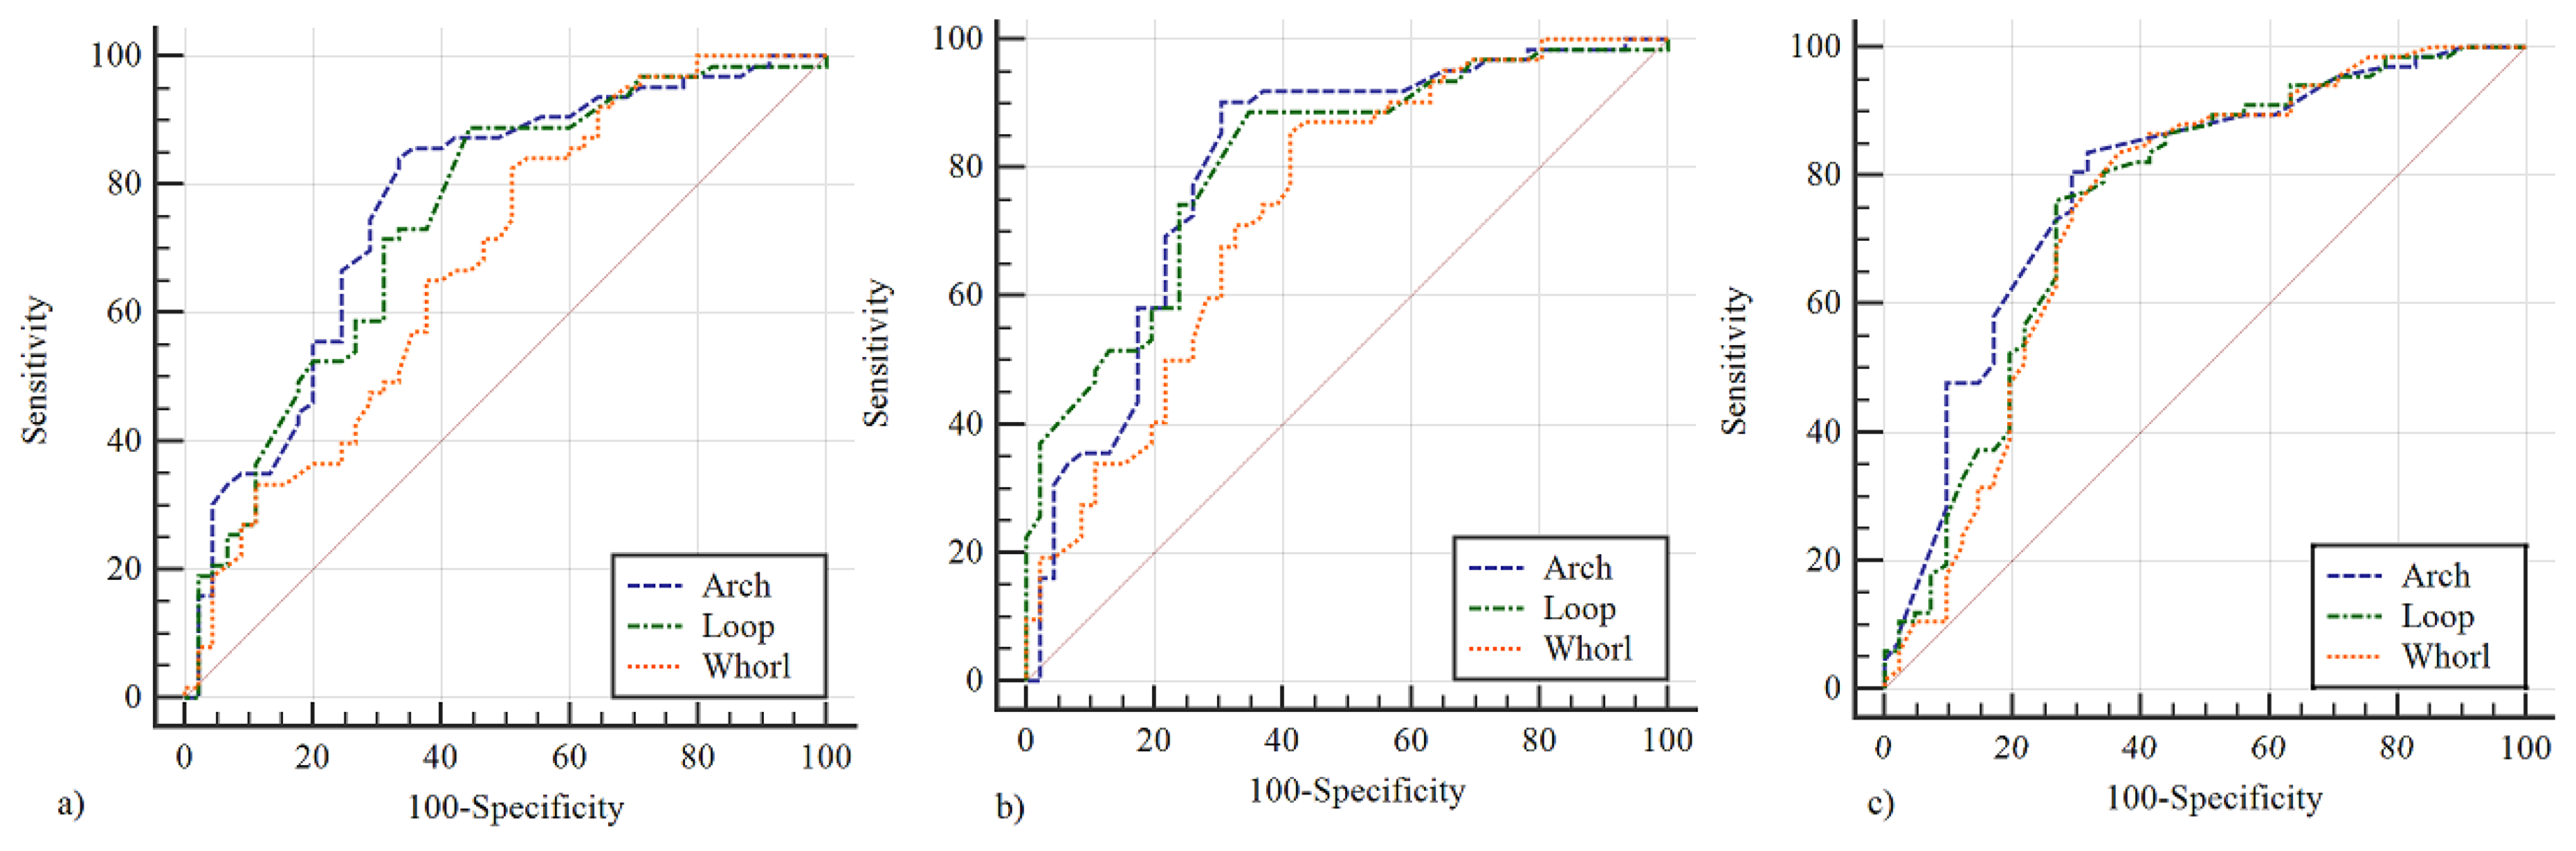
5.2. Analysis Results of Experimentation
- Accuracy is a system to measure the degree of closeness of measurements of a quantity to that quantity’s actual (true) value.
- Precision is the fraction of retrieved documents that are relevant to the find:
- Recall in information retrieval is a fraction of the documents that are relevant to a query that is successfully retrieved.
6. Conclusions
Author Contributions
Funding
Acknowledgments
Conflicts of Interest
References
- Alpaydin, E. Introduction to Machine Learning; The MIT Press: London, UK, 2009; p. 584. [Google Scholar]
- Bertrand, C.; Ernest, F.; Zhang, H.H. Principles and Theory for Data Mining and Machine Learning; Springer Press: New York, NY, USA, 2009; p. 786. ISBN 978-0-387-98135-2. [Google Scholar]
- Bishop, C. Pattern Recognition and Machine Learning; Springer Press: New York, NY, USA, 2006. [Google Scholar]
- Kotsiantis, S.B. Supervised machine learning: A review of classification techniques. MathSciNet 2007, 31, 249–268. [Google Scholar]
- Bruijne, M.D. Machine learning approaches in medical image analysis: From detection to diagnosis. JACR Med. Image Anal. 2016, 33, 94–97. [Google Scholar] [CrossRef] [PubMed]
- Boykov, Y. Interactive graph cuts for optimal boundary and region segmentation of objects in N-D images. In Proceedings of the Eighth IEEE International Conference on Computer Vision, Vancouver, BC, Canada, 7–14 July 2001; pp. 105–112. [Google Scholar]
- Tomin, N.V.; Kurbatsky, V.G.; Sidorov, D.N.; Zhukov, A.V. Machine Learning Techniques for Power System Security Assessment. IFAC-PapersOnLine 2016, 49, 445–450. [Google Scholar] [CrossRef]
- Milan, S.; Vaclav, H.; Roger, B. Image pre-processing. Image Processing, Analysis and Machine Vision; Springer: Boston, MA, USA, 1993; pp. 56–111. [Google Scholar]
- Strobl, C. An Introduction to Recursive Partitioning: Rationale, Application and Characteristics of Classification and Regression Trees, Bagging and Random Forests. Psychol. Methods 2009, 14, 323–348. [Google Scholar] [CrossRef] [PubMed]
- Cristianini, N.; Shawe-Taylor, J. An Introduction to Support Vector Machines (and Other Kernel-Based Learning Methods); Cambridge University Press: Cambridge, UK, 2000; p. 190. [Google Scholar]
- Zhukov, A.V.; Sidorov, D.N.; Foley, A.M. Random Forest Based Approach for Concept Drift Handling. In Analysis of Images, Social Networks and Texts; Springer: Berlin, Germany, 2016; p. 661. [Google Scholar]
- Maio, D.; Maltoni, D. A structural approach to fingerprint classification, Pattern Recognition. In Proceedings of the 13th International Conference on Pattern Recognition, Vienna, Austria, 25–29 August 1996; Volume 3, pp. 578–585. [Google Scholar]
- Mohamed, S.M.; Nyongesa, H.O. Automatic fingerprint classification system using fuzzy neural techniques, Fuzzy Systems. In Proceedings of the 2002 IEEE World Congress on Computational Intelligence, 2002 IEEE International Conference on Fuzzy Systems, Honolulu, HI, USA, 12–17 May 2002; Volume 1, pp. 358–362. [Google Scholar]
- Zhang, Q.; Yan, H. Fingerprint classification based on extraction and analysis of singularities and pseudo ridges. Pattern Recognit. 2004, 37, 2233–2243. [Google Scholar] [CrossRef]
- Hong, J.H.; Min, J.K.; Cho, U.K. ; Fingerprint classification using one-vs-all support vector machines dynamically ordered with Bayes classifiers. Pattern Recognit. 2008, 41, 662–671. [Google Scholar] [CrossRef]
- Senior, A. A combination fingerprint classifier. IEEE Trans. Pattern Anal. Mach. Intell. 2001, 23, 1165–1174. [Google Scholar] [CrossRef]
- Karu, K. A Jain Fingerprint Classification Pattern Recognition; Elsevier: Amsterdam, The Netherlands, 1996; pp. 389–404. [Google Scholar]
- Nyongesa, H.; Al-khayatt, S. Fast robust fingerprint feature extraction and classification. J. Intell. Robot. Syst. 2004, 40, 103–112. [Google Scholar] [CrossRef]
- Nagaty, K. Fingerprints classification using artificial neural networks: A combined structural and statistical approach. Neural Networks 2001, 14, 1293–1305. [Google Scholar] [CrossRef]
- Guo, T.; Liu, X.; Shao, G. Fingerprint Classification Based on Sparse Representation Using Rotation-Invariant Features. In Proceedings of the 2012 International Conference on Information Technology and Software Engineering; Springer: Berlin/Heidelberg, Germnay, 2013; pp. 631–641. [Google Scholar]
- Schroff, F.; Criminisi, A.; Zisserman, A. Object class segmentation using randomforests. In Proceedings of the British Machine Vision Conference 2008, Leeds, UK, 1–4 September 2008; pp. 1–10. [Google Scholar]
- Everingham, M.; Van Gool, L.; Williams, C. The pascal visual object classes (voc) challenge. Int. J. Comput. Vis. 2010, 88, 303–338. [Google Scholar] [CrossRef]
- Leistner, C.; Saffari, A.; Santner, J.; Bischof, H. Semi-supervised random forests. In Proceedings of the 2009 IEEE 12th International Conference on Computer Vision, Kyoto, Japan, 29 September–2 October 2009; Volume 26, pp. 506–513. [Google Scholar]
- Lepetit, V.; Lagger, P.; Fua, P. Randomized trees for real-time keypoint recog-nition. In Proceedings of the 2005 IEEE Computer Society Conference on Computer Vision and Pattern Recognition, San Diego, CA, USA, 20–25 June 2005; Volume 27, pp. 775–781. [Google Scholar]
- Lowe, D. Distinctive image features from scale-invariant keypoints. Int. J. Comput. Vis. 2004, 91–110. [Google Scholar] [CrossRef]
- Schulter, S.; Leistner, C.; Roth, P.; Bischof, H.; Van Gool, L. On-line hough forests. In Proceedings of the British Machine Vision Conference (BMVC 2011), London, UK, 29 August–2 September 2011. [Google Scholar]
- Nguyen, T.H.; Nguyen, T.L.; Dreglea, A.I. Machine learning algorithms application to road defects classification. Intell. Decis. Technol. 2018, 12, 59–66. [Google Scholar] [CrossRef]
- Nguyen, T.H.; Nguyen, T.L.; Dreglea, A.I. Robust approach to detection of bubbles based on images analysis. Int. J. Artif. Intell. 2018, 16, 167–177. [Google Scholar]
- Nguyen, T.H.; Nguyen, T.L. ROC curve analysis for classification of road defects. BRAIN Broad Res. Artif. Intell. Neurosci. 2019, 10, 65–73. [Google Scholar]
- Derin, H. Modeling and segmentation of noisy and textured images using Gibbs random fields. IEEE Trans. Pattern Anal. Mach. Intell. 1987, 9, 39–55. [Google Scholar] [CrossRef] [PubMed]
- Felix, J.X.; Vishnu, N.B.; Marios, S. Local binary convolutional neural networks. In Proceedings of the 2017 IEEE Conference on Computer Vision and Pattern Recognition (CVPR), Honolulu, HI, USA, 21–26 July 2017; Volume 1, pp. 473–484. [Google Scholar]
- Haddad, R.A. A Class of Fast Gaussian Binomial Filters for Speech and Image Processing. IEEE Trans. Acoust. Speech Signal Process. 1991, 39, 723–727. [Google Scholar] [CrossRef]
- Canny, J. A computational approach to edge detection. IEEE Trans. Pattern Anal. Mach. Intell. 1986, 8, 679–698. [Google Scholar] [CrossRef] [PubMed]
- Breiman, L. Random forests. Mach. Learn. 2001, 1, 5–32. [Google Scholar] [CrossRef]
- Kim, K.J. Financial time series forecasting using support vector machines. Neurocomputing 2003, 55, 307–319. [Google Scholar] [CrossRef]
- Fingerprint Verification Competition, “FVC 2000”. Available online: http://bias.csr.unibo.it/fvc2000/ (accessed on 1 August 2000).
- Fingerprint Verification Competition, “FVC 2002”. Available online: http://bias.csr.unibo.it/fvc2002/ (accessed on 14 August 2002).
- Fingerprint Verification Competition, “FVC 2004”. Available online: http://bias.csr.unibo.it/fvc2004/ (accessed on 1 August 2004).


| RF | SVM | CNN | k-NN | |
|---|---|---|---|---|
| Training time (s) | 8H15M | 7H40M | 8H32M | 5H28M |
| Correct rate (%) | 96.25 | 95.76 | 95.82 | 91.90 |
| MSE | 0.274 | 0.321 | 0.303 | 0.481 |
| RF | SVM | CNN | k-NN | |
|---|---|---|---|---|
| Training time (s) | 12H30M | 9H06M | 14H05M | 7H50M |
| Correct rate (%) | 97.78 | 95.83 | 96.11 | 92.05 |
| MSE | 0.215 | 0.304 | 0.267 | 0.668 |
| RF | SVM | CNN | k-NN | |
|---|---|---|---|---|
| Training time (s) | 18H47M | 15H40M | 20H31M | 10H38M |
| Correct rate (%) | 97.86 | 96.81 | 96.90 | 92.88 |
| MSE | 0.255 | 0.317 | 0.240 | 0.719 |
© 2019 by the authors. Licensee MDPI, Basel, Switzerland. This article is an open access article distributed under the terms and conditions of the Creative Commons Attribution (CC BY) license (http://creativecommons.org/licenses/by/4.0/).
Share and Cite
Nguyen, H.T.; Nguyen, L.T. Fingerprints Classification through Image Analysis and Machine Learning Method. Algorithms 2019, 12, 241. https://doi.org/10.3390/a12110241
Nguyen HT, Nguyen LT. Fingerprints Classification through Image Analysis and Machine Learning Method. Algorithms. 2019; 12(11):241. https://doi.org/10.3390/a12110241
Chicago/Turabian StyleNguyen, Huong Thu, and Long The Nguyen. 2019. "Fingerprints Classification through Image Analysis and Machine Learning Method" Algorithms 12, no. 11: 241. https://doi.org/10.3390/a12110241
APA StyleNguyen, H. T., & Nguyen, L. T. (2019). Fingerprints Classification through Image Analysis and Machine Learning Method. Algorithms, 12(11), 241. https://doi.org/10.3390/a12110241