Article

A Hybrid Proposed Fundus Image Enhancement Framework for Diabetic Retinopathy

1
Intelligent Media Research Center (iLEARN), School of Computer Science and Technology, Shandong University, Binhailu 72, Jimo, Qingdao 266237, China
2
Machine learning laboratory, School of Software Engineering, Shandong University, Jinan 250101, China
*
Author to whom correspondence should be addressed.
Algorithms 2019, 12(1), 14; https://doi.org/10.3390/a12010014
Submission received: 21 November 2018 / Revised: 27 December 2018 / Accepted: 28 December 2018 / Published: 4 January 2019

Abstract

:
Diabetic retinopathy (DR) is a complication of diabetes and is known as visual impairment, and is diagnosed in various ethnicities of the working-age population worldwide. Fundus angiography is a widely applicable modality used by ophthalmologists and computerized applications to detect DR-based clinical features such as microaneurysms (MAs), hemorrhages (HEMs), and exudates (EXs) for early screening of DR. Fundus images are usually acquired using funduscopic cameras in varied light conditions and angles. Therefore, these images are prone to non-uniform illumination, poor contrast, transmission error, low brightness, and noise problems. This paper presents a novel and real-time mechanism of fundus image enhancement used for early grading of diabetic retinopathy, macular degeneration, retinal neoplasms, and choroid disruptions. The proposed system is based on two folds: (i) An RGB fundus image is initially taken and converted into a color appearance module (called lightness and denoted as J) of the CIECAM02 color space model to obtain image information in grayscale with bright light. Afterwards, in step (ii), the achieved J component is processed using a nonlinear contrast enhancement approach to improve the textural and color features of the fundus image without any further extraction steps. To test and evaluate the strength of the proposed technique, several performance and quality parameters—namely peak signal-to-noise ratio (PSNR), contrast-to-noise ratio (CNR), entropy (content information), histograms (intensity variation), and a structure similarity index measure (SSIM)—were applied to 1240 fundus images comprised of two publicly available datasets, DRIVE and MESSIDOR. It was determined from the experiments that the proposed enhancement procedure outperformed histogram-based approaches in terms of contrast, sharpness of fundus features, and brightness. This further revealed that it can be a suitable preprocessing tool for segmentation and classification of DR-related features algorithms.

Graphical Abstract

1. Introduction

Diabetes mellitus (DM) has become a serious healthcare problem and is observed to be the fourth leading factor of death. Recently, the number of diabetic patients was 336 million around the world, and this number is auspicated to reach 592 million by the year 2035 [1]. Diabetic retinopathy (DR) is a microvascular complication of diabetes that causes eyesight loss in various ethnicities of the working-age population. To date, 80% of DR cases have been recorded in patients who have suffered from diabetes for more than 10 years. If the DR patient undergoes early screening and consistent treatment, then the progression of DR can be reduced from severe to the mild stage. The categorization of DR by clinicians is manifested into two classes, i.e., nonproliferative (NPDR) and proliferative (PDR). According to the clinical estimations in Reference [2] about retina impairment, NPDR is further divided into mild, moderate, and severe stages, and therefore, an early screening of DR severity levels is usually performed using the NPDR subclasses. PDR is an advanced stage where retinal anatomic features such as optic disc, cup, and retinal vascular structure have a large and distorted size [3,4].
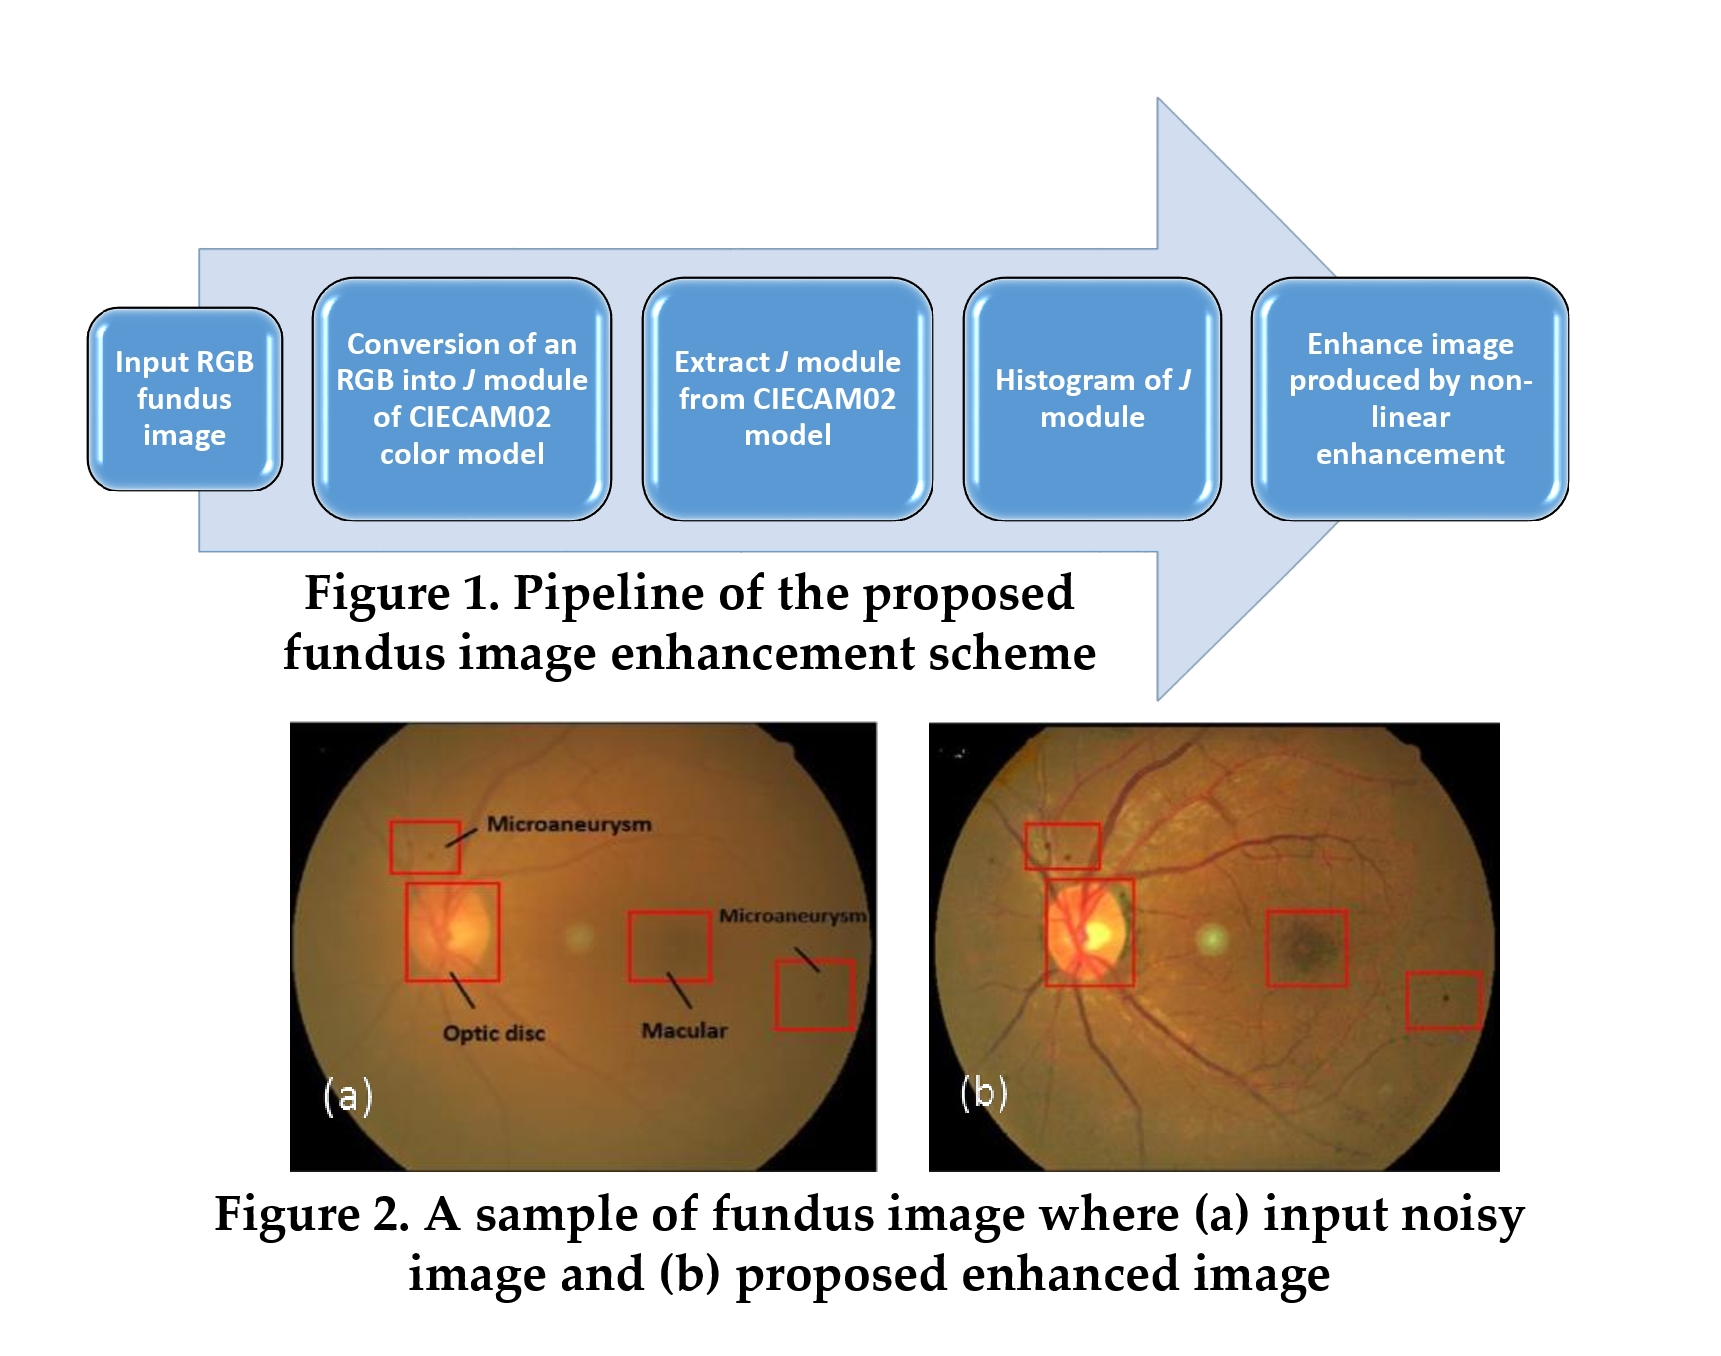
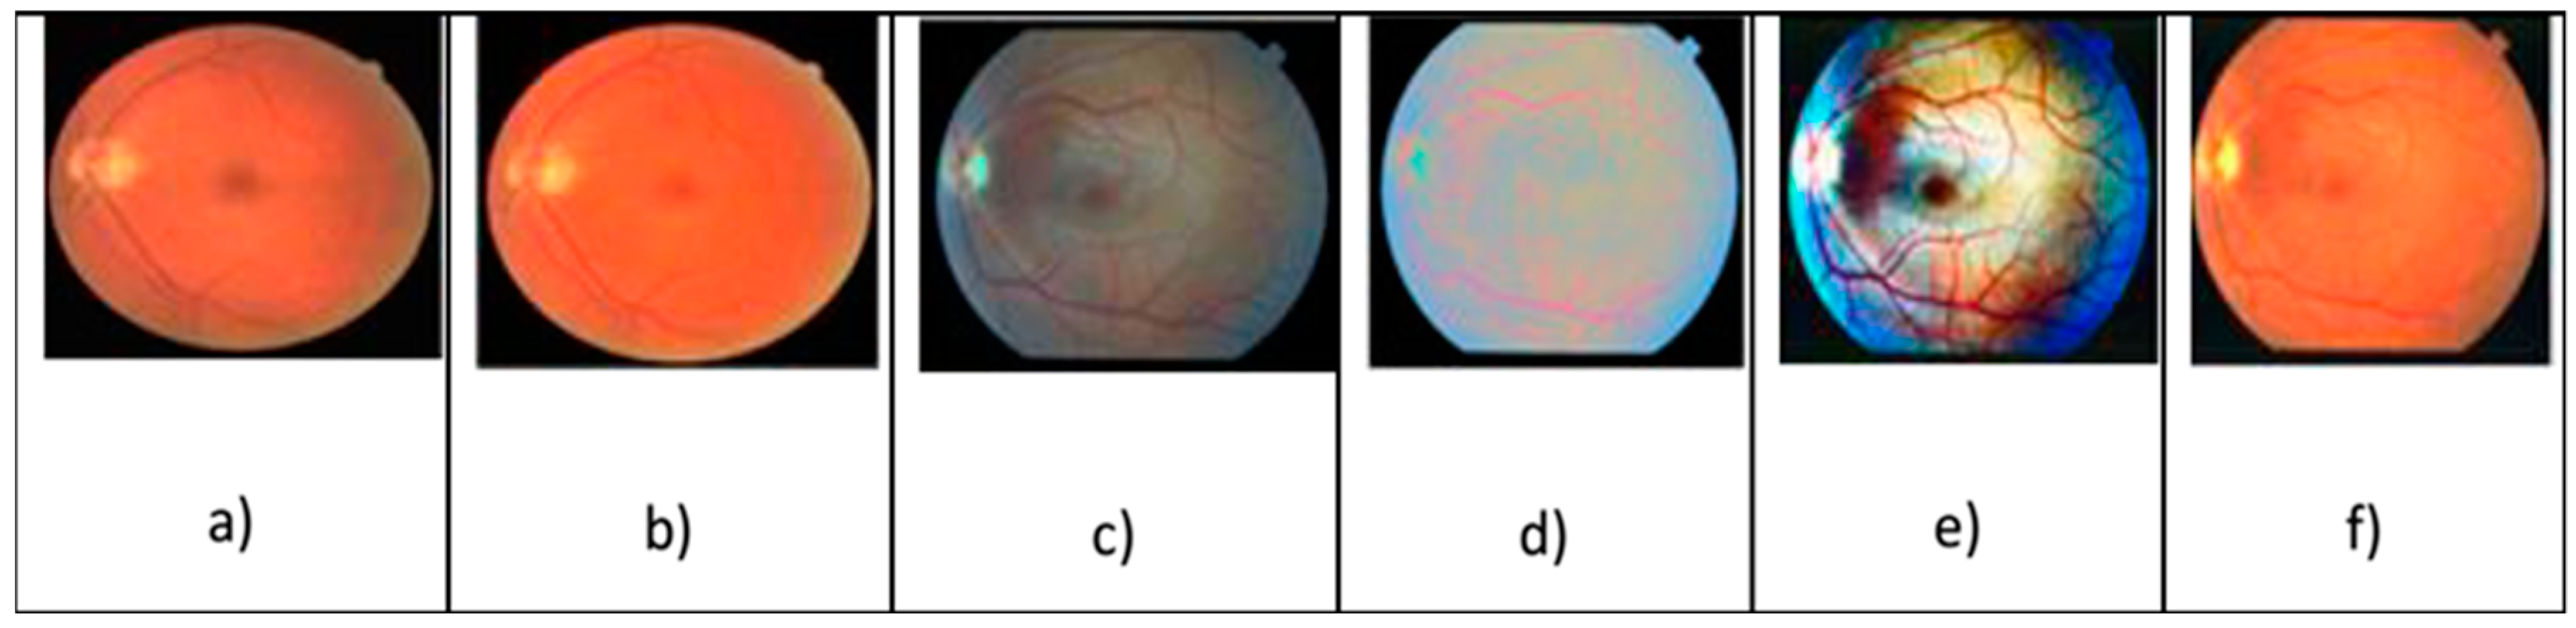
In modern ophthalmology, digital fundus photography is conceived as a powerful medical imaging channel used by ophthalmologists and computer-aided diagnosis (CAD) systems to detect various retinal disorders such as glaucoma, diabetic retinopathy, macular degeneration, and retinal neoplasms [5,6]. Fundus images normally contain the central and posterior retinal surface, i.e., bright (optic disc and cup) and dark (macula and fovea) regions. Moreover, DR clinical features such as microaneurysms (MAs), hemorrhages (HEMs), exudates (EXs) and cotton wool spots (CWSes) are also available on the fundus images. These images are often processed by clinical experts and screening algorithms to grade and interpret severity levels of DR in patients [7]. 
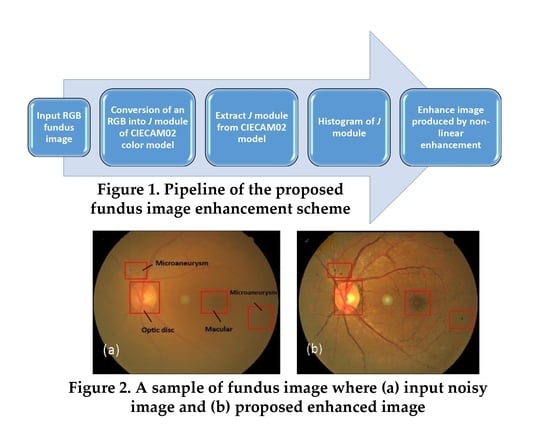
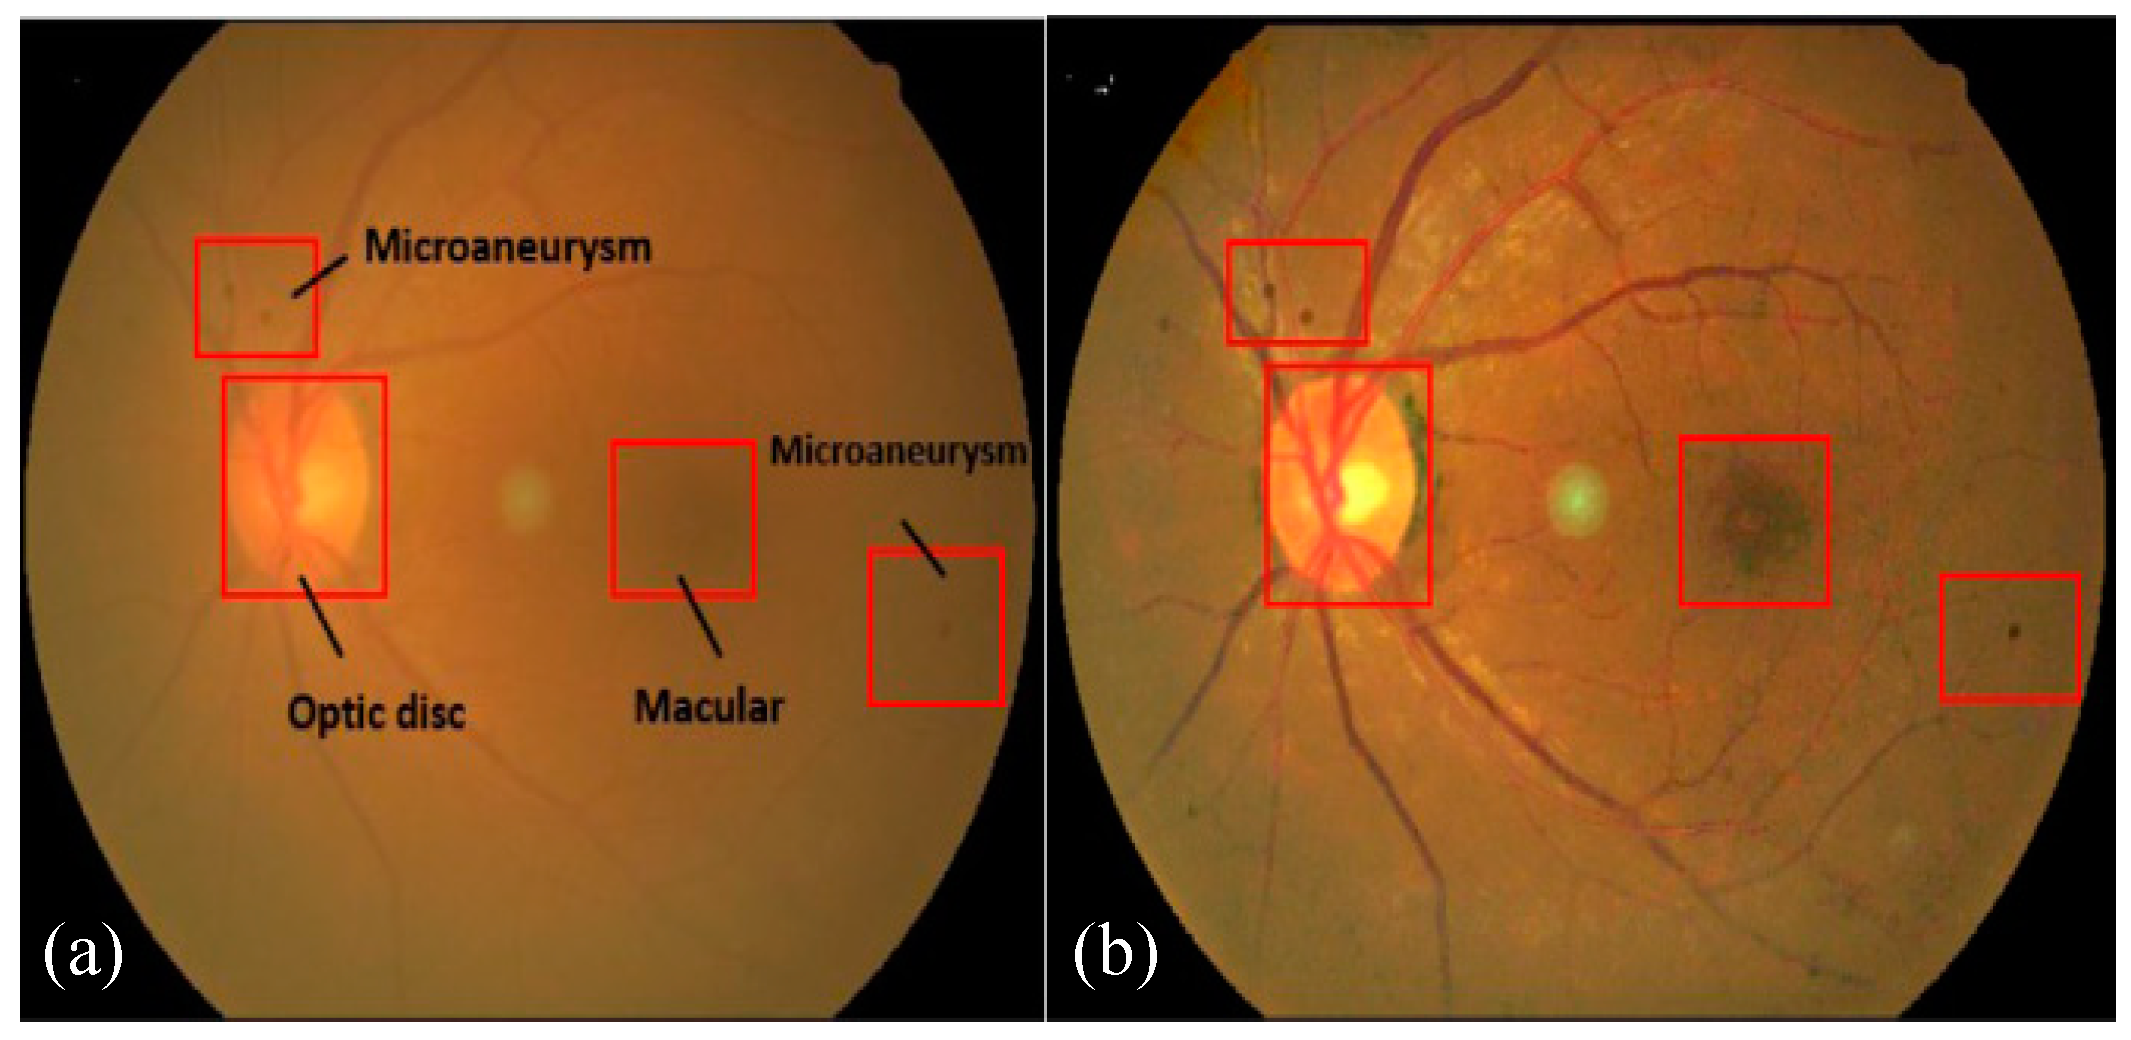
Figure 1 presents a visual example of a fundus image with DR-based indicators.
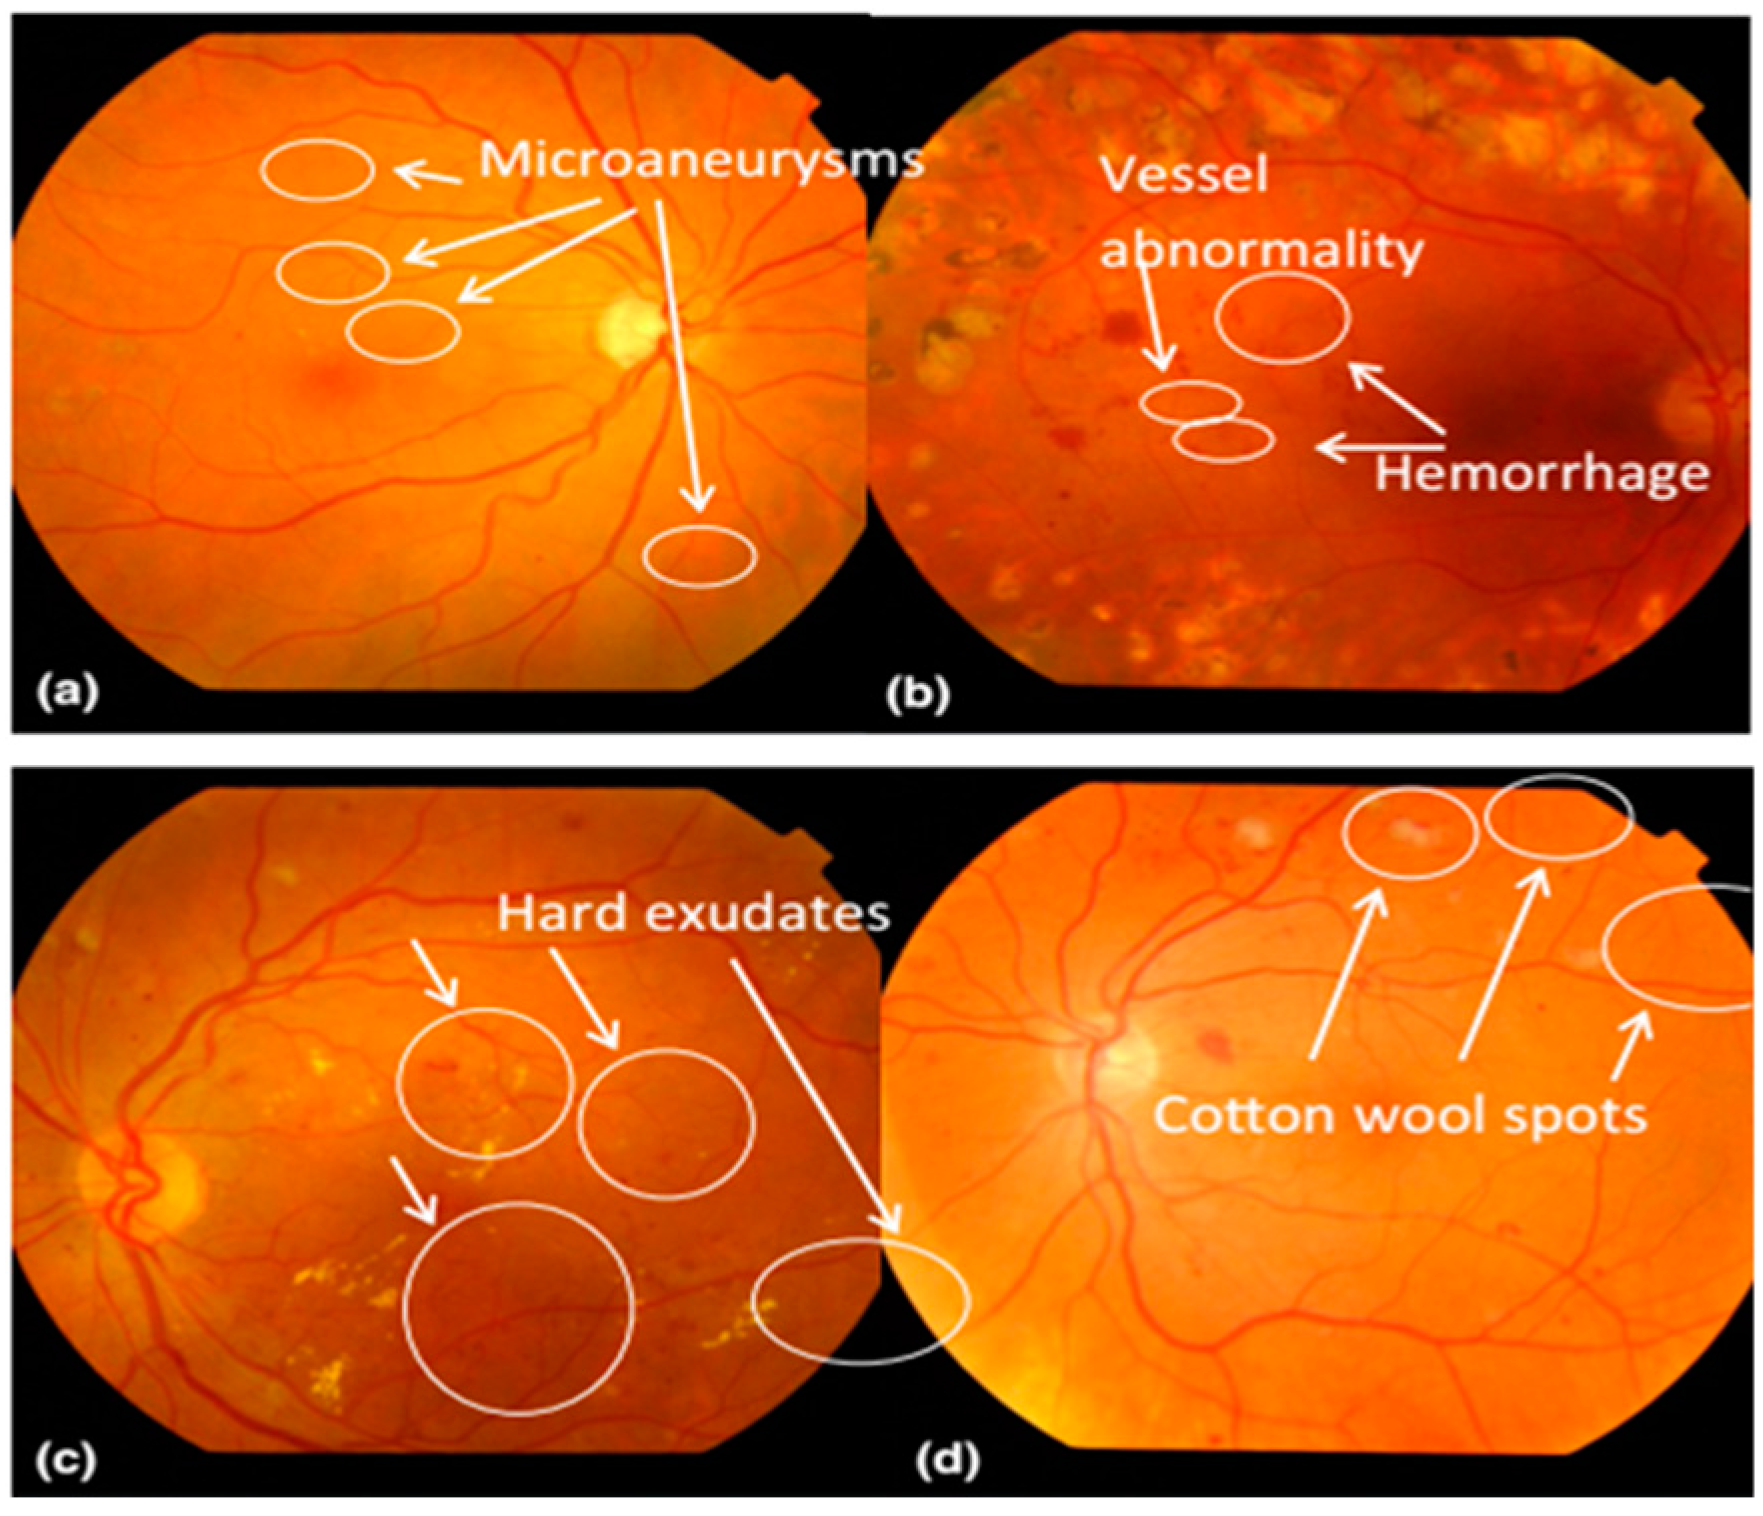
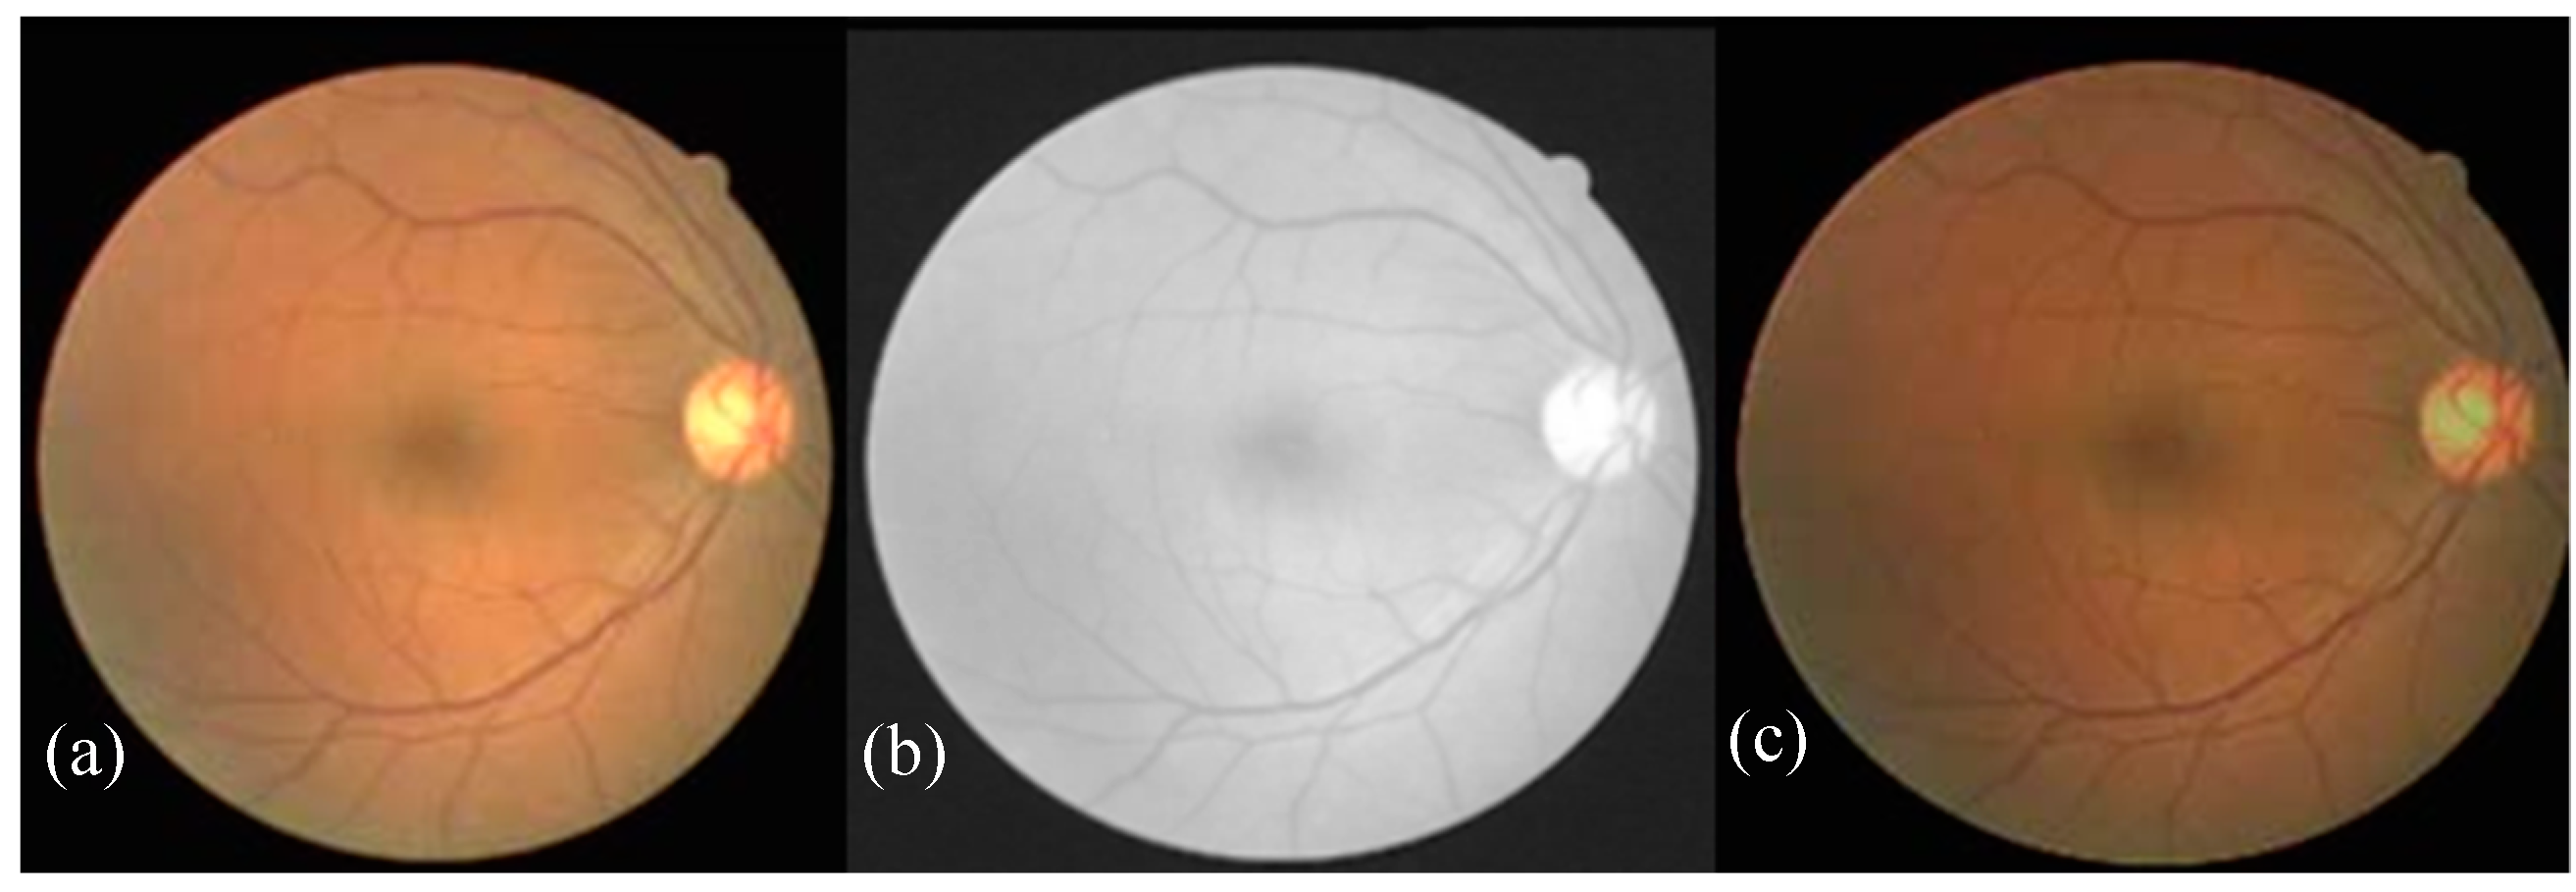
The acquisition of fundus images is accomplished using a fundus camera, where fundus images are captured using different light conditions and angles. Therefore, these images suffer from inadequate brightness and contrast, leading to low segmentation and classification results in DR assessment. Figure 2a illustrates the uneven illumination conditions of fundus images, whereas Figure 2b shows a noisy and low contrast fundus image [8]. The automated diagnosis of DR is only possible by the identification of DR-related features on the fundus images. This could be a challenging task because of varied contrast, appearance, and structure of these DR-based lesions.
Since MA is defined as an initial clinical indicator of the presence of DR in fundus images, the contrast between the yellowish part (MAs), white region (exudates), and vasculature system is observed to be very low, which makes the segmentation of tiny MAs in the respective fundus part crucial, polemic, and exhaustive for both clinicians and CAD systems. To obtain better real-time settings of DR or to present the fine visual perception of DR-related features, the quality of fundus images needs to be optimized to an acceptable level. Among the parameters of good image quality, contrast is a more significant attribute than dynamic level of brightness and resolution. Contrast enhancement of fundus images has been observed to be an important step by computational algorithms in obtaining better quantitative measurements from the images. Most of the contrast enhancement methods available in the literature are based on spatial (histogram) domains [9,10].
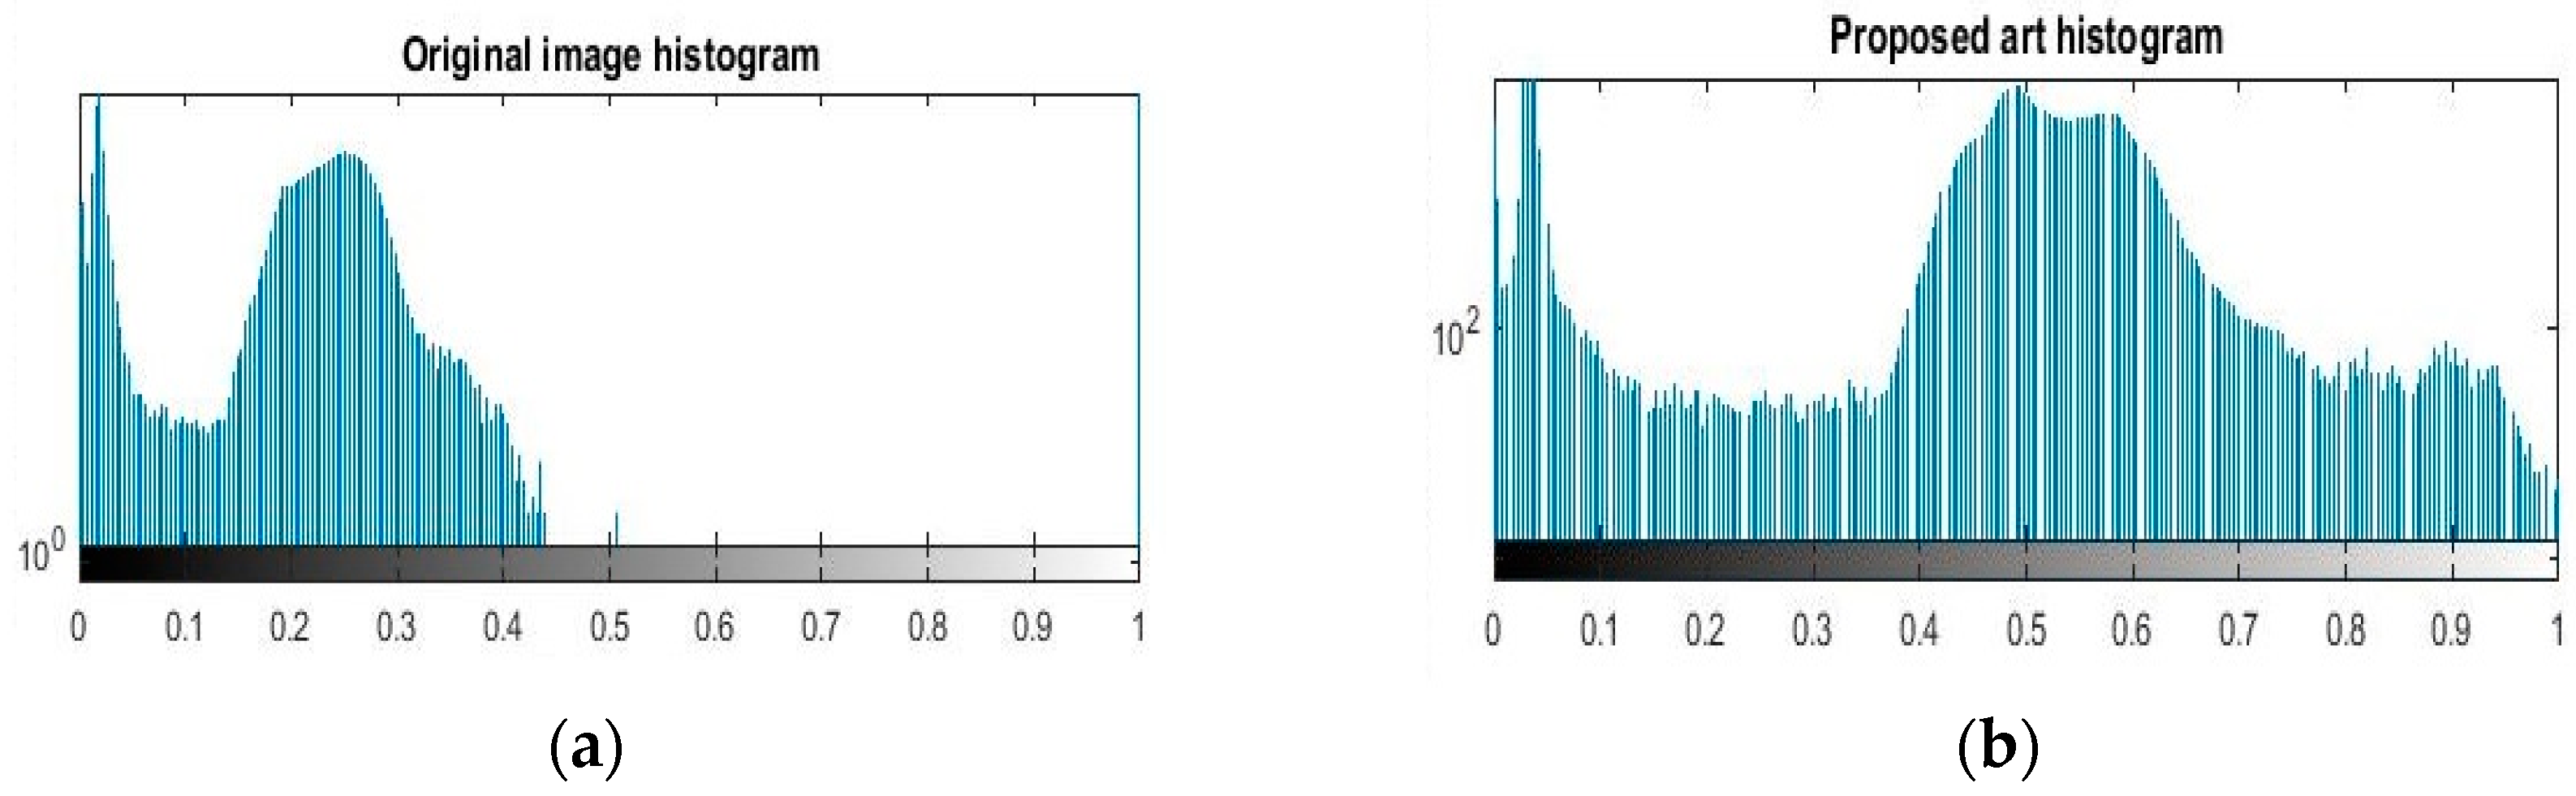
Histogram equalization (HE) is a significant operated image enhancement art due to its easy implementation. Moreover, a number of HE variants in the literature have been found to be promising in the enhancement of a dynamic range of modalities. Each variant has its own merits and demerits [11]. An adaptive histogram equalization (AHE) was then presented to overcome the shortcomings of HE, i.e., the over-enhancement of artifacts and intensity saturation. These adaptive approaches applied the histogram on pixel levels to boost the regional contrast of the image. The AHE produces good results, but it has a slow processing speed and great influence on the amplification of noise [12]. To address these problems, a contrast-limited adaptive histogram equalization (CLAHE) procedure was released in Reference [13], which has been observed to be remarkable in the removal of high rations of noise, artifacts, and over-enhancement of bright regions from the images. Due to its popularity, various CLAHE extensions have been proposed by authors [14,15]. The key problem of CLAHE is not employing the complete range of histograms for image enhancement, as well as suppressing some fine details. In addition to the usage of a non-holistic histogram range, the performance of CLAHE also highly depends on the selection of contextual regions, tile size, histogram bins, adequate distribution of tiles, and the parameters of an enhanced image itself. This seems to be computationally expensive, and obtained CLAHE results become worse than an original image [16]. Later, an exposure-based sub-image histogram equalization (ESIHE) was created to come up with a solution to regulate the enhancement rate, maintain brightness, and lessen noise level [12]. Yang et al. [17] considered a bin underflow–bin overflow histogram equalization (BUBOHE) scheme to solve the HE problems. Their scheme remained successful in image enhancement, but it failed to address the problem of decreased local contrast. Another study based on adaptive gamma correction (AGC), proposed by Chiu et al. [18], was used to enhance the quality of dimmed light images. They employed weight distribution on pixel level intensity to improve image contrast. Their approach presented significant contrast levels, but over-enhanced the bright area of the image. Saravanan et al. [19] used an adaptive histogram equalization on a green plane of the RGB image to improve the contrast. Initially, a green channel was extracted because of its rich color and content details. Then, background subtraction was performed using a median filtered grayscale image, and finally, an AHE was applied to normalize the brightness and intensity. Similarly, a shaded correction method [20] was employed to subtract the background details and to improve the contrast of color images. However, these mechanisms have produced spot noise and increased the luminance of the brighter features, i.e., the optic disc and cup. Intajag et al. [21] considered a fuzzy set with a derivation equation to partition the histogram into multimodes for image enhancement. They mainly applied a fuzzy set on each mode of histogram to get an optimal crossover point of the S-function with the highest probability of the fuzzy index, which was then utilized for enhancement. Their scheme was found to be successful in image enhancement, but still, the problem of over-enhancement of noise was not addressed. 
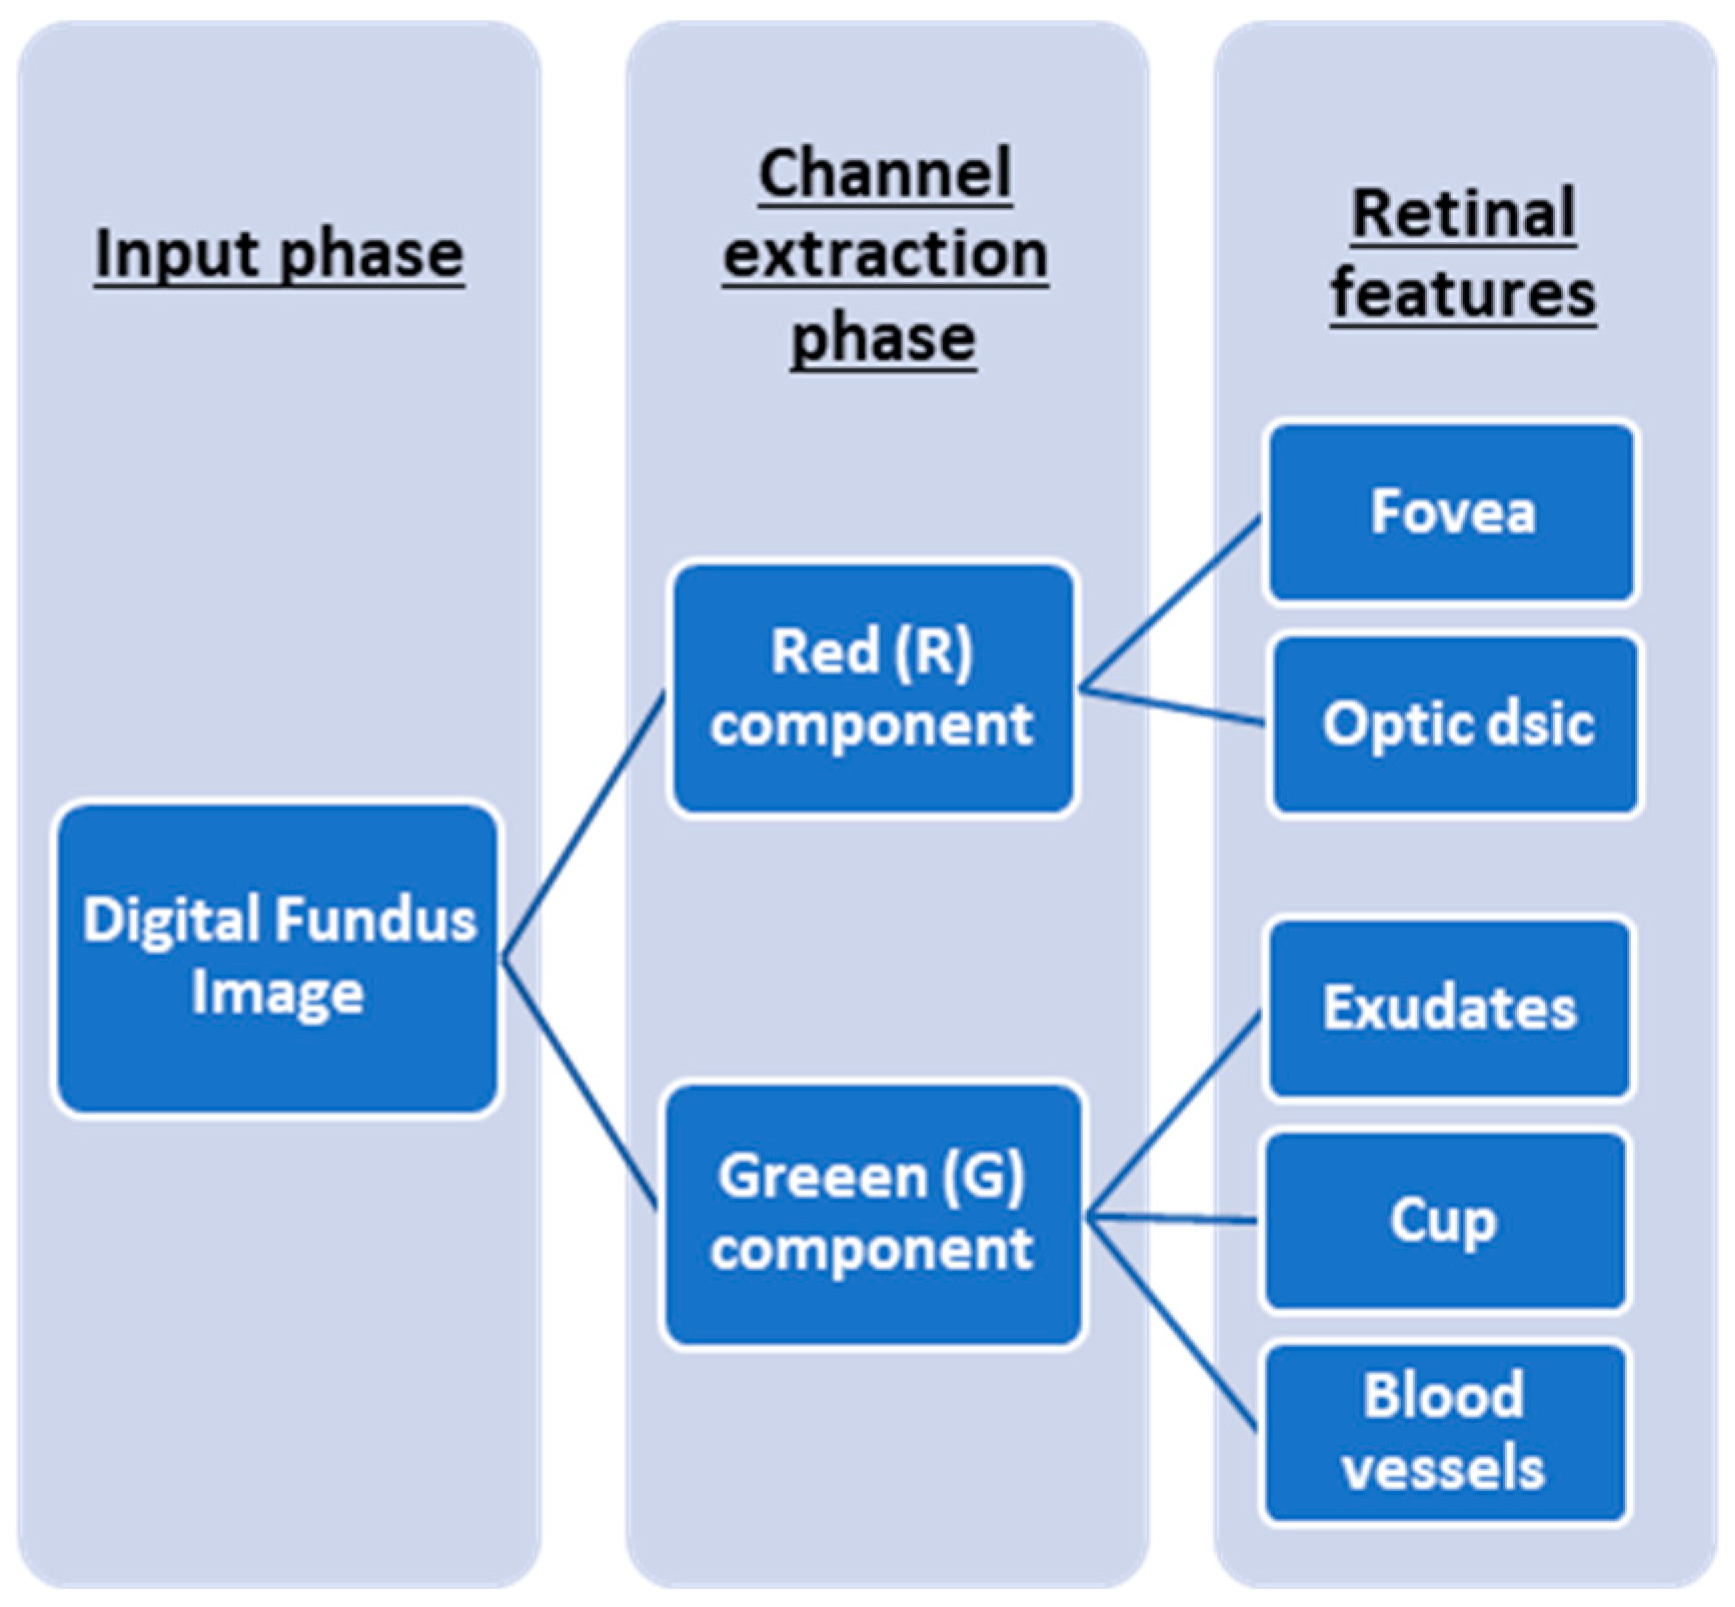
Figure 3 demonstrates the application of an RGB component in the extraction of diagnostic parameters for DR assessment. Datta et al. [22] computed a fuzzy histogram of the green channel and then partitioned it into subhistograms. Finally, contrast enhancement was achieved using the equalization of an intensity level of the subhistograms with minimization of the difference of mean brightness with respect to its corresponded original image. However, the problem of a high rate of luminosity in the brighter region of the image remained unsolved. A green plane modification [23] and a multiscale image analysis with a Laplacian pyramid [24] were found significant in image normalization and contrast enhancement. These two studies [25,26] presented a comprehensive look at the HE, AHE, CLAHE, and Mahalanobis distance arts investigated for image enhancement. These approaches produced reasonable image enhancement results, but were found less effective in the elimination of the over-enhancement of noise and luminance in the brighter part of the image.
Due to the drawbacks of the above enhancement arts, the aim of this work was to develop a real-time image enhancement tool to boost the contrast of fundus images holistically without any pre- or postprocessing steps or distortion of mean brightness and color information of the image. Lastly, the presented art results were compared to histogram-related methods and recorded up to the mark in optimization of these method limitations.
Accordingly, the structure of the paper is organized as follows: Section 2 highlights some detail about common histogram-based image enhancement methods. Section 3 illustrates the pipeline of the methodology in detail. Experimental settings and results are given in Section 4. The discussion of the paper is given in Section 5. Final remarks with some future directions for the paper are concluded in Section 6.

2. Histogram-Based Image Enhancement Arts

This section presents a brief overview of histogram-based running arts such as HE, AHE, CLAHE, and ESIHE. These methods have been widely applied in the image pre-processing domain to improve the contrast and textural information of images.

2.1. Histogram Equalization (HE)

HE is an image-processing technique focused on image intensities to enhance the local contrast of the image. Moreover, it operates on the principle of a uniformly distributed gray scale histogram, which has a viable contrast. Suppose f is an Ar × Ac confirmed image holding an intensity range from 0 to L-1. L indicates the depth of the intensity range, i.e., 256. If the histogram distribution of the image has a wide and flattened gray level, then it represents a highly contrasted image. It is noticed that HE is useful for very large tones of light background and dark foreground images. HE can significantly stretch local contrast to show the nonvisible features of an image and thus is helpful in the differentiation of the most observable image regions.

2.2. Adaptive Histogram Equalization (AHE)

The function of an AHE is based on the computation of different image histograms to use them in the reallocation of the intensities for an image contrast enhancement. It is therefore a more viable procedure than a standard HE in regional contrast improvement and sharpness of image edges. However, it has a great tendency toward noise amplification in the image homogeneous parts.

2.3. Contrast-Limited Adaptive Histogram Equalization (CLAHE)

The aim of CLAHE is to overcome the noise amplification problem of the histogram equalization scheme by applying the threshold on the slope of the function of input image intensity values to the resultant image intensities. Perhaps CLAHE is more appropriate for very low-contrast images. It uses a contrast-limited transformation function on the adjacent neighborhood pixels to boost the contrast. Contrast enhancement is directly associated with the height of the histogram, and therefore both limiting the slope and clipping the histogram height operate as the same function to control the enhancement rate.

2.4. Exposure-Based Sub-Image Histogram Equalization (ESIHE)

The efficacy of ESIHE has been observed to be superior than HE extensions in the production of control and in regulating enhancement levels with better brightness. ESIHE is based on a clipping (i.e., height of) histogram in order to clip the highest histogram value rather than the already defined threshold. This allows for adjusting the clipping threshold. The exposure of ESIHE is less discussed than other enhancement arts in the literature. The output of ESIHE has also been found to be robust in terms of an entropy and contrast rate using low grayscale images.

3. Methodology

It has been noticed that contrast enhancement has a vital role in automated medical imaging analysis. The pipeline of the proposed fundus image enhancement procedure is described in Figure 4.

3.1. RGB-to-J Component of CIECAM02 Model Conversion

There are numerous color space models available in the image processing field, such as HSV, HSI, CIELAB, CIE L*U*V, CIECAM97s, and many more for the better visualization of image features. This work adopted an enhanced version of the CIECAM97s model, called CIECAM02, due to its strength in grayscale with high rates of brightness. It also has the ability to measure color differences in diverse ranges of viewing coordinates and to provide uniform color spaces. The CIECAM02 color model was developed by the Commission International Eclairage (CIE) in 2002 to overcome the challenges of the CIECAM97s model. The CIE is responsible for releasing color appearance models for color management systems. The CIECAM02 has the potential to anticipate color appearances, especially chromatic adaption in dynamic ranges of viewing conditions. It has six different color appearance modules, such as brightness Q, lightness J, colorfulness M, chroma C, saturation S, and hue H [27].
Although our objective was to enhance the contrast of fundus images, the first step of the proposed scheme was the conversion of an input RGB fundus image into lightness, denoted as J, an attribute of the CIECAM02 model. This respective J component contains gray information with an eminent level of brightness. Initially, an RGB image was separated into red, green, and blue channels, and then stored each channel value in a vector. Afterwards, tristimulus values were computed in order to get a J component of the CIECAM02 model. Equation (1) illustrates the tristimulus value calculation process:
( X Y Z ) = [ 0.41 0.35 0.18 0.21 0.71 0.07 0.01 0.11 0.95 ] · [ R G B ] .
In the above Equation (1), tristimulus values, denoted as XYZ, were obtained by the multiplication of R, G, B values (i.e., stored in a vector) with chromaticity values, which were taken from Reference [28]. Next, the computed XYZ values were then used in Equations (2) and (3) to get the J module of the CIECAM02 model as follows:
FXYZ(x, y, z) = srgb2xyz (fv (x, y, z)),
FJ(x, y, z) = xyz2cam (fXYZ (x, y, z)).
In Equation (2), srgb2xyz is a standard red, green, and blue colorimetry, used here as a function of the vectorized tristimulus values. Finally, the J attribute was achieved using an xyz2cam function in Equation (3), applied to acquired tristimulus values.

3.2. Histogram of J module

An image histogram is a typical histogram technique used to present the graphical layout of an image with intensity variation. It assists us in analogies of pixel intensity and contrasts of an image. To equally improve the image contrast, a histogram step in the present study was executed after the conversion of an RGB input image into a J module. Generally, an acceptable level of image histogram consists of a wide range of flattened histograms. Figure 5 illustrates the visual example of a J module with its corresponding histogram.

3.3. Image Enhancement

This research employed an enhancement algorithm that augments color content of the fundus image. To improve the image contrast, an edge sharpening procedure was applied on the J component of the CIECAM02 model under Laplacian transform and Laplacian pyramid image representation. This method concentrates on creating high-spatial color contents using the existing content of an image in a nonlinear fashion [29], as it has been determined that a fundus image contains an odder illumination in the brighter area than in the central surface of the image. The respective enhancement approach has the ability to deal with extensive levels of brightness and has been found to be robust against noise, non-uniform illumination, low contrast, artifacts, and transmission errors in the image.
Suppose Lo is the Laplacian pyramid component, and L−1 is the higher Laplacian color content. Then the final enhanced image is yielded using the following equations:
L 1   =   B P ( s B O U N D ( L o ) )
where s indicates a scaling constant, and BOUND(x) is a function defined as
B O U N D ( X ) = { T ,   i f   x   > T X ,   i f   T   x   T T ,   i f   x     T .
The definition of T is as follows, (1 − c) × Lomax, where c denotes pixel ranges from [0–1]. Finally, the enhanced image is calculated as follows:
O u t p u t   I m a g e   =   L 1     J .
Here, J represents the lightness module, and L−1 is the high-frequency part of pyramid representation. Figure 6 shows a visual representation of the proposed enhanced image.

4. Experimental Results and Settings

The proposed fundus image enhancement strategy was tested on 1240 images comprised of two publicly available datasets, i.e., DRIVE [30] and MESSIDOR [31]. The details of these images are given in Table 1. DRIVE is an online available dataset of 40 lossless fundus images in an RGB format with clinical expert annotations. These 40 images are equally classified into training and testing sections. The resolution of each image is 768 × 584 pixels with a field of view (FOV) of 45°. MESSIDOR is also a publicly available dataset that contains 1200 lossless images with ophthalmologist labels. These images were captured with a FOV of 45° at various dimensions. To evaluate the suitability of the proposed scheme with other histogram-oriented methods, a statistical analysis was conducted using entropy, peak signal-to-noise ratio (PSNR), contrast-to-noise ratio (CNR), histogram, and structure similarity index measure (SSIM) parameters. These parameters have been employed by the contrast enhancement arts in the measurement of image quality. All experiments were executed using MATLAB R2017b on a Core i5 64-bit Intel processor system with 16 GB DDR3 RAM, running an operating system (Windows 10). An average time of 7 s was computed for each enhanced image by the presented enhancement art. The subsequent section discusses the mathematical foundation of the applied quality parameters with their results.

4.1. Performance Evaluation Histogram of Contrast-Enhanced Images

In this section, the results of the contrast enhancement images with their histograms produced by the proposed art and other developed histogram methods are shown using low contrast and bright images. Figure 7a–f illustrates the visual results of the before and after enhancement images. It can be observed from Figure 7a–f that the obtained results by HE, AHE, CLAHE, and ESIHE were found to be less satisfactory because of visual perception difference in color and brightness. In addition, fundus anatomic features (disc, cup, and retinal vessels) and DR-based lesions were reported to be less visible, which leads to poor performance of the segmentation approaches. Similarly, the output produced by the proposed method was noticed to be reasonable in image color, textural, and brightness information. Figure 8a–f shows the histogram variance performance of all applied arts with reference to an original image histogram. Since the good histogram is one, it has a flat and wide range of gray information [12]. As can be noticed in Figure 8a–f, the visual appearance and interpretation of the proposed art histogram was comprehensively better than HE, AHE, and CLAHE. This is because the histograms of HE, AHE, and CLAHE did not have a wide range of flattened gray level, and thus caused false positives of dark regions. Meanwhile, the ESIHE histogram was found to be nearly flattened, but did not have a wide gray range, which leads to brightening the dark region of the image. Thus, the presented image quality enhancement art could be an efficient strategy in improving the sharpness of fundus features and in preserving the fine details of an image. Moreover, it could improve the performance of the computational segmentation and classification procedures in the localization of abnormal features in fundus images.

4.2. Entropy

The objective of entropy is to present the average content information of an image. A larger value of entropy is assumed to be good image quality. To compute image entropy, Equation (7) is as follows:
E N T =   l = 0 L 1 I ( l ) l o g I ( l ) .
Here, ENT is entropy, L denotes gray levels, l means intensity level, and I(l) is a probability density function.
It can be analyzed from Table 2 that the entropy measures of the proposed art using four tested images were acceptable because it contained a higher rate of contrast and image information than other approaches. HE, AHE, and CLAHE results in the entropy domain were less acceptable because of a loss of image information that further led to the false detection of DR. Meanwhile, ESIHE results were nearly observed with the proposed method, but it suffered from the over-enhancement of noise in the entropy domain. The obtained entropy by the proposed art was noticed to be acceptable with original tested image entropies. The proposed art enhanced the contrast without an amplification of the noise component. Thus, it can be concluded that the performance of the proposed art using an entropy parameter was highly superior to an existing method.

4.3. Peak Signal-to-Noise-Ratio (PSNR)

PSNR aims to show the quality of the resultant image after the application of the technique [9]. A greater PSNR value tends toward a high quality of the reconstructed image. Initially, a mean square error (MSE) is calculated to get a PSNR value, as given in Equation (8):
M S E   =   i = 1 M J = 1 N [ X ( i , j ) Y ( i , j ) ] 2 M N .
After MSE calculation, the root MSE is applied in order to get a PSNR as follows:
P S N R = 10   ·   l o g 10 ( ( P e a k v a l u e ) 2 | M S E ) .
In Equations (8) and (9), X(i,j) represents an input image with an index i and j, having M by N pixels, while Y(i,j) denotes the resultant enhanced image at location (i,j). Peakvalue indicates the maximum difference between an original image value and MSE. The achieved PSNR value by the proposed art using four tested samples, as shown in Table 3, was found to be more significant than histogram-based approaches. This indicates that the proposed art had a greater contrast ration in comparison to the other approaches. HE, AHE, and CLAHE were observed to be less effective in enhancing the contrast, while ESIHE produced better a PSNR than its other extensions. The PSNR analysis of the proposed art reveals that it could be a useful preprocessing solution for computational algorithms in real-time settings of DR.

4.4. Structure Similarity Index Measure (SSIM)

SSIM is an index employed to measure the structure similarity between an original and an enhanced image [9]. A greater value of an SSIM indicates the best identical images with a high contrast rate. Equation (10) shows the calculation of the SSIM index:
SSIM (X, Y) = [l(X, Y)]α · [c(X, Y)]β · [s(X, Y)]γ.
In the above Equation (10), X, Y denote two windows with the same dimensions as the original and reconstructed image; α > 0, β > 0, γ > 0 denote constant exponents used here as weight parameters; and l, s, c represent luminance, structure, and contrast components, computed as follows:
l ( X ,   Y )   = 2 μ x   μ y + a 1 μ x 2 + μ y 2 + a 1 ,
s ( X ,   Y )   = σ x y + a 3 σ x σ y + a 3 ,
c ( X ,   Y )   = 2 σ x   σ y   + a 2 σ x 2 + σ y 2 + a 2 .
The terms µ and σ indicate the average and variance of X, Y, respectively, in the aforementioned Equations (11)–(13), while a 1 ,   a 2 ,   and   a 3 are used as constant parameters to avoid instability between the average and variance of X, Y, and were specifically chosen as a = (KL)2. Here, L contains a dynamic range of pixel values, i.e., 255, and K < 1 is a small constant. In order to simplify the expression, the values of α = β = γ = 1 and a 3 = a 2 2 . An SSIM value of 1 means the best possible structure similarity between an original and enhanced image.
As can be seen in Table 4, the proposed art achieved the highest SSIM values (near to 1) on tested images and outperformed the other methods. The performance of HE, AHE, and CLAHE in the SSIM domain were observed to be less significant in terms of having an identical structure to the original tested images. However, ESIHE nearly performed with the proposed art in enhancing contrast with acceptable structures of tested images. Finally, the obtained SSIM by the proposed art demonstrated the efficacy of the proposed art in enhancing image contrast without distortion of the image structures.

4.5. Contrast-to-Noise-Ratio (CNR)

The objective of CNR is to estimate the noise and contrast between an input and resultant enhanced image. Recently, CNR has been extensively used in medical imaging quality assessments [32]. The formula for the calculation of CNR is as follows:
C N R   = C o n t r a s t N o i s e =   | μ 1 μ 2 | σ 1 2 + σ 2 2 .
Here in Equation (14), µ1, µ2, σ1, and σ2 indicate the expectation values and standard deviations of two different signals, i.e., two areas of different brightness in a fundus image.
As seen in Table 5, the proposed fundus image enhancement method was able to improve the contrast of noisy, poor contrast, and non-uniform illumination images. The achieved CNR values of the presented art were found to be more prominent than histogram-oriented approaches.
The mean and standard deviation values of the original and final enhanced images of the proposed art and all other histogram-based approaches were calculated, as given in the comparison Table 6. Standard deviation implies image quality, i.e., a higher standard deviation value indicates a high-quality image. As seen in Table 6, the achieved standard deviation values of the proposed fundus image enhancement art using Entropy (4.60 ± 4.52), PSNR (23.78 ± 20.10), SSIM (0.98 ± 0.96), and CNR (8.78 ± 7.67) exhibit high mean and standard deviation results. Meanwhile, the results of the other approaches did not exhibit such a performance. In addition to the obtained standard deviation results, Fisher’s F-statistic was also applied to get the statistical analysis in order to justify the superiority of the proposed fundus image enhancement method over the histogram-related arts using entropy, PSNR, and CNR. In Table 7, the outcome of this statistical analysis is reported by showing F-values and p-values [33]. The p-value was observed to be less than 0.05 for all quality parameters. Thus, the quantitative assessment of all applied image enhancement arts with respect to quality metrics was statistically significant. It can be seen in Table 7 that the achieved statistical results denote that the proposed art was more successful in obtaining high image quality with intact image features than its competitors.

5. Discussion

In modern ophthalmology, the application of fundus photography has been observed to be notable in the early screening of glaucoma, cataracts, and diabetic retinopathy. Further, it assists clinical experts in quickly analyzing the relationship between normal and intricate features of DR. Fundus images often suffer from a dynamic range of image artifacts such as noise, low contrast, and non-uniform illumination. Therefore, there is a dire need for image preprocessing steps to normalize and regulate the contrast of fundus images in order to obtain high segmentation and classification results [34,35,36,37,38]. In this paper, a novel medical fundus image enhancement scheme is presented based on a color perception model, named a CIECAM02 model, with a contrast enhancement method. To improve the global content and contrast of an image, an enhancement approach was applied using a CIECAM02 lightness J component in a nonlinear fashion. To quantitatively evaluate the performance of the proposed art, some quality parameters, i.e., PSNR, CNR, histogram, entropy, and SSIM, were applied to 1240 fundus images collected from two publicly available datasets. These parameters were widely adopted by the common histogram-based image enhancement arts such as HE, AHE, CLAHE, and ESIHE to measure image quality. The proposed method performance using the quality parameters in the experiments showed a significant improvement in fundus image quality enhancement over the other histogram methods. However, the performance of the ESIHE method was noticed to be far better than its other extensions in image enhancement.
The first experiment was to compare the histogram of the proposed art with reference to the histogram of the input image and other histogram-based approaches, as shown in Figure 8. The obtained histogram of the proposed method was notable in the adjustment of the histogram and contrast enhancement.
The second experiment was to evaluate the entropy of the original images with the exploited enhancement methods. The term entropy means the average information of an original image (in this scenario, 4.56, 4.55, 4.57, and 4.61). As seen in Table 2, the obtained entropy of HE and AHE was less than the original image entropy value, which indicates the loss of image details and further leads to the production of false detection in DR subjects. Similarly, the entropy range of CLAHE far exceeded the original images. This indicates the enhancement of noise components. Meanwhile, ESIHE achieved more acceptable entropy results than its extensions. In contrast to the ESIHE results, the entropy ratio of the proposed art was noticed to be very satisfactory, with reference to original image entropies. Hence, it can be concluded that the proposed method has the ability to enhance fundus image quality without improving noise and other artifacts.
The third experiment was to test the potential of the proposed art using the PSNR parameter against the original and histogram-based methods. From Table 3, it is clearly shown that the obtained PSNR values of HE, AHE, CLAHE, and ESIHE were reported to be at a minimum compared to the proposed method. These arts failed to improve the contrast of the fundus image to an appreciable level. However, the PSNR of the presented art was found to be superior to the other methods, which means that it could boost the contrast of the fundus image to the highest level. It has been clear that a greater value of an SSIM or CNR leads to high contrast and identical information between the reference and well-enhanced image. In the fourth and fifth experiments, the obtained SSIM and CNR results of the proposed art, as given in Table 4 and Table 5, were observed to be more superior than HE, AHE, CLAHE, and ESIHE. This further indicates that the proposed method was found to be successful in the improvement of fundus image contrast while preserving high structure similarity with the original image.
The proposed fundus image enhancement strategy was also successful in the removal of blurriness and noise existing in the DR fundus image. As is clearly seen in Figure 9b, the output of the proposed scheme contained a high-contrast fundus image with more feasible DR features after the processing of an input noisy image. Hence, the proposed fundus image enhancement system can be a useful tool in the production of real-time DR applications.
Figure 10 illustrates the strength of the proposed art in uneven illumination images. Here, it is noticed that non-uniform illumination was removed at a high rate by the proposed method. Moreover, fundus anatomic features were observed with a high visible ratio, resulting in making existing computerized DR systems more effective in DR assessment.
From the aforementioned experiments, it is well understood that the proposed method was more successful in fundus image quality enhancement than histogram-based image enhancement approaches using a diverse range of low-contrast and non-uniform illumination of images. Both contrast enhancement and color preservation of blurry and non-uniform illumination fundus images were improved by the presented method without following any long pre- or postprocessing steps such as histogram stretching, division of histogram modes, denoising techniques, and cumulative distribution functions. Those processing steps are often adopted by existing image enhancement methods to boost image quality. Moreover, existing fundus image enhancement methods are focused mainly on central contrast enhancement rather than brightness. However, both brightness and contrast factors have a vital role in improving DR-based CAD system efficiency in segmentation and classification of important NPDR features. The only limitation of the proposed enhancement strategy was not to directly implement DR-based CAD systems due to further investigating insights into the proposed art using a diverse range of high-quality fundus images for advancement rather than applications.

6. Conclusions and Future Remarks

The development of a fundus image quality enhancement criterion is clinically considered to be an effective way to improve the performance of DR-based computerized screening systems. This implementation leads to cost reductions in screening programs, which facilitates access to those patients that belong to rural and urban regions. This paper presented a novel medical fundus image enhancement tool for DR grading. Initially, an RGB fundus image was decomposed into a lightness module of the CIECAM02 color model. This lightness component was further processed by a nonlinear enhancement algorithm to improve the contrast and color content of the fundus image. Finally, all previous components were combined to form an enhanced RGB image. In view of the simple implementation requirements and notable computational performance of the proposed scheme, it can be a useful enhancement scheme for high-end medical image repositories. In the future, the strength of the presented art can be tested on other medical colored modalities and real-world screening programs for DR, where the fundus images come from a dynamic range of resolutions, contrasts, and multiple ethnicities. Moreover, the proposed method will be evaluated on perceptual-oriented color space, various image enhancement approaches, and filters for decomposition and contrast enhancement of the high-resolution images.

Author Contributions

Conceptualization, I.Q.; methodology, I.Q.; software, I.Q.; validation, I.Q., K.S.; formal analysis, I.Q.; investigation, I.Q.; writing—original draft preparation, I.Q.; writing—review and editing, I.Q.; visualization, I.Q.; supervision, J.M.; project administration, J.M.

Funding

This work is supported by the National Natural Science Foundation of China (NNSFC) under the grant no. 61672322. The authors express their deep sense of gratitude to the intelligent media research center of Shandong University, where the research work was carried out.

Acknowledgments

The authors express their deep sense of gratitude to the intelligent media research center of Shandong University, where the research work was carried out. Moreover, the authors would particularly like to thank the anonymous reviewers for their helpful suggestions.

Conflicts of Interest

The authors declare no conflicts of interest.

References

  1. Mo, J.; Zhang, L.; Feng, Y.J.N. Exudate-based diabetic macular edema recognition in retinal images using cascaded deep residual networks. Neurocomputing 2018, 290, 161–171. [Google Scholar] [CrossRef]
  2. Haneda, S.; Yamashita, H. International clinical diabetic retinopathy disease severity scale. Nihon Rinsho 2010, 68, 228–235. [Google Scholar] [PubMed]
  3. Wan, S.; Liang, Y.; Zhang, Y.J.C.; Engineering, E. Deep convolutional neural networks for diabetic retinopathy detection by image classification. Comput. Electr. Eng. 2018, 72, 274–282. [Google Scholar] [CrossRef]
  4. Qureshi, I.; Sharif, M.; Yasmin, M.; Raza, M.; Javed, M. Computer aided systems for diabetic retinopathy detection using digital fundus images: A survey. Curr. Med. Imaging Rev. 2016, 12, 234–241. [Google Scholar] [CrossRef]
  5. Orlando, J.I.; Prokofyeva, E.; del Fresno, M.; Blaschko, M. An ensemble deep learning based approach for red lesion detection in fundus images. Comput. Methods Prog. Biomed. 2018, 153, 115–127. [Google Scholar] [CrossRef] [PubMed] [Green Version]
  6. Qureshi, I. Applications. Glaucoma detection in retinal images using image processing techniques: A survey. Int. J. Adv. Netw. Appl. 2015, 7, 2705. [Google Scholar]
  7. Abbas, Q.; Fondon, I.; Sarmiento, A.; Jiménez, S.; Alemany, P.J.M. Automatic recognition of severity level for diagnosis of diabetic retinopathy using deep visual features. Med. Biol. Eng. Comput. 2017, 55, 1959–1974. [Google Scholar] [CrossRef]
  8. Xiong, L.; Li, H.; Xu, L. An enhancement method for color retinal images based on image formation model. Comput. Methods Prog. Biomed. 2017, 143, 137–150. [Google Scholar] [CrossRef] [PubMed]
  9. Sahu, S.; Singh, A.K.; Ghrera, S.; Elhoseny, M.J.O.; Technology, L. An approach for de-noising and contrast enhancement of retinal fundus image using clahe. Opt. Laser Technol. 2019, 110, 87–98. [Google Scholar]
  10. Gandhamal, A.; Talbar, S.; Gajre, S.; Hani, A.F.M.; Kumar, D. Local gray level s-curve transformation–a generalized contrast enhancement technique for medical images. Comput. Biol. Med. 2017, 83, 120–133. [Google Scholar] [CrossRef]
  11. Jain, A.K. Fundamentals of Digital Image Processing; Prentice Hall: Englewood Cliffs, NJ, USA, 1989. [Google Scholar]
  12. Yadav, S.K.; Kumar, S.; Kumar, B.; Gupta, R. Comparative analysis of fundus image enhancement in detection of diabetic retinopathy. In Proceedings of the 2016 IEEE Region 10 Humanitarian Technology Conference (R10-HTC), Agra, India, 21–23 December 2016; pp. 1–5. [Google Scholar]
  13. Zuiderveld, K. Contrast limited adaptive histogram equalization. Graph. Gems 1994, 474–485. [Google Scholar] [CrossRef]
  14. Reza, A. Realization of the contrast limited adaptive histogram equalization (clahe) for real-time image enhancement. J. VLSI Signal Process. Syst. Signal Image Video Technol. 2004, 38, 35–44. [Google Scholar] [CrossRef]
  15. Arigela, S.; Asari, V.K. Adaptive and nonlinear techniques for visibility improvement of hazy images. In International Symposium on Visual Computing; Springer: Berlin/Heidelberg, Germany, 2011; pp. 75–84. [Google Scholar]
  16. Shamsudeen, F.M.; Raju, G. Enhancement of fundus imagery. In Proceedings of the International Conference on Next Generation Intelligent Systems (ICNGIS), Kottayam, India, 1–3 September 2016; pp. 1–5. [Google Scholar]
  17. Yang, S.; Oh, J.H.; Park, Y. Contrast enhancement using histogram equalization with bin underflow and bin overflow. In Proceedings of the 2003 International Conference on Image Processing, Barcelona, Spain, 14–17 September 2003; pp. 881–884. [Google Scholar]
  18. Chiu, Y.-S.; Cheng, F.-C.; Huang, S.-C. Efficient contrast enhancement using adaptive gamma correction and cumulative intensity distribution. In Proceedings of the 2011 IEEE International Conference on Systems, Man, and Cybernetics (SMC), Anchorage, AK, USA, 9–12 October 2011; pp. 2946–2950. [Google Scholar]
  19. Saravanan, V.; Venkatalakshmi, B.; Rajendran, V. Automated red lesion detection in diabetic retinopathy. In Proceedings of the 2013 IEEE Conference on Information & Communication Technologies (ICT), Thuckalay, Tamil Nadu, India, 11–12 April 2013; pp. 236–239. [Google Scholar]
  20. Spencer, T.; Olson, J.A.; McHardy, K.C.; Sharp, P.F.; Forrester, J.V.J.C. An image-processing strategy for the segmentation and quantification of microaneurysms in fluorescein angiograms of the ocular fundus. Comput. Biomed. Res. Int. J. 1996, 29, 284–302. [Google Scholar] [CrossRef]
  21. Intajag, S.; Tipsuwanporn, V.; Chatthai, R. Retinal image enhancement in multi-mode histogram. In Proceedings of the 2009 WRI World Congress on Computer Science and Information Engineering, Los Angeles, CA, USA, 31 March–2 April 2009; pp. 745–749. [Google Scholar]
  22. Datta, N.S.; Saha, P.; Dutta, H.S.; Sarkar, D.; Biswas, S.; Sarkar, P. A new contrast enhancement method of retinal images in diabetic screening system. In Proceedings of the 2015 IEEE 2nd International Conference on Recent Trends in Information Systems (ReTIS), Kolkata, India, 9–11 July 2015; pp. 255–260. [Google Scholar]
  23. Daniel, E.; Anitha, J. Optimum green plane masking for the contrast enhancement of retinal images using enhanced genetic algorithm. Int. J. Light Electron Opt. 2015, 126, 1726–1730. [Google Scholar] [CrossRef]
  24. Khan, S.; Qidwai, U.; Muhammad, H.; Qidwai, U. Retinal image enhancement using laplacian pyramidal multi-scaling. In Proceedings of the 2014 IEEE Region 10 Symposium, Kuala Lumpur, Malaysia, 14–16 April 2014; pp. 141–146. [Google Scholar]
  25. Vaidya, Y.M.; Doiphode, S.E. Comparison of pre-processing methods for segmentation and approximation of optic disc boundary from processed digital retinal images. In Proceedings of the 2014 International Conference on Devices, Circuits and Communications (ICDCCom), Ranchi, India, 12–13 September 2014; pp. 1–6. [Google Scholar]
  26. Ab Rahim, H.; Ibrahim, A.S.; Zaki, W.M.D.W.; Hussain, A. Methods to enhance digital fundus image for diabetic retinopathy detection. In Proceedings of the 2014 IEEE 10th International Colloquium on Signal Processing & its Applications (CSPA), Kuala Lumpur, Malaysia, 7–9 March 2014; pp. 221–224. [Google Scholar]
  27. Luo, M.R.; Li, C. Ciecam02 and its recent developments. In Advanced Color Image Processing and Analysis; Springer: Berlin/Heidelberg, Germany, 2013; pp. 19–58. [Google Scholar]
  28. Soltic, S.; Chalmers, A.N.; Jammalamadaka, R. Application of the ciecam02 colour appearance model to predict the effect of gamma on the colours viewed on crt monitors. Signal Process. Image Commun. 2004, 19, 1029–1045. [Google Scholar] [CrossRef]
  29. Greenspan, H.; Anderson, C.H.; Akber, S. Image enhancement by nonlinear extrapolation in frequency space. IEEE Trans. Image Process. Publ. IEEE Signal Process. Soc. 2000, 9, 1035–1048. [Google Scholar] [CrossRef] [PubMed] [Green Version]
  30. Staal, J.; Abràmoff, M.D.; Niemeijer, M.; Viergever, M.A.; Van Ginneken, B. Ridge-based vessel segmentation in color images of the retina. IEEE Trans. Med. Imaging 2004, 23, 501–509. [Google Scholar] [CrossRef]
  31. Decencière, E.; Zhang, X.; Cazuguel, G.; Lay, B.; Cochener, B.; Trone, C.; Gain, P.; Ordonez, R.; Massin, P.; Erginay, A.J.I.A.; et al. Feedback on a publicly distributed image database: The messidor database. Image Anal. Stereol. 2014, 33, 231–234. [Google Scholar] [CrossRef]
  32. Timischl, F.J.S. The contrast-to-noise ratio for image quality evaluation in scanning electron microscopy. Scanning 2015, 37, 54–62. [Google Scholar] [CrossRef]
  33. Zijdenbos, A.P.; Forghani, R.; Evans, A. Automatic “pipeline” analysis of 3-d mri data for clinical trials: Application to multiple sclerosis. IEEE Trans. Med. Imaging 2002, 21, 1280–1291. [Google Scholar] [CrossRef]
  34. Jin, Z.; Zhou, G.; Gao, D.; Zhang, Y. EEG classification using sparse Bayesian extreme learning machine for brain–computer interface. Neural Comput. Appl. 2018, 1–9. [Google Scholar] [CrossRef]
  35. Zhang, Y.; Nam, C.S.; Zhou, G.; Jin, J.; Wang, X.; Cichocki, A. Temporally constrained sparse group spatial patterns for motor imagery BCI. IEEE Trans. Cybern. 2018, 1–11. [Google Scholar] [CrossRef] [PubMed]
  36. Zhou, G.; Cichocki, A.; Zhang, Y.; Mandic, D.P. Group component analysis for multiblock data: Common and individual feature extraction. IEEE Trans. Neural Netw. Learn. Syst. 2016, 27, 2426–2439. [Google Scholar] [CrossRef] [PubMed]
  37. Jin, Z.; Zhou, G.; Gao, D.; Zhang, Y. Multi-kernel extreme learning machine for EEG classification in brain-computer interfaces. Expert Syst. Appl. 2018, 96, 302–310. [Google Scholar]
  38. Wang, H.; Zhang, Y.; Waytowich, N.R.; Krusienski, D.J.; Zhou, G.; Jin, J.; Wang, X.; Cichocki, A. Discriminative feature extraction via multivariate linear regression for SSVEP-based BCI. IEEE Trans. Neural Syst. Rehabil. Eng. 2016, 24, 532–541. [Google Scholar] [CrossRef]
Figure 1. An example of fundus images where (a) represents a normal image; (b) microaneurysms (MAs); (c) hemorrhages (HEMs) and vessel abnormality; (d) exudates (EXs); and (e) cotton wool spots (CWSes) [7].
Algorithms 12 00014 g001
Figure 2. A sample of fundus images where (a) indicates less illumination ratio of an image; and (b) is a low-contrast and noisy image [8].
Algorithms 12 00014 g002
Figure 3. RGB component application in a diabetic retinopathy (DR) assessment.
Algorithms 12 00014 g003
Figure 4. Structure of the proposed fundus image enhancement scheme.
Algorithms 12 00014 g004
Figure 5. A sample of a fundus image: (a) J component grayscale image with (b) its histogram.
Algorithms 12 00014 g005
Figure 6. A sample of fundus images: (a) An input image; (b) a J component grayscale image; and (c) the proposed enhanced image.
Algorithms 12 00014 g006
Figure 7. An enhancement comparison of fundus images: (a) Input image, (b) proposed enhanced image, (c) histogram equalization (HE), (d) adaptive histogram equalization (AHE), (e) contrast-limited adaptive histogram equalization (CLAHE), and (f) exposure-based sub-image histogram equalization (ESIHE).
Algorithms 12 00014 g007
Figure 8. A histogram variance performance comparison: (a) Input image histogram, (b) proposed histogram, (c) HE histogram, (d) AHE histogram, (e) CLAHE histogram, and (f) ESIHE histogram.
Algorithms 12 00014 g008aAlgorithms 12 00014 g008b
Figure 9. A DR fundus image enhancement comparison: (a) Input noisy image, and (b) proposed enhanced image.
Algorithms 12 00014 g009
Figure 10. A non-uniform fundus image enhancement: (a) Non-uniform image, and (b) proposed enhanced image.
Algorithms 12 00014 g010
Table 1. A summary of the fundus image benchmarks used in the experiments.
DatabaseNo. of ImagesField of ViewResolution in (Pixels)
DRIVE [30]40 lossless fundus images45°768 × 584
MESSIDOR [31]1200 lossless fundus images45°1440 × 960; 2240 × 1488; 2304 × 1536
Table 2. Entropy measurement of the proposed method with other histogram approaches.
Statistical ParameterMethodImage01Image02Image03Image04
EntropyOriginal4.564.554.574.61
HE4.134.114.314.11
AHE4.214.234.004.21
CLAHE5.124.994.634.80
ESIHE4.425.004.604.70
PROPOSED4.534.524.554.60
Table 3. Peak signal-to-noise ratio (PSNR) comparison of proposed art with literature methods. A large value indicates high image quality.
Statistical ParameterMethodImage01Image02Image03Image04
PSNROriginal6.557.979.777.98
HE7.049.8910.789.89
AHE12.9010.1113.9013.89
CLAHE15.8013.8913.9213.90
ESIHE15.9017.9017.9019.90
PROPOSED20.1021.2322.6723.78
Table 4. Structure similarity index measure (SSIM) comparison of the proposed art with literature approaches. A large value denotes high structure similarity.
Statistical Parameter MethodImage01Image02Image03Image04
SSIMHE0.960.950.910.90
AHE0.950.960.930.91
CLAHE0.960.960.920.94
ESIHE0.970.960.940.95
PROPOSED0.980.970.960.98
Table 5. Contrast-to-noise ratio (CNR) comparison of proposed scheme with histogram approaches. A large value denotes a better CNR.
Statistical ParameterMethodImage01Image02Image03Image04
CNROriginal3.813.703.983.99
HE4.105.014.785.65
AHE4.114.995.105.79
CLAHE5.996.126.457.01
ESIHE7.906.906.907.90
PROPOSED8.108.237.678.78
Table 6. Performance evaluation of the proposed method with histogram-related techniques based on mean and standard deviation of entropy, PSNR, SSIM, and CNR.
Total ImagesMethodMean ± SDMean ± SDMean ± SDMean ± SD
EntropyPSNRSSIMCNR
1240 ImagesOriginal4.61 ± 4.559.77 ± 6.551 ± 0.993.99 ± 3.70
HE4.31 ± 4.1110.78 ± 7.040.96 ± 0.905.65 ± 4.10
AHE4.23 ± 4.0013.89 ± 10.110.96 ± 0.915.79 ± 4.11
CLAHE5.12 ± 4.6315.80 ± 13.890.96 ± 0.927.01 ± 5.99
ESIHE5.00 ± 4.4219.90 ± 15.900.97 ± 0.947.90 ± 6.90
Proposed4.60 ± 4.5223.78 ± 20.100.98 ± 0.968.78 ± 7.67
Table 7. Statistical analysis of proposed art with histogram-based methods using quality parameters.
One-Way ANOVAEntropyPSNRCNR
F-value140.400108.73069.380
p-value0.0210.0300.032
A p-value < 0.05 indicates statistical significance.

