Abstract
This paper presents a fast algorithm for texture-less object recognition, which is designed to be robust to cluttered backgrounds and small transformations. At its core, the proposed method demonstrates a two-stage template-based procedure using an orientation compressing map and discriminative regional weight (OCM-DRW) to effectively detect texture-less objects. In the first stage, the proposed method quantizes and compresses all the orientations in a neighborhood to obtain the orientation compressing map which then is used to generate a set of possible object locations. To recognize the object in these possible object locations, the second stage computes the similarity of each possible object location with the learned template by using discriminative regional weight, which can effectively distinguish different categories of objects with similar parts. Experiments on publiclyavailable, texture-less object datasets indicate that apart from yielding efficient computational performance, the proposed method also attained remarkable recognition rates surpassing recent state-of-the-art texture-less object detectors in the presence of high-clutter, occlusion and scale-rotation changes. It improves the accuracy and speed by 8% and 370% respectively, relative to the previous best result on D-Textureless dataset.
1. Introduction
Object detection is one of the most fundamental problems in computer vision. Recognizing object instances in natural scenes is crucial for many real applications such as Robotic systems [1], Image retrieval [2], Augmented Reality [3] and 3D reconstruction [4]. In these applications, real-time object learning and detection are two challenging tasks. Computationally efficient approaches are strongly needed among these application fields to adapt to a changing and unknown environment, and to learn and recognize new objects. Many of objects in these applications have little texture, and they are therefore called “texture-less” objects.
Recently, deep Convolutional Neural Networks (CNN) have achieved impressive results for object detection. These methods can be mainly divided into region-based CNN methods [5,6,7,8,9,10] and regression-based CNN methods [11,12,13,14,15]. Region-based CNN method first extract candidate regions in the detection area in preparation for subsequent feature extraction and classification. This starts from Regions with CNN features (RCNN) [5] and is improved by SPP-Net [6] and Fast RCNN [7] in terms of accuracy and speed. Later, Faster R-CNN [8] uses the region proposal network to quickly generate object regions, achieving high object detection accuracy. The Faster R-CNN can also be used for other sensors such as infrared image [9] and Terahertz image [10]. Compared with the method based on region, a regression-based method usually achieves better real-time performance by using end-to-end detection frameworks. Typical regression-based CNN methods include You Only Look Once (YOLO) [11] and Single Shot multibox Detector (SSD) [12]. The regression-based methods are improved by multi-view object detection [13] and light field imaging by [14] in terms of accuracy and dimension. Despite the progress, there are also notable limitations for deep leaning methods. First, the deep leaning methods are much dependent on big training dataset which are usually lacking in texture-less object detection applications. Second, the training for neural networks with deep architecture is quite time-consuming [15].
The object detection methods based on the manual designed features methods could not automatically extract abundant representative features from the vast training samples as deep leaning methods. But these methods are attractive for object detection because they need neither a large training set nor a time-consuming training stage, which can be implemented efficiently. Nowadays, the methods of texture-less object detection based on the manual designed features can be divided into descriptor-based methods and template-based methods.
Descriptor-based methods are widely used in texture-less object detection. While texture-rich objects can be detected under severe occlusions with distinctive local features, such as Scale Invariant Feature Transform (SIFT) [16] and Speeded Up Robust Features (SURF) [17], but these methods fail on texture-less objects which have large uniform regions. The technique assumes a feature point aggregation approach [18,19,20,21], often adopting a partial SIFT-like pipeline to describe its grouped feature points. Some of descriptor-based methods like SIFT and SURF detect very few key points on texture-less objects and local descriptors extracted on these key points are less discriminative because only similar edges exist around the key points. To enhance the local features, the SIFT descriptor and an improved spatial sparse coding Bag-Of-Words model (BOW) [22] were integrated for objects feature extraction and representation, but object location is largely disturbed by cluttered background. Tombari [23] came up with Bunch of Lines Descriptor (BOLD) features to describe and detect line segments in the pipeline of SIFT-feature description and detection. It begins by applying an original Line Segment Detector (LSD) [24] algorithm for image to obtain line segment. Then BOLD used line-segment midpoints as interest-points to aggregate nearby segments via k-nearest neighbours (kNN), and the descriptor was built by unique angle primitives over pairs of neighboring segments. The kNN classifier can be used for many applications of signal and image processing [25], [26]. Given recognition performance, another work that resembles BOLD is Bounding Oriented Rectangle Descriptor for Enclosed Regions (BORDER) [27], which achieved an impressive recognition rate. The BORDER uses an adaptation of LSD to obtain equal fragmented of each extensive line-segment termed Linelets. The improvement demonstrates better resistance in the presence of occlusion. In order to achieve scale and rotation invariance, the BORDER proposed the oriented rectangle template, which is deployed in a multi-scale rectangle scheme to enhance robustness of occlusion. Subsequently, encompassed regions are sampled linearly to accumulate rotation-invariant angle primitives [23] to generate its descriptors. For the descriptor, the key factor besides delivering exclusiveness is rotation invariance. However, to meet the requirements of the object rotation invariance, the process of building the oriented rectangle template rotations is relatively slow for high memory requiring and computational complexity especially in cluttered scenes where large number of feature points need to be described.
Most methods are based on template matching, where objects are trained with various indifferent methods and windowed through the scene to find the best matched location. Template matching is attractive for object detection because it can work well for objects with few discriminating features which are dominantly determined based on their overall shape. An early approach to template matching [28] and its extension [29] include the use of the Chamfer distance between the template and the input image contours as a dissimilarity measure. The distance measurement is efficiently computed by distance transformation, but this method is very sensitive to noise and light changes. Another method of distance measurement for binary edge images is Hausdorff distance [30], which measures the maximum of all distances from each edge point in the image to its nearest neighbor in the template. However, it is vulnerable to an occlusion and complex background. Considering the disadvantages of these methods, Hsiao proposed a novel shape matching algorithm, which can explicitly obtain contour connectivity constraints by constructing a network on the image gradient (Gradient Networks) [31]. While the method can improve the detection accuracy by iteration to calculate the probability of matching each pixel to the object shape, it cannot process video or image sequences in real-time. Generally, a typical template-based matching algorithm considers the template in their entirety but tends to suffer performance complexity issues since the matching process may require searching through a large amount of pixels to find potential matches for the template. Consequently, many template-based algorithms have troubled in real-time object detection, where massive amounts of templates are often required to compensate for the lack of visual properties such as rotation and scale changes. To overcome the limitation, image gradients instead of image contours was proposed for use as matching features [32,33]. Based on image gradients, Dominant Orientation Templates (DOT) was designed to detect texture-less objects. At the core of DOT is a binary representation of the image and template, choosing a dominant gradient orientation for each region, which can be built efficiently and used to parse images to quickly find objects. Subsequently, based on the work of DOT [32], LINEearizing the memory (LINE2D) [33] was proposed, which is faster and more robust by cache-friendly response maps and spreading the orientations [34]. However, the DOT utilizes only the dominant gradient orientations as the matching feature and cannot adequately describe a texture-less object, resulting in the massive loss of information of the texture-less object and severe degradation of performance or even failure in the presence of occlusion and clutter. By experiments, it is found that the recognition rates of DOT and LINE2D are much inferior to descriptor-based methods.
In this paper, we propose a method having general purpose, fast, and high object detection rates by using binarized orientation compressing map and discriminative regional weight. The proposed fast algorithm, which consists of two stages, greatly reduces the computational complexity and false recognition rate. Different from DOT which only exploits the dominant orientations, the proposed method quantizes and encodes all the orientation in a neighborhood to retain more information. In order to improve the computational efficiency, the proposed method compresses the quantized gradient orientation by using a sliding circular window. After the quantization compression process, a set of possible object locations is generated in an orientation similarity measure process. Based on the possible object locations detected in the first stage, the discriminative regional weight is proposed to distinguish different objects with similar parts effectively in the second stage. Finally, we test the proposed method on two image datasets and the results are compared with some other algorithms. Experimental results illustrate that the proposed method is suitable for real-time texture-less object detection, and its performance is competitive with other state-of-the-art texture-less object detectors in homogenous conditions.
2. The Orientation Compressed Map
This section addresses the problem of generating possible object locations in texture-less object detection. We describe a process of quantizing and compressing the orientation of the gradients and explain how they can be built and used to generate possible object locations quickly. The proposed method starts by using a binary string to represent the orientation of the gradient. An orientation compressing map then is proposed to improve the matching speed. Finally, it shows how to use the orientation compressing representation to compute the similarity and extract possible object locations.
2.1. Quantizing and Encoding the Orientations
Experts usually chose to consider image edge gradients because they are proved to be more discriminant than other forms of representations [16,35]. To accelerate the matching process, the gradient direction is quantized and a binary string is employed to represent the quantized direction. As illustrated in Figure 1a, a semicircular space is divided into N parts (e.g, N = 16) which are congruent with each other, and each part is represented by a binary string. In order not to be affected by whether the object is over a dark background or a bright background, we only consider the orientation of the gradient, as shown in Figure 1b, if the angle of the direction is less than 0, it will be mapped to the upper half of the circle. As shown in Figure 1b, the orientation is encoded by a binary string, and each individual bit of the string corresponds to one quantized orientation.

Figure 1.
(a) A semi-circle is divided into 16 parts which are congruent with each other, and every part has an unique discrete direction; (b) The orientation of the gradients and their binary strings.
In this paper, Canny operator is used for edge detection. After the non-maximum suppression, double thresholds are applied to obtain the edge maps. The low threshold and the high threshold of Canny detector are proportional to the maximum gradient of the tested image. In this paper, and reaches the best performance with respect to our experiments.
2.2. Orientation Compressing Map
As mentioned above, although the DOT roughly achieves speed requirements, it only considers the dominant orientations, resulting in the unsatisfactory performance of object detection. In order to make the measure more robust to small transformations of object while meeting the speed requirements, orientation compressing map which combines the encoded orientations is proposed in this section.
In order to reduce computation complexity, a compressing process is implemented after encoding the orientation. The location in the compressed image corresponds to a block of pixels in the original image centered at location , with:
As illustrated in Figure 2b,c, and a blue block corresponds to a pixel in the compressed image.
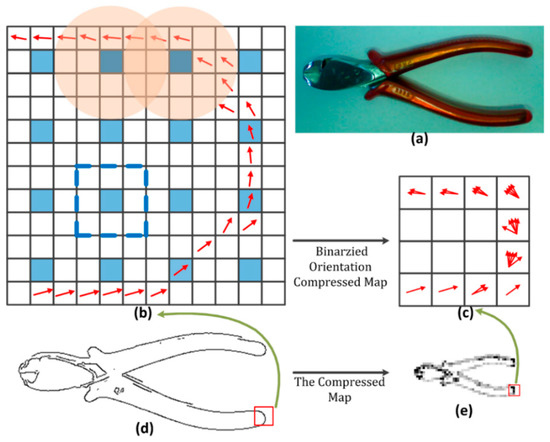
Figure 2.
An example to explain the process of producing the binarized orientation compressing map. (a) The model image; (b) Original quantized gradient orientations in the red box of model edge map; (c) The quantized orientation compressing map of Figure 2b; (d) The edge map of the model; (e) The orientation compressing map of the template image.
Different from the DOT [32], the proposed compressing map exploits all the encoded orientations in a neighborhood instead of only considering the orientation of the strongest gradient. Define as the encoded orientation of the compressing map, it can combine the orientations efficiently by performing the bitwise OR operation:
where is the compressed orientation at location in the orientation compressing map of the template image , which combines all the orientations in the region centered at location in the template image. Specially, to prevent the orientation compressing map from changing largely when shift one or two pixel, the mechanism of two overlapped circle windows is implemented. As shown in Figure 2b, two circular windows centered on blue pixels partially overlap, and their radius can be defined as follows:
indicates the circular window centered at location with radius . The symbol indicates rounding.
Figure 2 shows the process of computing the orientation compressing map of the template image which is shown in Figure 2a. Figure 2b is original quantized gradient orientations in the red box of the template’s edge map shown in Figure 2d. Figure 2c is the orientation compressing map of the orientations in Figure 2b, it combines the original quantized orientations efficiently by performing the bitwise OR operation. Figure 2e represents the orientation compressing map of the template image. In Figure 2e, the darker pixel indicates the more different quantized orientations are combined.
2.3. Similarity Measure and Possible Object Locations
In order to improve the matching speed, the gradient orientations are encoded and compressed. Naturally, both the template and the input image are implemented by the same operation, which can generate the binarized orientation compressing map respectively. The similarity measure based on the orientation compressing map is designed to fulfill the requirements of robustness to deformation and occlusion.
The orientation compressing map of the template (CMT) can be compared with the orientation compressing map of the input image (CMI) pixel by pixel according to the bitwise AND operation:
where is the compressed orientation at location in the CMT and is the compressed orientation at location shifted by in the CMI. is returning the number of bits set to 1 and counts the number of matched quantized orientations between and . As shown in Figure 3a,b, the CMT in Figure 3a is compared with the shadow region of the CMI by Equation (4) and the matched quantized orientations are represented by the arrows with blue and hollow in the Figure 3b.
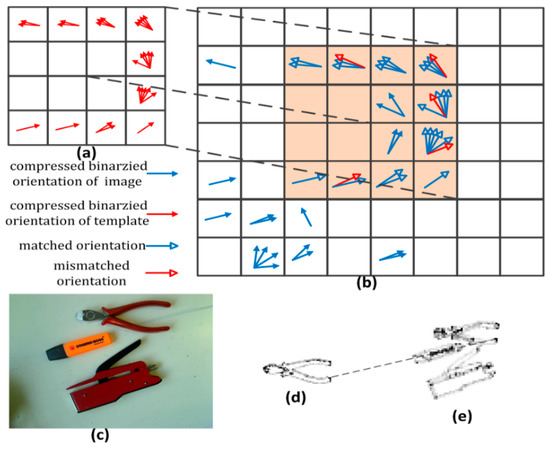
Figure 3.
Illustration of the similarity measure. (a) Part of the quantized orientation compressing map of the template; (b) CMT as a sliding window is used to calculate the similarity measure for each location in the CMI; (c) The input image; (d) Orientation compressing map of the template (CMT); (e) Orientation compressing map of the input image (CMI).
Given that parts of the model are occlusive in the input image, the similarity score is calculated for each pixel between the CMI and the CMT, which can be formalized as:
where usually indicates the number of quantized orientations at location in the CMT. There are many different quantized orientations if the CMT matches a cluttered region in the CMI. To improve the robustness of clutter, needs to be adjusted according to the number of quantized orientations at location shifted by in the CMI as follows:
where
and
is the number of quantized orientations at location in the CMT. Similarly, returns the number of quantized orientations at location shifted by in the CMI. According to the experimental results, is set to 3.
Considering the similarity measure that returns the average value of the similarity score of pixels between the CMI and the CMT located at , which can be evaluated as:
where represents the number of pixels possessing compressed orientations in the CMT. As shown in Figure 3a, the value of is 10.
2.4. Extract Possible Object Locations Based on the Orientation Compressing Map
The similarity measure is used to yield a set of possible object locations. In the D-Textureless dataset [23], models are rotated and scaled in the test images and the test images are 640 × 480 pixels as shown in Figure 4. For the red plier model, it appears in Figure 4e,f respectively, which are the positive test samples. Figure 4g,h are the negative test samples. Before matching with these test images, the model is performed scale and rotation transformation, which can generate 252 templates by rotating the model in the range of with increment and scaling the model in the range of [60%, 90%] with 5% increment. The model can be easily learned because the learning process only requires generating and storing the orientation compressing maps of these templates (CMT) with different scales and rotations. For the precision and computational load, is a good trade-off with respect to our experiments, which will be explained in detail in Section 4.1.
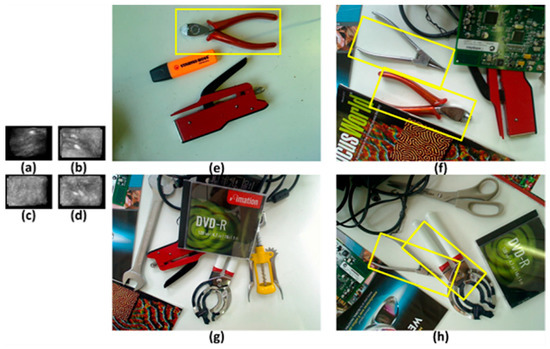
Figure 4.
Possible object locations. (a–d) The similarity score of CMI. (e) There is only one possible object location; (f) There are two possible object locations, and one of them is the positive; (g) There are no possible object locations; (h) Unfortunately, there are two negative possible object locations, but they can be eliminated in the second stage.
The compressing map can be used for generating possible object locations efficiently. The whole time of generating orientation compressing map of the test image (CMI) and matching with the 252 orientation compressing maps of templates takes 0.19 s on a laptop with Intel Core i5 processor and 4 GB memory. The similarity score of the CMI of the four test images are shown in Figure 4a–d. Note that each pixel of similarity score in Figure 4a–d is the max similarity score of the all the CMTs matching with CMI in its location. Using the non-maximal suppression, a set of possible object locations with different scale and rotation are selected as shown in the yellow boxes in Figure 4e–h. In Figure 4e,f, it can be seen that the compressing map generates a small set of possible object locations which contain the object with correct position, scale and rotation. Especially, for some negative test samples as shown in Figure 4h, the orientation compressing map excludes all possible object locations.
3. Discriminative Regional Weight
In this section, the second part of the proposed method is introduced. After generating the possible object locations, the remaining problem is how to recognize the texture-less object in these possible locations. Based on the discriminative regional weight, a novel similarity measure is designed for the texture-less object detection.
3.1. Region Based Weight
Based on the observation from biological vision that the vision system is sensitive to the region of the greater curvature, we propose a region-based weight method which exploits the number of different quantized orientations in a neighborhood. Let be the weight value of the location , and it can be defined as follows:
where is binarized orientations at location in the weighted image:
indicates the window centered at with pixels.
As depicted in Figure 5, the weight is proportional to the number of the different quantized orientations in a neighborhood. In Equation (10), a small will result in large weight in the region of greater curvature but also a loss of contributions from other regions. In practice, we found that is a good trade-off. The methods of descriptor-based usually use feature points as the basis for object recognition. The feature points are generally detected in regions with significant gradient changes and they are more discriminative. In this way, the discriminative regional weight combines the advantages of feature points. It can not only effectively distinguish similar objects, but also enhance the robustness of occlusion.
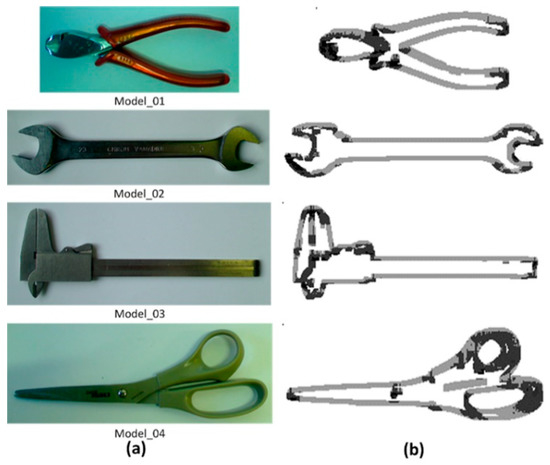
Figure 5.
Regional weight of model. (a) The original model; (b) The deeper color of the pixel where the weight value is bigger.
3.2. Object Detection
This section describes our object detection approach where the template representation is modified to deal with texture-less objects. In particular, we build on the work of spreading the orientations of LINE2D [33], yet extend it by adding a discriminative regional weight for better performance. To be robust to small image transformations, an image representation for template matching is designed by spreading the orientations. The core of spreading orientation is to spread gradient orientations in local image neighborhoods. Base on the quantized gradient orientation in the first of stage, and the formulation is as follow:
where is the spread orientation at location in the template image. According to LINE2D [33], is set to 3 in our experiments.
According to the scale and rotation of each possible object location, the appropriate template is selected and matched with the possible object location. The similarity measure is obtained by the following:
where is the discriminative regional weight at location . is the similarity function, which measures the similarity for each pixel between the candidate patch and template patch, it can be formally expressed as:
where is the penalty coefficient and its range is in this paper, is set to according to the experimental results. can be seen as the measure defined by LINE2D [33]:
where is the quantized orientation at location shifted by in the input image . And represents one quantized orientation, of the spread orientation .
The proposed similarity measure which integrates the discriminative regional weight achieves better results for similar objects recognition. As shown in Figure 6, to detect the spanner model (Model_02), a vernier caliper (Model_03) places in the input image, and part of its texture is similar to spanners’. Consequently, there is a great possibility to mistake the vernier caliper as a spanner without applying the discriminative regional weight as shown in Figure 6b. And Figure 6c represents a correct recognition by using the weight of model as displayed in Figure 6b.
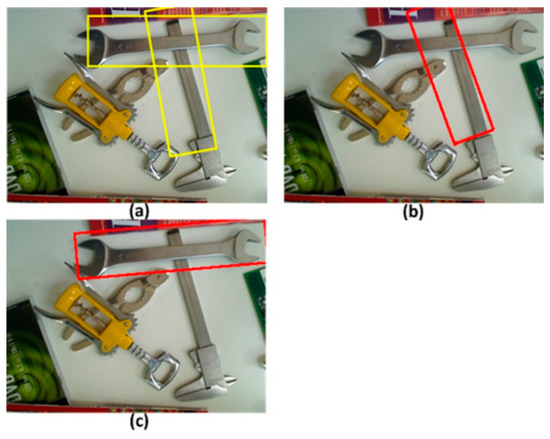
Figure 6.
To detect Model_02, an example to explain the effect of the discriminative region weight. (a) Possible object locations are generated in the first stage; (b) There is a false detection without using a discriminative region weight; (c) Applying the discriminative region weight can eliminate other negative candidate regions in the second stage.
3.3. Object Detection Algorithm
As shown in Figure 7, the proposed algorithm demonstrates a two-stage template-based procedure using Orientation Compressing Map and Discriminative Regional Weight (OCM-DRW) to effectively detect texture-less objects. In the first stage, the orientation compressing map of the template (CMT) can be compared with the orientation compressing map of the input image (CMI) pixel by pixel according to the bitwise operation, and a set of possible object locations with different scale and rotation possible object locations are generated. In the second stage, according to the scale and rotation of each possible object location, the appropriate template is selected and matched with the possible object location based on the discriminative regional weight.

Figure 7.
Block-diagram of OCM-DRW algorithm.
4. Experiment Results
In this section, the OCM-DRW is tested and compared against several state-of-art detectors in texture-less object genres. In order to evaluate the performance of OCM-DRW for object instance detection, we include in our comparison template-based methods for texture-less object detection such as LINE2D [33], as well as popular descriptor-based keypoint detectors like SIFT [16], BOLD [23] and BORDER [27]. In addition, to ensure comprehensiveness, two datasets of experiments are conducted, the D-Textureless dataset [23] for models appearing rotated, translated and scaled in the scenes and the CMU Kitchen Occlusion dataset (CMU-KO8) [36] for its highly cluttered and occlusive scenes.
The OCM-DRW is compared with LINE2D, SIFT, BOLD and BORDER, which are all implemented in C++ set with their proposed parameters in the literature. The OCM-DRW code is as we show in Ref. [37]. The implementations of LINE2D and SIFT are taken from OpenCV, while BOLD and BORDER are realized by the library from their project sites. Similar to [23] and [27], the performance of these algorithms are evaluated measuring its true positive rate and false positive rate. The test samples are divided into positive samples which contain the target object and negative samples which don’t contain the target object. The true positive ratio (TPR), also known as sensitivity, is defined as follows:
where TP are the number of positive samples which are correctly detected (True Positives) and FN is the number of positive samples which are incorrectly detected as the negative sample (False Negative). And the False positive ratio (FPR) can be defined as follows:
where FP is the number of negative samples which are incorrectly detected as the positive sample (False Positive) while TN is the number of negative samples which are correctly detected (True Negative). Detector that have a good performance are indicated by high TPR value and low FPR value.
4.1. Parameter Experiment
In Section 2.2, the input image is compressed at the scale of . We evaluate the different by using TPR and the number of possible objection locations in D-Textureless dataset, which consists of 9 models and each model has 54 images. The possible object locations are generated and TPR represents the ratio of possible object locations which contain the correct target object to all positive samples in the 486 test images. In the first stage, we consider which has higher TPR as better choice, because the possible object locations where negative samples are incorrectly detected as the positive samples will be removed in the second stage. From Figure 8, it can be seen that has higher TPR.
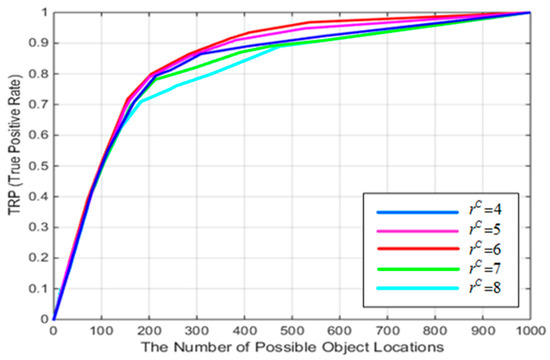
Figure 8.
Experiments for object detection with different initial values.
In Section 3.1, the weight value is computed by counting the number of different quantized orientations over a neighborhood in the template image. The value of adjusts adaptively according to the scale of template in the training stage. In the process of computing the weight in D-Textureless dataset, template images are scaled in the range of [60%, 90%] with 5% increment and the value of equals to its initial value multiplied by the scale of the templates. Figure 9 reports object detection results attained by an approach of multi-scale operation with different initial values . From the Figure 9, it can be seen that offers the best region weighted.
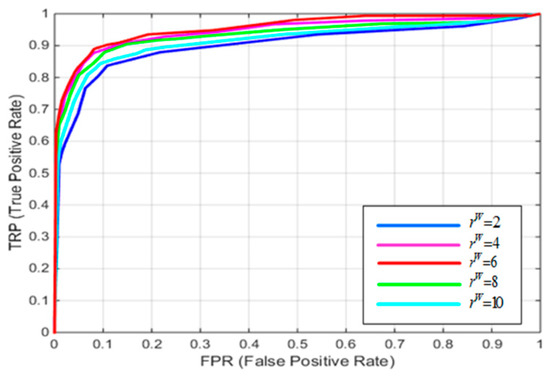
Figure 9.
Experiments for object detection with different initial values.
4.2. D-Textureless Dataset Experiment
The first experiment engages the publicly-available D-Textureless dataset by the creators of BOLD [23]. It contains 9 texture-less models, accompanied by 54 scenes with clutter and occlusions. Besides being texture-less, this dataset challenges algorithms on properties such as translation, rotation, and up to about 50% scale and occlusion. As mentioned above, 252 templates in the first stage are used to match the test image, generating a set of possible object locations. In the second stage, according to the scale and rotation of each possible object location, the appropriate template and the adjacent scale and rotation total of 9 templates are selected to detect the object and estimate its position, scale and rotation. We consolidate all participating algorithms to obtain the ROC plot as shown in Figure 10a. Upon analysis, it can be observed that texture based like SIFT clearly is inferior to the others in the texture-less objects detection. It is found that BORDER achieves an impressive object recognition rate, with OCM-DRW able to slightly edge out BORDER to claim top spot. Figure 10 presents some of OCM-DRW’s, BORDER’s and BOLD’s recognition results in the D-Textureless dataset. Based on the compressing map which exploits all the encoded orientations in a neighborhood and the discriminative regional weight which can effectively distinguish different texture-less objects, OCM-DRW performs better than BORDER and BOLD, it can detect the rotated target in the cluttered background as shown in Figure 11.
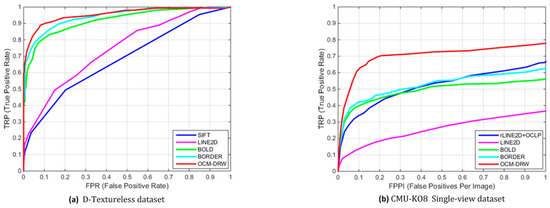
Figure 10.
Recognition results using different approaches on texture-less datasets.
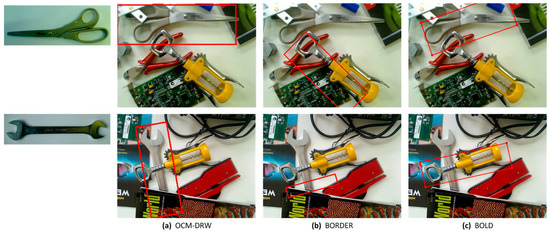
Figure 11.
Recognition results from D-Textureless dataset based on OCM-DRW, BORDER and BOLD. (a) OCM-DRW successfully detects; (b) BORDER fails to detect; (c) BOLD also fails to detect.
4.3. CMU-KO8 Dataset Experiment
For evaluation the robustness of OCM-DRW with respect to occlusion, the next experiment involves the extremely cluttered and occluded CMU Kitchen Occlusion dataset (CMU-KO8) assembled by Hsiao and Herbert [36]. This dataset consists of common household objects in a more natural setting, and cluttered environments under various levels of occlusion, making this dataset very challenging. It contains 8 texture-less kitchen-wares models, together with 100 scene images for each model in both single view and multiple view situations. In addition, each single-view scene image holds only one instance of a model object and contains ground truth labels of the occlusions. According to the dataset, Hsiao and Herbert propose three different variants of LINE2D (rLINE2D, rLINE2D+OPP and rLINE2D+OCLP) [36]. For OCM-DRW evaluation, each model does not have significant scale and rotation changes over the test images in the single-view dataset. Therefore, only 9 templates are trained by the scale and rotation transformation, which creates templates by rotating the template in the range of with increment and scaling the template in the range of [95%, 105%] with 5% increment. We attain the results of OCM-DRW, BORDER, BOLD, LINE2D and rLINE2D+OCLP in terms of recall versus FPPI (False Positives PerImage) scheme [18] as portrayed to assess the detection rate in the single-view scene. In addition, rLINE2D+OCLP is used to compare with other detectors due to the best recognition result of it among three different variants of LINE2D. SIFT is not included because of the lack of keypoint information for most of the models in this dataset. The similarity measure used by OCM-DRW make this method have good robustness of clutter, which explained in expression (6). Figure 10b shows the performance of OCM-DRW over the others in the single-view database, also revealing OCM-DRW’s robustness in heavy occlusion and clutter. OCM-DRW performs better than BORDER and BOLD, it can detect the target object partially covered in the cluttered background as shown in Figure 12.
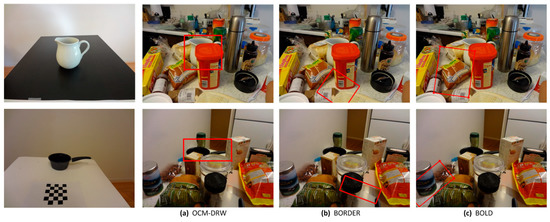
Figure 12.
Some detection results are achieved by OCM-DRW, BORDER and BOLD respectively from CMU-KO8 dataset. (a) OCM-DRW successfully detects; (b) BORDER fails to detect; (c) BOLD also fails to detect.
4.4. Timing Comparison
All mentioned algorithms are compared the average recognition time for test images. In addition, the recognition time is not be evaluated on the CMU-KO8 dataset, because very little emphasis is placed in scale and rotation changes and only 9 templates are used to match. Thus, the detection time is computed as an average over all the test images in D-Textureless dataset. The size of per test image is 640 × 480 in the D-Textureless dataset. The comparison results are given in Figure 13. For a fair comparison, all the algorithms are implemented on a laptop with an Intel Core i5 processor and 4 GB memory. As OCM-DRW is predominantly a binary-based detector, it has fast matching speeds. Regarding the processing time, OCM-DRW is faster than BOLD, BORDER and SIFT and slower than LINE2D because we do not implement their cache-friendly response map.
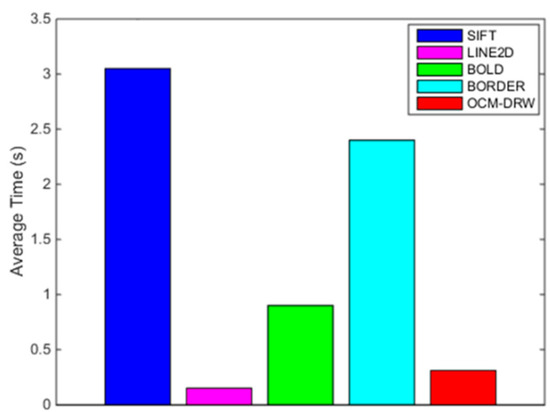
Figure 13.
The average time per image for the detectors on CPU.
In the Existing system, in order to further accelerate detection speed, the parallel processing cores of the GPU hardware will be considered in the future. The major computation in OCM-DRW is the similarity measure for each location of test image. By using Compute Unified Device Architecture (CUDA), the main process of OCM-DRW can be parallelized, and the execution of program is accelerated.
5. Conclusions
In this paper, a fast approach to texture-less object detection is proposed, which is a two-stage template-based procedure using an orientation compressing map and discriminative regional weight. Possible object locations are predicted by employing the orientation compressing map in the first stage. According to the scale and rotation of each possible object location, the appropriate template is selected and matched with the possible object locations by using the discriminative regional weight in the second stage. Results from two datasets reveal that OCM-DRW displays high competence in recognizing texture-less objects. Hence, it is expected to be utilized in a wide range of industrial vision applications. To achieve higher frame rates, in future work, we plan to parallelize the algorithm on the GPU, using CUDA parallel computation framework.
Author Contributions
Conceptualization, H.Y. and H.Q.; software, H.Q. and H.Y.; writing—original draft preparation, H.Q.; writing—review and editing, M.P.; supervision, H.Y.
Funding
This research received no external funding.
Conflicts of Interest
The authors declare no conflict of interest.
References
- Staffan, E.; Kragic, D.; Jensfelt, P. Object Detection and Mapping for Service Robot Tasks. Robotica 2007, 25, 175–187. [Google Scholar]
- Datta, R.; Joshi, D.; Li, J. Image retrieval: Ideas, influences, and trends of the new age. ACM Comput. Surv. 2008, 40, 5. [Google Scholar] [CrossRef]
- Hodan, T.; Damen, D.; Mayol-Cuevas, W.; Matas, J. Efficient Texture-less Object Detection for Augmented Reality Guidance. In Proceedings of the IEEE International Symposium on Mixed & Augment Reality Workshops, Fukuoka, Japan, 29 September–3 October 2015; pp. 81–86. [Google Scholar]
- Rottensteiner, F.; Sohn, G.; Gerke, M.; Wegner, J.D.; Breitkopf, U.; Jung, J. Results of the ISPRS benchmark on urban object detection and 3D building reconstruction. ISPRS J. Photogramm. 2014, 93, 256–271. [Google Scholar] [CrossRef]
- Girshick, R.; Donahue, J.; Darrell, T.; Malik, J. Rich feature hierarchies for accurate object detection and semantic segmentation. In Proceedings of the IEEE Conference on Computer Vision and Pattern Recognition (CVPR), Columbus, OH, USA, 24–27 June 2014; pp. 580–587. [Google Scholar]
- He, K.; Zhang, X.; Ren, S.; Sun, J. Spatial pyramid pooling in deep convolutional networks for visual recognition. In Proceedings of the European Conference on Computer Vision (ECCV), Zurich, Switzerland, 6–12 September 2014; pp. 346–361. [Google Scholar]
- Girshick, R. Fast R-CNN. In Proceedings of the IEEE International Conference on Computer Vision (ICCV), Santiago, Chile, 7–13 December 2015; pp. 1440–1448. [Google Scholar]
- Ren, S.; He, K.; Girshick, R.; Sun, J. Faster R-CNN: Towards Real-Time Object Detection with Region Proposal Networks. IEEE Trans. Pattern Anal. Mach. Intell. 2017, 39, 1137–1149. [Google Scholar] [CrossRef]
- Liu, X.; Yang, T.; Li, J. Real-Time Ground Vehicle Detection in Aerial Infrared Imagery Based on Convolutional Neural Network. Electronics 2018, 7, 78. [Google Scholar] [CrossRef]
- Zhang, J.; Xing, W.; Xing, M.; Sun, G. Terahertz Image Detection with the Improved Faster Region-Based Convolutional Neural Network. Sensors 2018, 18, 2327. [Google Scholar] [CrossRef] [PubMed]
- Redmon, J.; Divvala, S.; Girshick, R.; Farhadi, A. You only look once: Unified, real-time object detection. In Proceedings of the IEEE Conference on Computer Vision and Pattern Recognition (CVPR), Las Vegas Valley, NV, USA, 27–30 June 2016; pp. 779–788. [Google Scholar]
- Liu, W.; Anguelov, D.; Erhan, D.; Szegedy, C.; Reed, S.; Fu, C.; Berg, A.C. SSD: Single shot multibox detector. In Proceedings of the European Conference on Computer Vision (ECCV), Amsterdam, The Netherlands, 11–14 October 2016; pp. 21–37. [Google Scholar]
- Tang, C.; Ling, Y.; Yang, X.; Jin, W.; Zheng, C. Multi-View Object Detection Based on Deep Learning. Appl. Sci. 2018, 8, 1423. [Google Scholar] [CrossRef]
- Ren, M.; Liu, R.; Hong, H.; Ren, J.; Xiao, G. Fast Object Detection in Light Field Imaging by Integrating Deep Learning with Defocusing. Appl. Sci. 2017, 7, 1309. [Google Scholar]
- Li, Y.; Wang, S.; Tian, Q.; Ding, X. Feature representation for statistical-learning-based object detection: A review. Pattern Recogn. 2015, 48, 3542–3559. [Google Scholar] [CrossRef]
- Lowe, D.G. Distinctive image features from scale-invariant keypoints. Int. J. Comput. Vis. 2004, 60, 91–110. [Google Scholar] [CrossRef]
- Bay, H.; Ess, A.; Tuytelaars, T.; Gool, L.V. Speeded Up Robust Features (SURF). Comput. Vis. Image Underst. 2006, 110, 404–417. [Google Scholar]
- Kim, G.; Hebert, M.; Park, S.K. Preliminary Development of a Line Feature-Based Object Recognition System for Textureless Indoor Objects. In Recent Progress in Robotics: Viable Robotic Service to Human; Lecture Notes in Computer Science; Springer: Berlin/Heidelberg, Germany, 2007; pp. 255–268. [Google Scholar]
- David, P.; DeMenthon, D. Object recognition in high clutter images using line features. In Proceedings of the IEEE International Conference on Computer Vision (ICCV), Beijing, China, 17–20 October 2005; pp. 1581–1588. [Google Scholar]
- Awais, M.; Mikolajczyk, K. Feature pairs connected by lines for object recognition. In Proceedings of the IEEE Conference on Computer Vision and Pattern Recognition (CVPR), San Francisco, CA, USA, 13–18 June 2010; pp. 3093–3096. [Google Scholar]
- Dornaika, F.; Chakik, F. Efficient object detection and tracking in video sequences. J. Opt. Soc. Am. A 2012, 29, 928–935. [Google Scholar] [CrossRef]
- Wang, X.; Shen, S.; Ning, C.; Huang, F.; Gao, H. Multi-class remote sensing object recognition based on discriminative sparse representation. Appl. Opt. 2016, 55, 1381–1394. [Google Scholar] [CrossRef]
- Tombari, F.; Franchi, A.; Di Stefano, L. Bold features to detect texture-less objects. In Proceedings of the IEEE Conference on Computer Vision and Pattern Recognition (CVPR), Columbus, OH, USA, 24–27 June 2014; pp. 1265–1272. [Google Scholar]
- Von Gioi, R.G.; Jakubowicz, J.; Morel, J.M.; Randall, G. LSD: A line segment detector. Image Process. Line 2012, 2, 35–55. [Google Scholar] [CrossRef]
- Glowacz, A. Fault diagnosis of single-phase induction motor based on acoustic signals. Mech. Syst. Signal Process. 2019, 117, 65–80. [Google Scholar] [CrossRef]
- Glowacz, A.; Glowacz, Z. Recognition of images of finger skin with application of histogram, image filtration and K-NN classifier. Biocybern. Biomed. Eng. 2016, 36, 95–101. [Google Scholar] [CrossRef]
- Chan, J.; Lee, J.A.; Kemao, Q. BORDER: An Oriented Rectangles Approach to Texture-less Object Recognition. In Proceedings of the IEEE Conference on Computer Vision and Pattern Recognition (CVPR), Las Vegas Valley, NV, USA, 27–30 June 2016; pp. 2855–2863. [Google Scholar]
- Olson, C.F.; Huttenlocher, D.P. Automatic target recognition by matching oriented edge pixels. IEEE Trans. Image Process. 1997, 6, 103–113. [Google Scholar] [CrossRef]
- Gavrila, D.M.; Philomin, V. Real-time object detection for “smart” vehicles. In Proceedings of the IEEE International Conference on Computer Vision (ICCV), Kerkyra, Greece, 20–27 September 1999; pp. 87–93. [Google Scholar]
- Rucklidge, W.J. Efficiently locating objects using the Hausdorff distance. Int. J. Comput. Vis. 1997, 24, 251–270. [Google Scholar] [CrossRef]
- Hsiao, E.; Hebert, M. Gradient Networks: Explicit Shape Matching Without Extracting Edges. In Proceedings of the Aaai Conference on Aritificial Intelligence, Bellevue, DC, USA, 14–18 July 2013; pp. 417–423. [Google Scholar]
- Hinterstoisser, S.; Lepetit, V.; Ilic, S.; Fua, P.; Navab, N. Dominant Orientation Templates for Real-time Detection of Texture-less Objects. In Proceedings of the IEEE Conference on Computer Vision and Pattern Recognition (CVPR), San Francisco, CA, USA, 12–20 June 2010; pp. 2257–2264. [Google Scholar]
- Hinterstoisser, S.; Cagniart, C.; Ilic, S.; Sturm, P.; Navab, N.; Fua, P.; Lepetit, V. Gradient Response Maps for Real-time Detection of Textureless Objects. IEEE Trans. Pattern Anal. Mach. Intell. 2012, 34, 876–888. [Google Scholar] [CrossRef] [PubMed]
- Hinterstoisser, S.; Holzer, S.; Cagniart, C.; Ilic, S.; Konolige, K.; Navab, N.; Lepetit, V. Multimodal templates for real-time detection of texture-less objects in heavily cluttered scenes. In Proceedings of the IEEE Conference on Computer Vision and Pattern Recognition (CVPR), Colorado Springs, CO, USA, 20–25 June 2011; pp. 858–865. [Google Scholar]
- Steger, C. Similarity Measures for Occlusion, Clutter, and Illumination Invariant Object Recognition. In Dagm-symposium Pattern Recognition; Lecture Notes in Computer Science; Springer: Berlin/Heidelberg, Germany, 2001; pp. 148–154. [Google Scholar]
- Hsiao, E.; Hebert, M. Occlusion Reasoning for Object Detection under Arbitrary Viewpoint. IEEE Trans. Pattern Anal. Mach. Intell. 2014, 36, 1803–1815. [Google Scholar] [CrossRef] [PubMed]
- Yu, H.; Qin, H.; Peng, T. A Fast Approach to Texture-less Object Detection Based on Orientation Compressing Map and Discriminative Regional Weight. Available online: https://github.com/HanchengYu/OCM-DRW (accessed on 19 January 2018).
© 2018 by the authors. Licensee MDPI, Basel, Switzerland. This article is an open access article distributed under the terms and conditions of the Creative Commons Attribution (CC BY) license (http://creativecommons.org/licenses/by/4.0/).