1. Introduction
Decision-making is one of the required tasks of a software manager. A decision-maker (DM) and team is expected to recognize and select the best alternatives, taking into account technical and human factors (e.g., experience and perceptions). The preferences for the alternatives and available criteria should lead the decision to an expected and satisfactory goal. One branch of software engineering is linked to the manufacture of tools and methods that facilitate decision-making of the software manager. The area that produces automatic, semi-automatic, interactive, and others methods is known as search-based software engineering (SBSE), in which search-based optimization is applied to software engineering. This approach to software engineering has proved to be successful and generic, and has been a sub-field of software engineering for ten years [
1]. SBSE seeks to reformulate software engineering problems as ‘search problems’ [
1,
2]. Notably, this is not to be confused with textual or hypertextual searching. Instead, search-based software engineering defines a search problem as one in which optimal or near-optimal solutions are sought in a search space of candidate solutions, guided by a fitness function that distinguishes between better and worse solutions [
3].
The techniques found in search-based software engineering can solve many optimization problems related to the area of software engineering, as well as help in support of the decision-maker. Algorithms known as metaheuristics can be used to find satisfactory solutions in a set of data. Metaheuristics can easily incorporate new constraints and explore regions of a set in an attempt to achieve local optimality. Although these cannot guarantee global optimality, they can identify numerous local options.
On the other hand, problems of software engineering often involve conflicting constraints, involving ambiguous and imprecise information within a broad set of choices or decisions. Solving these problems is a complex task if there is no obvious optimal solution [
4]. If we consider a set of requirements for composing multiple constraints, the sequences of input requirements for this problem may be too numerous. Further, the solutions’ compositions must comply with constraints such as customer satisfaction, time, and cost, among others [
5].
The releases model, derived from incremental software development, allows customers to receive portions of the software in advance [
6]. A problem faced by companies developing and maintaining large and complex software systems developed for large and diverse customers is to determine what requirements will be implemented in the next software release [
7]. The more complex the software, the longer the time required to arrive at a satisfactory result concerning the planning of releases [
8].
It is essential that requirements are selected and prioritized to take effect in the most efficient way possible. Requirements changes are often the primary factor in increasing time and cost in software development projects. Therefore, selecting and prioritizing requirements while taking into account their degree of stability can increase the effectiveness of the entire software development process. Volatile requirements are considered a factor that can cause significant difficulties during software development, because these requirements may change throughout the project implementation. In this way, changes in features are expected, which can cause problems for the software development company [
9].
As seen by the extensive coverage in the literature, software requirements planning problems are readily solved by SBSE. Deciding which requirements will be implemented first is a decision problem for the software manager, which can be solved using quantitative methods, such as metaheuristics. However, the task of prioritizing also has a subjective bias related to the decision-maker’s experience. In this scenario, verbal decision analysis (VDA) may appear as an alternate option to work around these issues. It must be emphasized that verbal decision analysis is a subjective method widely used to solve the qualitative problems inherent to personal preference.
In addition, addressing next release issues can be a relatively complex task for the decision-maker, as finding a satisfactory solution may involve consideration of several factors, such as technical precedence, available resources and risk. Predictably, this effort requires time and skill from the decision-maker, especially if the problem contains many requirements and constraints. Software release planning requires social values that are transversal to the task at hand, such as an intuitive ability and good communication from those involved in planning. Thus, the experience of the decision-maker is an extremely important factor in this task and taking it into account reveals another bias in the process of assembling software releases. Subjective aspects may include preferences of the decision-maker to allocate to certain teams, to focus on requirements that can be implemented more quickly, or for particular aspects inherent in his field of experience.
The problems of the planning of releases are mostly multi-objective, and therefore, the solution is almost always composed of a family of solutions located at the Pareto front that must be considered equivalent [
10]. The evaluated multi-objective approach consists of treating human preferences as an object to be maximized, in addition to maximizing overall client satisfaction and minimizing the project risk [
11]. Multi-objective optimization addresses optimization problems that have multiple objective functions to be simultaneously maximized or minimized. The VDA method is structured on the assurance that most decision-making problems can be qualitatively described, and supports the decision-making process by the verbal representation of problems. Although the decision-maker’s ability to choose is dependent on the occasion and stakeholder interests, methods of decision-making support are universal [
12]. The literature includes several methods based on VDA that help the decision-maker to choose, given multiple criteria, a set of alternatives that might best meet their personal preferences [
12].
Therefore, in the context of planning and ordering software releases, the objective of this work is to compare the results obtained by metaheuristics (with SBSE quantitative methodology) with the results obtained by methods of verbal decision analysis (with qualitative methodologies). We also propose a new methodology to solve requirement prioritization problems in software releases using VDA methods.
Barbosa [
13,
14] presented a version of this research that achieved good results. A solution generated by VDA aligned with those generated by metaheuristics and was very close to solutions generated by SBSE when compared to the Pareto front. This work improved previous research, updating the Non-dominated Sorting Genetic Algorithm II (NSGA-II), Strength Pareto Evolutionary Algorithm 2 (SPEA-2) and MultiObjective Cellular genetic algorithm (MOCell) metaheuristics, considering that more experienced decision-makers would solve this type of problem. These improvements will be discussed further later. A generational distance (GD) metric was also devised [
15] to make it easier to understand and compare generated results. The objectives of this change were to achieve suitable accuracy and to improve validation of overall results. Such objectives are necessary to improve this technique, using VDA as a means to solve problems common to metaheuristics. New instances were also generated and evaluated by this research.
The methodology adopted in this work provides the decision-maker of a software development project with an alternative approach to a software release planning problem, indicating the best order of implementation of software requirements, taking into account technical aspects (e.g., implementation cost and technical precedence between requirements) and human aspects (e.g., technical knowledge and experience).
2. Verbal Decision Analysis
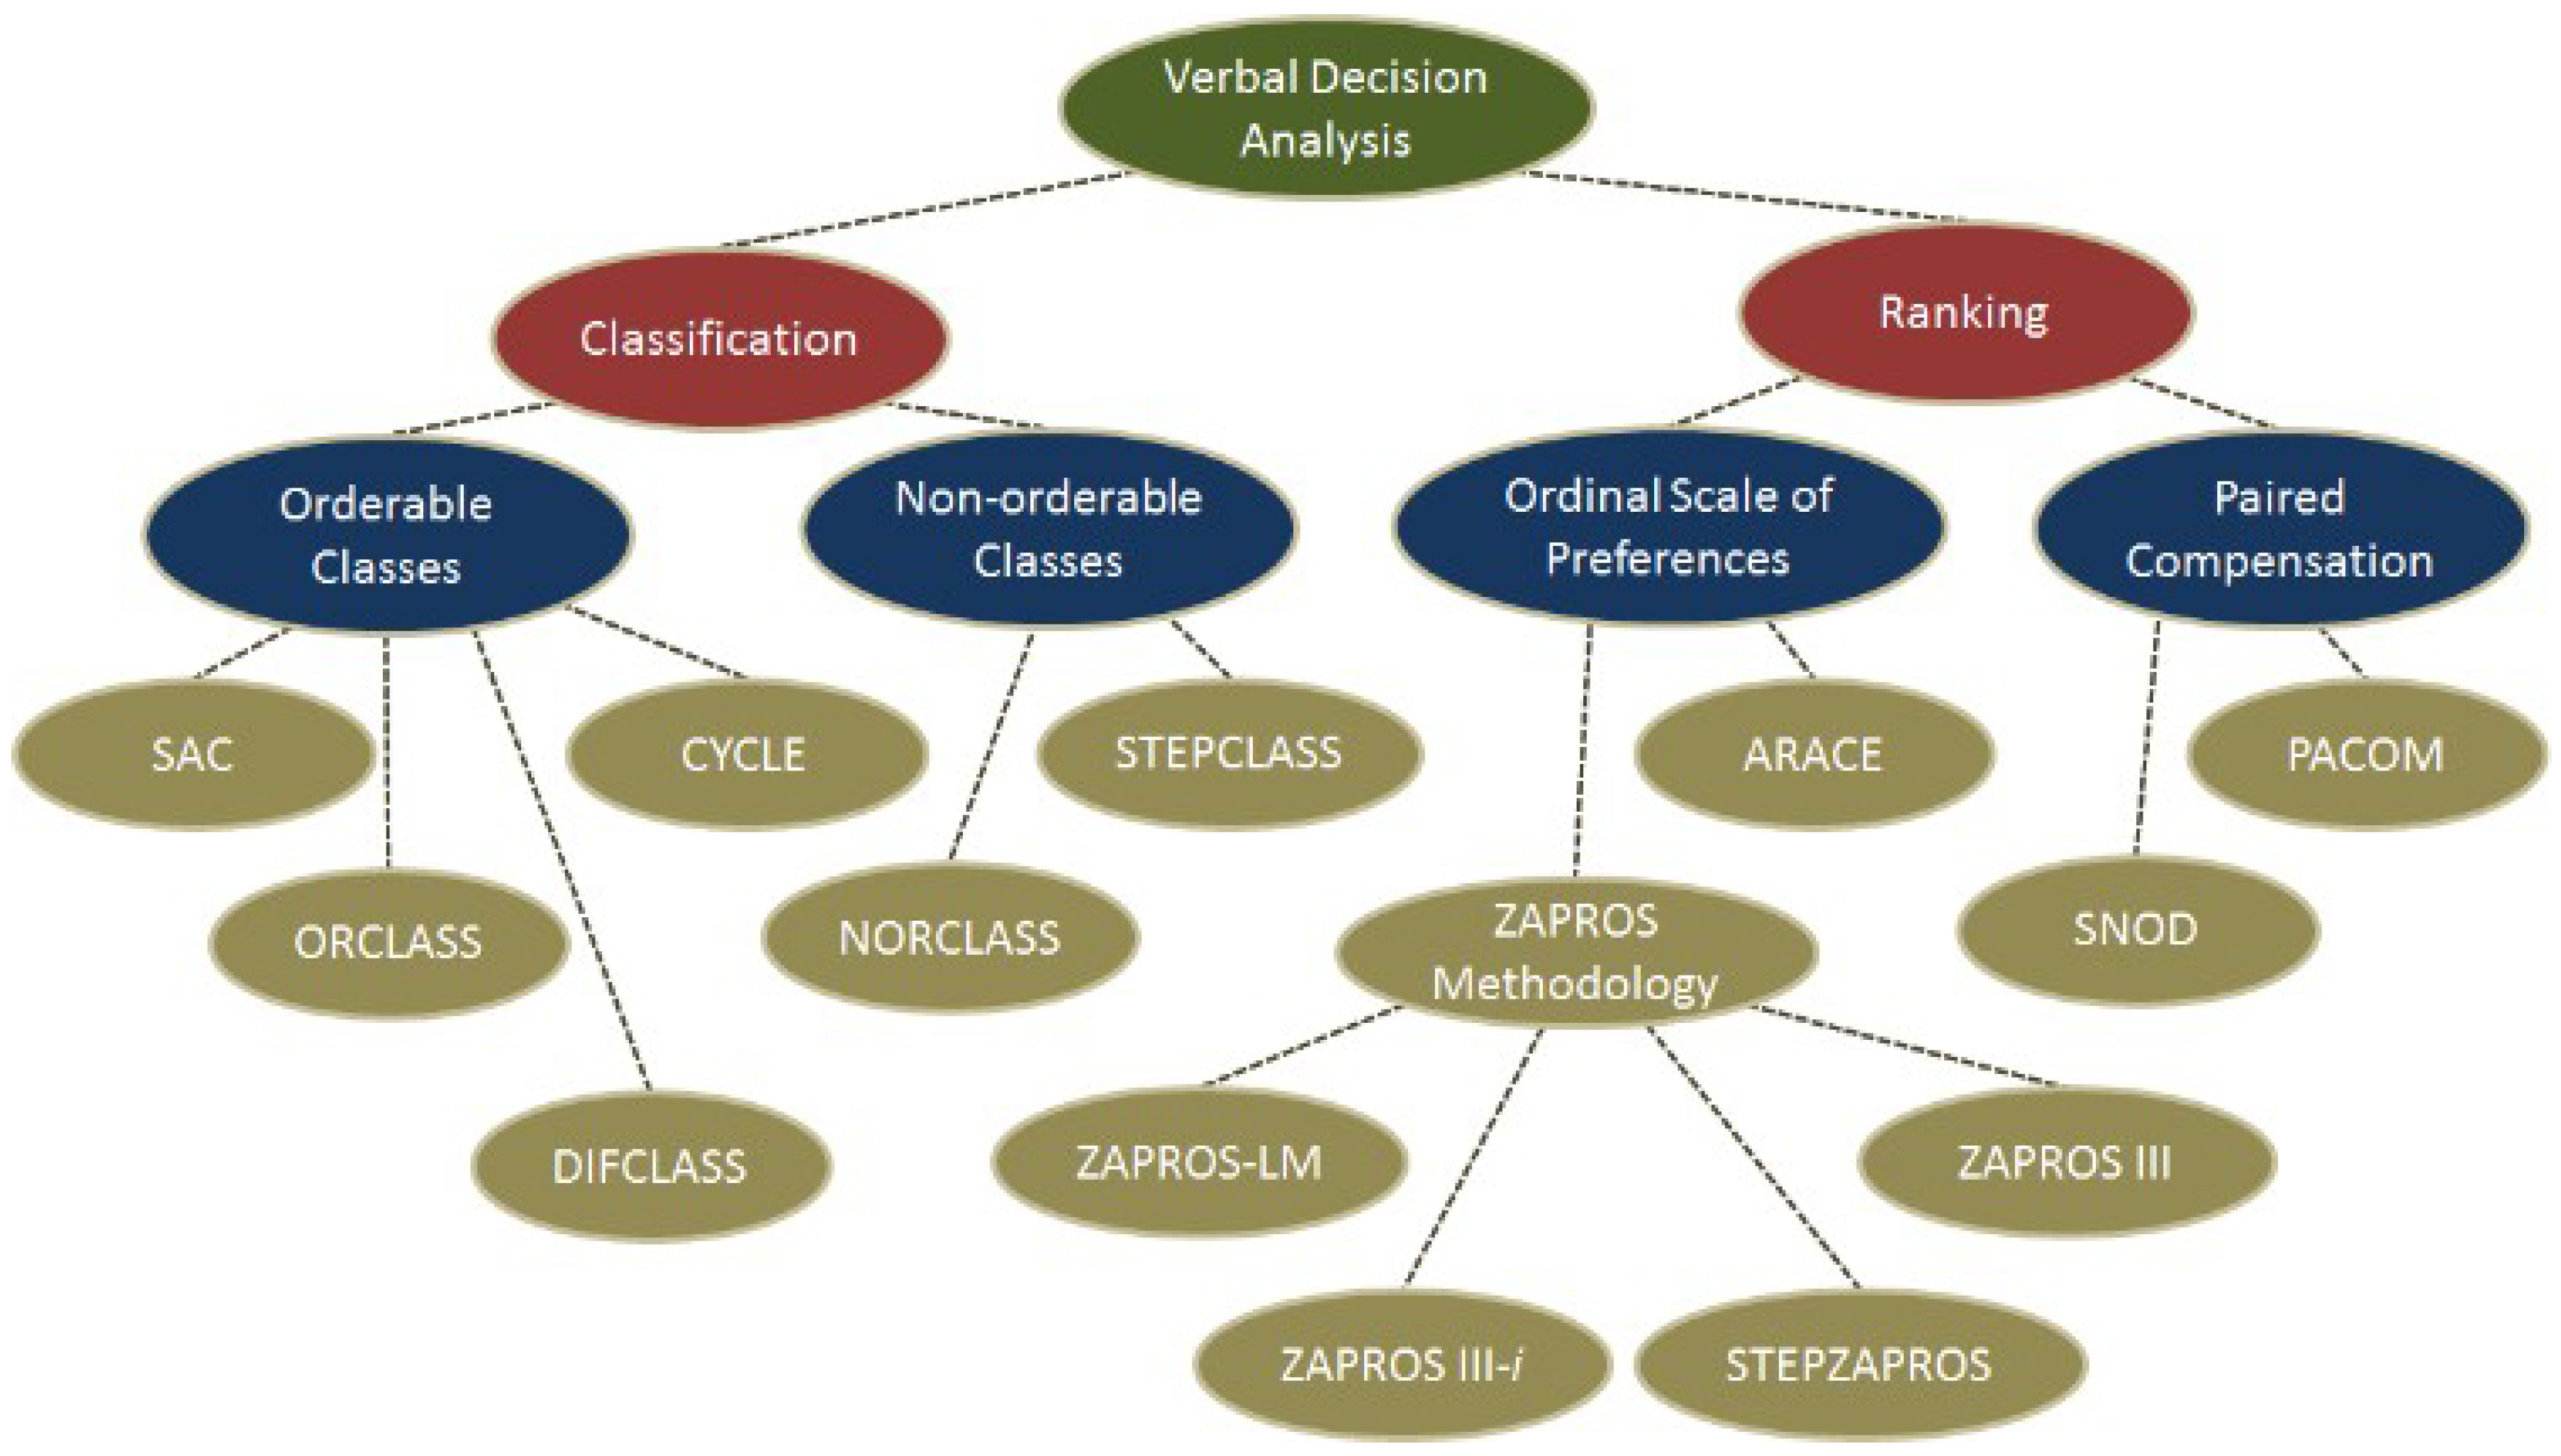
Verbal decision analysis (VDA) proposes systematic analysis and support of decisions based on verbal factors and a qualitative analysis of attributes, as opposed to the quantitative methods that are generally used. Therefore, no numerical conversions are performed. VDA comprises a set of several methods for classifying and ordering alternatives, which consider multiple criteria in solving problems [
16].
Figure 1 shows the VDA methods for classification and ordering.
Furthermore, verbal decision analysis has excellent applicability to problems that present a considerable number of alternatives and a relatively small set of criteria and their values. The methods that make up the VDA framework have many features and benefits [
18], among which we highlight the following:
- (i)
Its purpose is to describe the problems, and VDA methods use language that is natural for the decision-maker;
- (ii)
Methods use the verbal information to induce preferences, which allows them to implement psychologically valid measures from the decision-maker’s viewpoint;
- (iii)
Methods include steps to process inconsistent entries in decision-maker preferences, such as consistency checks and criteria independence;
- (iv)
Methods use transparent procedures from the decision-maker’s viewpoint;
- (v)
They allow us to review the preferences that were given and the means of generating the result, providing explanations about the results generated.
The application of these methods and, in particular, the ZAPROS method, to a given problem presents a significant amount of solution possibilities. However, this is due to the numerous combinations of criteria values to generate situations to be analyzed, which, at the end of the process, refer to the decision rule. This high number of combinations can complicate the stages of preference elicitation and comparison of alternatives such that it would be impossible to perform them manually.
Estimation of the number of unparalleled alternatives (and consequently of the decision power of the method) can be made by calculating the general number of alternative pairs
(where
N is the number of criteria and
n is the number of criteria values) and the subset that will be related by Pareto dominance (
D). From the difference between
Q and
D, we have the set of alternatives that depends directly on the scale of preferences obtained by the answers of the decision-maker; this is the set that is more likely to contain opposite pairs of alternatives. Then, we have the decision power index of a method by means of the calculation
, where
B is the difference between
Q and
D, and
S is the number of alternatives that cannot be compared based on the preference scale of the decision-maker, or which represent incomparable alternatives [
19].
3. The ZAPROS III-i Method
The project manager has among his activities the role of making decisions. To come up with a solution, he has a set of alternatives to choose from. Each alternative has its own characteristics and, in some cases, these may be common to other alternatives. The use of methodologies that support the decision-maker can minimize possible negative impacts caused by wrong decisions due to poor choice of alternatives [
20]. VDA aims to provide such support by presenting alternatives to the decision-maker in friendly language and in the most human way as possible. There are many methods within VDA that operate in such a manner. Among these is the ZAPROS III method [
20], which provides a more consistent process of eliciting preferences compared with previous methods [
20]. It structures preferences of values as the distances between the evaluations of two criteria, denominated quality variations (QV). In addition, it uses the formal index of quality (FIQ) to order established alternatives and minimize the number of pairs of alternatives to be compared to obtain a solution [
21]. Some alternatives may be unmatched, and this leads to unsatisfactory results in decision-making models. Thus, the ZAPROS III-
i method was devised, amending ZAPROS III slightly in the process of comparing alternatives to improve the decision method [
21]. The use of the ZAPROS III-
i methodology as a means to solve problems of ordering software requirements shows promise, since this method considers, in addition to the factors described in the previous section, the opinion of the project manager.
ZAPROS III-
i consists of a VDA method that aims at sorting alternatives in scenarios involving a reduced set of criteria and values and a large number of alternatives. The method relies on obtaining preferences around values that represent the distances between two criteria judgments. A preference scale can be structured, allowing the comparison of alternatives [
17].
As explained in [
17], the ZAPROS III-
i method is structured in three stages: problem formulation, elicitation of preferences, and comparison of alternatives. In the first step, criteria and their values relevant to the decision-making process are obtained. In the second step, the preference scale based on the preference of the decision-maker is generated. This process occurs in two stages: (i) elicitation of preferences for quality variation of the same criterion, and (ii) preference elicitation between pairs of criteria. In the last step, a comparison is made between the alternatives based on the preferences of the decision-maker. For details on the procedure, see [
17].
The method follows the same formal statement of the problem proposed in [
19,
20]:
Given:
1. K = 1, 2, ..., N, representing a set of N criteria;
2. nq represents the number of possible values on the scale of q-th criterion, (q ∈ K); for ill-structured problems, as in this case, usually nq ≤ 4;
3. Xq = {xiq} represents a set of values for the q-th criterion, and this set is the scale of this criterion; |Xq| = nq (q ∈ K), where the values of the scale are ranked from best to worst, and this order does not depend on the values of other scales;
4. Y = X1 × X2 × … × Xn represents a set of vectors yi (every possible alternative: hypothetical alternatives + real alternatives) in such a way that yi = (yi1; yi2; …; yiQ), and yi ∈ Y, yiq ∈ Xq and Q = |Y|, such that |Y| = ∏Qq=1 nq
5. A = {ai} ∈ Y, i = 1, 2, ..., t such that the set of t vectors represents the description of the real alternatives.
Required are the ranks of multi-criteria alternatives based on the decision-maker preferences.
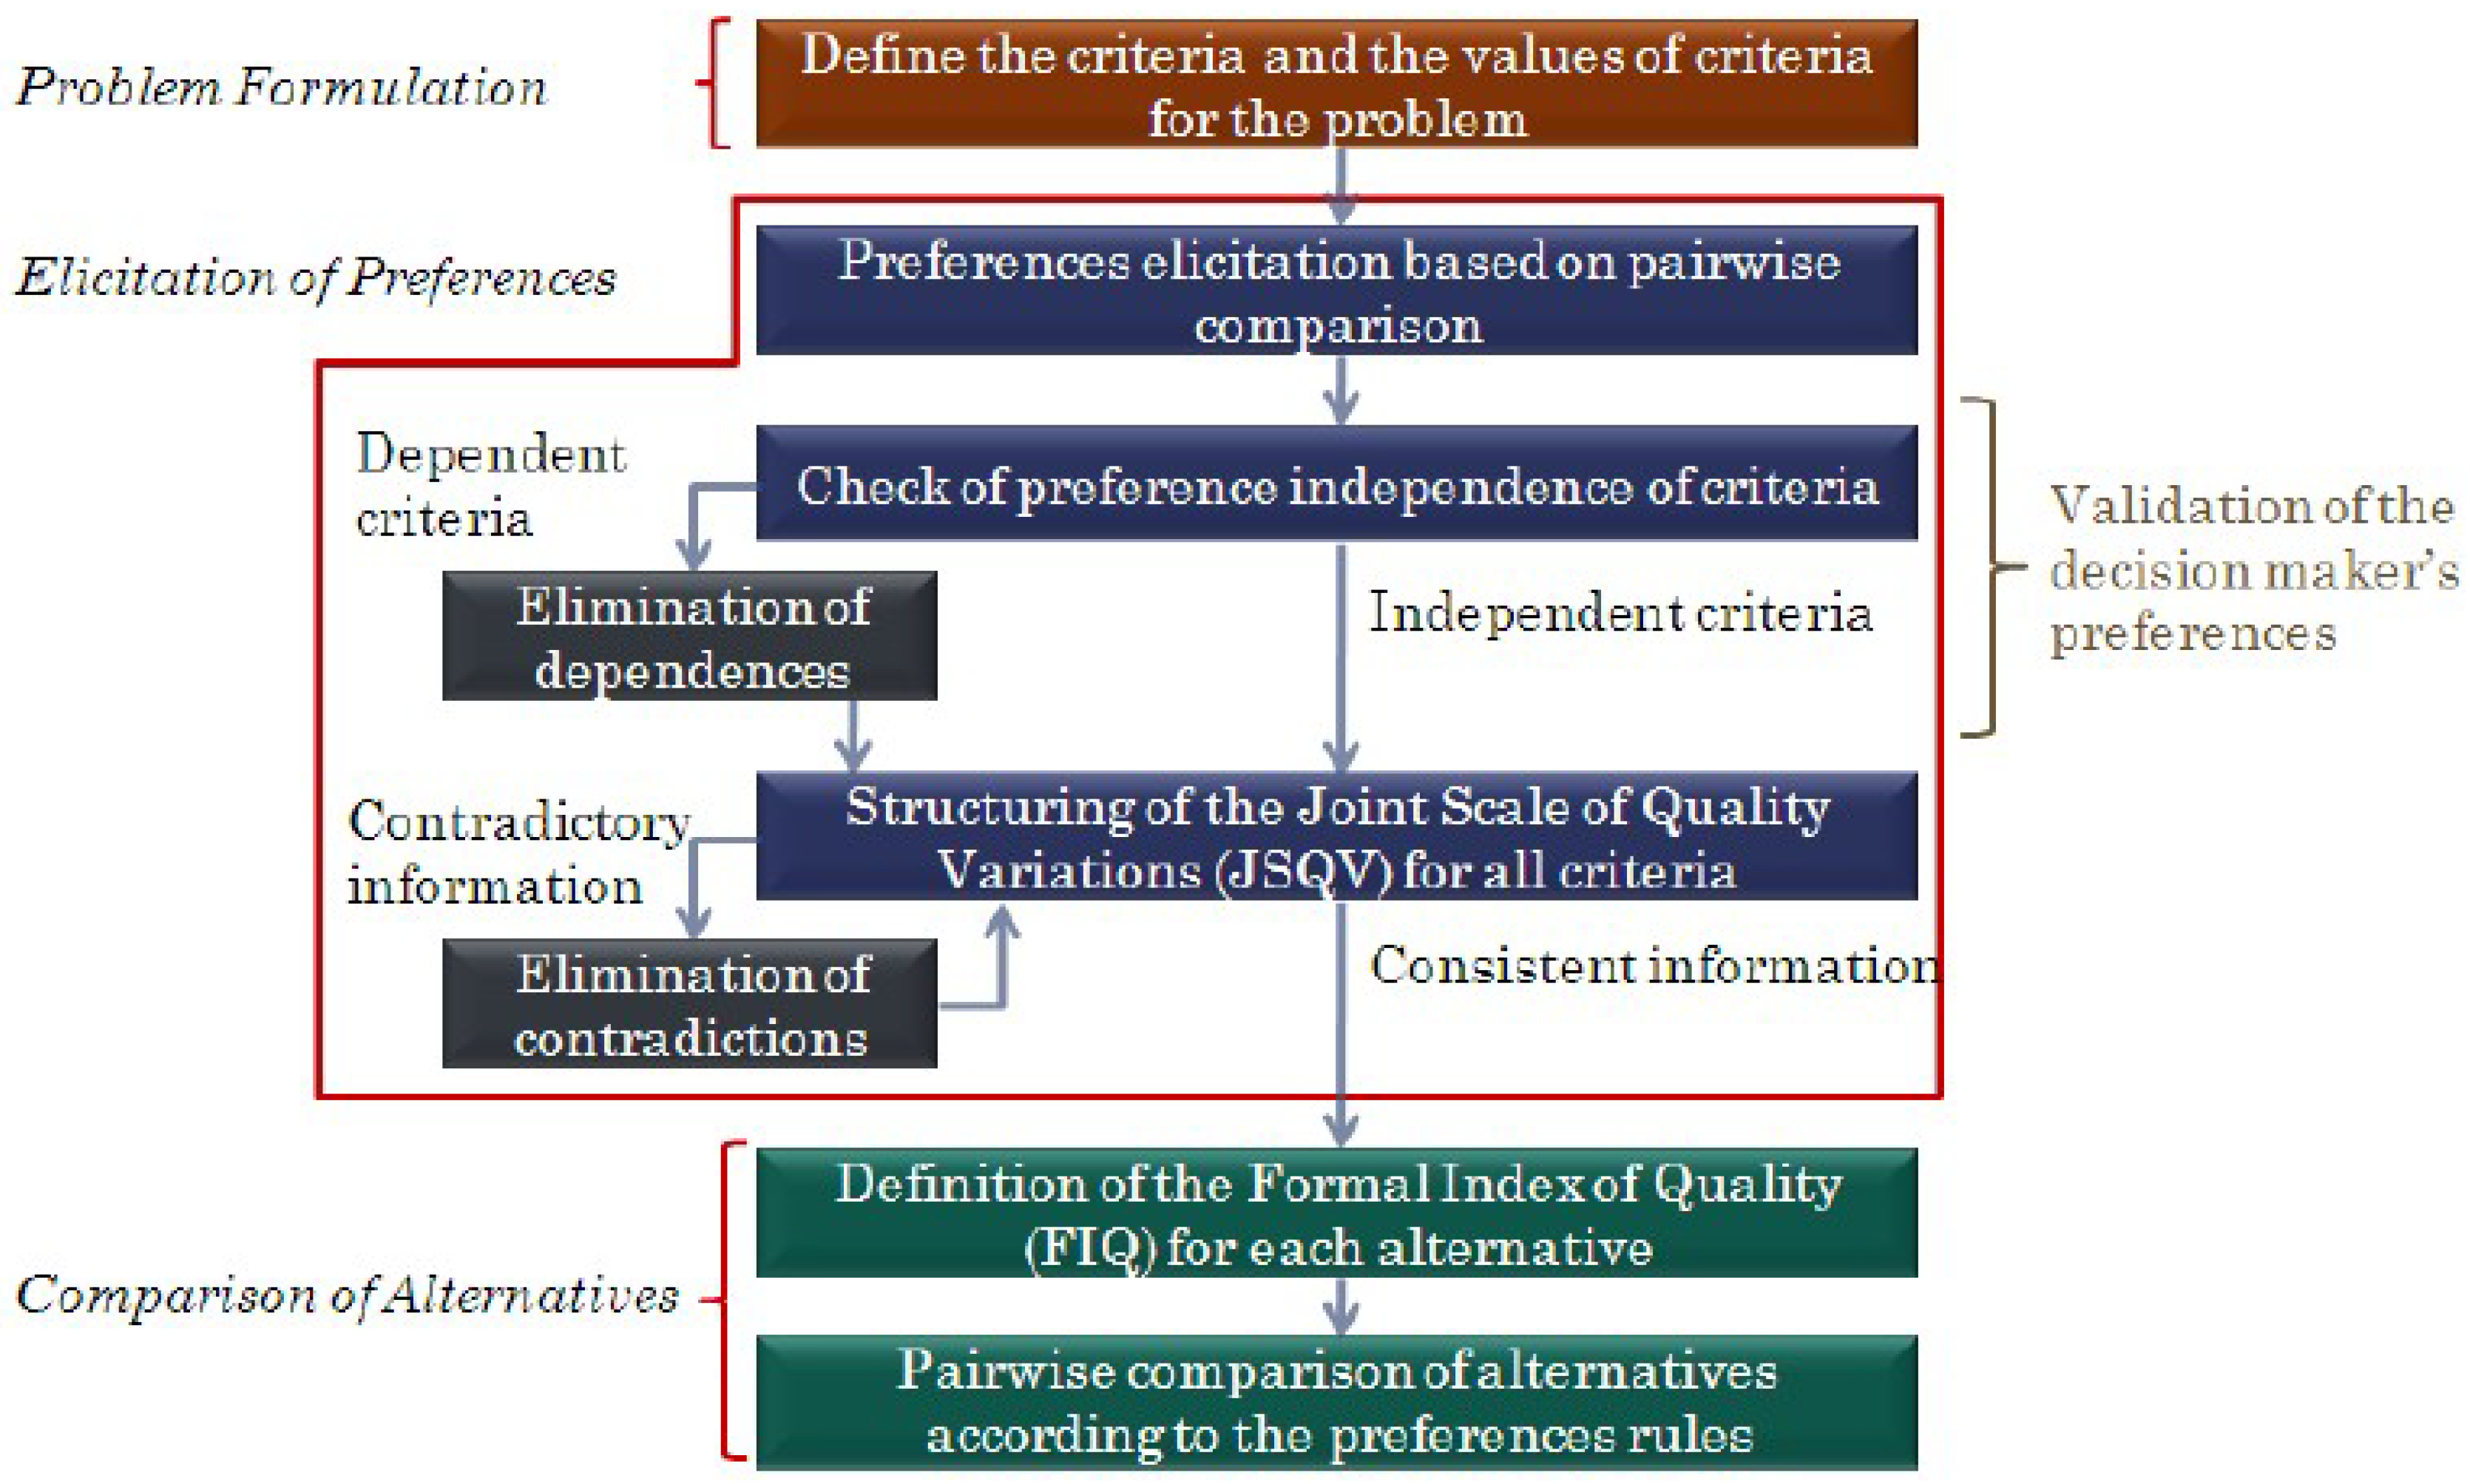
The flowchart with steps to apply the ZAPROS III-
i method to rank a set of alternatives was presented in [
17] and is shown in
Figure 2. In the first stage, problem formulation, the relevant criteria and their values are obtained through the decision-making process. In the second stage, elicitation of preferences, the preference scale is generated based on the decision-maker’s preference. As mentioned, this stage occurs in two steps: (i) elicitation of preferences for quality variation of the same criterion, and (ii) elicitation of preferences between pairs of criteria. In the last stage, comparison of alternatives, the alternatives are compared based on the decision-maker’s preferences.
In the elicitation of preferences stage, decision-maker responses allow ranking of all quality variations (QV) from the scales of two criteria. This ranking is called the joint scale of quality variation (JSQV) for two criteria. All criteria are submitted to the same process. Finally, the scale of preferences for quality variations (JSQV) for all criteria is constructed [
17].
As an example of the flow diagram shown in
Figure 2, we briefly show that the task of eliciting the preferences of the decision-maker consists of comparing all the quality variations (QV) obtained on a two-criteria scale by means of questions to him. After obtaining all the QV’s, a joint result is obtained and the JSQV is obtained, e.g., c1 < a1 < b1 < a2 < b2 < c2 < a3 < b3 < c3. Since each criterion has a set of alternatives (Y1 = {A1, B2, C2} and Y2 = {A2, B1, C2}), we can compare these alternatives with respect to JSQV and obtain a FIQ for each of these alternatives, e.g., Y1 = 3 and Y2 = 9. In this example, Y1 is more preferable than Y2. A more consistent explanation can be found in [
17].
As can be seen, VDA has many techniques. ZAPROS III-i was adopted in this work because it has a method that was developed for VDA and generates a ranking of very good alternatives.
To facilitate the decision-making process and to carry it out consistently, a tool called ARANAÚ was developed [
22]. The tool was first developed to support the ZAPROS III method. In this work, we use an updated version of the ZAPROS III-
i method. The ARANAÚ tool serves as a means of data entry and facilitates the methodology of this work because it has the ZAPROS III-
i method incorporated into it.
4. Prioritize Software Requirements
Bagnall [
7] deals with the determination of the requirements that must be executed for the next release of the software. The author predicts that customers have different levels of importance to the company and points out the requirements that have prerequisites and that must be performed in a previous or parallel release to that being implemented. The algorithms applied in this strategy can be used to obtain quick solutions to small problems.
Greer [
23] states that defining the release in which the requirement is delivered is a decision that depends on several variables that have a complex relationship. They deal with different stakeholder perspectives, release plans, and constraints.
We consider here that stakeholders involve different levels (administrator, CEO, etc.) of clients of the client company. These stakeholders have different levels of importance when viewed from the software developer’s point of view. A CEO stakeholder will surely have requirements of his particular interest implemented and delivered faster than any other employee of the client company.
In allocating requirements, it is important to note that we must also consider the resources that will be needed to implement those requirements.
It is difficult to meet all the requirements identified for a system, mainly due to time and budget constraints. Requirements are usually developed in stages and prioritization helps to define which should be implemented first [
24].
According to Karlsson [
25], the requirements must be allocated in different versions of the software and, for Berander [
26], the “correct” selection of the requirements that will be part of each version is the primary step towards the success of a project or product. Therefore, it is necessary to distinguish those that will have the most significant impact on user satisfaction.
In addition to the factors already seen, other aspects, such as volatility, can impact the prioritization of requirements. Considerable effort is required to select and prioritize volatile requirements. This type of requirement is generally considered an undesirable problem. Previous studies have already identified that their characteristics may produce adverse impacts on software development processes [
27]. For example, a study by Curtis [
28] indicates that volatile requirements correspond to a significant portion of the problems faced by software development companies.
Nurmuliani [
27] conducted a real study in a software development company to identify the causes of volatility in requirements and the impact of this on company projects. In descending order, the author considered that the most significant changes in requirements are due to: (a) inclusion of new requirements in the system, (b) exclusion of requirements and (c) modification of the characteristics of the requirements.
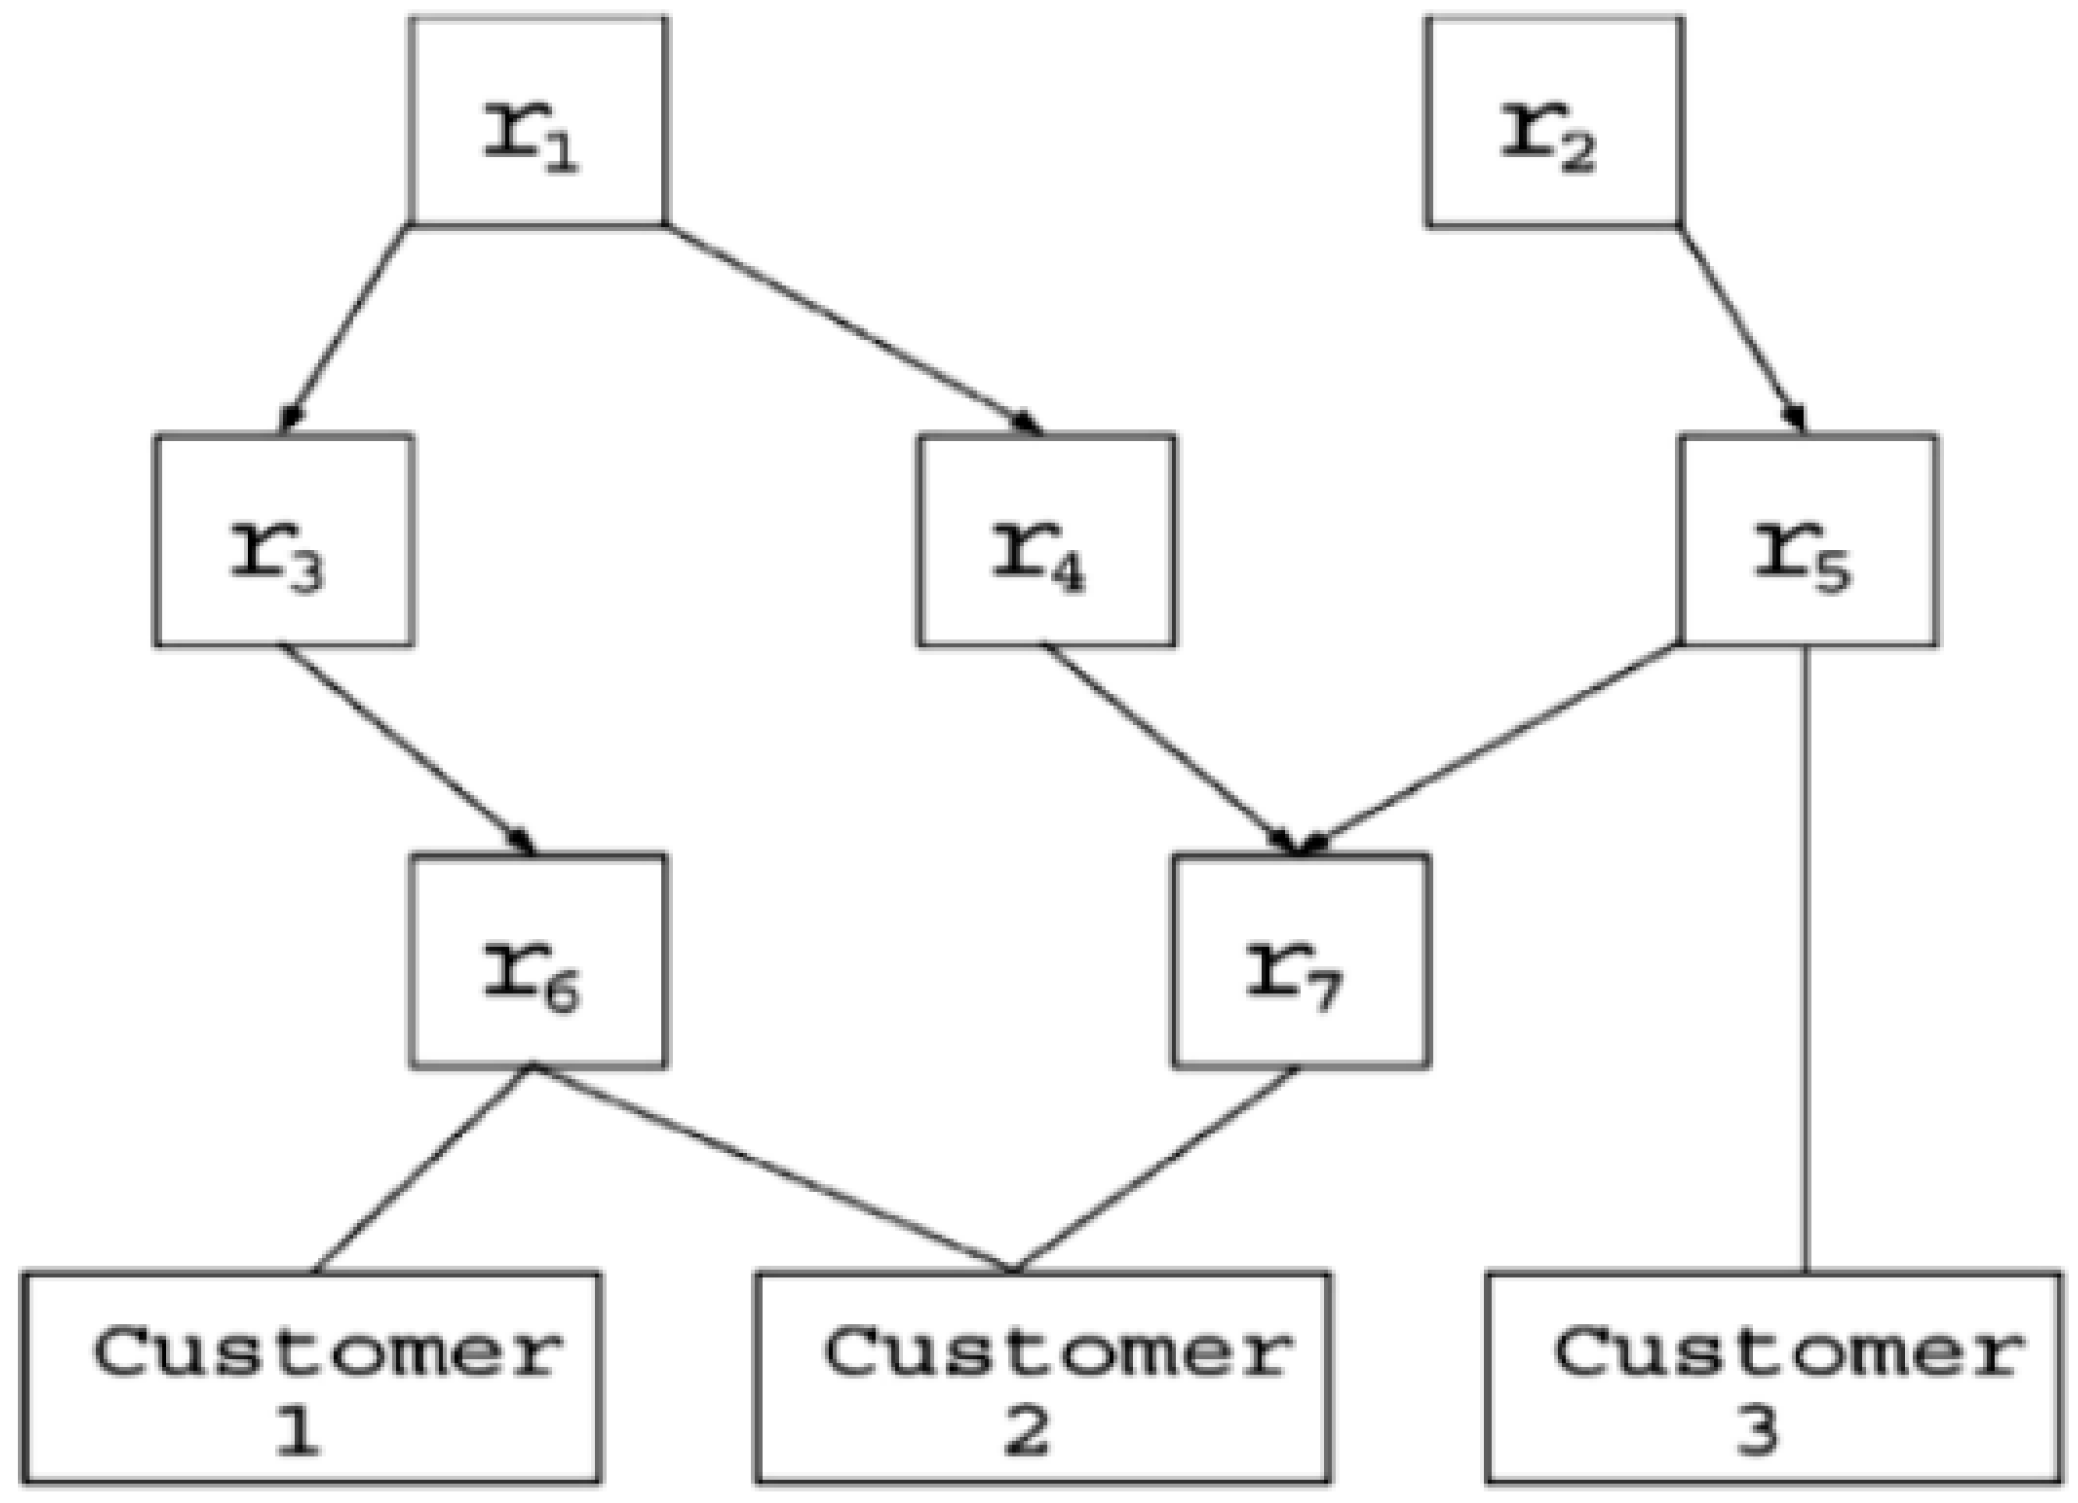
Bagnall [
7] proposed a challenge called the next release problem, which the author, a pioneer in this field of research, presents as a search of the characteristics that should be chosen given the variables, dependencies between requirements and priority of requirements.
Figure 3 shows that the requirements r(
n), where
r represents the requirement id, are associated with clients (
n), where
n represents the customer id.
The problems faced by search-based software engineering (SBSE) are usually solved through metaheuristics. According to Becceneri [
29], metaheuristics are a general algorithmic tool, which can be applied to different optimization problems, with relatively small modifications, to make them adaptable to a specific problem. Thus, we can consider metaheuristics as heuristic procedures that have generic strategies for escaping from good locations. Metaheuristics can easily incorporate new constraints and explore regions of a set in an attempt to overcome local optimality. Although they cannot guarantee an optimal point, they can identify several suitable options.
In the literature, several surveys [
30,
31,
32] use SBSE methods to solve software release planning problems. Brasil [
33] developed an approach that uses a multi-objective mathematical optimization formulation for the problem of release planning considering the following factors: (a) customer satisfaction, (b) prioritization, (c) business value, (d) risks, (e) resources, and (f) technical precedence. The proposed approach aimed at (a) maximizing customer satisfaction by prioritizing the most important requirements to the customer, and (b) minimizing project risks by first implementing the highest risk requirements and having as constraints the time, cost and precedence limits of each requirement. As a result of this multi-criteria approach, a random strategy employed was surmounted by metaheuristics. Therefore, metaheuristics have generated better solutions considering the objectives, which corroborates the use of these approaches.
Our work proposes to prioritize software requirements in the order in which they will be implemented using a VDA method. In the literature, we can find several problems solved by VDA in other areas of performance, such as [
34,
35,
36,
37,
38], but the use of VDA to solve the problem of the next release does not appear to be common. This leads to the search for satisfactory results in this research that, based on the characteristics of several methods [
18], chooses and uses the ZAPROS III-
i method [
16].
The results will be compared with those obtained when using the metaheuristics (quantitative methods) MOCell [
39], NSGA-II [
40] and SPEA2 [
41]. The metaheuristics used here are different from those used in Barbosa [
13,
14], because they have subsequently been discussed and have evolved into their current versions. Updating the most recent versions available for these metaheuristics brings an improvement in the results obtained by these solutions. The choice of multicriteria resolution methods among those available owes to the characteristics of the problem in question. To help validate the resulting information, we can insert a random search algorithm, which does not offer any specific search methodology.
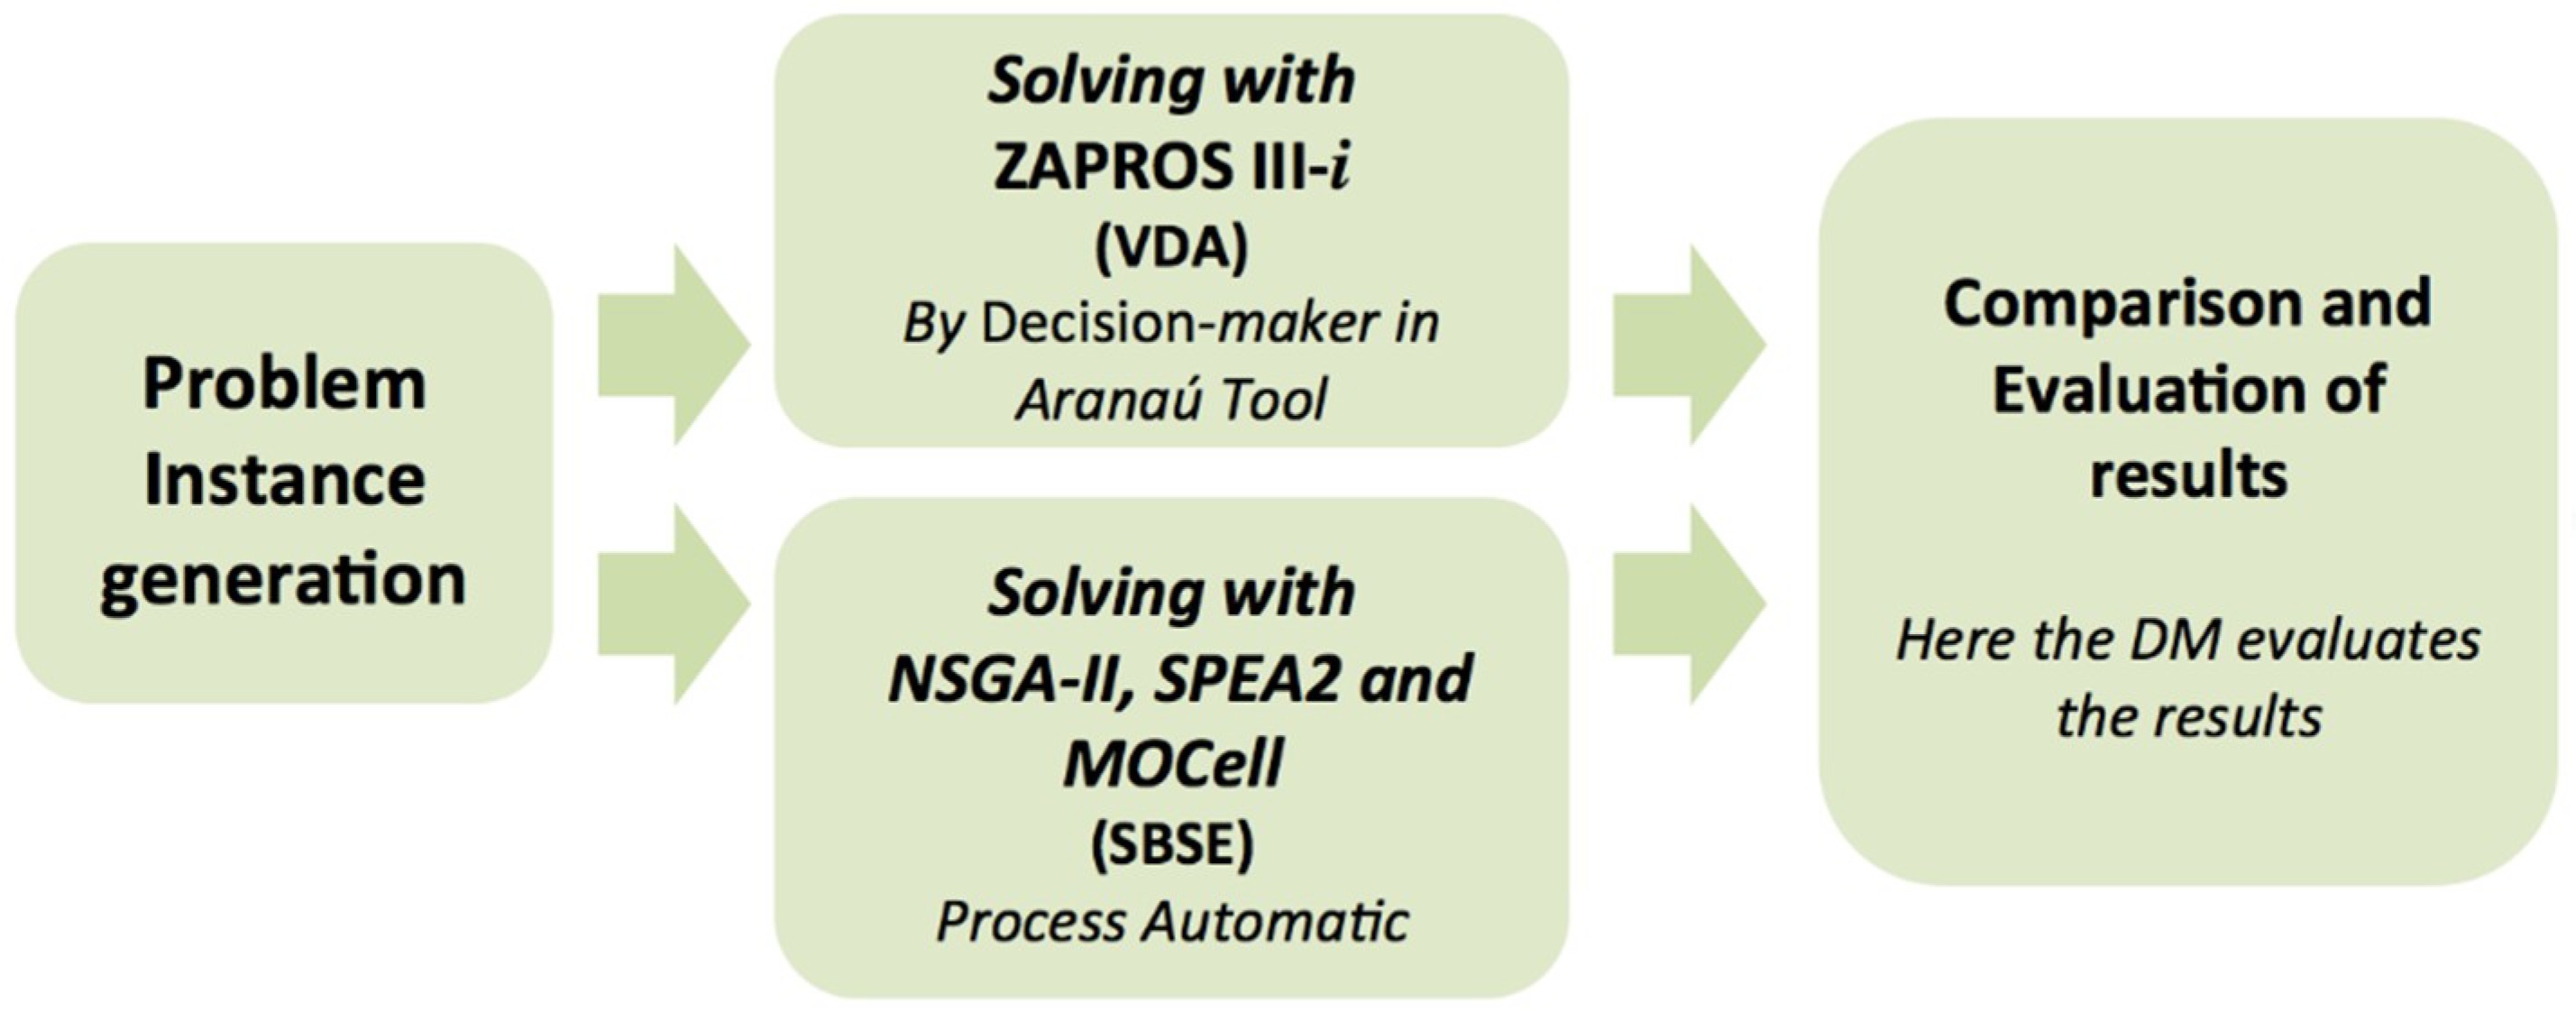
The methodology adopted in this work is represented in
Figure 4. We will emphasize in detail the methodology used by VDA to solve the proposed problem. Later we will comment on the results of the solutions obtained by the metaheuristics of SBSE.
5. Problem Generation
In this work, we are dealing with empirical problems of prioritization of requirements. Therefore, we seek to match as closely as possible the scenario faced by companies that develop software. The mathematical formulation for the elaboration of the strategy to be studied can be elaborated as follows:
Function 1— objective of maximizing customer satisfaction and aggregate business value , where the score expresses the business value to the requirement . In this way, and considering the importance , with which the client associates a requirement , the function adds more value as more requirements are selected. Therefore, the most important requirements (M) and those which may be implemented (explained in function 3) are selected for implementation, from the point of view of the most important customers.
Function 2—Represents the degree of stability of the project requirements i, through the advanced implementation of the requirements considered to be more stable. This function calculates the product between the stability of the requirement and the position to which it was allocated. The variable represents the position of the requirement (), being able to assume a value of , in the order of implementation established by the prioritization, for , where 1 indicates that the requirement has higher priority in relation to the others. Thus, a smaller value of the function indicates that requirements with greater stability were prioritized. In this way, this function maximizes the degree of stability among the project requirements, first implementing the requirements with greater aggregate stability.
Strategy constraints are presented in Equations 3 and 4, explained as follows:
Function 3—Represents the cost constraint of implementing the requirements to the available budget , where the variable indicates whether the requirement will be implemented or not , to . Since the total cost to fully implement the project may be greater than the amount of resources available, then some requirements may not be implemented. Thus, it is important to implement the most important requirements for the most important customer of the software developer company.
Function 4—Represents the constraint of precedence between the requirements, where in the case presented above, technically precedes . If a requirement precedes a requirement , then must be implemented before .
The generation of these scenarios occurred through the software generation of files with the data configured within the parameters described in the previous paragraphs. The problem settings (number of clients, available budget, technical precedence, etc.) are similar to previous searches, but the data contained in the files were regenerated for this job.
As described in the literature [
13,
14], the VDA methodology has a natural limitation regarding the number of criteria. As we are considering a criterion here as a software requirement, which has a series of characteristics, we have to adapt to the VDA model. Therefore, we consider that each problem generated has 20 software requirements.
In addition, we consider the number of customers who are interested in the project to be seven. Among these seven clients, each one of them has an importance for the technology company software developer. Some clients (managers, CEO) may be more important than others. This is taken into account. We also consider that each of these clients may have a preference for a set of requirements that, for example, are inherent to their professional activities in the client company. To generate a more realistic problem to make the process challenging, we consider that the amount of resources available is between 70% and 80% of the total value needed to implement the 20 requirements, where each of these 20 has an estimated individual value. Logically the sum of these values corresponds to the estimated overall project execution value. With a tight budget, there is a need to implement the more stable requirements. Furthermore, this is a small guarantee that the more stable, the less prone to change it will be throughout the implementation process, thus ensuring more efficient resource spending. Therefore, implementing stable requirements first appears as an advantage to the IT company, and we consider this stability as a sorting criterion. As is also known, requirements have technical precedence between them. This characteristic was considered in this work and, as shown in
Figure 4, is the first step in the methodology discussed here. The representation of the simulations generated for these situations is shown in
Table 1.
The configurations presented in
Table 1 were based on the situational workflow of companies developing small software that have several requirements with technical precedence and a tight budget. The data that each of the four files contains are empirical simulations, but they try to demonstrate the reality of these companies.
Following the methodology of
Figure 4, sessions 6 and 7 follow parallel runs of the tests in the experiments from the previous sessions.
6. Use of the VDA Methodology
For the application of the decision-making process, the ARANAÚ support tool was used. This tool gives graphical support to the use of the ZAPROS III-i methodology throughout the completion of the project data that is required.
To arrive at a useful classification using ARANAÚ, we follow these steps: (a) identification of the alternatives; (b) definition of the criteria and the criteria values; and, (c) the ARANAÚ tool application.
6.1. Alternatives
Initially, we considered for the set of alternatives the 20 requirements of the software project generated by
Table 1. Note that this table generated four variants. We will use them all in essays separately.
6.2. Definition of the Criteria and the Criteria Values
Since the generation of alternatives occurred in a quantitative format, we have numerical values ranging from a minimum to a maximum. For example, for the cost of a requirement, we have values between 10 and 20, where 10 represents the minimum cost added to a requirement and 20 the maximum value. Thus, it is necessary to convert these numerical values to a format that ranges from the term ‘low cost’ to the term ‘high cost’, as shown in
Table 2.
In order to ensure compatibility between quantitative and qualitative methods, conversion was necessary. For example, if an alternative (also called here requirement 01) has, in the quantitative model, value 04 as a parameter to determine its cost, with 01 being the lowest cost and 04 the highest cost, then in the qualitative model we can state that the requirement 01 has “a high financial value needed to be implemented”. This is due to the fact that the basis of the qualitative model (VDA) is natural language, so it was necessary for the quantitative problem to be adapted to the qualitative method. Thus, in VDA language the requirement 01, for example, has a “criteria” (in quantitative language we can call this a “characteristic”) called cost, a “criteria” called stability, etc.
Table 2 shows the definitions of VDA criteria adopted in this work as well as their possible values in natural language. In this way, we can define and evaluate the criteria to be used in ARANAÚ. It is important to emphasize that the term “criteria” used in
Table 2 deals with the characteristics that the requirements can have.
6.3. The ARANAÚ Tool Application
With all the values of the files, represented in
Table 1, defined and converted to the criteria presented in
Table 2, we can make use of the ARANAÚ tool.
Application of Questionnaire
We invited 12 professionals related to the areas of requirements management, software engineering or management of software projects to participate in this research. The average experience was 1 year. Decision-makers have an average of 5 months more experience than those that were invited [
13,
14]. Their requirements and characteristics were previously registered. An explanation was given about the experiment and participants were informed about the experiment scope in terms of available resources, technical precedence, values of importance of the client and other configurations (criteria) contained in each requirement of the set that comprises a file. Decision-makers might have a researcher available to clarify probable questions. A form was developed and applied via the Web containing the values of the requirements, such as implementation cost values, technical precedence, importance of that requirement for a particular client, and stability values. Decision-makers chose the preferences that best fitted the project’s already-defined goals (e.g., implementing the most important requirements for the most important customers to the company, leaving the more volatile requirements to last), objectives and constraints (e.g., costs, client importance and total project budget). After the generated result, the participant was able to see the generated solution and evaluate it with a score from 0 to 10 (where 0 is a minimum score and 10 is a maximum score). The mean time between the application of the questionnaire until the evaluation of the obtained result was of 9 min.
In addition to being a limiting factor for ZAPROS III-i and the ARANAÚ tool, the implementation of many alternatives (more than 20 requirements and all of their characteristics, for example) can make the questioning process time-consuming and tiring.
As this is a multi-criteria problem, some conflict issues were presented to these professionals to indicate the most feasible solution. The questions were elaborated on by the tool itself, taking into account the information provided about the project and the requirements.
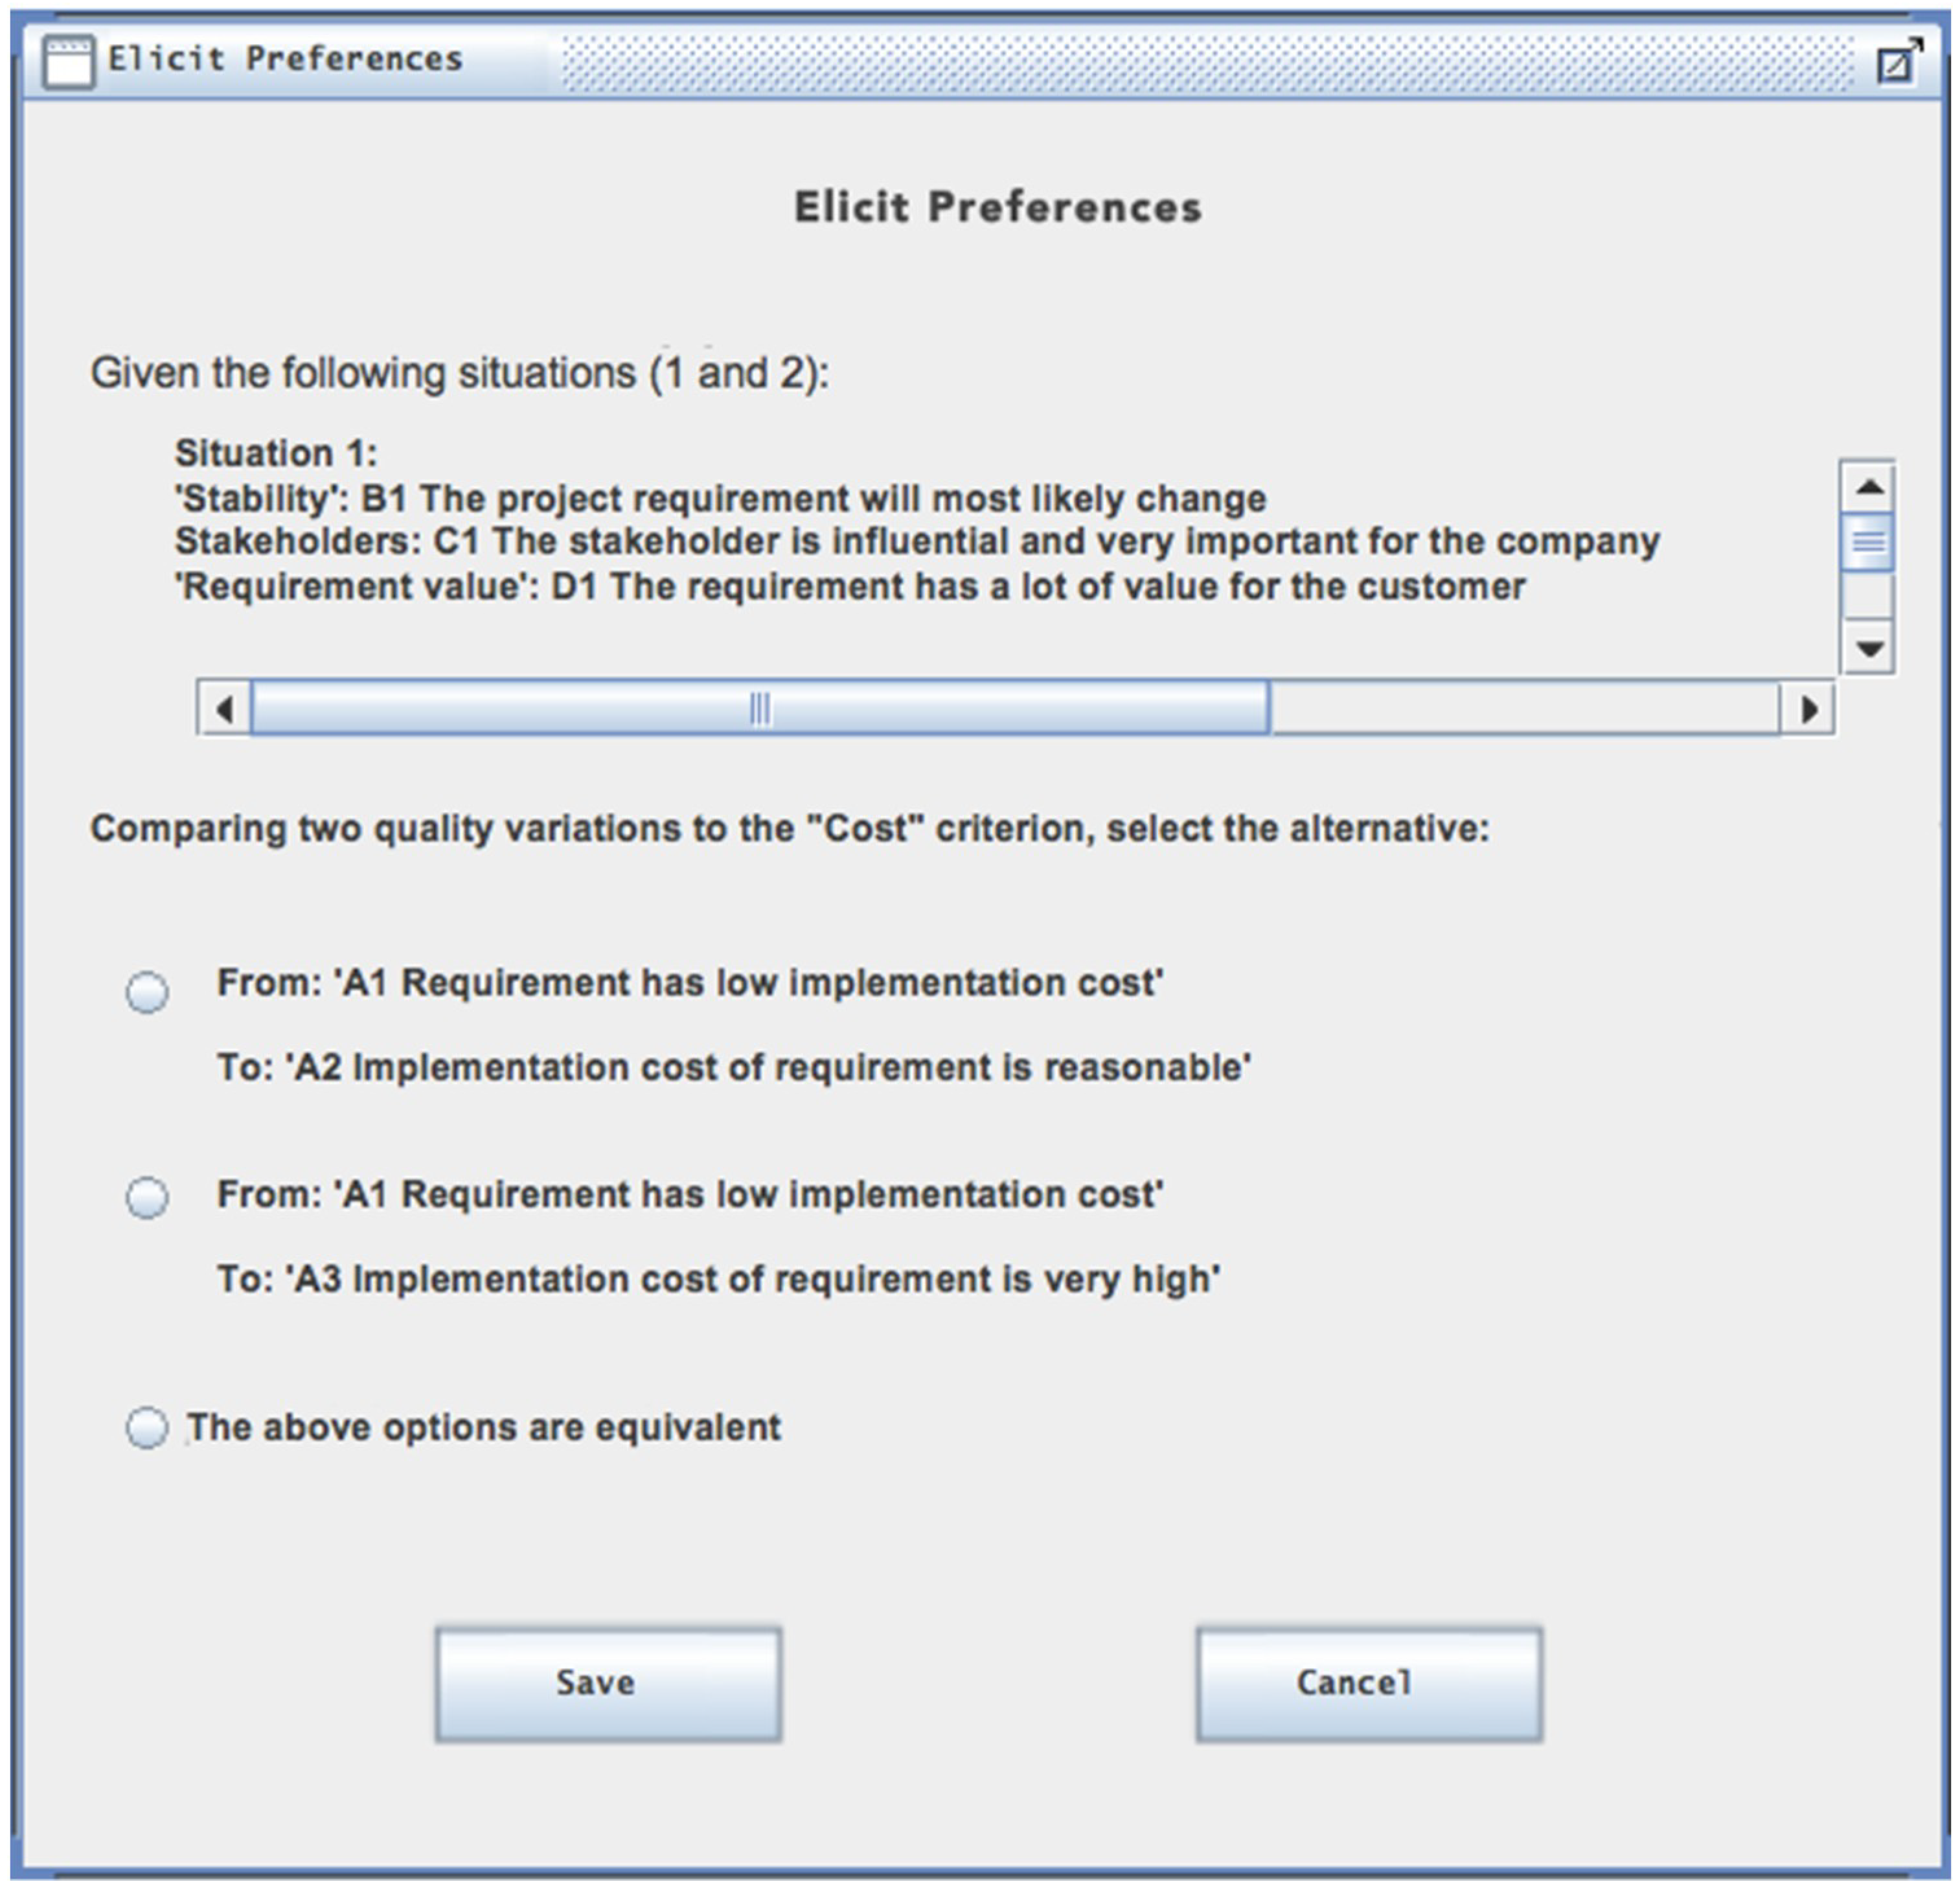
Figure 5 shows the format of the ARANAÚ application.
Here the decision-maker and his team decided what his preferences were when asked by the tool that presents available solutions for a given context.
The subjectivity adopted by the VDA is expressed when the decision maker starts choosing characteristics among the requirements that best fit the project at that moment; e.g., “is it better to implement a requirement that has a high implementation cost but is valuable to an important customer of the company?” or “for a very stable requirement, is it better to implement those that are more expensive first or not?”. This last case is shown in
Figure 5. All these subjective parameters were considered before the ZAPROS III-
i methodology generated a result.
SBSE uses similar approaches to this work, such as the one described in [
42], in which these problems are well solved. However, here we consider the adoption of a perspective that works with VDA. The point of encounter between these fields in the problem of the next release is the key point of this work.
7. Use of the SBSE Methodology
The metaheuristics NSGA-II, MOCell, and SPEA-2 presented previously, were applied to find solutions to the problem. In addition to these, in this work we also used, as a reference, the algorithms using a random search for the purposes of comparison and validation of the results obtained by these algorithms and the metaheuristics.
In SBSE a metaheuristic must surpass a random algorithm in order to be considered adequate [
43]. The parameters of the algorithms were conceived with the tests of the search approaches for the best solution to the problem. For this, the parameters described in
Table 3 were defined.
The applications of metaheuristics under the proposed approach were carried out with the help of the jMetal framework [
44]. This tool, implemented in the Java language, provides support for the construction of multi-objective metaheuristics. Each generated solution represents an average of 10 equally executed solutions. The results for SBSE metaheuristics will be discussed in the next session. As the last step of the workflow presented in
Figure 4, the comparison of results and discussion will also follow.
8. Results and Discussion
The ARANAÚ tool resulted in a set of requirements ordered according to the order of implementation, while respecting the criteria for each requirement and the choices made by the decision-maker.
Table 4 shows the ranking of requirements generated by the ARANAÚ tool for the problem File 3, where requirement 15, for example, will be the first to be implemented and requirement 3 will be the 20th if there is a resource available for such implementation.
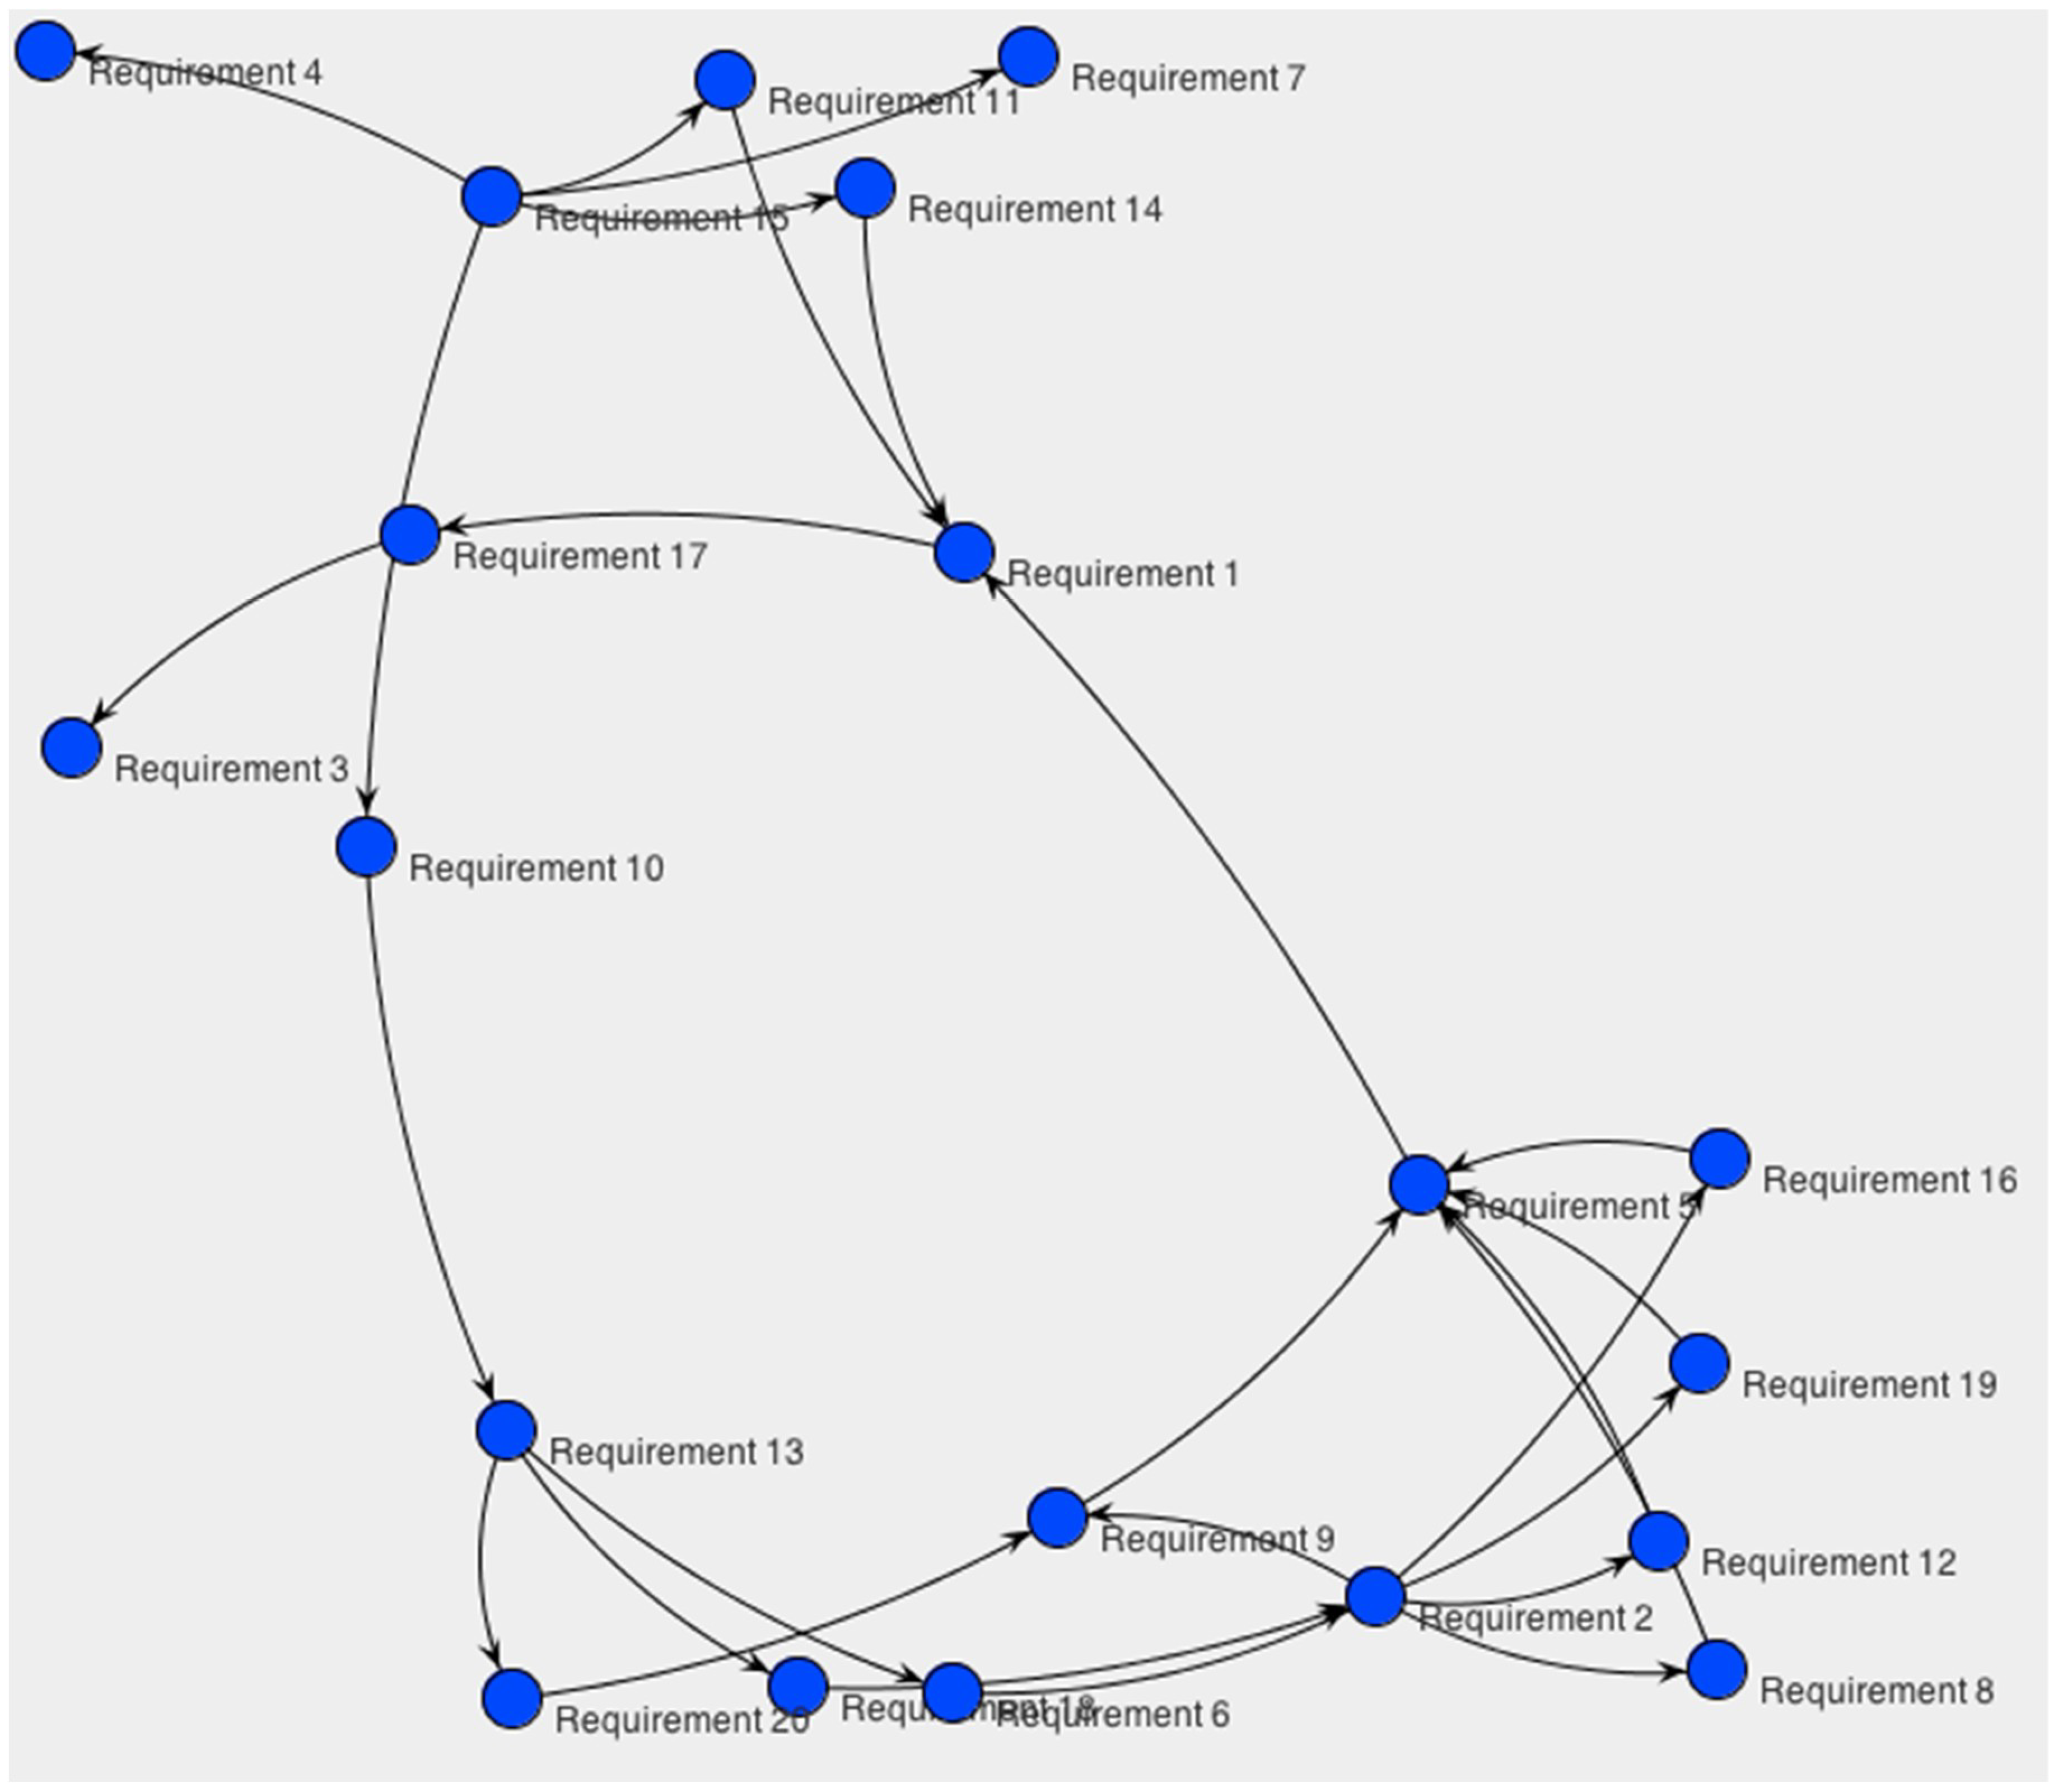
Figure 6 shows a graph of dominance among the alternatives of the set of prioritized requirements for the problem File 3.
The results obtained from the four problems executed by the methods were extracted and tabulated. Finding the set of non-dominated solutions is one of the premises of multi-objective optimization. This set can be called the Pareto front. With this set, the decision-maker is able to choose which of the solutions best meets their needs in the context of the project.
Due to the high disparity and the difference of scales between the results obtained by the strategies, a normalization of the values of the solutions was applied in order to match the results. After normalizing, the results were evaluated by the generational distance metric.
Generational Distance (GD)
The Generational Distance (GD) metric [
15] calculates the distance related to the convergence between the Pareto front solutions of the current instance (
) with respect to the actual Pareto front (
) [
45]. For each solution of
is calculated the smallest distance with respect to the elements of
, defined by:
In this metric,
is multiplied by
, defining a weighting for the distance. The normalization is obtained by the application
. The metric is defined by:
It is preferable for an algorithm to reach a low value for this metric. In
Table 5, we compare the results obtained in [
13,
14] with those obtained in this work. The lower the value presented, the closer the obtained solution to the actual Pareto front. A value of 0 means that the solution is already part of the real Pareto front. This occurs with the results from File 2. High values indicate that the solution is away from the Pareto front and, therefore, is not a good solution. Due to the high disparity and the difference of scales between the results obtained concerning the Pareto front, a normalization of the values of the solutions was applied to match the results.
As shown in
Table 5, the low values expressed by the GD metric demonstrate that the solutions obtained by ZAPROS III-
i in this work surpassed the results found in [
13,
14] in all the files, except File 2. In the previous results, the File 2 solution was already part of the real Pareto front and, hence, could not be further improved.
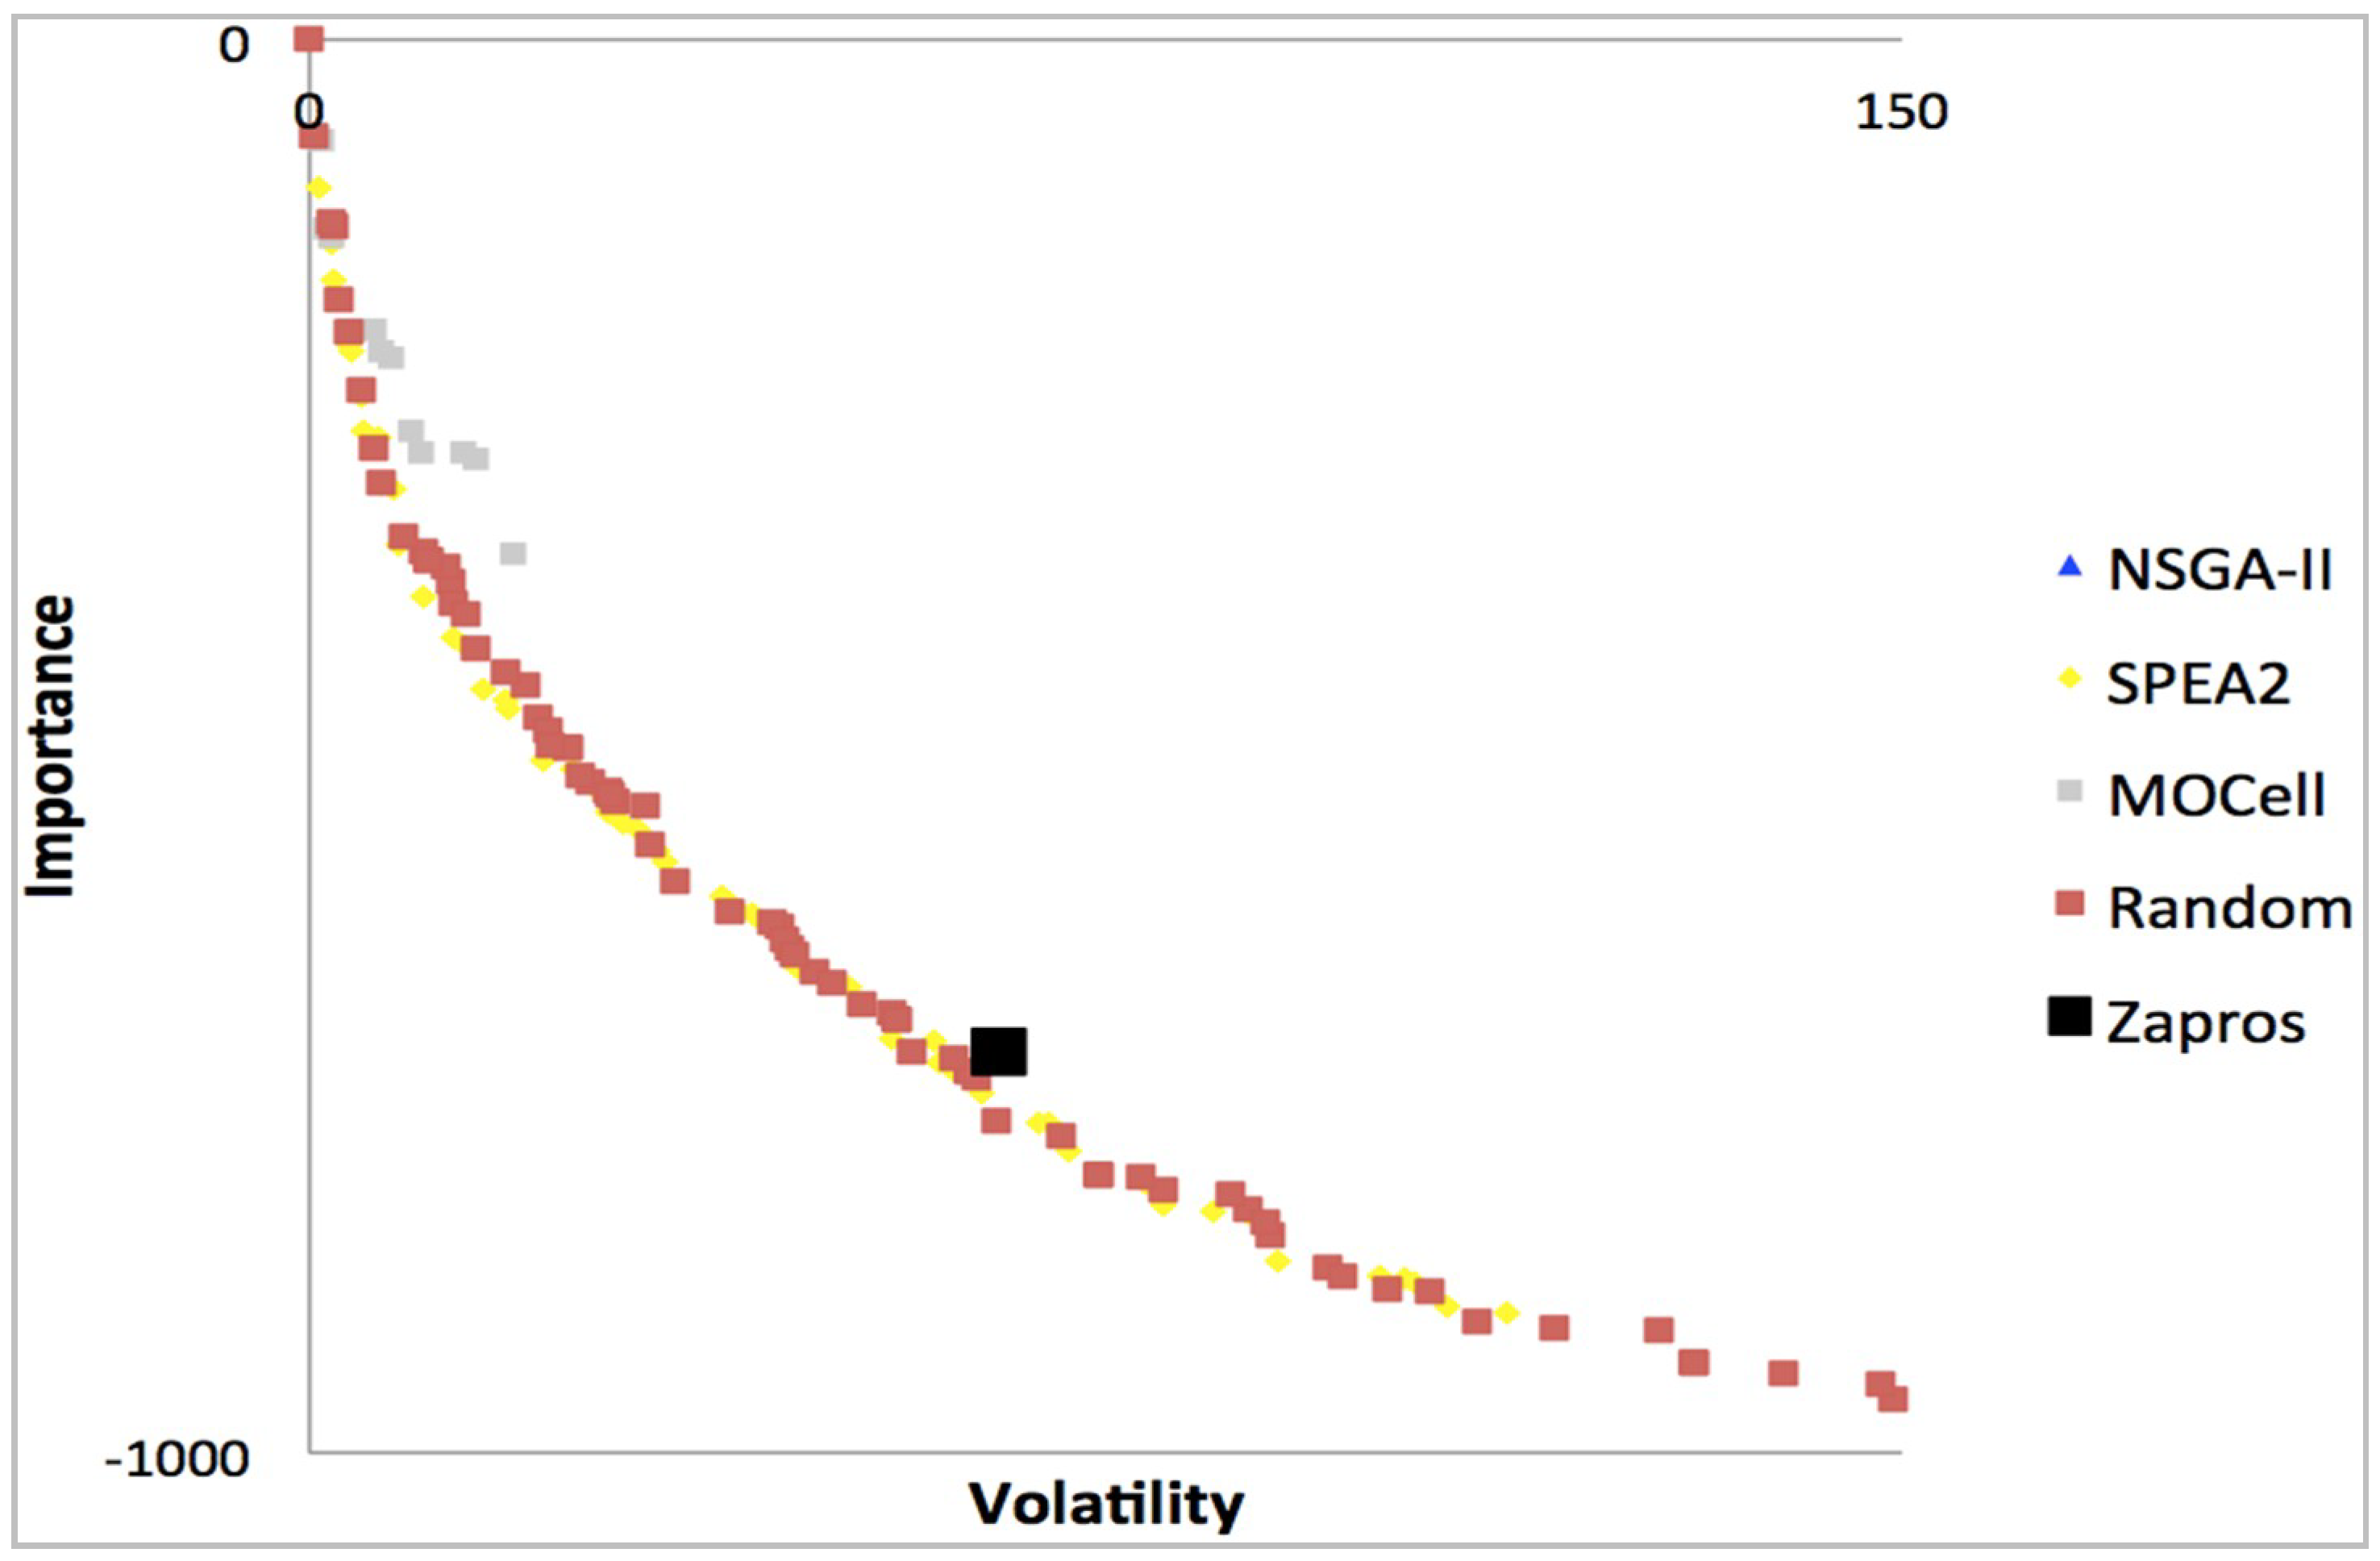
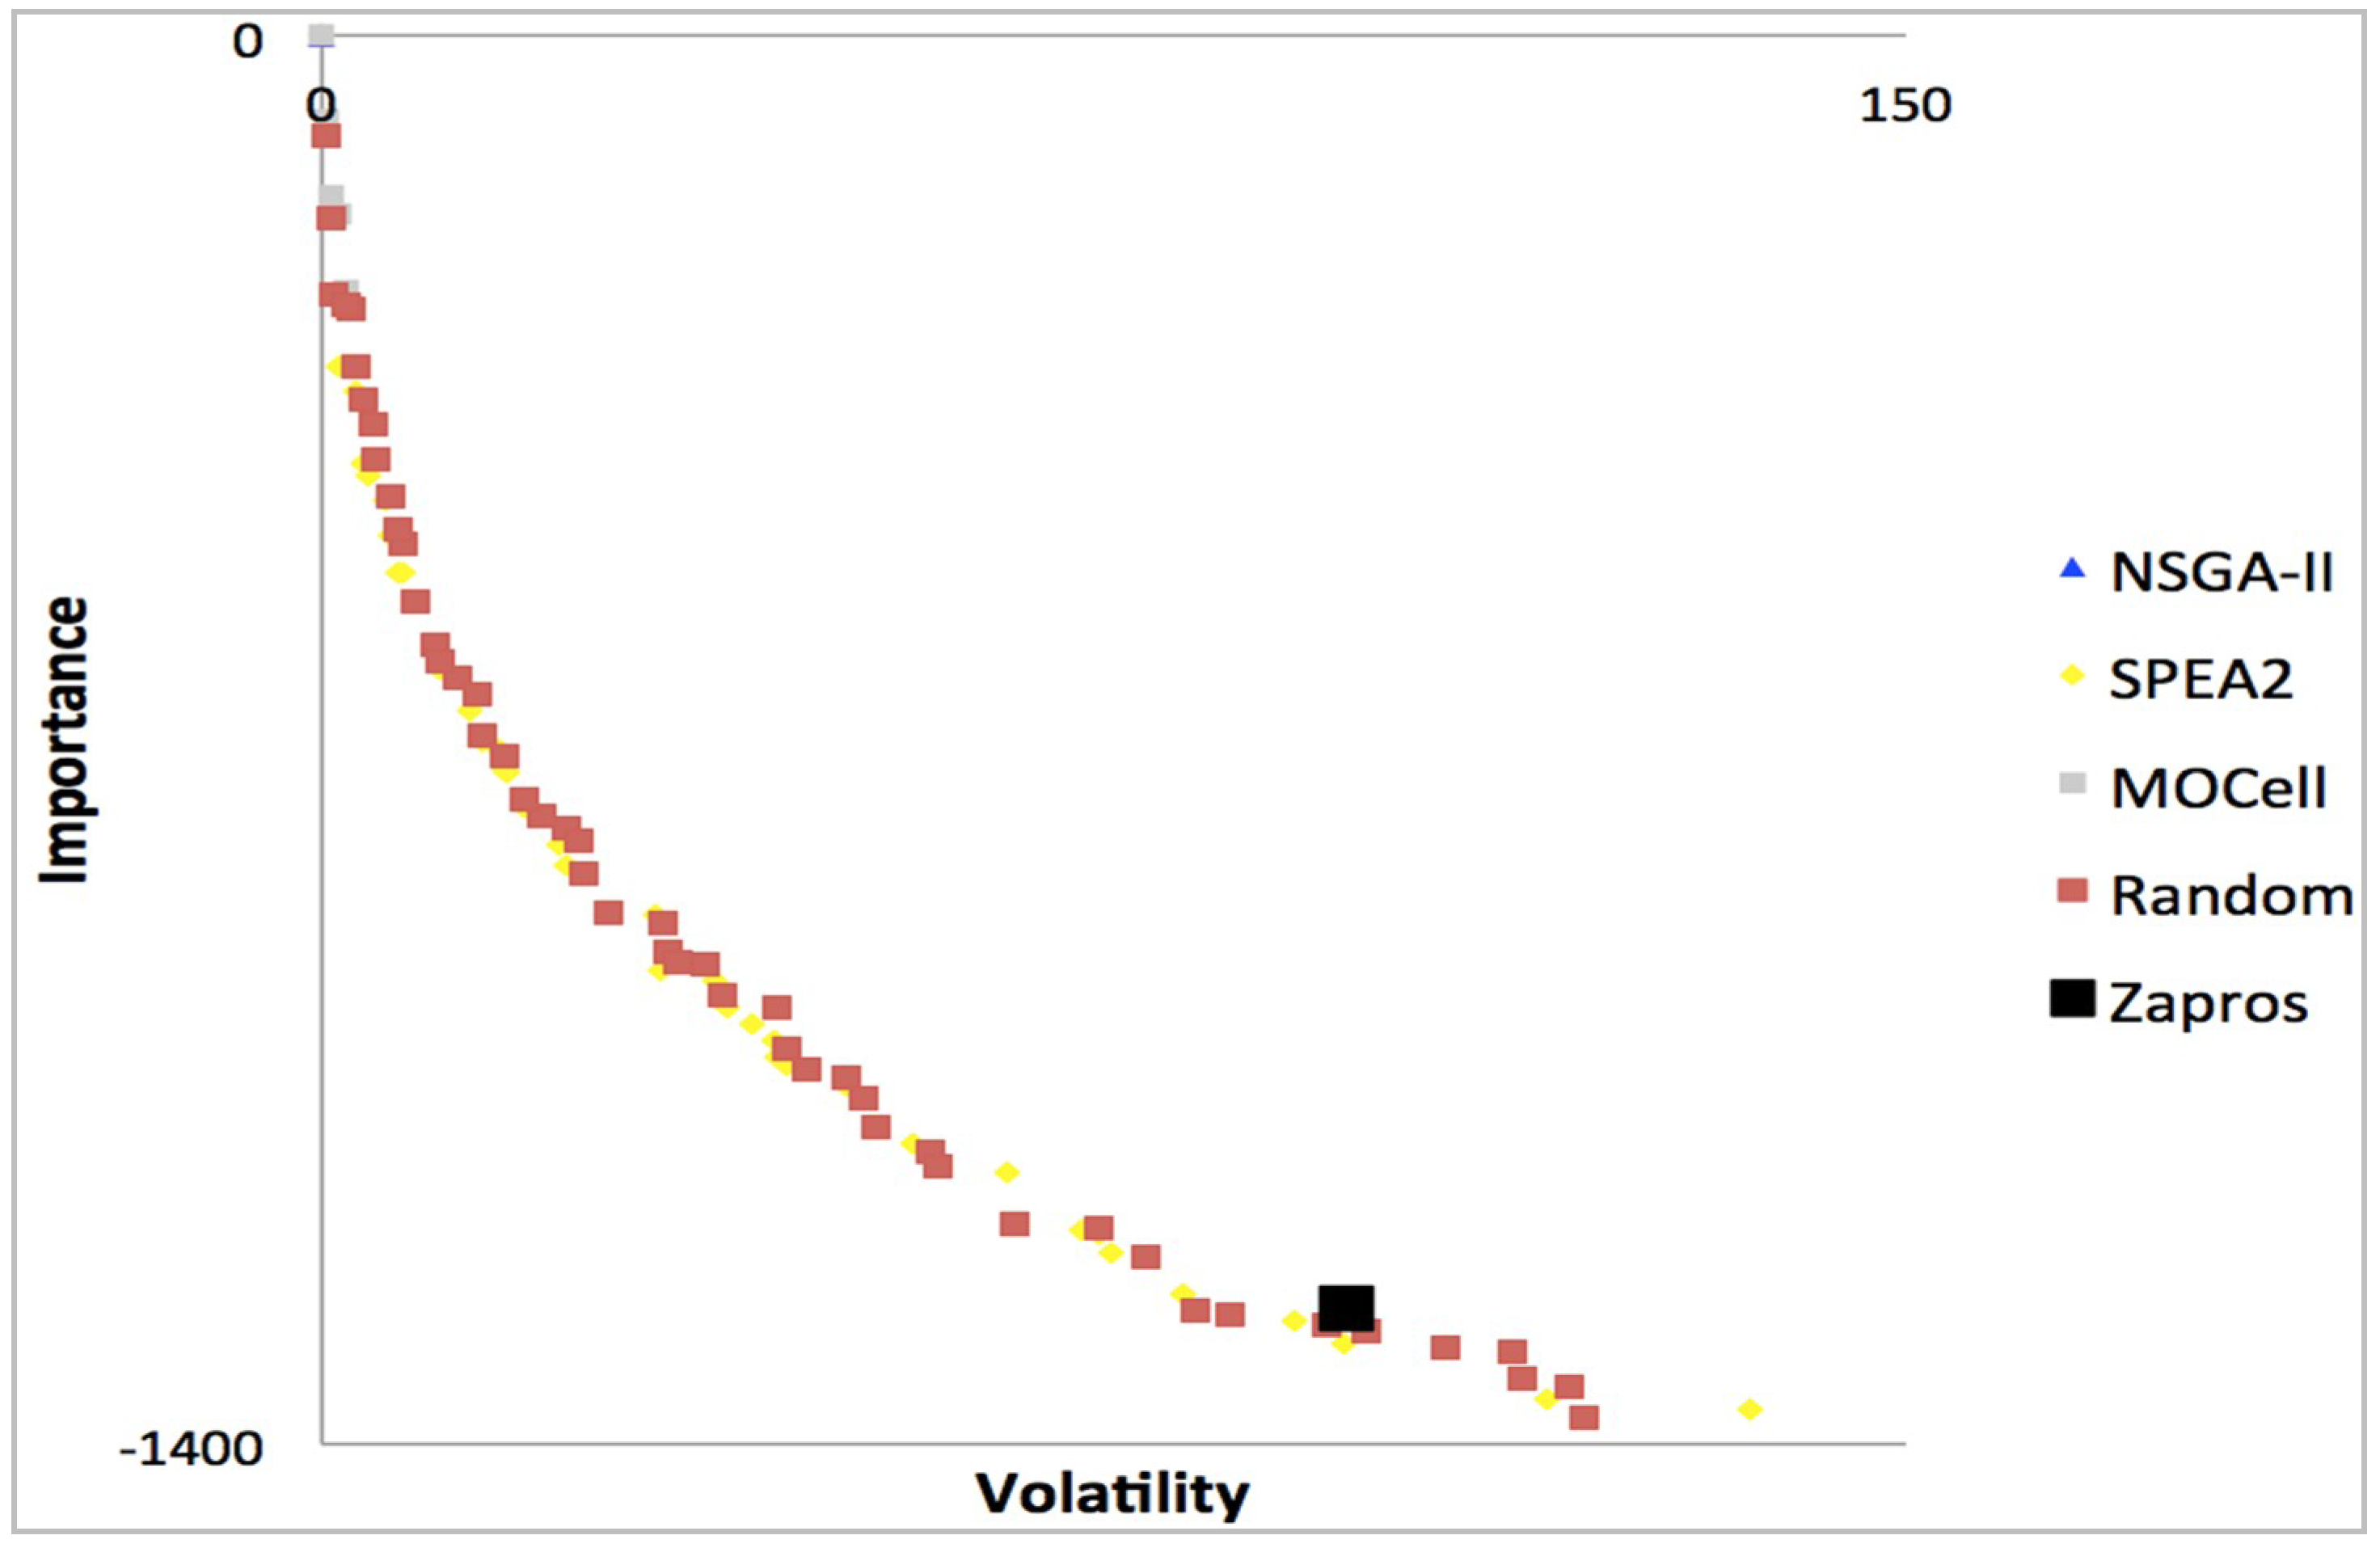
In addition, we can see in
Figure 7,
Figure 8,
Figure 9 and
Figure 10, the result of the four experiments concerning Files 1, 2, 3 and 4 (summarized in
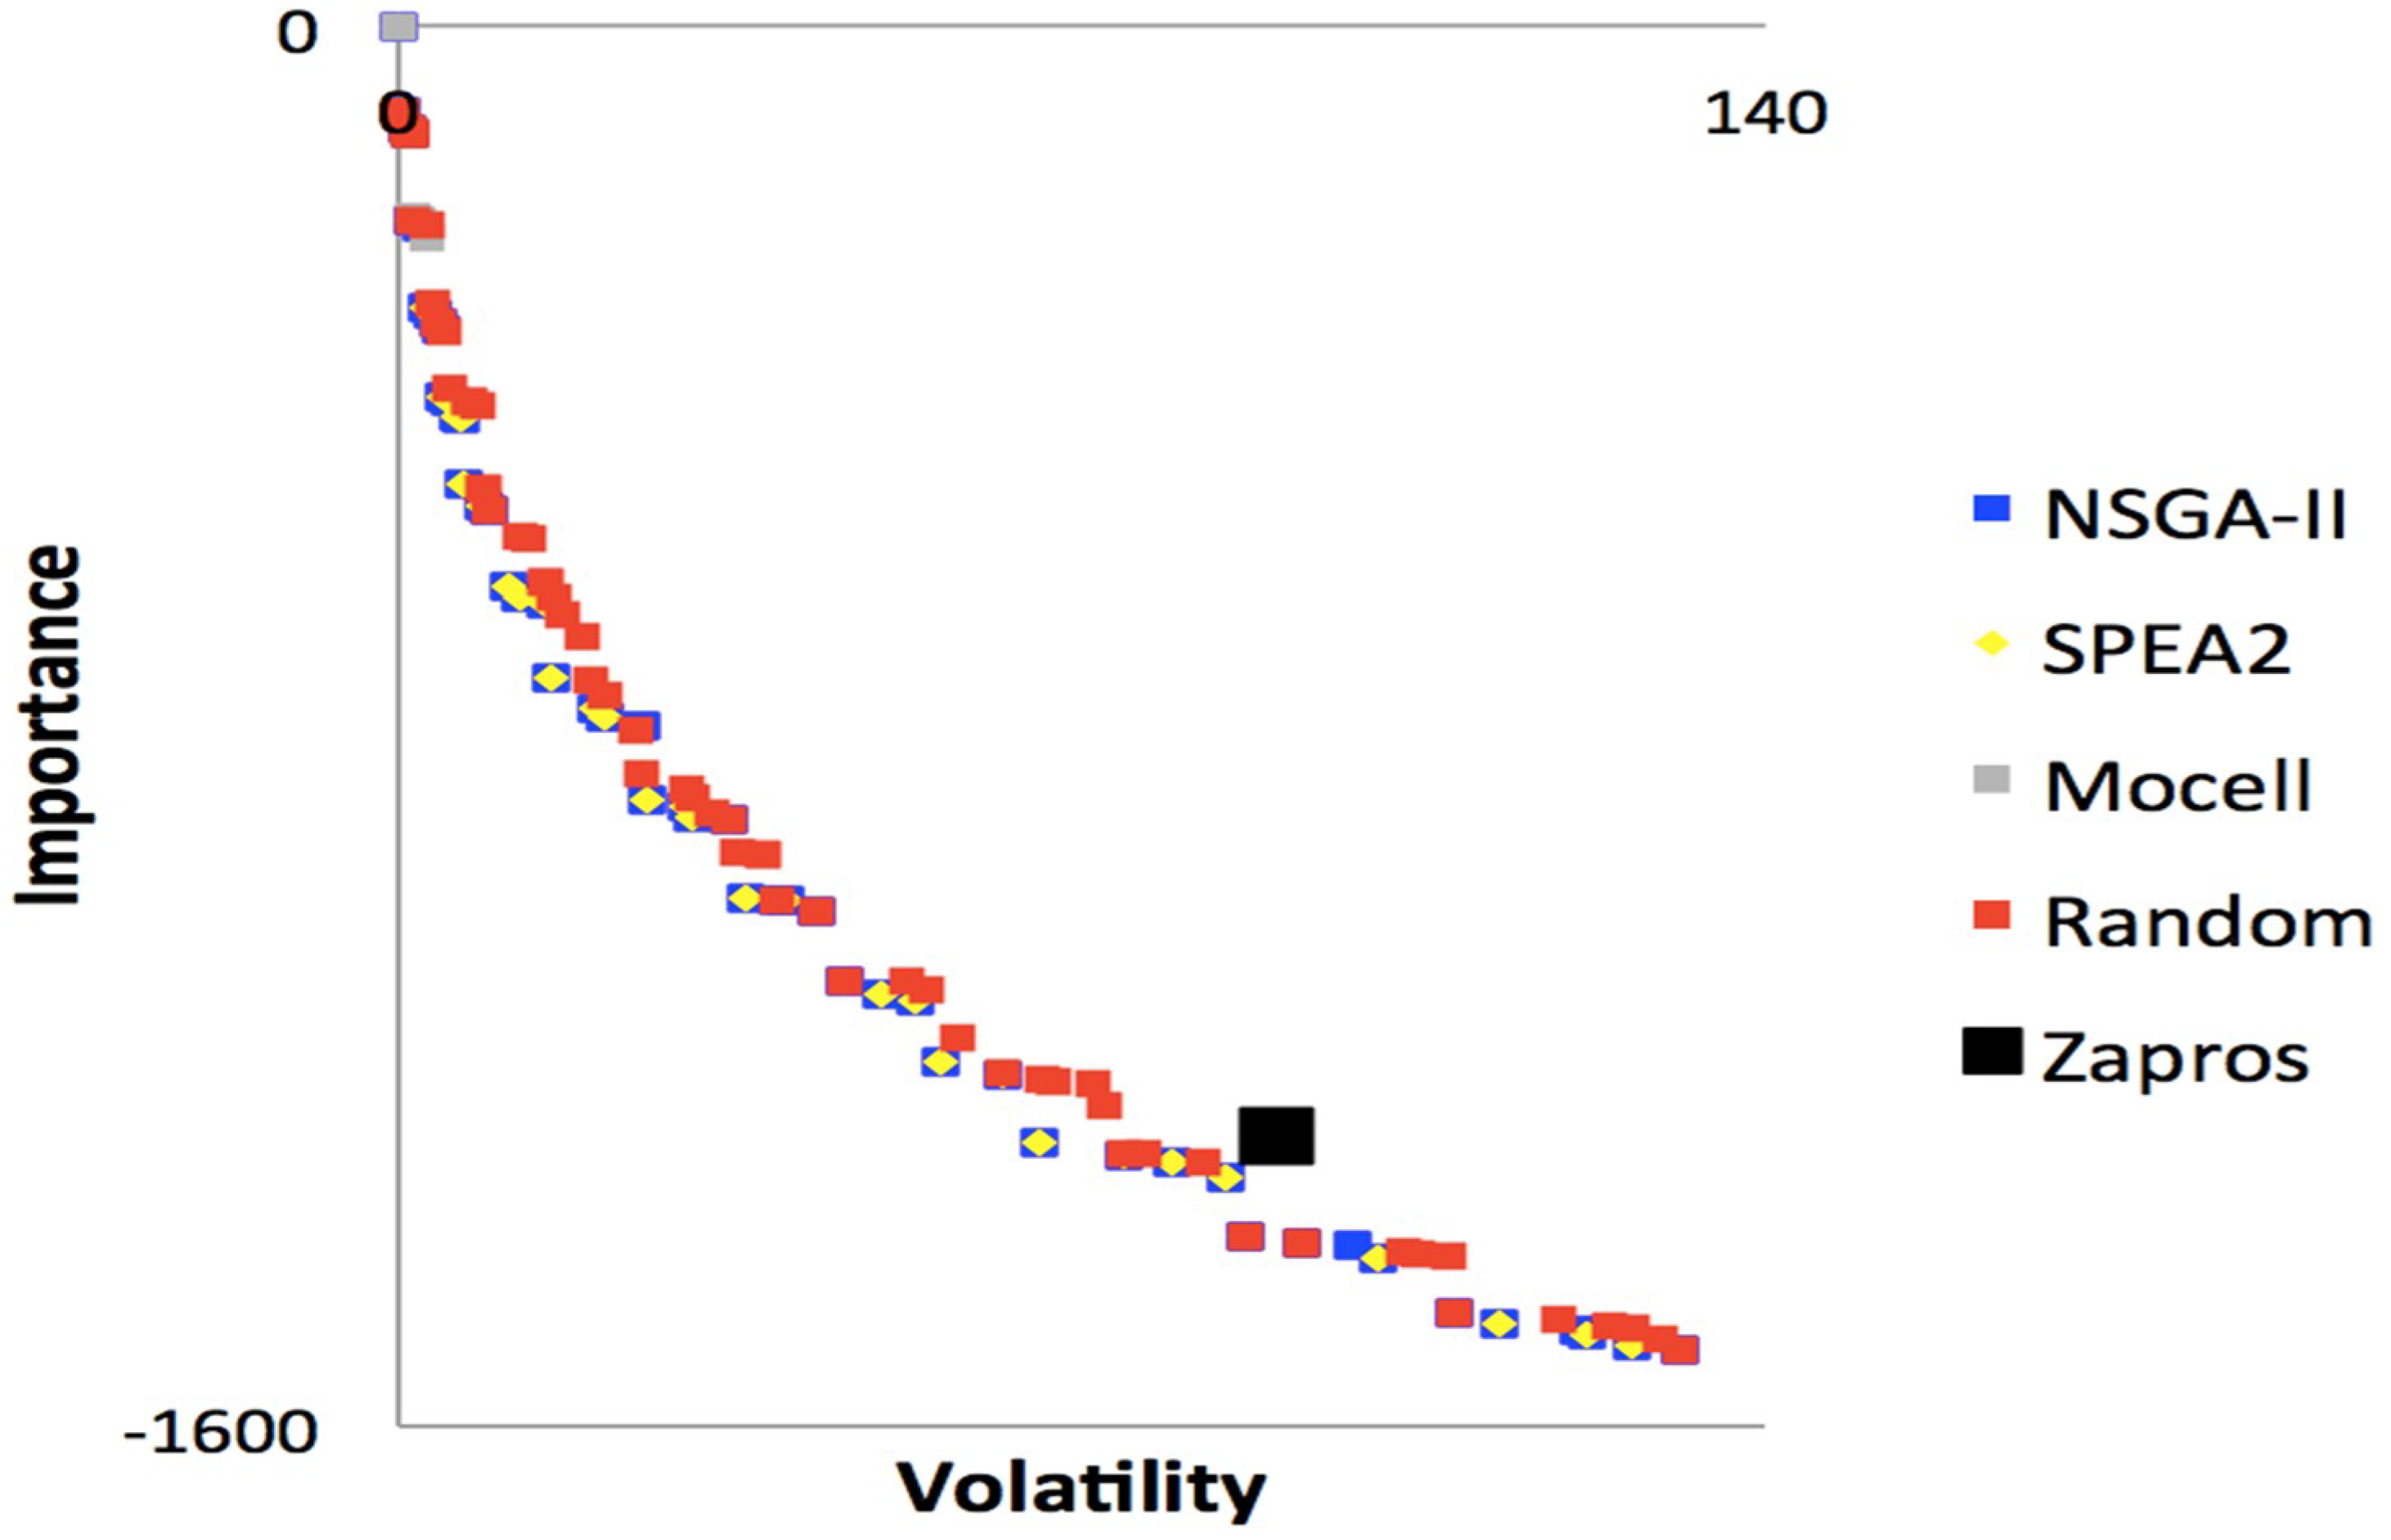
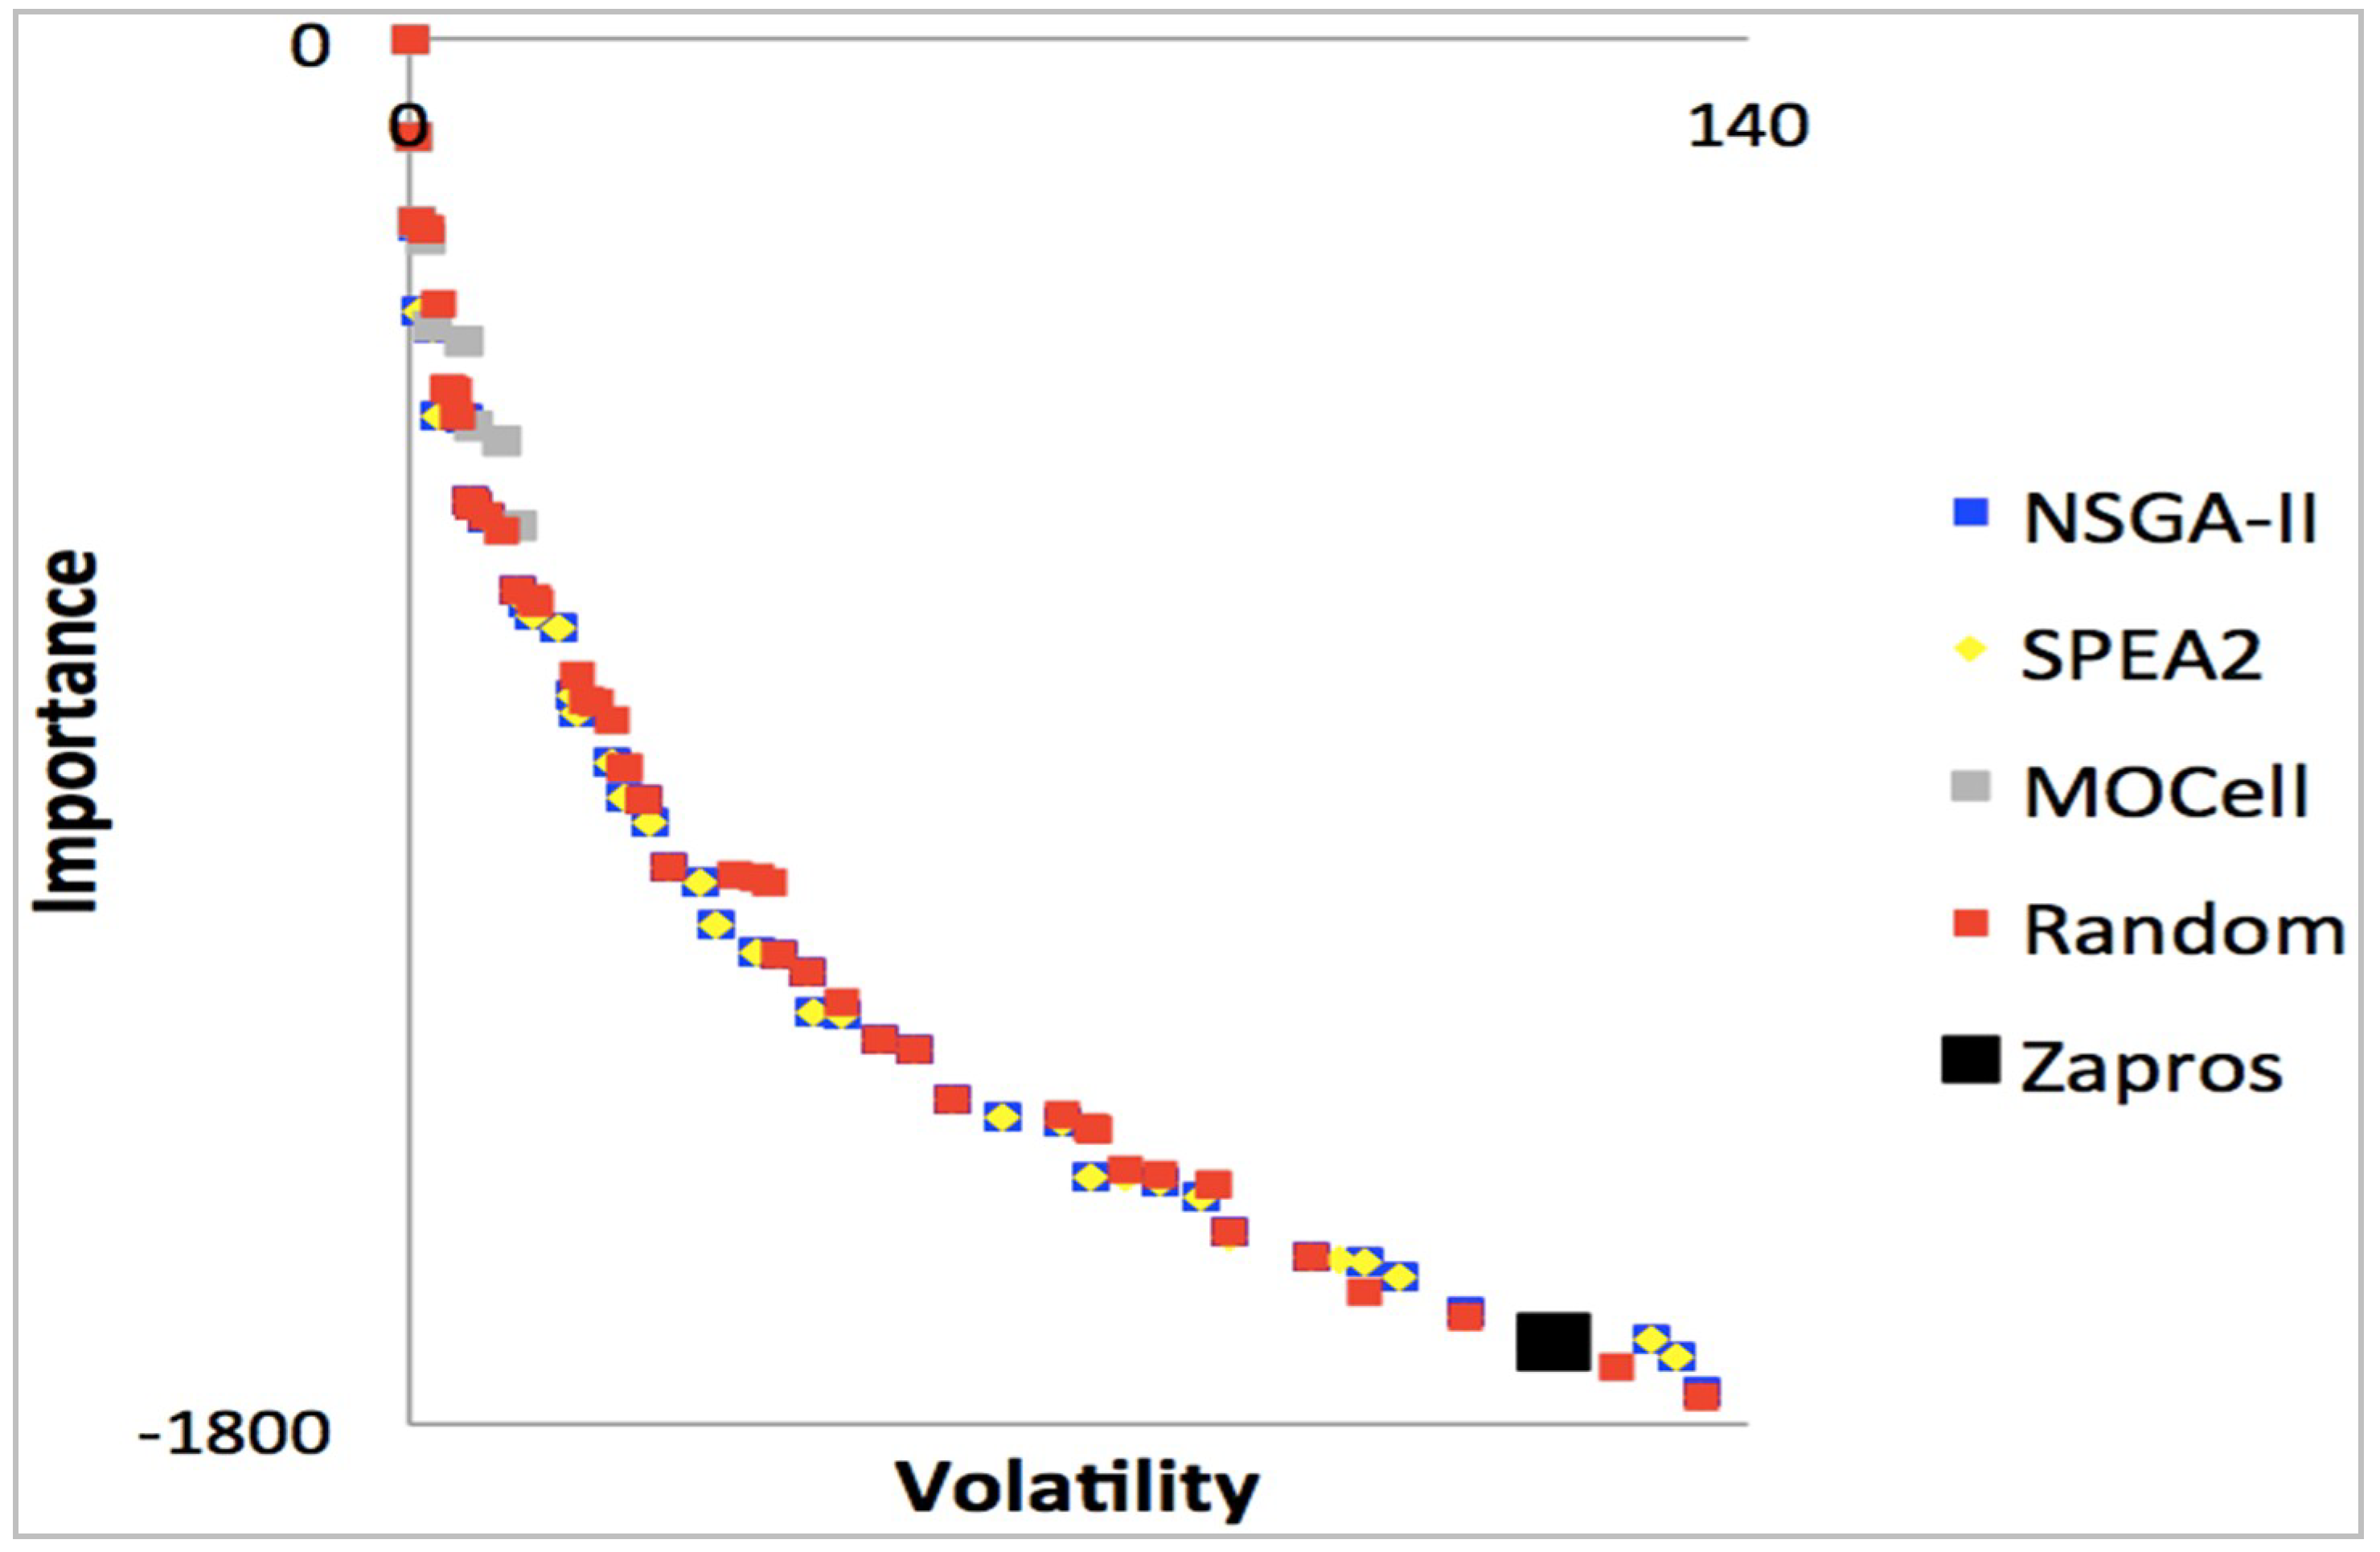
Table 1), respectively. The graphical difference between the results obtained in this and previous research is relatively small but, nonetheless, quite promising. The figures show the executions of NSGA-II, SPEA2, MOCell, ZAPROS III-
i, and the random search algorithm.
We can also observe in the figures five Pareto fronts, which are superimposed and differentiated by color according to the legend. The graphs take into account the requirements, importance criteria and the stability of the requirement. As already stated, the more stable requirements are implemented first, the better for the developer company, which will make the most of the available resource. However, an unstable (more volatile) requirement may be of significant importance to a valued customer to the developer company. This would result in a different situation.
Figure 8 and
Figure 10 represent solutions to problems with 20 requirements, 7 customers interested in this requirement and only 80% resource available to implement the software project.
Figure 8 presents 10% of technical precedence between requirements while
Figure 10 presents 20%. Similarly,
Figure 7 and
Figure 9 represent solutions to problems that have the same number of requirements and customers, but 70% of the available budget. The solution shown in
Figure 7 has 10% of technical precedence, while the solution represented by
Figure 9 has 20%.
Many methods based on metaheuristics are used to solve this type of problem, with quite quite similar solutions. The result obtained from ZAPROS III-i is represented by a single black dot in the graphs. This point represents the only solution available to the decision-maker from the ARANAÚ tool. The other algorithms do not provide a single solution, but a set of solutions.
The superiority of the results of metaheuristics relative to those pointed out by the decision-maker can be proven in experiments [
46]. However, although metaheuristics may present better results, they do not represent the expressed will of the decision-maker as a whole. There are several methodologies in SBSE that incorporate the desire of the decision-maker. A more consistent explanation about this method of selection is given in [
42]. The black dots shown in
Figure 7,
Figure 8,
Figure 9 and
Figure 10 show that these are the best choices for the decision-maker, or the best solutions to the problem given the decision-maker’s particularities and experience.
In general, when we compare these results with those of [
13,
14], we notice that there was an improvement in three of the four solutions tested by the ZAPROS III-
i method. Having more experienced decision-makers responding to the questionnaires contributed to the improvement of the VDA solution, in addition to the upgrade and improvement of the SBSE solutions.
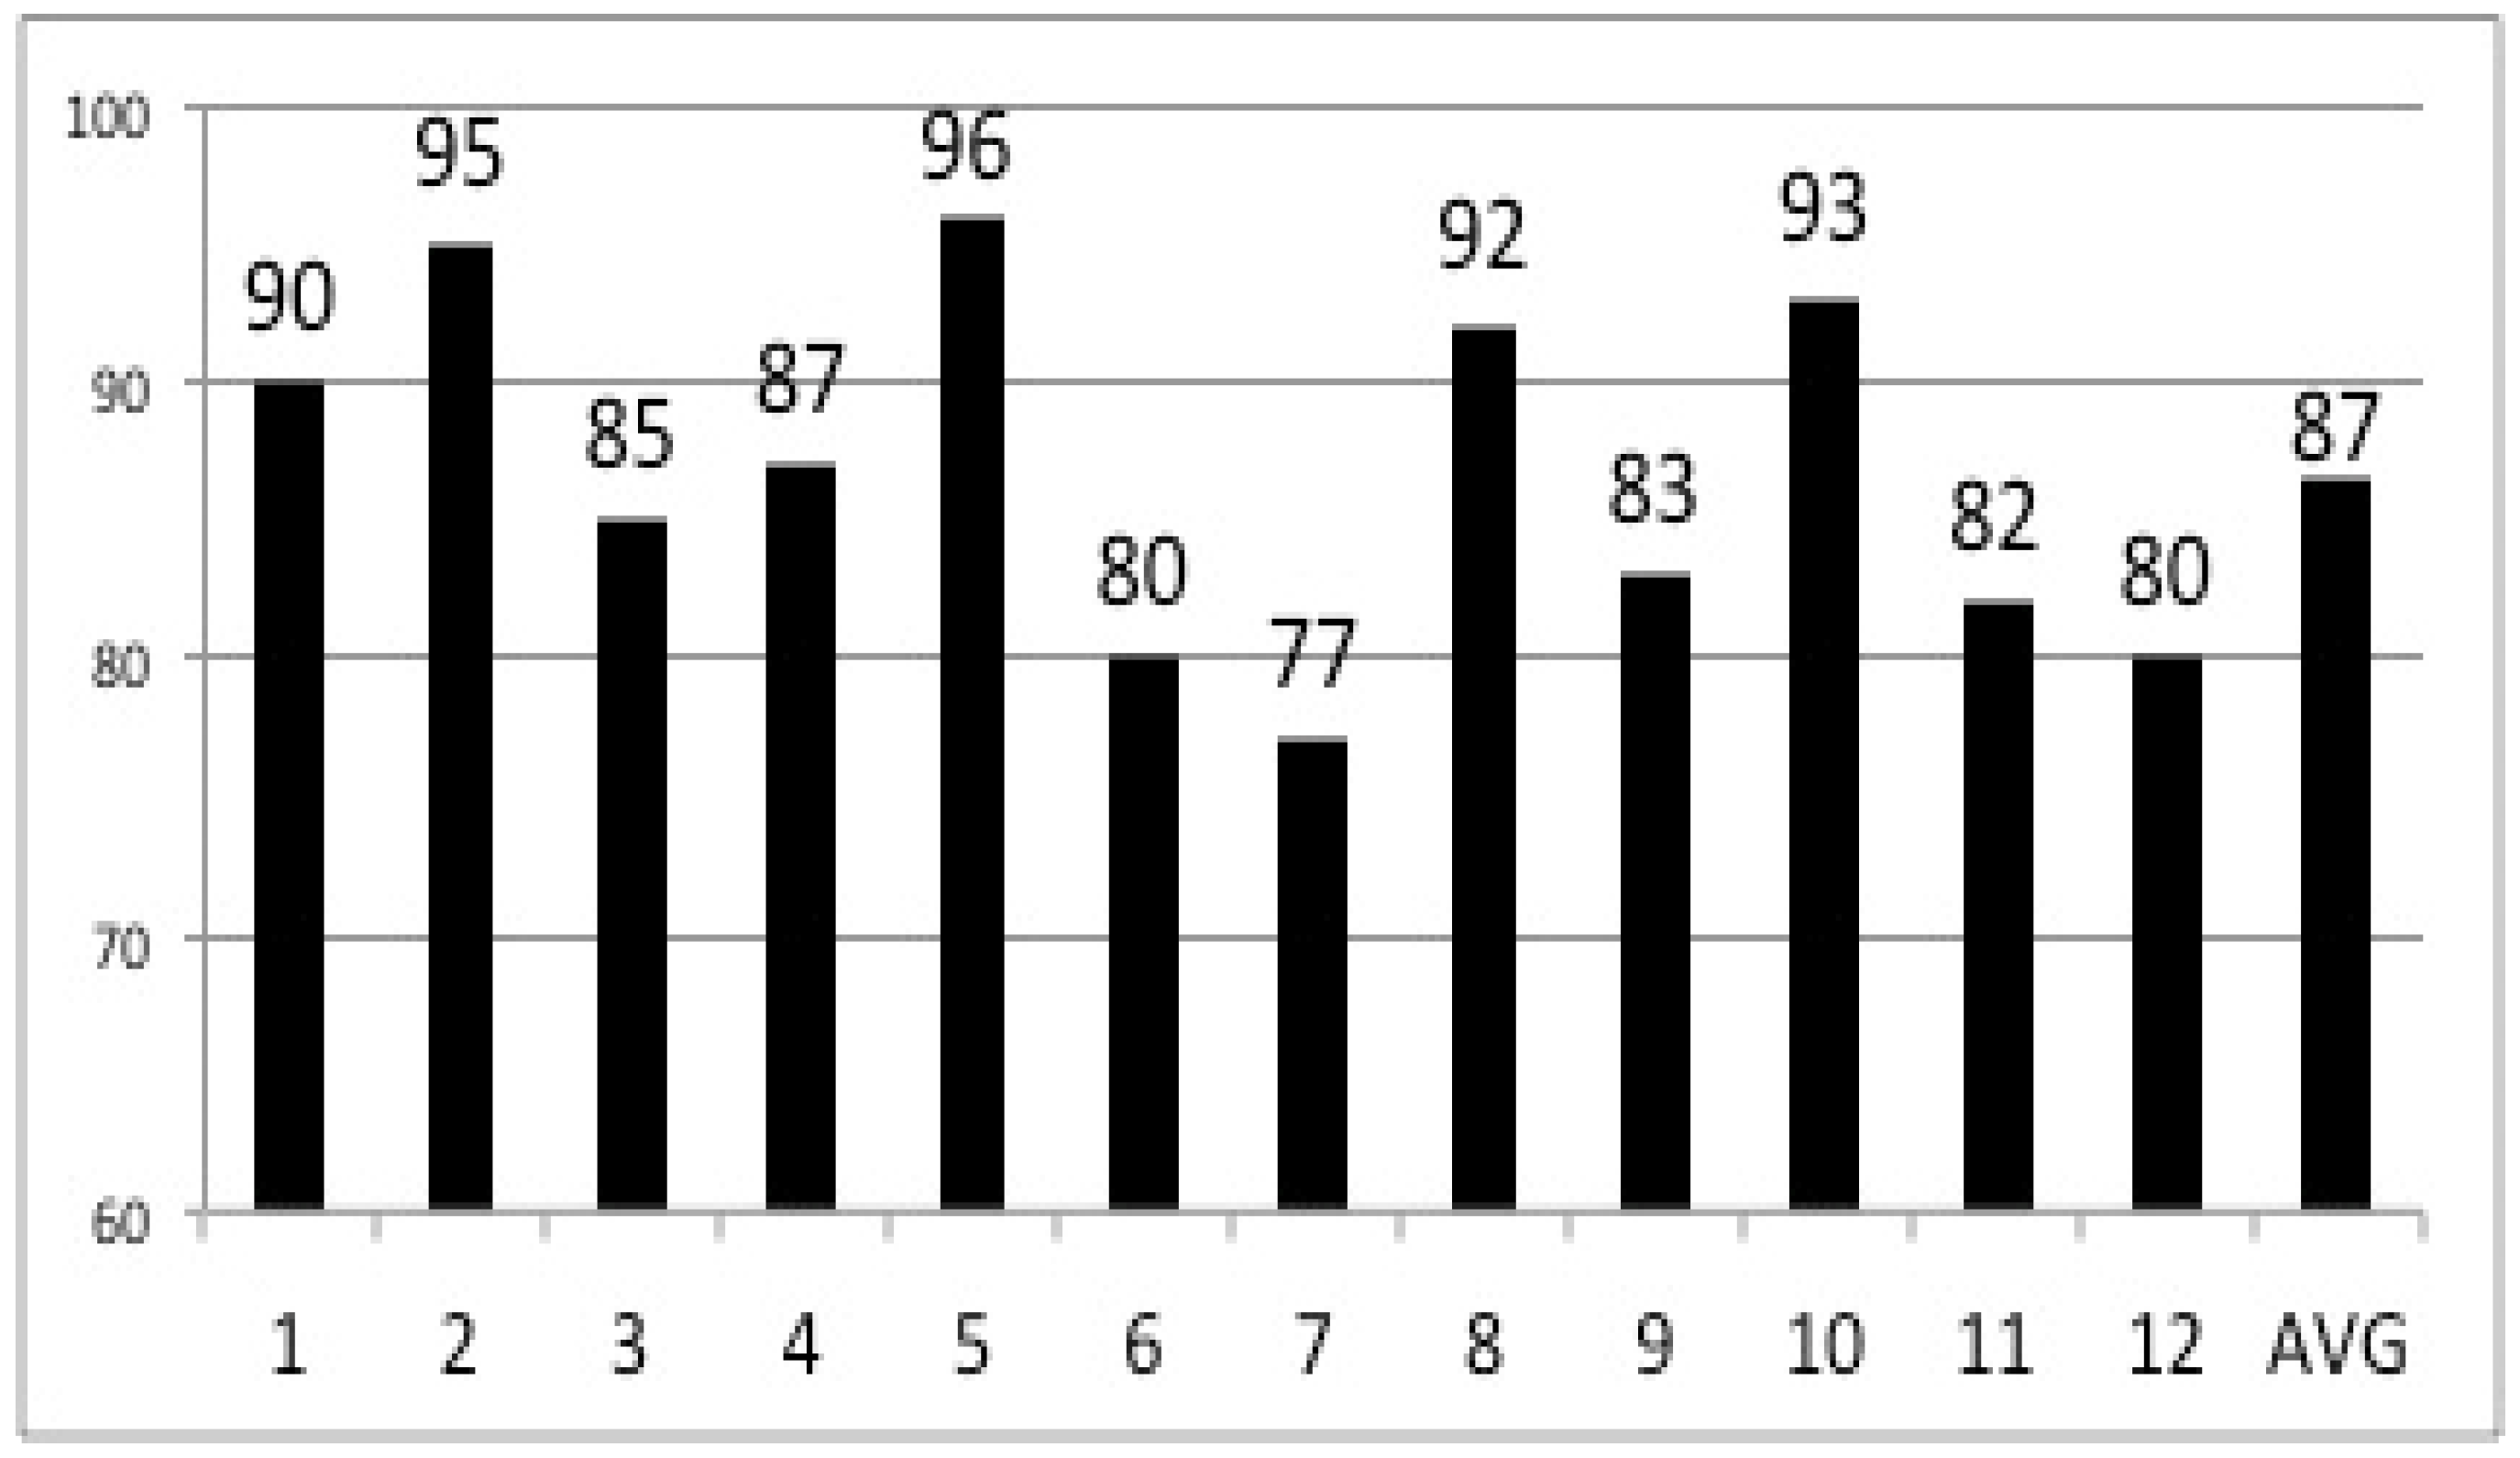
As mentioned, at the end of the execution and following the derivation of the solutions of ordered requirements, the decision-maker was asked to evaluate the solution generated by ARANAÚ, where 0 is the worst score and 100 the best score. The average overall rating was 87 points. This is considered to be satisfactory when we consider that research in this field is taking its first steps. Satisfactory human evaluations of the solutions generated by ZAPROS III-
i is of great importance for this research. The evaluation scores corresponding to each decision-maker and the average are shown in
Figure 11.
Moreover, this can significantly increase the time of enterprise production if we consider that the project manager will not need to look at the other options to decide on the best. Relying on his own criteria, informed by his professional experience, the solution presented by ZAPROS III-i is the one that best applies to the business.
9. Conclusions
Software release planning is one of the most complex activities in the process of incremental software development [
47]. This article demonstrates a new methodology for solving software release planning problems. This problem was developed for multi-objective search, where the objectives are to maximize the satisfaction of stakeholders and to minimize problems of reimplementation of volatile requirements. The efficiency of resource expenditure is increased because the more stable requirements are implemented first. By using this methodology, project managers have a range of options to increasingly customize the solutions generated and to minimize wrong decisions.
Barbosa [
13,
14] corroborates the results of this research. The earlier study used ten requirements and five clients interested in the project, and generated similar results to the present work, which used 20 software requirements and seven interested customers. This also demonstrates that the effectiveness of the method is maintained when the number of requirements, and consequently the difficulty of finding a satisfactory solution, is increased. As was noted, although small changes and updates were made to the algorithms used in this research, the data obtained were similar to those of previous studies. The order of implementation was little modified. However, we infer that these modifications would have an effect in the case of a large number of requirements of a software project (e.g., 3000). However, VDA methods are impaired when we increase the number of alternatives (i.e., requirements). This work provides a valuable contribution and incentive to continue with this research working with projects of up to 20 requirements.
Automated methods can generate excellent solutions [
48,
49]. However, it is essential for the software release planning process to consider the opinion of the decision-maker and her team, and thus provide a solution in which they can participate and contribute to the process of comparing alternatives.
A significant observation we can make is that methods structured in verbal decision analysis, which consider qualitative analysis of attributes, can generate solutions to solve the problems of allocation of software requirements that are currently resolved by SBSE. This work thus provides a precedent for new research in the field, which has been little discussed in the literature until now.
In future work we will try to solve the limitations of the VDA—for example, the limitations of criteria—to try to improve the solutions to larger problems. We may also seek other metaheuristics with improved methodologies for comparison with any new results that we obtain.

 ,
, 


