Abstract
Edge-fuzzy graphs constitute an essential modeling paradigm across a broad spectrum of domains ranging from artificial intelligence to computational neuroscience and social network analysis. Under this model, fundamental graph properties such as edge length and graph diameter become stochastic and as such they are consequently expressed in probabilistic terms. Thus, algorithms for fuzzy graph analysis must rely on non-deterministic design principles. One such principle is Random Walker, which is based on a virtual entity and selects either edges or, like in this case, vertices of a fuzzy graph to visit. This allows the estimation of global graph properties through a long sequence of local decisions, making it a viable strategy candidate for graph processing software relying on native graph databases such as Neo4j. As a concrete example, Chebyshev Walktrap, a heuristic fuzzy community discovery algorithm relying on second order statistics and on the teleportation of the Random Walker, is proposed and its performance, expressed in terms of community coherence and number of vertex visits, is compared to the previously proposed algorithms of Markov Walktrap, Fuzzy Walktrap, and Fuzzy Newman–Girvan. In order to facilitate this comparison, a metric based on the asymmetric metrics of Tversky index and Kullback–Leibler divergence is used.
1. Introduction
The Random Walker principle is the algorithmic cornerstone for building a number of heuristics for large graphs, namely for those with the fundamental property that neither their vertex nor their edge set fits in main memory. Such heuristics are efficient in terms either of computation time or memory requirements or often both. Under this principle, a virtual entity usually named the Random Walker visits the vertices. Within the scope of this article, the probabilistic strategy followed by the Random Walker to decide which vertex will visit next is of paramount importance, although, depending on the problem under study, other properties of the Random Walker may be of interest.
Virtual or ideal entities play an important role in science and engineering, mainly as a means to prove a theorem, to establish ideal performance limits, and to provide grounds for rejecting a conjecture based on a reductio ad absurdum methodology. Consider, for instance, the particle sorting demon of Maxwell [1,2] with its connections to algorithmic information theory and the steam engine of Heron of Alexandria [3]. In addition, the Random Walker principle itself has been applied to a number of graph analytics such as vertex similarity [4] and graph cuts [5] as well as to image processing [6].
A central finding of the theory of scale-free graphs, corroborated by significant evidence from a broad range of fields such as genomics, computational neuroscience, combinatorics, and social network analysis, states that they strongly tend to exhibit modularity. Namely, scale free graphs are recursively composed of vertex communities. The latter is a crucial factor for simultaneously achieving scalability, low-delay local information propagation, and structural robustness [7,8]. For instance, a large online social media group for Roman history afficionados can be composed of overlapping but to a great extent distinct specialized communities about Roman politics, law, and military, whereas the latter may be further subdivided into smaller communities regarding weaponry, tactics, legion standards, key battles, distinguished commanders, and the Praetorian guard.
Even though knowledge about communities offers a deep insight to graph structure, locating them is intractable. Consequently, numerous community discovery algorithms have been developed. Two of the most prominent ones are the Newman–Girvan [8] and the Walktrap [9] algorithms. The former is deterministic and is based on local edge density, while the latter is heuristic and relies on an edge crossing Random Walker. In [10], variants of both algorithms for edge-fuzzy graphs were proposed. Furthermore, in [11], a random walk approach for community detection in complex networks is introduced.
This article extends the work of [12]. Initially, the implementation of the Markov Walktrap algorithm, which is an extended version of Fuzzy Walktrap, was firstly proposed in [10]. Fuzzy Walktrap in turn has been based on deterministic Walktrap algorithm [9]. Furthermore, a method for algorithmically assessing the performance of Markov Walktrap relative to Fuzzy Walktrap and Fuzzy Newman–Girvan, being another fuzzy community detection technique [10], are thoroughly presented. Finally, one very important aspect to be mentioned is the expression of Markov Walktrap in Cypher, which composes the main query language for Neo4j [13].
The primary contribution of this article is the implementation over Neo4j of Chebyshev Walktrap, a community discovery algorithm designed for edge-fuzzy graphs, a class of fuzzy graphs [14] used among others in [10], which is based on the Random Walker algorithmic principle. Additionally, Chebyshev Walktrap relies on the competitive factors of second order statistics though the Chebyshev inequality and on an optional relocation capability in order to bound unnecessarily costly walks and, thus, remaining inside a community and being trapped for too long within the boundaries of a community, respectively. The relocation aspect was also backported to the Markov Walktrap algorithm first proposed in [15]. The effect of relocation on the community coherence was evaluated based on the asymmetric Tversky index using the Fuzzy Newman–Girvan algorithm from [15] as baseline, while its effect on the output distribution was assessed with the asymmetric Kullback–Leibler divergence.
The remainder of this article is structured as follows. Scientific literature regarding community discovery is reviewed in Section 2. The fuzzy graph model is outlined in Section 3 while Markov Walktrap and Fuzzy Walktrap algorithms are presented in Section 4. Experimental results are discussed in Section 5. Finally, the main findings of this paper as well as future research directions are discussed in Section 6. Table 1 summarizes the symbols used in this paper.

Table 1.
Paper notation.
2. Related Work
From a system perspective, graph analytics play a crucial role in data mining systems such as Google Pregel or in massive machine learning frameworks such as GraphLab (https://turi.com/). Moreover, recently, there is strong interest for scalable, production grade graph databases [13,16] such as BrightStar (https://brightstardb.com), Neo4j (www.neo4j.com), Titan (https://github.com/thinkaurelius/titan), Sparksee (www.sparsity-technologies.com) and GraphDB (www.ontotext.com).
Traditionally, from an algorithmic viewpoint, analytics include structural [17,18] and spectral [19,20] partitioning, where a graph is split according to some functional constraints such as flow or edge density. Efficient information diffusion in large graphs is also of interest [21,22], especially for online political campaigns and digital marketing. The Random Walker principle has been also applied to two other important metrics, namely vertex similarity [4] and heuristic minimum cuts [5]. Both metrics can also be treated deterministically, especially in the context of social network analysis [23,24]. Community structure discovery provides insight to the inner workings of a particular graph [7,8,17], while metrics such as those in [25] control the discovery process quality. Persistent graphs can be instrumental in designing rollback capabilities in graph databases [26].
Among the numerous applications of graphs or linked data, one can find Web searching and ranking [27] with established algorithms such as PageRank [28] and HITS [29]. Bibliometric and scientometric data analysis [30] can boost collaboration between researchers, while image segmentation [6] is central to computer vision and robotics. Social network analysis has greatly benefited from structural [31] or functional [32,33] community detection algorithms. Additionally, influence and perceived social status in online social media have been tied to the participation in communities [34]. Message diffusion within a social graph is studied [34,35], while [36,37,38] deal with emotional modeling with respect to user influence [36]. Finally, random walkers have served as models for the propagation of computer viruses both in single systems and in networks, including LANs and the Internet [39,40]. Within this context, the strategy or the mix of strategies followed by the random walker is of paramount importance as it affects the entity and number of resources susceptible to infection.
First and second order statistics are used across a number of fields. In [41], a channel estimation methodology based on first order statistics is proposed. Methods for blind source separation using second order statistics include [42,43]. A comprehensive approach about the applications of higher order methods is given in [44] signal processing and in [45] for biomedical engineering. In [46], a third order method was presented for adaptively scheduling biosignal processing applications at the operating system level. Independent Component Analysis (ICA), a powerful signal processing technique, is based on higher order spectra [47]. Among the multitude of ICA applications is source separation in EEG waveforms [48].
3. Edge-Fuzzy Graphs
3.1. Definitions
Within the scope of this paper, the edge-fuzzy graphs are probabilistic and combinatorial hybrids comprised of a fixed set of vertices V and a fuzzy set of edges . Formally,
Definition 1.
A homogeneous edge-fuzzy graph is the ordered triplet
where is the set of vertices, is the fuzzy set of edges, and h is the edge membership function , which quantifies the degree of participation of each to G [10]. Moreover:
- the vertex set V is fixed, namely they belong to G with probability one,
- the distribution h is the same for each edge,
- the existence probability of is drawn independently for each edge.
A subtle point is that h does not affect the structural properties of the graph in the sense that no edges are added or deleted, except when for a particular holds that . If h is continuous, the probability of this ocurring is zero. However, if h is discrete, then depending on h a potentially non-negligible portion of the edges may be deleted. In this article, h was chosen so that only at most an exponentially small proportion of the edges would be assigned to a zero weight. Consequently, the underlying graph preserved its original structure along with any associated connectivity patterns. Otherwise, if a considerable fraction of edges were to be deleted, then the resulting graph would behave more like an Erdös-Rényi graph. The latter are known to be easily constructed by randomly sampling a graph space or, equivalently, the edges of but their properties deviate in a significant way from those of real world, large graphs.
Observe that there is no fuzziness whatsoever regarding vertices as by definition they always exist with probability one. In scientific literature, the existence of fuzzy graph classes is prominent. Vertices are fuzzy as well as their fuzziness interacts with that of the edges, mostly by long product chains. Such graphs are beyond the scope of this article.
Definition 2.
Under the fuzzy graph model of Defintion 1, the cost of traversing is
which expresses the intuitive requirement that edges which are less likely to belong to the graph are also harder to cross.
Depending on the application, may well be connected through another non-linear transform to h as long as edges with high are easy to cross and edges with low h are difficult to cross such as
Definition 3.
The cost of a fuzzy path is the sum of the cost of its individual edges
where is the harmonic mean of defined as
By construction is bounded as follows
Whether the above bounds are loose depends on the variability of the actual values . That is, if the latter are drawn from a distribution which favors extreme values, will tend to be close to these bounds. It should also be noted that the variance is strongly dependent on that of . Moreover, is prone to outliers, which might lead to an unrealistically high average fuzzy path length. This can be remedied by taking into account the variance of the fuzzy path length. Finally, a low tends to contain almost exclusively low edge costs or, equivalently, edges with high probability of belonging to the graph, an argument which agrees with the weak law of large numbers. In turn, this suggests the intuitive corollary that low cost paths are comprised almost exclusively of edges that are less likely to be fuzzy. This corollary can be used in order to design efficient hybrid probabilistic and combinatorial algorithms based on dynamic programming for finding and enumerating low cost paths akin to the way a similar observation has led to the development of shortest paths relying on dynamic programming in deterministic graphs.
From a probabilistic viewpoint, the sum is interesting by itself as a finite but possibly large sum of inverse random variables. Notice that the central limit theorem may not be applied in such a setting since the variance of the might be infinite. If this is not the case, different bounds can be computed depending on the distribution of such as the abovementioned central limit theorem, a Poisson bound, a power law bound, or finally approximations based on Markov or Chebyshev inequalities, the Chernoff bound, or on the Gnedenko extreme value theorem. Notice that the effect of a single edge which is exceedingly difficult to cross can be instrumental in shaping graph communities.
The numerical properties of the above sum are also of interest. As values of possibly uneven orders of magnitude may be added, catastrophic cancellation may occur resulting in the loss of meaningful information. This might happen if the summation is executed in an order left to the implementation. On the other hand, the summation order dictated by the Priest algorithm [49] results in the least possible loss of significant decimal digits by adding only numbers of comparable magnitude. Another option would be to substitute the harmonic mean with its thresholded counterpart
For other uses of the thresholded harmonic and geometric means, see [50], while, for the effect of finite precision arithmetic to long biosignals, see [51].
An alternative for long paths would be to substitute, under certain conditions, the finite sum with an appropriate integral. Assuming with no loss of generality that and , then
where is an optional correction factor. A finer approach requiring more probabilistic information about the longer paths of a given graph would be to partition such a path so that
Selecting n and forming the sets , , and is not a trivial task. Instead, choosing such an approach might be a viable solution only for certain combinations of h and . Techniques for estimating the variability as well as the cardinality of large sets such as [52] can be useful while pursuing this approach.
It should be emphasized that the class of fuzzy graphs of Definition 1 can be well considered as a typical example of higher order data. This is attributed to the inherently distributed way information is stored in a graph, in this particular case as edge existence probabilities. In order for meaningful information regarding path costs to be mined, a non-negligible fraction of edges must be crossed and, thus, the interplay of a number of edges must be considered.
3.2. Reciprocal Random Variables
Because of the Definitions 2 and 3 for and , respectively, the properties of an inverse random variable gain more interest. The following definition is straightforward.
Definition 4.
The inverse distribution of a mass distribution function of a random variable X is defined as the mass distribution function of [53].
Property 1.
In the continuous case, the distributions of X and are linked as
Proof.
The cumulative distribution of is defined as
By differentiating the last relationship, the stated result follows. ☐
For instance, if X is the continuous uniform random variable in , where , then the distribution of is
Despite its simplicity, in certain scenaria, relationship (10) cannot be used. For instance, only the first moments of X may be known or might be a legitimate value, in which case there is a singularity in the inversion of . Instead, bounds are sought for the first moments of , which makes more sense from a programming viewpoint in the case of large graphs.
Jensen inequality provides a straightforward way to bound the expected value by using the expected value of the non-zero random variable X.
Theorem 1.
(Jensen inequality) For any random variable and any convex function provided that both the domains of X and are subsets of the domain of
Corollary 1.
The mean value of the strictly positive random variable has a lower bound of
Property 2.
Function is convex when .
Proof.
Notice that the second derivative is positive when x is positive. An alternative way to prove this claim is to apply the standard convexity definition. For every , , and
☐
In order to derive realistic upper bounds for the path lengths of a given fuzzy graph, certain probabilistic inequalities can be employed. The first is Markov inequality, which establishes a first order bound for the probability of X taking very large values by stating that
Theorem 2.
(Markov inequality) The probability of a strictly positive random variable X exceeding is bounded by
Second order bounds can be derived by the Chebyshev inequality. The latter provides tighter bounds while lifting the positivity assumption.
Theorem 3.
(Chebyshev inequality) The probability of an arbitrary random variable X exceeding its expected value by a certain fraction of its standard deviation as
The Chebyshev inequality is generic enough to be applied in a number of scenaria, including those in the present article. Still, it should be noted that other techniques may provide sharper bounds in certain cases. For instance, when X is normally distributed, then specialized methods exist for evaluating the integral under its tail.
Estimating the variance of a transformed random variable can be done through the delta method.
Theorem 4.
(Delta method) Let X be a random variable whose expected value and variance are known. For an analytic , the variance of can be estimated as
Proof.
The first order approximation of the Taylor expansion of around is
Taking the variance of both sides along with the identities,
yields the stated result. ☐
Corollary 2.
For , the delta method yields
The Markov and Chebyshev are but two of the probabilistic inequalities collectively known as concentration inequalities, the latter bound the deviation of a random variable or a sequence of random variables from a known value. Other such inequalities include the Talagrand, the Efron–Stein, and the Dvoretzky–Kiefer–Wolfowitz inequalities.
4. Family of Walktrap Heuristics
4.1. Deterministic Walktrap
The original Walktrap algorithm [9] simulates an edge crossing random walker in order to estimate the stationary distribution of a homogeneous Markov chain. The walker can commence from any vertex and cross edges by randomly selecting destination vertices, systematically moving to vertices with high edge density as vertices are selected with probability proportional to their degree. Since vertices can be visited an arbitrary number of times, unlike algorithms like BFS and DFS, eventually some patterns in the vertex visiting sequence will emerge. As a community is from a structural perspective, essentially a locally dense graph segment, the walker is more likely to move along vertices belonging to the same community for a large time interval before moving to another community. Thus, analysis of the vertex sequence generated by the random walker can reveal the underlying graph community structure. The Walktrap algorithm is outlined in Algorithm 1.
| Algorithm 1: Deterministic Walktrap |
| Require: graph , termination criterion Ensure: vertex pair sequence is generated
|
The degree of any neighboring vertex can be determined by the graph adjacency matrix defined as
Specifically, the degree of is the sum of the k-th column of . The probability that from vertex a neighbor is selected at the next step is directly proportional to
In contrast to many graph algorithms, each vertex may be visited more than once. In fact, vertices must be visited many times in order for meaningful patterns to emerge regarding community structure. Typically, for deterministic graphs, a constant number of visits per vertex may suffice resulting in a total of visits, though techniques exploiting the self-similarity nature of large, scale free graphs may yield somewhat lower bounds of , . For fuzzy graphs, the linear bound is as of yet unknown as to whether it can be improved.
In a distributed setting such as Hadoop, the Deterministic Walktrap can be scaled up since graph segments can be distributed to the nodes. The map part will be the parallel random walkers crossing edges. If such a walker must cross a segment, it can either bounce back or be transferred to the appropriate node. The reduce part will be the frequency count of a large number of vertex pairs.
Once the random walker has finished crossing the graph, the communities are discovered by means of hierarchical clustering using the frequency of pairs as weights. It should be noted that other methods such as Hidden Markov Models and text mining techniques dealing with missing values [54] may be used for discerning community patterns in the sequence .
4.2. Fuzzy Walktrap
The Fuzzy Walktrap algorithm has been proposed and analyzed in [10]. Similarly to Algorithm 2, given a vertex , each neighbor is a candidate for being visited by the Random Walker with probability proportional to its probability of belonging to the fuzzy graph, namely proportional to
where the fuzzy adjacency matrix defined as
Fuzzy Walktrap is outlined in Algorithm 2.
| Algorithm 2: Fuzzy Walktrap |
| Require: fuzzy graph , termination criterion Ensure: vertex pair sequence is generated
|
4.3. Markov Walktrap and Chebyshev Walktrap
Both the Markov Walktrap, proposed in [10], and Chebyshev Walktrap, introduced in this article, algorithms improve Fuzzy Walktrap in two ways. The first is that during the walking phase the Random Walker has two optional safeguards against being confined inside a community for too long. Both of these safeguards are common for Markov Walktrap and Chebyshev Walktrap. The second improvement is that, during the clustering phase, two communities may not merge if the path lengths within the resulting community exceed a certain threshold. The latter is based on first order statistics for the Markov Walktrap and on second order statistics for the Chebyshev Walktrap.
Regarding the control of community merge, for community , the mean path cost is the sum of the individual edge costs
and, therefore, is also a random variable. By linearity of expectation,
Moreover, as are independent,
In the general case, the distribution of is unknown, for specific choices of h, it can be computed or estimated. Alternatively, since is a sum of random variables, its distribution may be known for certain special cases. For instance, the sum of independent Poisson random variable is another Poisson random variable. In addition, the sum of independent binomial random variables is also a binomial random variable. Finally, the sum of a large number of independent random variables with finite variance is a normal random variable according to the Central Limit Theorem. Nonetheless, in this article, no such assumptions were made and the expected value and the variance of were approximated by the Jensen inequality and the delta method, respectively, in Equations (13) and (18).
Since is by construction positive, the Markov inequality can be applied. Therefore,
or, equivalently,
If, for a threshold exceeds , then that community is excluded from merging for an iteration provided it has at least vertices. This is a first order probabilistic safeguard preventing almost formed communities from losing their coherence.
On similar grounds, a second order such safeguard can be built on the Chebyshev inequality
4.4. Escape Strategies
Although the purpose of the Random Walker is to discover communities by repeatedly visiting neighboring vertices and crossing low cost edges, it is possible to be trapped inside a community if the latter is connected only through very high cost edges from the remaining graph. To this end, the Random Walker has the option as in [15] to reverse its strategy and select neighboring vertices with probability inversely proportional to their probability of existence if a random flag is triggered. The latter was implemented as a Bernoulli random variable with success probability , which can be set to zero if so desired in order to disable the weight inversion strategy. Recommended values are typically , . Therefore, as in [15], when weight inversion is enabled, the distance d between communities implicitly depends on terms of the form
instead of terms of the form
Alternatively, a probabilistically triggered restart of the Random Walker akin to the PageRank teleportation [28], the random mutation operator in a genetic algorithm [55,56], or the restart strategy in GMRES iterative solver for linear systems [57,58] was also considered. The relocation probability has a Bernoulli distribution and is evaluated independently at each step. The number of steps before such a relocation takes place is finite however small may be as long as it remains strictly positive. The number of steps N to the first relocation has a geometric distribution with success probability equal to with mass distribution function
Therefore, the expected value and variance of N, respectively, are
Even though the relocation modification clearly violates the inherent locality of the Walktrap family of heuristics, if properly calibrated, it happens infrequently enough so as not to severely degrade time performance. Moreover, in a distributed system, a simple move of the random walker to the appropriate graph segment suffices and its cost is certainly affordable. Moreover, since relocation is a rare event, the total number of relocations can be modeled by a Poisson distribution.
5. Analysis
5.1. Data
In order to experimentally evaluate the performance of Markov Walktrap, a Kronecker synthetic graph [59,60,61] has been created. Kronecker graphs are recursively constructed from an original generator graph with the following model
where is the generator graph and ⊗ denotes the Kronecker tensor product.
The generator matrix was
which has vertices numbered from 0 to 6 and each is connected to , , and , where
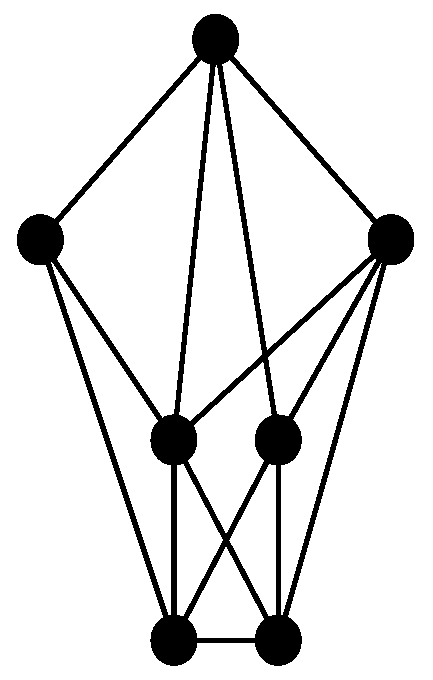
The generator graph is shown in Figure 1.

Figure 1.
The generator graph.
The Kronecker model of Equation (36) has been executed six times aiming to obtain a large graph Y whose properties are summarized in Table 2.
Table 2.
Structural properties of graph Y.
Definitions 5 and 6 outline four important structural graph metrics.
Definition 5.
The (log)density of a fuzzy graph is the ratio of the (logarithm of the) number of its edges to the (logarithm of the) number of its vertices.
Definition 6.
The (log)completeness of a fuzzy graph is the ratio of the (logarithm of the) number of its edges to the (logarithm of the) number of the edges of the complete graph with the same number of vertices.
Observe that Y is highly connected as it has a low diameter of a relatively low cost, high average degree, and a high number of triangles and squares.
5.2. Time and Memory Requirements
In Table 3, the total execution time for Chebyshev Walktrap (CW), Markov Walktrap (MW), Fuzzy Walktrap (FW), and Fuzzy Newman–Girvan (FN-G) is shown. The last two algorithms are outlined in [10], whereas Fuzzy Markov was proposed in [15]. The effect of the escape mechanisms of weight inversion (I) and relocation (R) are also shown for Markov Walktrap and Chebyshev Walktrap. The Fuzzy Newman–Girvan is an exhaustive algorithm that will serve as baseline both for the requirements and the clustering quality. For the Walktrap algorithms, the time for the two phases, namely random walking (RW) and community building (CB), are recorded separately, while for the Fuzzy Newman–Girvan case only, the total time is recorded as there is only a single phase. In addition, the last column of Table 3 lists the number of the vertices visited by the random walker.
Table 3.
Performance in terms of time (sec) and vertex visits.
Fuzzy Newman–Girvan is considerably slower than any member of the Walktrap family of algorithms. This can be attributed to the exhaustive nature of Fuzzy Newman–Girvan as well as to the extensive use of locality by the Walktrap family. Moreover, the probabilistic constraints of Markov Walktrap and Fuzzy Walktrap resulted in the acceleration of both phases of the respective algorithms, with the second order constraints yielding the lowest times in each case. Concerning the escape strategy of the random walker, the relocation option resulted in a slower walking phase but in an accelerated community building phase, with that combination being more efficient than both weight inversion and the combination of the two escape strategies. Omitting an escape strategy is not advisable. Therefore, it is not recommended to activate both escape strategies at the same time. At any rate, the Chebyshev Walktrap with relocation (CW+R) had the best overall performance tagged along in a close manner by the Markov Walktrap with relocation (MW+R). The original Fuzzy Markov being the tardiest member of the family.
An explanation for the time achieved under the relocation strategy is that the teleportation of the random walker results in cache misses, which translates to expensive fetch cycles in the memory hierarchy system. This can be seen in the last two columns of Table 3, as there is not a clear correspondence between the number of total visits and the total walking phase time. When relocation is enabled, the mean visit time is clearly higher. At any rate, the number of visits is linear in the vertex set cardinality.
In addition, the selection of h did not appear to have a significant performance impact, although in most cases the random walker was slower when h was a Poisson random variable both in terms of time and in terms of total visits. This can be attributed to the large number of high cost edges which forced the walker to bounce more times inside a community before eventually moving to another. On the other hand, the symmetric form of the binomial distribution mass function resulted in a larger number of low cost edges, facilitating the movement of the random walker and making the communities easily separable compared to the Poisson case.
The memory requirements were monitored with the Ubuntu Watch administrative tool as presented in Table 4. In contrast to other similar tools such as htop, Watch generates a text output which can be parsed and analyzed. It was periodically ran every 10 s through a bash script resulting in records of several thousand of entries each.
Table 4.
Performance in terms of memory (rounded in MBs).
Fuzzy Newman–Girvan consumes more memory than any other algorithm presented in this article by far. However, it utlilizes the memory constantly and consistently, as denoted by the relatively low standard deviation. This is an important performance feature for operating systems process schedulers [46]. On the other hand, the Walktrap family exploits graph caching. This in turn translates to lower traffic between the disk and the memory, as Neo4j is not a memory-only database, as well as to fewer synchronization and serialization operations. When the relocation strategy is selected, then memory utilization has certain spikes, as it can be inferred from the increased maximum memory occupied and the increased standard deviation. This is a direct result of the random walker teleportation which temporarily annuls any scheduling optimization as well as any caching done at the software or hardware level.
5.3. Community Coherence
The following definition will facilitate further analysis of the experimental results.
Definition 7.
The (log)scree plot of a set S is the plot of the (logarithm of the) values of S versus their sorted frequency.
Since Y does not contain ground truth communities, the communities obtained by the Fuzzy Newman–Girvan will be used as a baseline reference since their sizes are closer to a power law distribution, which is an essential feature of large, scale-free graphs. The deviation of a set of numbers from a power law
is quantified by the formula [62,63]
where parameters and can be estimated by, for instance, a least squares method [25]. Additionally, the estimated value of serves as a quality indicator, as it should be as close to as possible.
The number of communities for each algorithm are shown in Table 5. Notice that this is not an absolute clustering quality metric, as typically a large number of coherent communities is preferable to a smaller number of sparse ones. Nonetheless, the introduction of the relocation strategy systematically pushes the number of communities towards the reference number, although more evidence is required for determining community coherence. This will be addressed by the two asymmetric indices of this section.
Table 5.
Number of communities.
In order to evaluate the clustering quality, the Kullback–Leibler divergence between the sorted sizes of the communities generated by the Fuzzy Newman–Girvan and the sorted community sizes of the remaining algorithms was computed. Recall that for two discrete distributions and the Kullback–Leibler divergence is defined as
where k ranges over the union of discrete events. If and have no events in common, then the result is undefined. If for a single event or , then the corresponding summand is zero. Table 6 summarizes the divergence for the Poisson and the binomial cases.
Table 6.
Kullback–Leibler divergence.
Chebyshev Walktrap with relocation outperforms the remaining algorithms, as it has less divergence from the reference distribution.
A question at this point is whether a correspondence between the communities returned by each algorithm can be found. The asymmetric Tversky index between two sets T and V is defined as
and it quantifies the distance between the template set T and the variant set V. By the very definition of the index, the template set T and the variant set V are not interchangeable, namely . This agrees with intuition, as it makes sense to ask how much the heuristic results differ from the ground truth community, whereas there is no point in asking the inverse question. On the contrary, with a symmetric distance metric such as, for instance, the Tanimoto similarity coefficient
no distinction can be made between the template and the variant, which can potentially lead to misleading results.
At this point, it should be highlighted that Fuzzy Newman Girvan was executed only once since it is a deterministic algorithm.
Returning to Label (44), the case is of particular interest in data mining, as it confines the coefficients on the plane which maximizes the minimum distance of T from V. Notice that algebraically this asymmetry stems from both the terms and , which denote the number of elements of T not found in V and vice versa. Both terms signify in their own way how V is different from T. The former corresponds to the part of V which is missing from T, whereas the latter corresponds to any additions to V. As a rule, is more important and, consequently, . As there is no standard rule for selecting and , the following two schemes have been used, a linear
and an exponential
Observe that in the first case , while in the second , which clearly represents a non-linear scaling of the first case. Furthermore, the second case is considerably biased in favor of .
Once for each possible pair of the m ground truth communities and the n estimated ones the Tversky indices have been computed, the similarity score for a given s is computed
Summing over the range of s and taking the average, the mean similarity score is obtained
The overall similarity scores are shown in Table 7.
Table 7.
Tversky index.
Again, Chebyshev Walktrap with relocation outperforms the remaining algorithms as it has the highest similarity with the reference communities. Note that the exponential weighting scheme sharpens the difference between the algorithms by raising the maximum scores and lowering the minimum ones.
For the experiments of the section, the termination criterion was chosen to be a user supplied number of iterations, namely . This number of iterations is sufficiently large for generating communities in a reliable way. Moreover, each iteration is very quick, so the overall execution time was kept at an acceptable level despite the large number of iterations.
5.4. Relocations
Analysis is concluded with a summary regarding the relocations made by the Chebyshev Walktrap and the Markov Walktrap.
In Table 8, certain statistics regarding the random walker relocations are shown. Specifically, the first line presents the total number of relocations, whereas the second line shows the number of steps that the random walker makes before being relocated for the first time. Similarly, the last three lines contain the minimum, maximum and average number of steps between two successive relocations, respectively.
Table 8.
Relocation summary.
6. Conclusions
The primary contribution of this article is the implementation over Neo4j of Chebyshev Walktrap, a community discovery algorithm designed for edge-fuzzy graphs, a class of fuzzy graphs used among others in [10], which is based on the Random Walker algorithmic principle. Additionally, Chebyshev Walktrap relies on the competitive factors of second order statistics though the Chebyshev inequality and on an optional relocation capability in order to bound unnecessarily costly walks and, thus, remaining inside a community and being trapped for too long within the boundaries of a community, respectively. The relocation aspect was also backported to the Markov Walktrap algorithm first proposed in [15]. The effect of relocation on the community coherence was evaluated based on the asymmetric Tversky index using the Fuzzy Newman–Girvan algorithm from [15] as baseline, while its effect on the output distribution was assessed with the asymmetric Kullback–Leibler divergence. The latter was also the basis for evaluating the distance between the community size distribution generated by Fuzzy Newman–Girvan and the one computed by the Makrov Walktrap and the Chebyshev Walktrap. In these cases, the introduction of asymmetry resulted in the clear distinction between the baseline data and their variants.
The test dataset was a large synthetic Kronecker graph whose edge fuzziness was controlled either by a binomial or by a Poisson distribution. In this dataset, our performance metrics showed that Chebyshev Walktrap yields more compact communities whose sizes are more clustered. Additionally, Markov Walktrap is, in many instances, slightly faster at the expense of a somewhat bigger memory footprint.
The experimental results of Section 5 hint at some future research directions. More sophisticated from a probabilistic viewpoint, community discovery algorithms should be able to exploit the asymmetry of the edge fuzziness distribution through higher order concentration inequalities such as the Talagrand inequality, provided their computation is efficient. Moreover, new metrics for community matching, perhaps utilizing functional or semantic information should be developed. Additionally, methodologies for reliably assessing community coherence based on higher order structural or functional interactions should be sought. Finally, more experiments in larger graphs should be conducted in order to determine any inherent scalability limitations.
Author Contributions
Georgios Drakopoulos, Andreas Kanavos, and Konstantinos Tsakalidis conceived of the idea, designed and performed the experiments, analyzed the results, drafted the initial manuscript and revised the final manuscript.
Conflicts of Interest
The authors declare no conflict of interest.
References
- Zurek, W.H. Algorithmic Information Content, Church-Turing Thesis, Physical Entropy, and Maxwell’s Demon; Technical Report; Los Alamos National Lab.: Los Alamos, NM, USA, 1990. [Google Scholar]
- Brillouin, L. Maxwell’s demon cannot operate: Information and entropy. I. J. Appl. Phys. 1951, 22, 334–337. [Google Scholar] [CrossRef]
- Herrmann, D. Heron von Alexandria. In Die antike Mathematik; Springer: Berlin/Heidelberg, Germany, 2014; pp. 257–288. [Google Scholar]
- Fouss, F.; Pirotte, A.; Renders, J.M.; Saerens, M. Random-walk computation of similarities between nodes of a graph with application to collaborative recommendation. IEEE Trans. Knowl. Data Eng. 2007, 19, 355–369. [Google Scholar]
- Sinop, A.K.; Grady, L. A seeded image segmentation framework unifying graph cuts and random walker which yields a new algorithm. In Proceedings of the 2007 IEEE 11th International Conference on Computer Vision, Rio de Janeiro, Brazil, 2007; pp. 1–8. [Google Scholar]
- Couprie, C.; Grady, L.; Najman, L.; Talbot, H. Power watersheds: A new image segmentation framework extending graph cuts, random walker and optimal spanning forest. In Proceedings of the 2009 IEEE 12th International Conference on Computer Vision, Kyoto, Japan, 27 September–4 October 2009; pp. 731–738. [Google Scholar]
- Blondel, V.D.; Guillaume, J.L.; Lambiotte, R.; Lefebvre, E. Fast unfolding of community hierarchies in large networks. J. Stat. Mech. Theory Exp. 2008. [Google Scholar] [CrossRef]
- Girvan, M.; Newman, M. Community Structure in Social and Biological Networks. Proc. Natl. Acad. Sci. USA 2002, 99, 7821–7826. [Google Scholar] [PubMed]
- Pons, P.; Latapy, M. Computing Communities in Large Networks Using Random Walks. Available online: https://arxiv.org/abs/physics/0512106 (accessed on 28 March 2017).
- Drakopoulos, G.; Kanavos, A.; Makris, C.; Megalooikonomou, V. On converting community detection algorithms for fuzzy graphs in Neo4j. In Proceedings of the 5th International Workshop on Combinations of Intelligent Methods and Applications (CIMA), Vietri sul Mare, Italy, 9–11 November 2015. [Google Scholar]
- Rosvall, M.; Bergstrom, C. Maps of Information Flow Reveal Community Structure in Complex Networks. Technical Report. Available online: https://arxiv.org/abs/0707.0609 (accessed on 28 March 2017).
- Drakopoulos, G.; Kanavos, A. Tensor-based Document Retrieval over Neo4j with an Application to PubMed Mining. In Proceedings of the 7th International Conference of Information, Intelligence, Systems, and Applications (IISA 2016), Chalkidiki, Greece, 13–15 July 2016. [Google Scholar]
- Panzarino, O.P. Learning Cypher; PACKT Publishing: Birmingham, UK, 2014. [Google Scholar]
- Rosenfeld, A. Fuzzy Graphs. Fuzzy Sets Appl. 1975, 513, 77–95. [Google Scholar]
- Drakopoulos, G.; Kanavos, A.; Tsakalidis, A. A Neo4j implementation of fuzzy random walkers. In Proceedings of the 9th Hellenic Conference on Artificial Intelligence (SETN 2016), Thessaloniki, Greece, 18–20 May 2016. [Google Scholar]
- Robinson, I.; Webber, J.; Eifrem, E. Graph Databases; O’Reilly: Sebastopol, CA, USA, 2013. [Google Scholar]
- Fortunato, S. Community Detection in Graphs. Phys. Rep. 2010, 486, 75–174. [Google Scholar] [CrossRef]
- Ng, A.Y.; Jordan, M.I.; Weiss, Y. On Spectral Clustering: Analysis and an algorithm. In Proceedings of the Advances in Neural Information Processing Systems (NIPS 2001), Vancouver, BC, Canada, 3–8 December 2001. [Google Scholar]
- Kernighan, B.; Lin, S. An Efficient Heuristic Procedure for Partitioning Graphs. Bell Syst. Tech. J. 1970, 49, 291–307. [Google Scholar] [CrossRef]
- Shi, J.; Malik, J. Normalized Cuts and Image Segmentation. IEEE Trans. Pattern Anal. Mach. Intell. 2000, 22, 888–905. [Google Scholar]
- Lancichinetti, A.; Fortunato, S. Community Detection Algorithms: A Comparative Analysis. Phys. Rev. E 2009, 80, 056117. [Google Scholar] [CrossRef] [PubMed]
- Leskovec, J.; Lang, K.J.; Mahoney, M.W. Empirical Comparison of Algorithms for Network Community Detection. In Proceedings of the 19th International Conference on World Wide Web (WWW 2010), Raleigh, NC, USA, 26–30 April 2010; pp. 631–640. [Google Scholar]
- Carrington, P.J.; Scott, J.; Wasserman, S. Models and Methods in Social Network Analysis; Cambridge University Press: Cambridge, UK, 2005. [Google Scholar]
- Scott, J. Social Network Analysis: A Handbook; SAGE Publications: Thousand Oaks, CA, USA, 2000. [Google Scholar]
- Drakopoulos, G.; Kanavos, A.; Tsakalidis, A. Evaluating Twitter Influence Ranking with System Theory. In Proceedings of the 12th International Conference on Web Information Systems and Technologies (WEBIST), Rome, Italy, 23–25 April 2016. [Google Scholar]
- Kontopoulos, S.; Drakopoulos, G. A space efficient scheme for graph representation. In Proceedings of the 26th International Conference on Tools with Artificial Intelligence (ICTAI 2014), Limassol, Cyprus, 10–12 November 2014; pp. 299–303. [Google Scholar]
- Langville, A.; Meyer, C. Google’s PageRank and Beyond: The Science of Search Engine Rankings; Princeton University Press: Princeton, NJ, USA, 2006. [Google Scholar]
- Page, L.; Brin, S.; Motwani, R.; Winograd, T. The PageRank Citation Ranking: Bringing Order to the Web; Stanford InfoLab: Stanford, CA, USA, 1999. [Google Scholar]
- Kleinberg, J.M. Authoritative Sources in a Hyperlinked Environment. In Proceedings of the Symposium of Discrete Algorithms (SODA), San Francisco, CA, USA, 25–27 January 1998; pp. 668–677. [Google Scholar]
- Newman, M. Networks: An Introduction; Oxford University Press: Oxford, UK, 2010. [Google Scholar]
- Newman, M.E. Fast Algorithm for Detecting Community Structure in Networks. Phys. Rev. E 2004, 69, 066133. [Google Scholar] [CrossRef] [PubMed]
- Kafeza, E.; Kanavos, A.; Makris, C.; Chiu, D. Identifying Personality-based Communities in Social Networks. In Proceedings of the Legal and Social Aspects in Web Modeling (Keynote Speech) in Conjunction with the International Conference on Conceptual Modeling (ER) (LSAWM), Hong Kong, China, 11–13 November 2013. [Google Scholar]
- Kafeza, E.; Kanavos, A.; Makris, C.; Vikatos, P. Predicting Information Diffusion Patterns in Twitter. In Proceedings of the Artificial Intelligence Applications and Innovations (AIAI), Rhodes, Greece, 19–21 September 2014; pp. 79–89. [Google Scholar]
- Kanavos, A.; Perikos, I. Towards Detecting Emotional Communities in Twitter. In Proceedings of the 9th IEEE International Conference on Research Challenges in Information Science (RCIS), Athens, Greece, 13–15 May 2015; pp. 524–525. [Google Scholar]
- Kafeza, E.; Kanavos, A.; Makris, C.; Vikatos, P. T-PICE: Twitter Personality based Influential Communities Extraction System. In Proceedings of the IEEE International Congress on Big Data, Anchorage, AK, USA, 27 June–2 July 2014; pp. 212–219. [Google Scholar]
- Zamparas, V.; Kanavos, A.; Makris, C. Real Time Analytics for Measuring User Influence on Twitter. In Proceedings of the 27th IEEE International Conference on Tools with Artificial Intelligence (ICTAI), Vietri sul Mare, Italy, 9–11 November 2015. [Google Scholar]
- Kanavos, A.; Perikos, I.; Vikatos, P.; Hatzilygeroudis, I.; Makris, C.; Tsakalidis, A. Conversation Emotional Modeling in Social Networks. In Proceedings of the 26th IEEE International Conference on Tools with Artificial Intelligence (ICTAI), Limassol, Cyprus, 10–12 November 2014; pp. 478–484. [Google Scholar]
- Kanavos, A.; Perikos, I.; Vikatos, P.; Hatzilygeroudis, I.; Makris, C.; Tsakalidis, A. Modeling Retweet Diffusion using Emotional Content. In Proceedings of the Artificial Intelligence Applications and Innovations (AIAI), Rhodes, Greece, 19–21 September 2014; pp. 101–110. [Google Scholar]
- Kephart, J.O.; White, S.R. Directed-graph epidemiological models of computer viruses. In Proceedings of the 1991 IEEE Computer Society Symposium on Research in Security and Privacy, Oakland, CA, USA, 20–22 May 1991; pp. 343–359. [Google Scholar]
- Ren, J.; Yang, X.; Yang, L.X.; Xu, Y.; Yang, F. A delayed computer virus propagation model and its dynamics. Chaos Solitons Fractals 2012, 45, 74–79. [Google Scholar] [CrossRef]
- Tugnait, J.K.; Luo, W. On channel estimation using superimposed training and first-order statistics. In Proceedings of the 2003 IEEE International Conference on Acoustics, Speech, and Signal Processing (ICASSP’03), Hong Kong, China, 6–10 April 2003; pp. 4–624. [Google Scholar]
- Tong, L.; Xu, G.; Kailath, T. Blind identification and equalization based on second-order statistics: A time domain approach. IEEE Trans. Inf. Theory 1994, 40, 340–349. [Google Scholar] [CrossRef]
- Belouchrani, A.; Abed-Meraim, K.; Cardoso, J.F.; Moulines, E. A blind source separation technique using second-order statistics. IEEE Trans. Signal Process. 1997, 45, 434–444. [Google Scholar] [CrossRef]
- Mendel, J.M. Tutorial on higher-order statistics (spectra) in signal processing and system theory: Theoretical results and some applications. Proc. IEEE 1991, 79, 278–305. [Google Scholar] [CrossRef]
- Chua, K.C.; Chandran, V.; Acharya, U.R.; Lim, C.M. Application of higher order statistics (spectra) in biomedical signals—A review. Med. Eng. Phys. 2010, 32, 679–689. [Google Scholar] [PubMed]
- Drakopoulos, G.; Megalooikonomou, V. An adaptive higher order scheduling policy with an application to biosignal processing. In Proceedings of the 2016 Symposium Series on Computational Intelligence (SSCI 2016), Athens, Greece, 6–9 December 2016; pp. 921–928. [Google Scholar]
- Comon, P. Independent component analysis, a new concept? Signal Process. 1994, 36, 287–314. [Google Scholar] [CrossRef]
- Delorme, A.; Sejnowski, T.; Makeig, S. Enhanced detection of artifacts in EEG data using higher-order statistics and independent component analysis. Neuroimage 2007, 34, 1443–1449. [Google Scholar] [CrossRef] [PubMed]
- Priest, D.M. Algorithms for arbitrary precision floating point arithmetic. In Proceedings of the 10th IEEE Symposium on Computer Arithmetic, Grenoble, France, 26–28 June 1991; pp. 132–143. [Google Scholar]
- Drakopoulos, G. Tensor fusion of affective Twitter metrics in Neo4j. In Proceedings of the 7th International Conference of Information, Intelligence, Systems, and Applications (IISA 2016), Chalkidiki, Greece, 13–15 July 2016. [Google Scholar]
- Drakopoulos, G.; Megalooikonomou, V. Regularizing Large Biosignals with Finite Differences. In Proceedings of the 7th International Conference of Information, Intelligence, Systems, and Applications (IISA 2016), Chalkidiki, Greece, 13–15 July 2016. [Google Scholar]
- Drakopoulos, G.; Kontopoulos, S.; Makris, C. Eventually consistent cardinality estimation with applications in biodata mining. In Proceedings of the 31st Annual ACM Symposium on Applied Computing, Pisa, Italy, 4–8 April 2016; pp. 941–944. [Google Scholar]
- Hamming, R.W. On the distribution of numbers. Bell Syst. Tech. J. 1970, 49, 1609–1625. [Google Scholar]
- Aggarwal, C.C.; Zhai, C. Mining Text Data; Springer Science and Business Media: Berlin/Heidelberg, Germany, 2012. [Google Scholar]
- De Jong, K. Learning with genetic algorithms: An overview. Mach. Learn. 1988, 3, 121–138. [Google Scholar] [CrossRef]
- De Jong, K.A.; Spears, W.M. Using Genetic Algorithms to Solve NP-Complete Problems. In Proceedings of the ICGA, Fairfax, VA, USA, 4–7 June 1989; pp. 124–132. [Google Scholar]
- Saad, Y.; Schultz, M.H. GMRES: A generalized minimal residual algorithm for solving nonsymmetric linear systems. SIAM J. Sci. Stat. Comput. 1986, 7, 856–869. [Google Scholar] [CrossRef]
- Morgan, R.B. Implicitly restarted GMRES and Arnoldi methods for nonsymmetric systems of equations. SIAM J. Matrix Anal. Appl. 2000, 21, 1112–1135. [Google Scholar] [CrossRef]
- Leskovec, J.; Chakrabarti, D.; Kleinberg, J.; Faloutsos, C.; Ghahramani, Z. Kronecker graphs: An approach to modeling networks. J. Mach. Learn. Res. 2010, 11, 985–1042. [Google Scholar]
- Leskovec, J.; Kleinberg, J.; Faloutsos, C. Graphs over time: Densification laws, shrinking diameters and possible explanations. In Proceedings of the Eleventh ACM SIGKDD International Conference on Knowledge Discovery in Data Mining (KDD05), Chicago, IL, USA, 21–24 August 2005; pp. 177–187. [Google Scholar]
- Tsourakakis, C.E. Fast counting of triangles in large real networks without counting: Algorithms and laws. In Proceedings of the ICDM, Pisa, Italy, 15–19 December 2008; pp. 608–617. [Google Scholar]
- Drakopoulos, G.; Kanavos, A.; Makris, C.; Megalooikonomou, V. Finding fuzzy communities in Neo4j. In Smart Innovation, Systems, and Technologies; Howlett, R.J., Jain, L.C., Eds.; Springer: Berlin/Heidelberg, Germany, 2016. [Google Scholar]
- Drakopoulos, G.; Baroutiadi, A.; Megalooikonomou, V. Higher order graph centrality measures for Neo4j. In Proceedings of the 6th International Conference of Information, Intelligence, Systems, and Applications (IISA 2015), Corfu, Greece, 6–8 July 2015. [Google Scholar]
© 2017 by the authors. Licensee MDPI, Basel, Switzerland. This article is an open access article distributed under the terms and conditions of the Creative Commons Attribution (CC BY) license (http://creativecommons.org/licenses/by/4.0/).