Article

Study on Stress Development in the Phase Transition Layer of Thermal Barrier Coatings

1
State Key Laboratory for Strength and Vibration of Mechanical Structures, Shaanxi Key Laboratory of Environment and Controlfor Flight Vehicle, Xi’an Jiaotong University, Xi’an 710049, China
2
State Key Laboratory for Manufacturing System Engineering, Xi’an Jiaotong University, Xi’an 710049, China
*
Author to whom correspondence should be addressed.
Materials 2016, 9(9), 773; https://doi.org/10.3390/ma9090773
Submission received: 23 May 2016 / Revised: 7 September 2016 / Accepted: 7 September 2016 / Published: 13 September 2016
(This article belongs to the Special Issue Multiscale Methods and Application to Computational Materials Design)

Abstract

:
Stress development is one of the significant factors leading to the failure of thermal barrier coating (TBC) systems. In this work, stress development in the two phase mixed zone named phase transition layer (PTL), which grows between the thermally grown oxide (TGO) and the bond coat (BC), is investigated by using two different homogenization models. A constitutive equation of the PTL based on the Reuss model is proposed to study the stresses in the PTL. The stresses computed with the proposed constitutive equation are compared with those obtained with Voigt model-based equation in detail. The stresses based on the Voigt model are slightly higher than those based on the Reuss model. Finally, a further study is carried out to explore the influence of phase transition proportions on the stress difference caused by homogenization models. Results show that the stress difference becomes more evident with the increase of the PTL thickness ratio in the TGO.

1. Introduction

A thermal barrier coating system (TBCs) is highly advanced material system, mainly applied to the metallic surfaces of gas-turbine engines. These coatings provide heat insulation to the metallic parts from the extremely hot gas steam [1,2,3,4], and allow the engines to work at higher operating temperatures, which could significantly improve the turbine efficiency [5,6]. TBCs mainly consists of the 7 wt % Y2O3-stabilized ZrO2 (7YSZ) ceramic layer, i.e., Top Coat (TC), and the (Ni,Pt)Al or MCrAlY layer, i.e., bond coat (BC). TC is the primary heat-resistant layer with a lower heat conduction coefficient, while the BC is composed of Al and serves to prevent the substrate from oxidation and corrosion, and to improve cohesiveness between the TC and the substrate [7,8].
Due to the large and prolonged heat loads, much attention should be paid to the high-temperature mechanical performance of the TBC materials system, especially the high-temperature oxidation behavior, which could reduce the TBC life drastically and lead to thermal fatigue. As the oxygen diffuses through the TC, the BC materials are gradually oxidized to thermally grown oxide (TGO). Thus, there is a layer appeared along the interface where both BC and TGO materials co-exist, which is defined as the phase transition layer (PTL) [9]. As the BC oxidation develops, the phase transition layer grows down towards the substrate, while the early part of the layer finally becomes a TGO layer. In this study, the BC layer is assumed to be mainly consisted of Al, and the phase transition layer are co-existent Al and Al2O3. The TGO layer is considered to contain the Al2O3 layer and PTL.
The growth of the phase transition layer could affect the stress development on the interface, which has a significant effect on the interface degradation at high temperatures [10]. The establishment of constitutive relationships is essential for studying the stress development, so the influence of different constitutive relationships on the stress development is of great interest. Some research has been conducted on the constitutive relationship of the phase transition layer. An oxidation-constitutive framework coupling local expansion and local stresses induced by oxidation was proposed by Busso et al. to describe the effect of the phase transition caused by the gradual oxidation on the constitutive behavior of the phase transition zone [10,11]. Hille [9] described the growth of the TGO–BC mixture zone using an oxygen diffusion–reaction model, and investigated the stress-strain behavior within the mixture zone through a constitutive equation based on the Voigt model. It is well known that the composition and microstructure of the materials in TBCs are extremely complicated because of the intricate processes such as local oxidation, diffusion, creep, and sintering of the ceramic material [11]. Therefore, it is difficult to precisely describe constitutive behavior within the PTL and to evaluate the stress by using a specific constitutive formulation. Thus, it would be much more useful if the stress limits based on different constitutive models can be predicted. The Voigt and Reuss model are confirmed as the upper and lower bound among homogenization models [12]. Therefore, the above two models are applied in this study to explore the interface stress.
This work aims at investigating the influence of different homogenization models on stress prediction in TBCs. Thus, a constitutive equation based on the Reuss model is proposed. By using the constitutive equation based on the Voigt model [9] as well, this work studies the stress development in the PTL in detail. Both of the equations are discretized with the finite element method (FEM) and are implemented with the help of the commercial FE package ABAQUS. In the numerical examples, the effect of oxygen diffusion on the growth of the phase transition layer is first explored. The stress development in PTL is then predicted with the two constitutive equations, respectively, and the influence of phase transition proportions on the stresses is investigated. The results may show a reference for further research on the stress development in thermal barrier coatings.

2. Theoretical Models

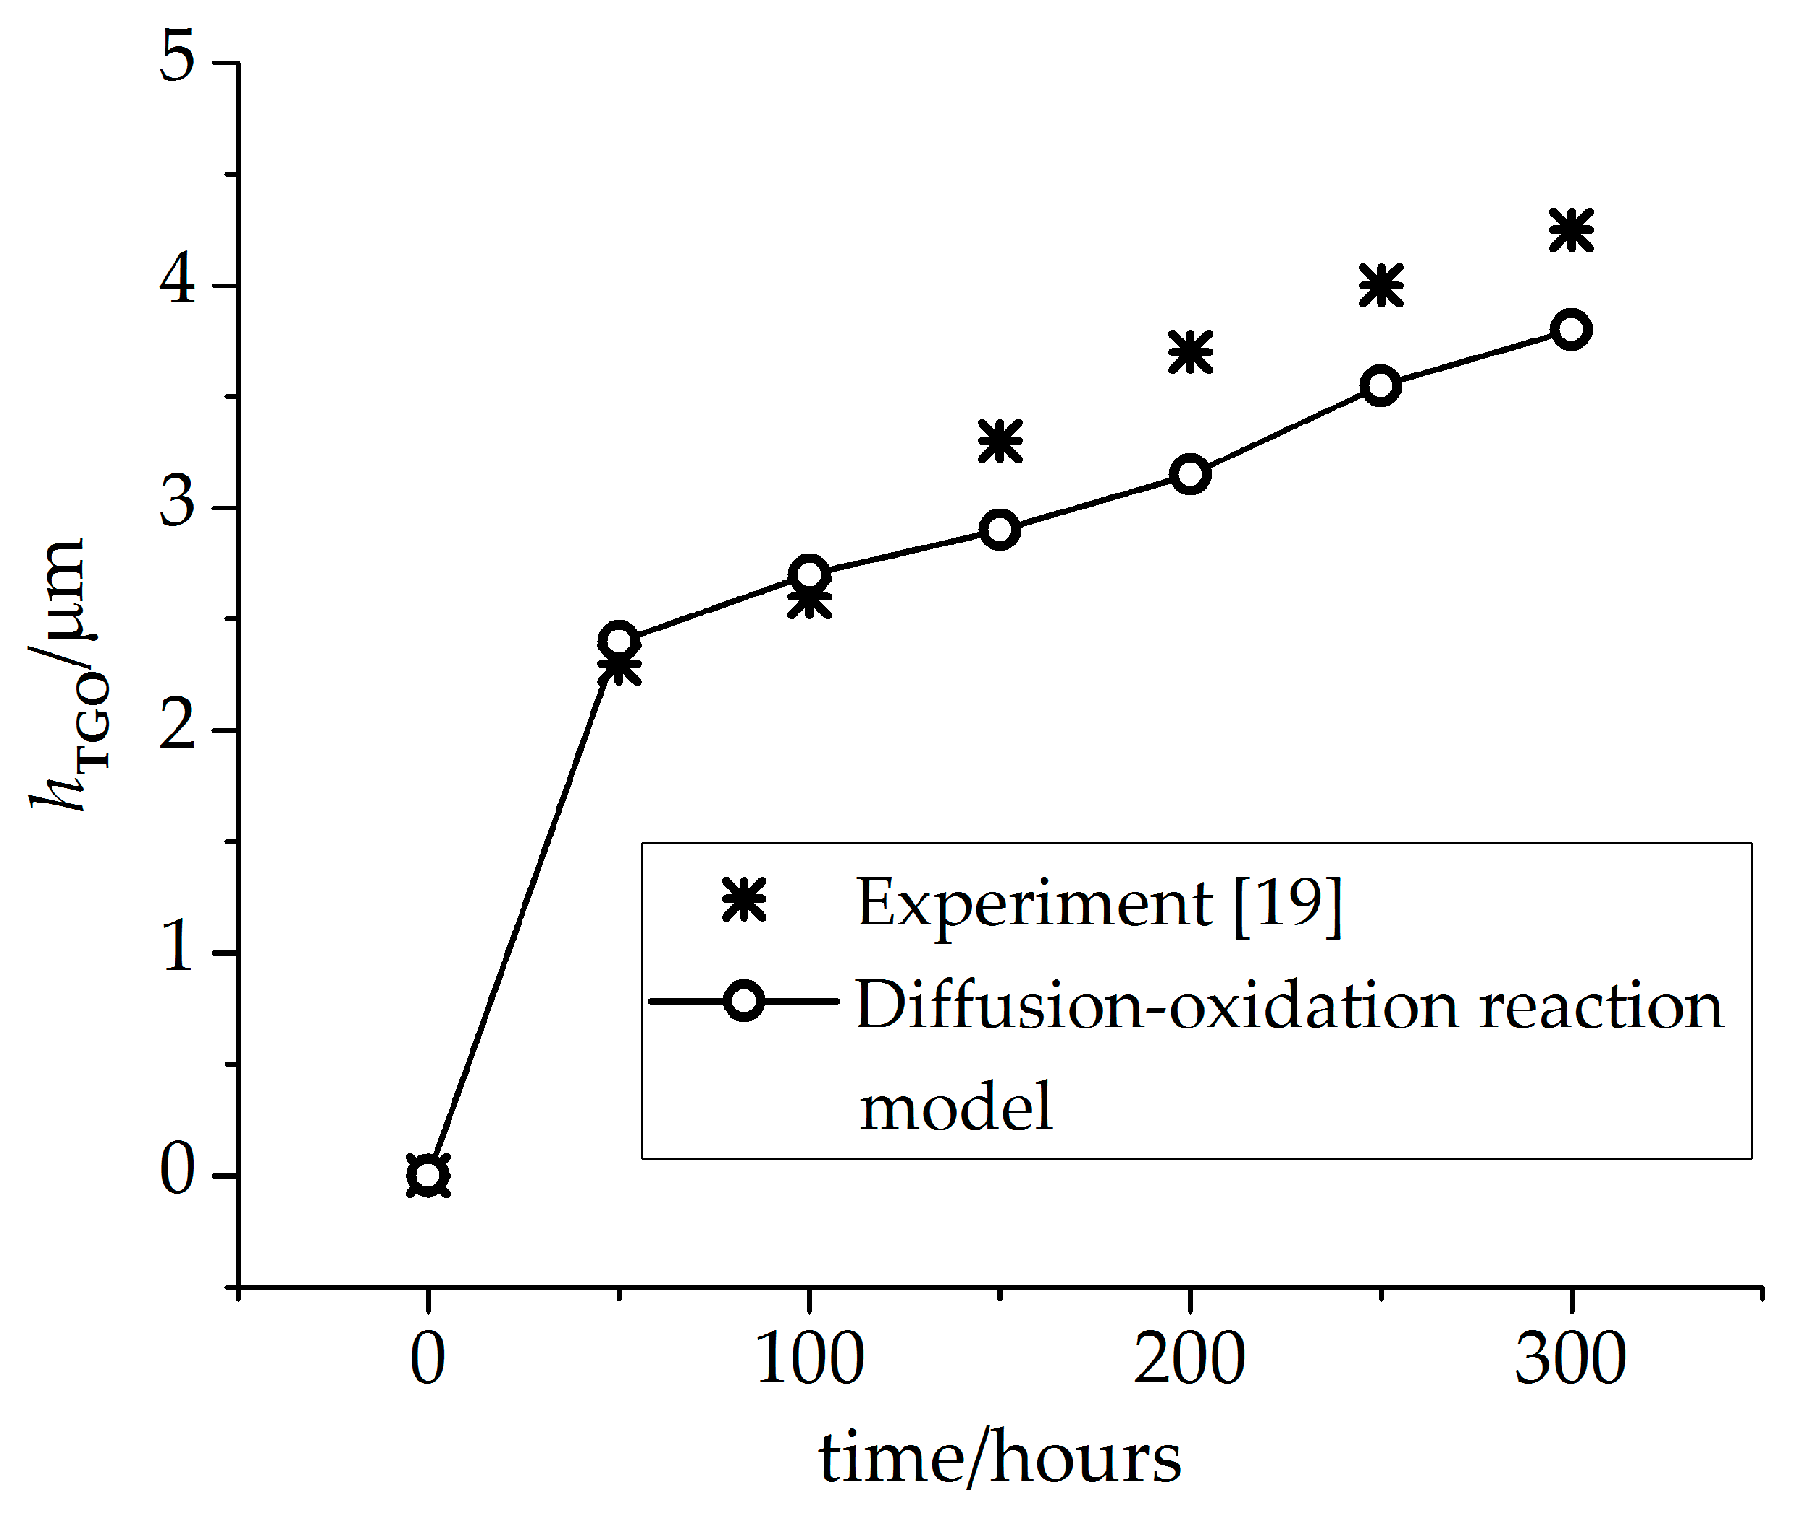
2.1. Diffusion-Oxidation Reaction Model for the TGO Layer

Fick’s law is employed in this work, which allows the description of the phenomenon of gas diffusion in a macroscopic point of view:
c ˙ o 2 = D d i v ( c o 2 )
where c o 2 is the concentration of oxygen and D is the diffusion coefficient of oxygen. During the oxidation of TBCs, the formation of TGO continuously consumes oxygen. To take this consumption effect into account, a diffusion-oxidation reaction model [13] can be written as follows by using the concept of alkali-silica reaction:
c ˙ O 2 = D d i v ( c O 2 ) S ( c o 2 )
where S ( c o 2 ) = A ξ ˙ is the oxidation term and A denotes the amount of oxygen consumed by per unit reference volume metal during oxidation. ξ ˙ is the changing rate of the Al2O3 dimensionless molar fraction ξ , which can be expressed as:
ξ ˙ = γ ( 1 ξ ) c o 2
where γ is a constant.
With the diffusion-oxidation reaction model mentioned above, the growth of the phase transition layer can be predicted.

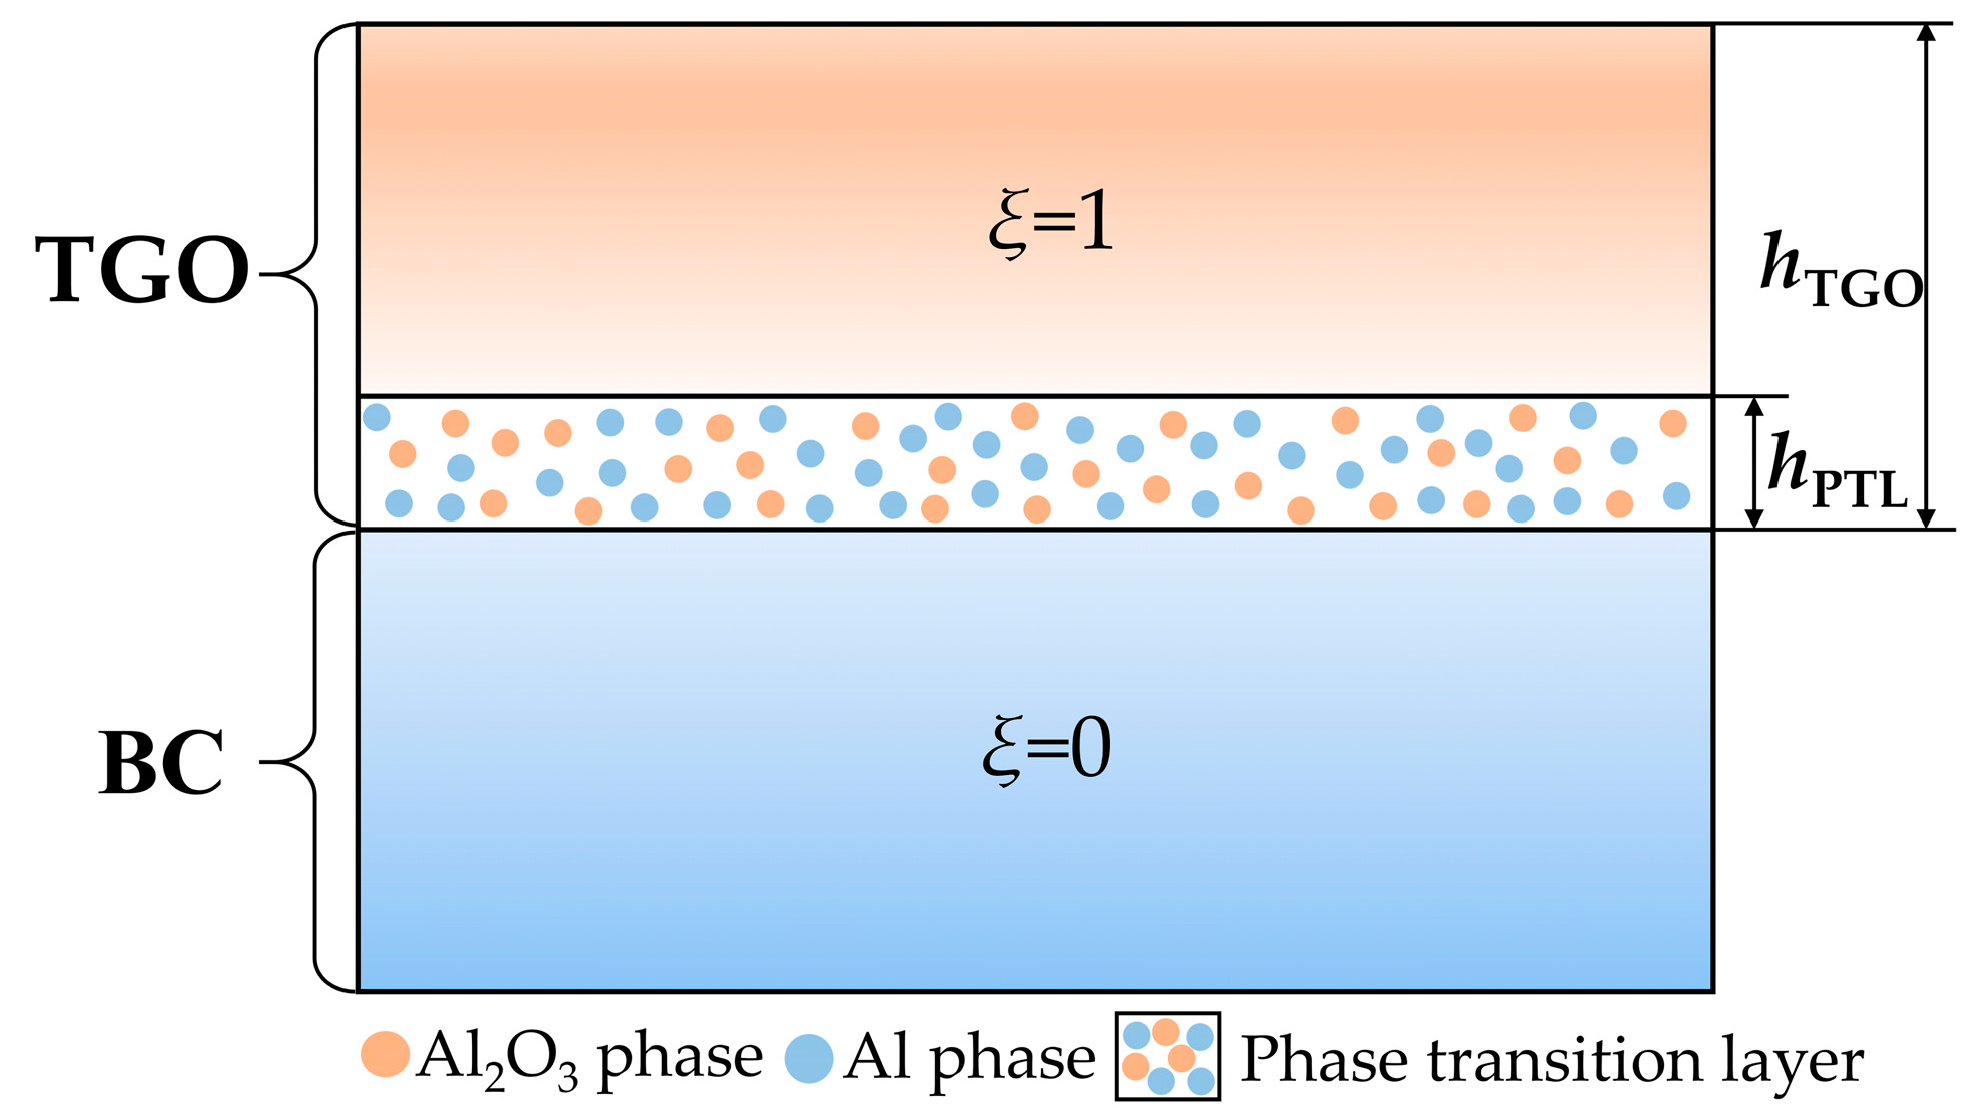
2.2. The Constitutive Equation for the Phase Transition Layer

As two limiting cases in the homogenization schemes, the Voigt and Reuss models represent the upper and lower bounds, respectively [12]. In this section, a new constitutive equation based on the Reuss model is proposed to describe the material behavior of the PTL.

2.2.1. Constitutive Equation based on Reuss Model

According to the Reuss model [14], the iso-stress assumption is set as follows:
σ = σ α = σ β
ε = ϕ ε α + ( 1 ϕ ) ε β
In this work, the PTL is composed of Al and Al2O3, so the α and β phases are specified as Al2O3 and Al phases, respectively.
ε A l is the total strain in the phase of Al, which is divided into the elastic strain ε A l e and thermal strain ε A l t h :
ε A l = ε A l e + ε A l t h
ε A l 2 O 3 is the total strain in the phase of Al2O3, which is partitioned into the elastic strain ε A l 2 O 3 e , the thermal strain ε A l 2 O 3 t h and the eigenstrain ε A l 2 O 3 g due to phase transition obtained from the Pilling-Bedworth ratio [15]:
ε A l 2 O 3 = ε A l 2 O 3 e + ε A l 2 O 3 t h + ε A l 2 O 3 g
Combining Equations (6) and (7), and taking Hooke’s law into account for each phase:
ε A l e = S A l σ A l
ε A l 2 O 3 e = S A l 2 O 3 σ A l 2 O 3
where S is the flexibility matrixes.
The relationship of stress and strain in the phase transition layer can be written as:
[ ( 1 ξ ) S A l + ξ S A l 2 O 3 ] σ = [ ε ( 1 ξ ) ε A l t h ξ ( ε A l 2 O 3 t h + ε A l 2 O 3 g ) ]
where ξ is the dimensionless molar fraction of Al2O3 phase, which values from 0 to 1.
In Equation (10), an equivalent flexibility matrix S e f f is defined, which can be expressed as:
S e f f = ( 1 ξ ) S A l + ξ S A l 2 O 3
The constitutive relationship based on the Reuss model can be finally obtained as follows:
σ = S e f f 1 : [ ε ( 1 ξ ) ε A l t h ξ ( ε A l 2 O 3 t h + ε A l 2 O 3 g ) ]

2.2.2. Constitutive Equation based on the Voigt Model

Another homogenization method used in this work is the Voigt model. According to [9], the constitutive equation based on the Voigt model is shown as Equation (13):
σ = ( 1 ξ ) D A l : ( ε ε A l t h ) + ξ D A l 2 O 3 : ( ε ε A l 2 O 3 t h ε A l 2 O 3 g )

3. Numerical Examples

This section contains the numerical calculation conditions applied in the finite element analysis, including detailed information about the finite element model of TBCs adopted in the calculations and material parameters for the diffusion-oxidation reaction model and constitutive equations.

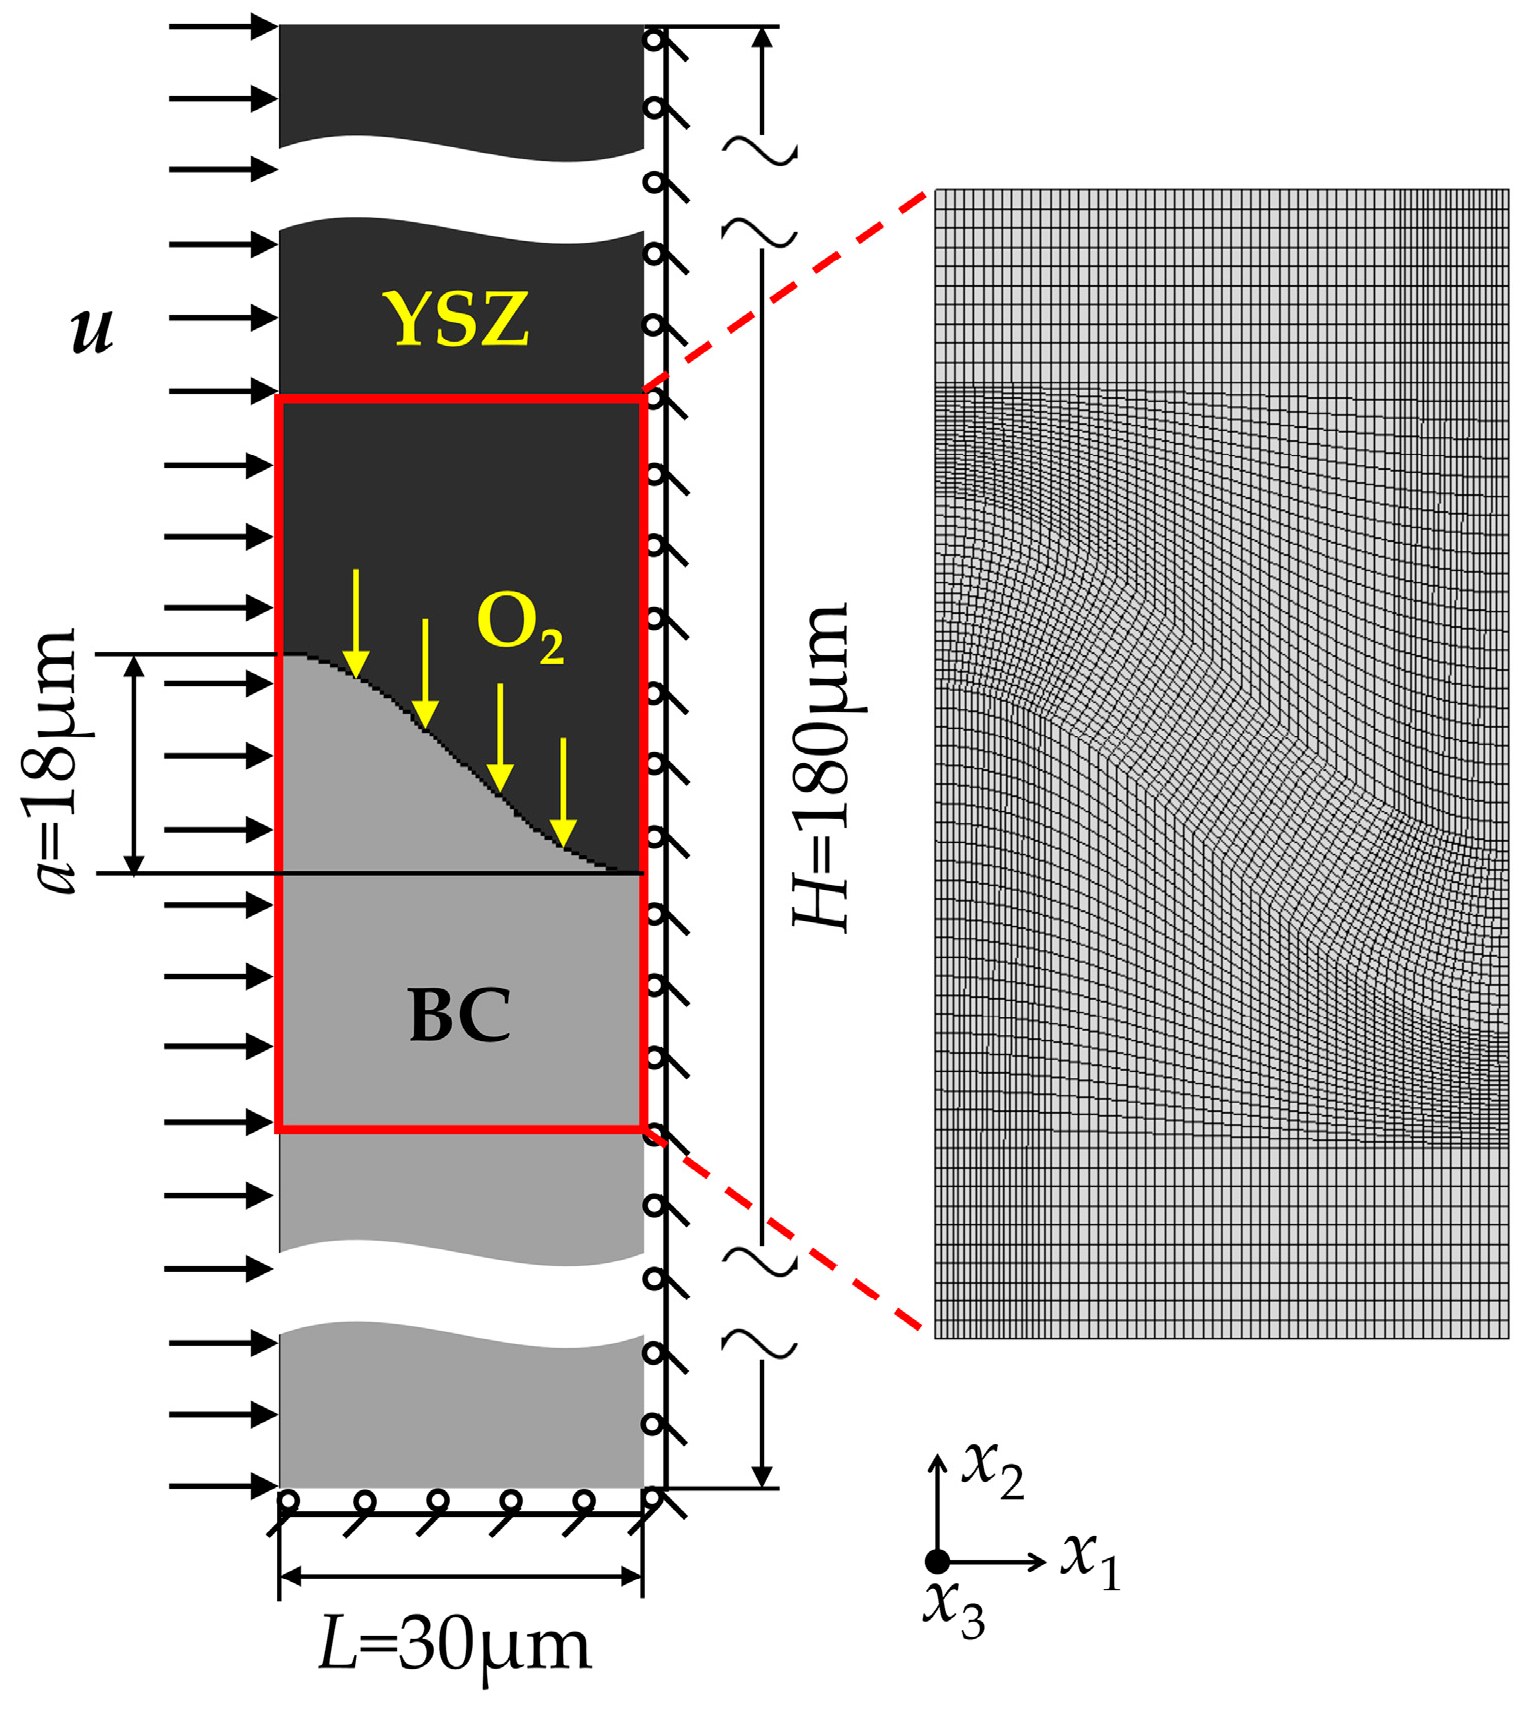
3.1. Finite Element Model

It is assumed that the morphology of the TC-BC interface is idealized as a periodic array of sine interfaces in this paper, as illustrated in Figure 1. The finite element model consists of 14,144 quadratic first-order iso-parametric elements and 14,421 nodes.
The thermal field imposed on TBCs during the service process is assumed to be spatially homogeneous. The TBCs are exposed at the temperature of 1100 °C for 200 h in the service process, and then cools to room temperature (20 °C) during the following 120 s. The TBCs are considered to be stress-free in the initial stage of the oxidation process, and these temperature-converting processes are defined as an operating cycle and applied to the finite element analysis for the evolution of stress.
For the diffusion analysis of this study, the oxygen concentration is considered to be uniform on the interface between TC and BC, and has a constant value of 1.5 mol/m3. With the diffusion-oxidation reaction model introduced in Equation (2), oxide growth occurred during the isothermal exposure periods at 1100 °C.
The displacement boundary condition is illustrated in Figure 1. The bottom boundary is constrained in x2 direction, depending on the fact that the thickness of the substrate is much larger than the TBCs; thus, it can be regarded that there is almost no translation in x2 direction on the substrate when TBCs deforms during the service process. The right boundary is clamped in the x1 direction due to the symmetry of the TBCs model. Meanwhile, a uniform displacement u is applied at the left boundary in x2 direction, considering the effect of the thermal contraction imposed by the substrate on TBCs during the cooling stage, which can be obtained by Equation (14):
u = α s u b ( T T r e f ) L
where α s u b is the thermal expansion coefficient of the substrate and T r e f is the reference temperature of 1100 °C. L is the length of the finite element model values 30 μm shown in Figure 1.
In the direction x3 perpendicular to the x1-x2 plane, the deformation of the substrate is imposed on the TBCs by a generalized plane-strain condition:
ε 33 = α s u b ( T T r e f )

3.2. Physical and Mechanical Properties

In this study, the TC, the TGO, and the BC are considered as isotropic materials and the Young’s modulus E, Poisson’s ratio ν, and the thermal expansion coefficient α of TC, BC, and TGO phases are listed in Table 1.
The diffusion-oxidation reaction model in Equation (2) is used to predict the oxide growth history. The values of oxygen diffusion coefficients of TGO and BC phase are regarded to be the same [17]. The parameter A obtained in [18] is used. The parameter γ in Equation (2) can be numerically calculated via the process of TGO formation in the experiment mentioned [19]. These parameters are listed in Table 2. Figure 2 shows the TGO thickness calculated by the diffusion-oxidation reaction model after several hours of oxidation. It can be seen that the numerical results are in good accordance with the experimental results from [19].

4. Results and Discussion

As mentioned in the introduction, an Al and Al2O3 co-existent region forms over the BC interface during the oxidation procedure, which is defined as the phase transition layer (PTL) with the dimensionless molar fraction of Al2O3, ξ. The purely Al2O3 layer (ξ = 1) and the PTL (0 < ξ < 1) compose the TGO layer, as can be seen in Figure 3. In this subsection, the growth of PTL and the stresses in PTL are investigated. In order to explore the effect of PTL growth on the stress development, the term phase transition proportion is defined, indicating the thickness ratio of the PTL taking part in the total TGO. The phase transition proportion in this work is expressed as hPTL/hTGO (see Figure 3), where hTGO is the total thickness of TGO and hPTL is the thickness of the PTL. Each value of the phase transition proportion represents a TGO growth state.
In the simulation, the TBCs exposed to the thermal environment with an oxidation stage at 1100 °C for 200 h, and a cooling stage at 20 °C for 120 s, is analyzed. The diffusion-oxidation reaction model and the constitutive equations introduced above are applied to the numerical calculations.

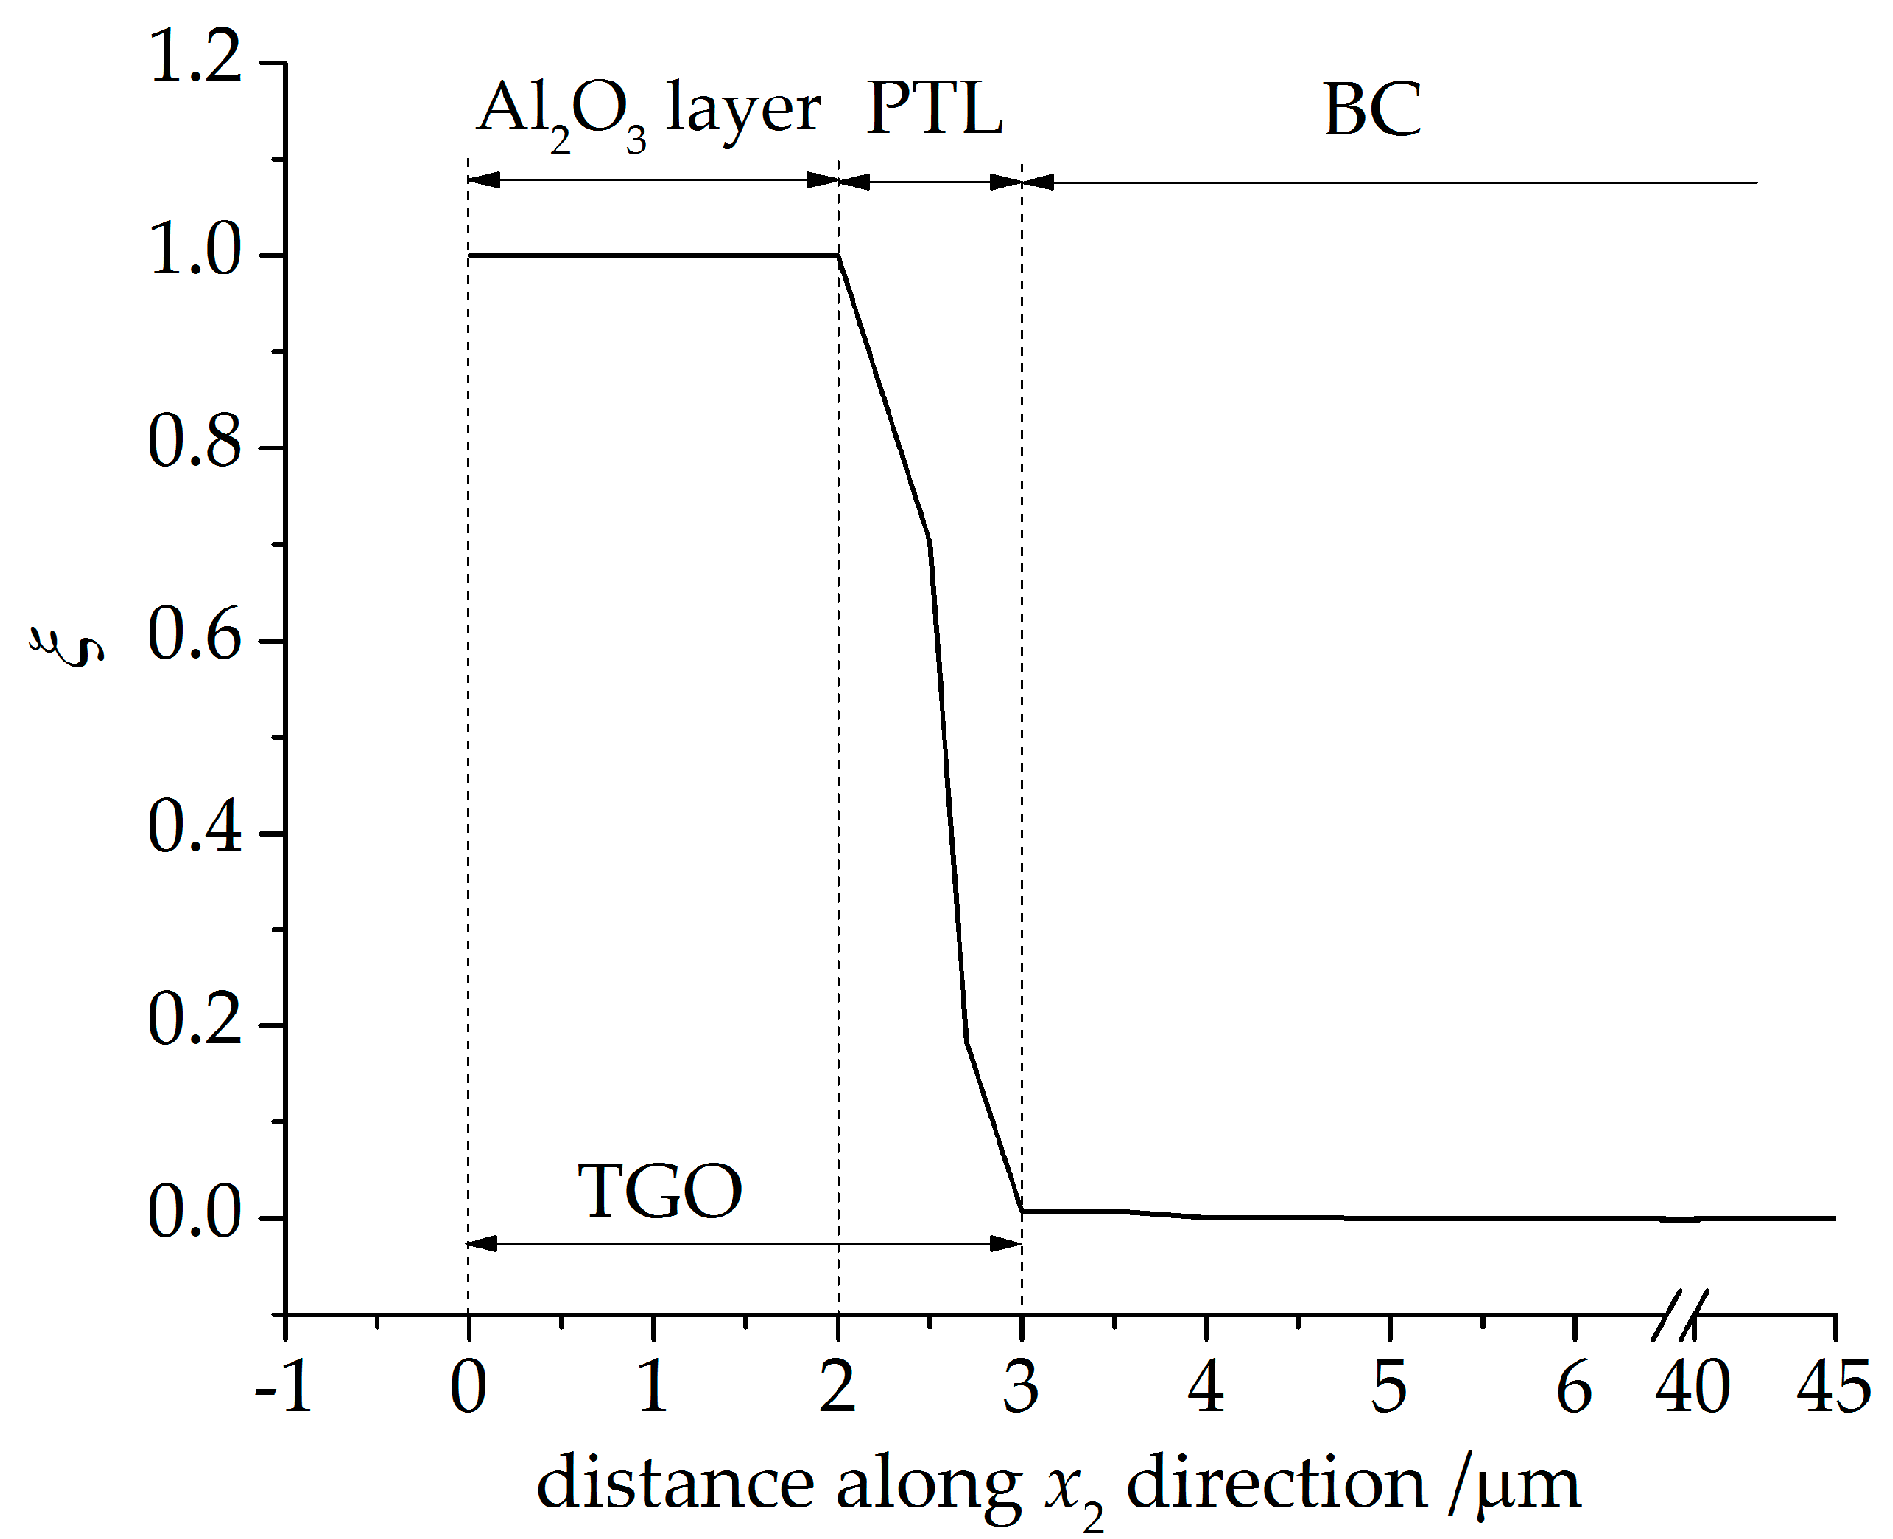
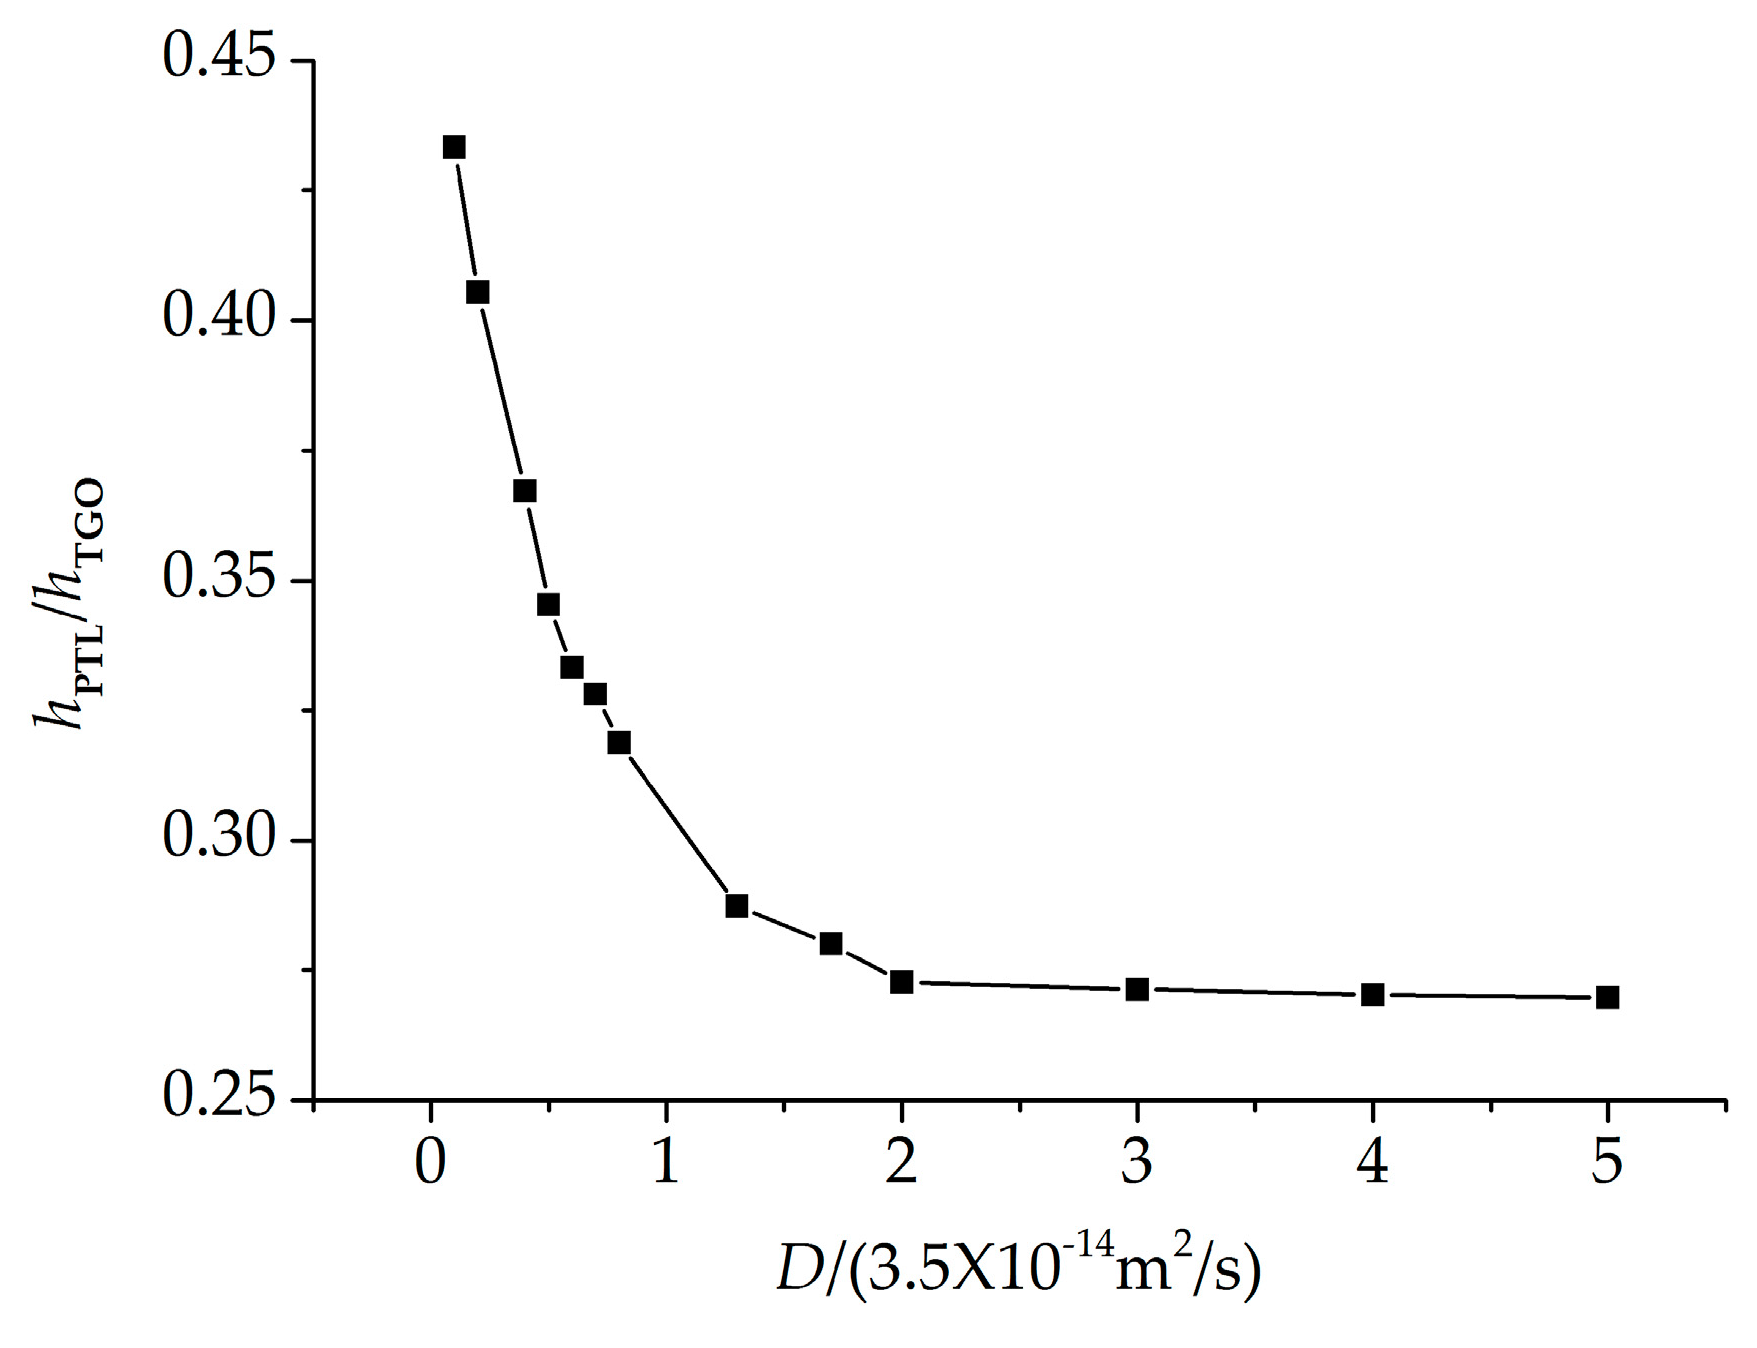
4.1. Growth of the Phase Transition Layer

As discussed earlier, with oxygen diffusing through the TC, the BC is assumed to be oxidized gradually, leading to the formation of the PTL. Figure 4 presents the contour plot of TGO growth after 200 h oxidation with the oxygen diffusion coefficient of 3.5 × 10⁻¹⁴ m2/s. It shows that Al2O3 forms on TC-BC interface at the beginning of oxidation. As the oxidation proceeds, Al2O3 grows uniformly in the direction of BC, and along x2 axis, the dimensionless molar fraction of Al2O3 ξ decreases. To observe the growth of TGO clearly, ξ curve is plotted reflecting ξ variation along the x2 direction at x1 = 0, as shown in Figure 5. The horizontal axis origin is set to be the point where the TGO emerges firstly in the direction x2. It can be seen that the thickness of TGO is 3 mm and PTL of 1 mm, with a phase transition proportion hPTL/hTGO of 33%.
It is obvious that oxygen diffusion plays an important role in the growth of the PTL. To investigate the effect of oxygen diffusion on the PTL growth, different oxygen diffusion coefficients (D in Equation (2)) as listed in Table 3 are considered. The corresponding phase transition proportions hPTL/hTGO can be obtained by numerical calculations, as plotted in Figure 6.
It is shown that with the oxygen diffusion coefficient increasing, the phase transition proportion decreases. The diffusion coefficient describes the rate of diffusion, which is the volume of oxygen diffusing through a unit area per unit time. To explain the oxygen diffusion effect on the PTL growth, a representative zone between TGO and BC layer is selected as shown in Figure 3. With larger oxygen diffusion coefficient D, more O2− interacts with Al to form Al2O3 in unit time, which increases the oxidation rate. More Al in the representative zone will be oxidized to Al2O3, causing ξ increasing and the thickness of PTL hPTL decreasing, respectively. As a result, larger D leads to smaller phase transition proportion hPTL/hTGO.

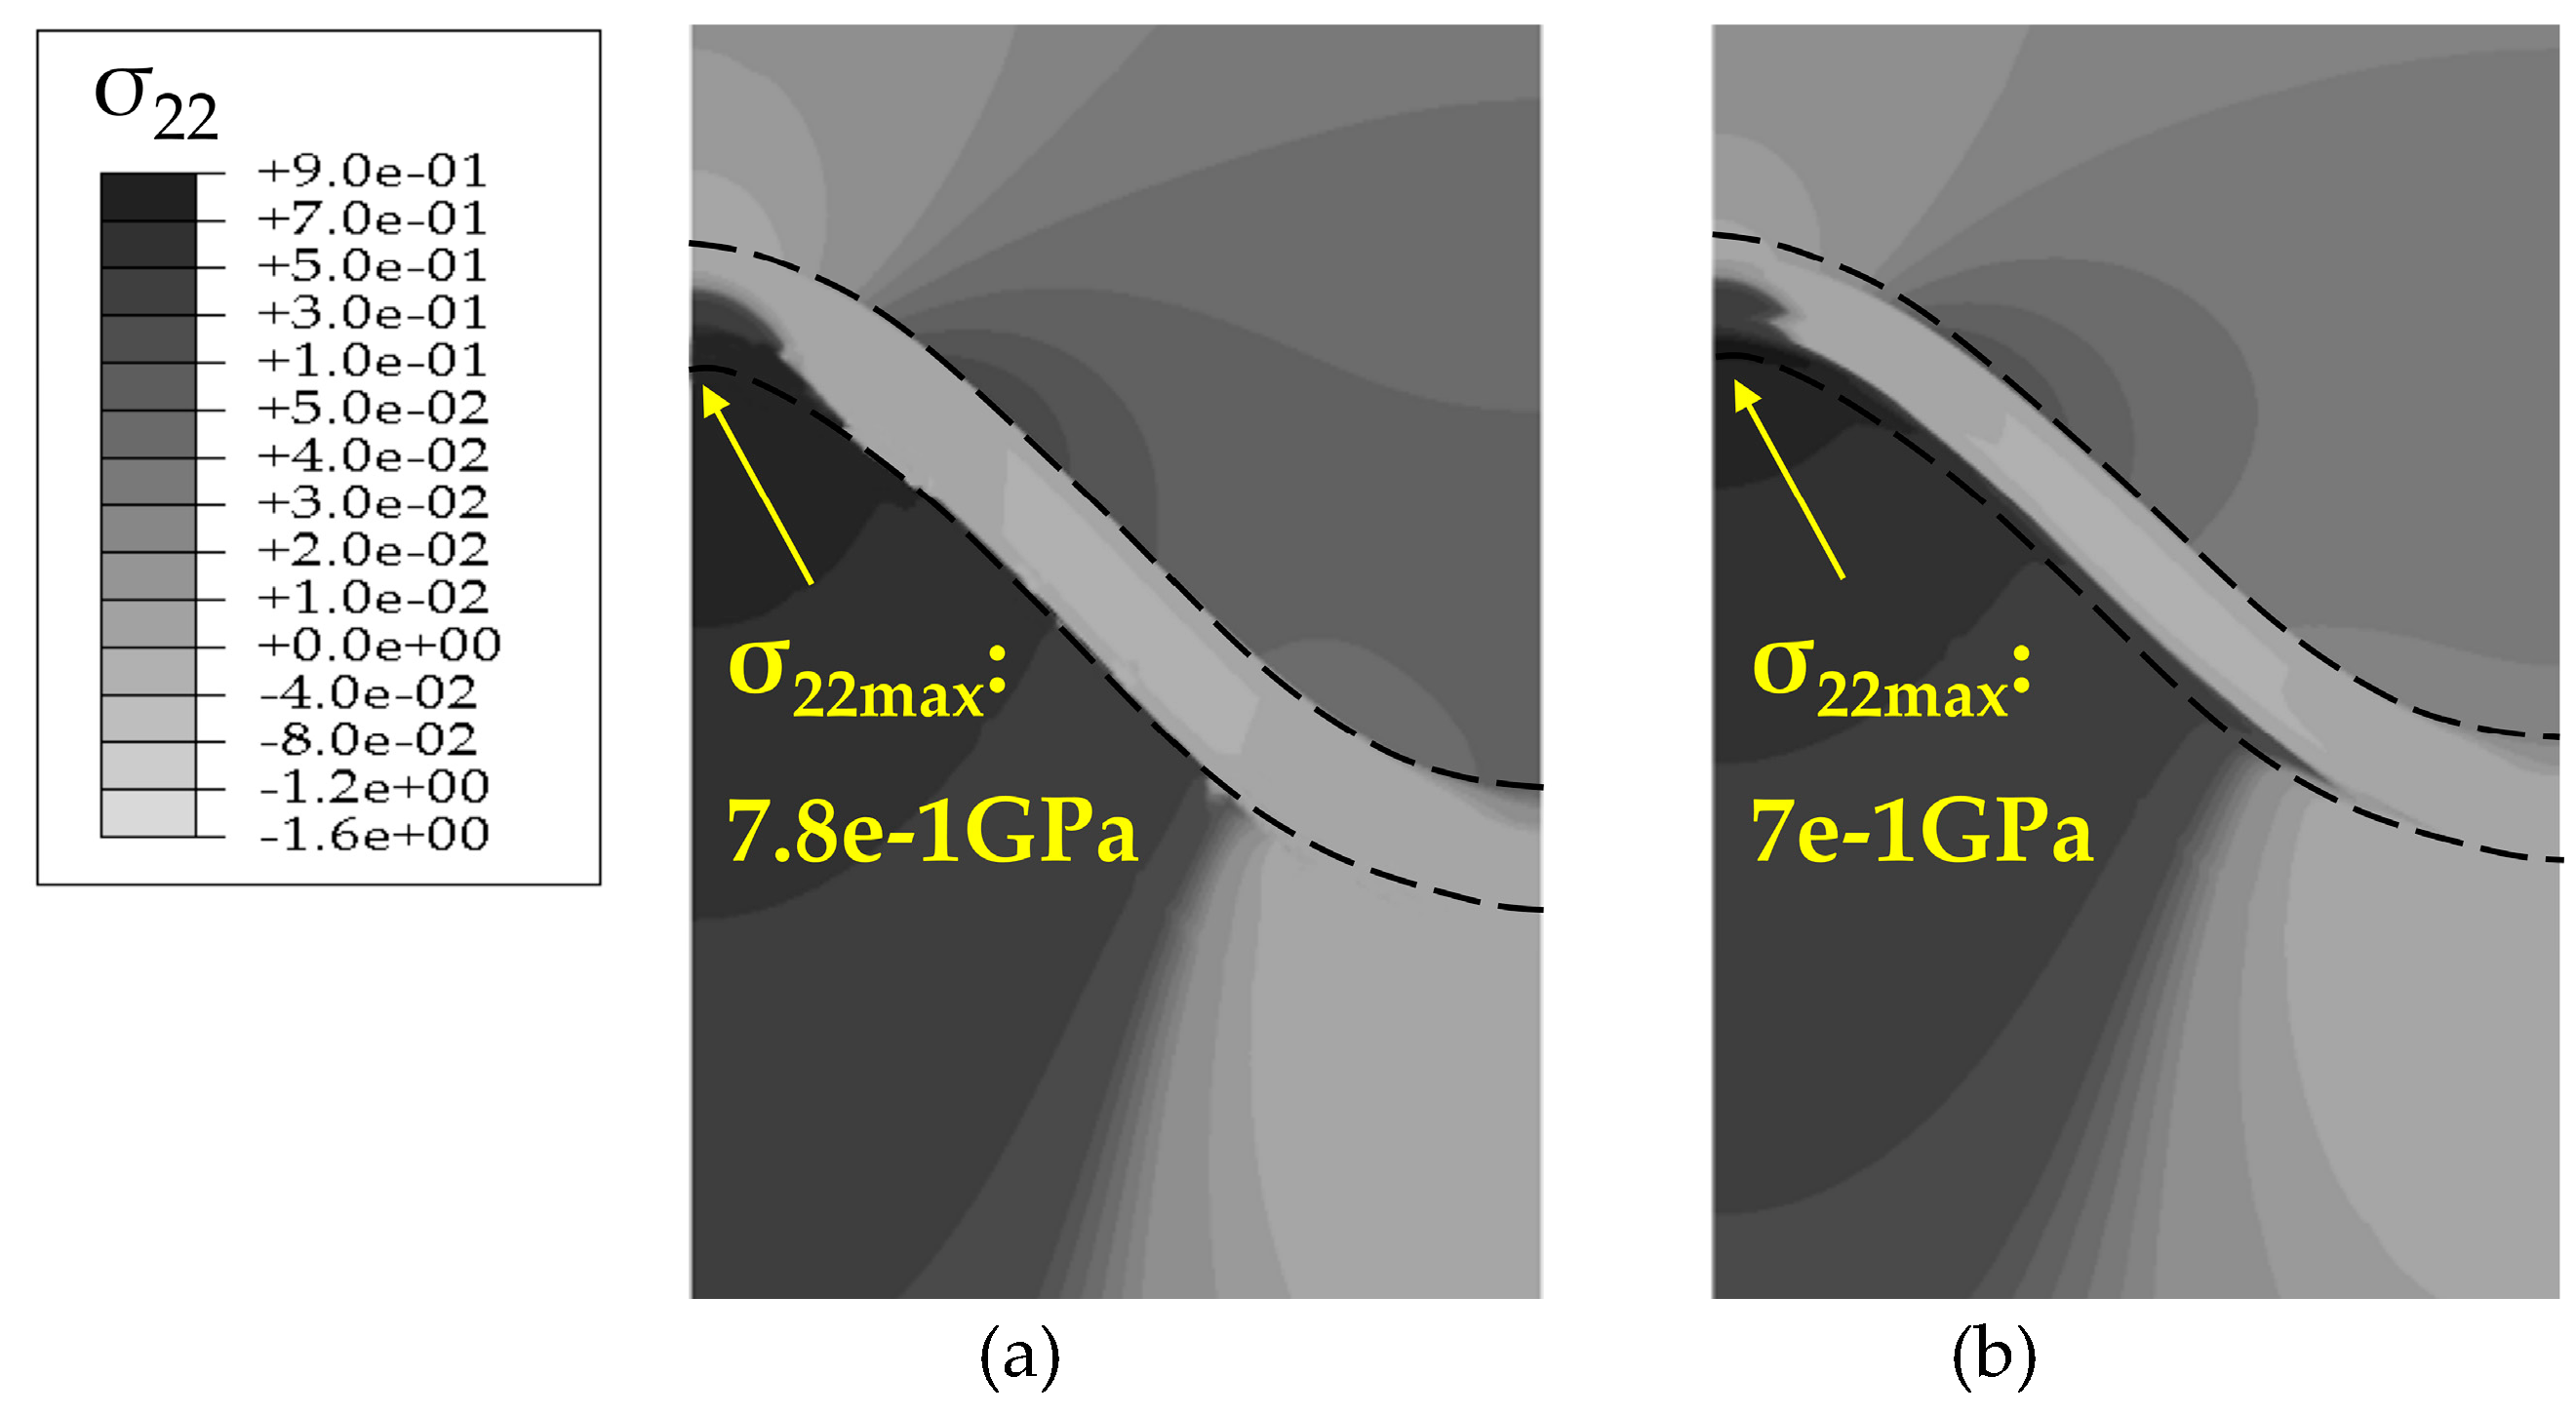
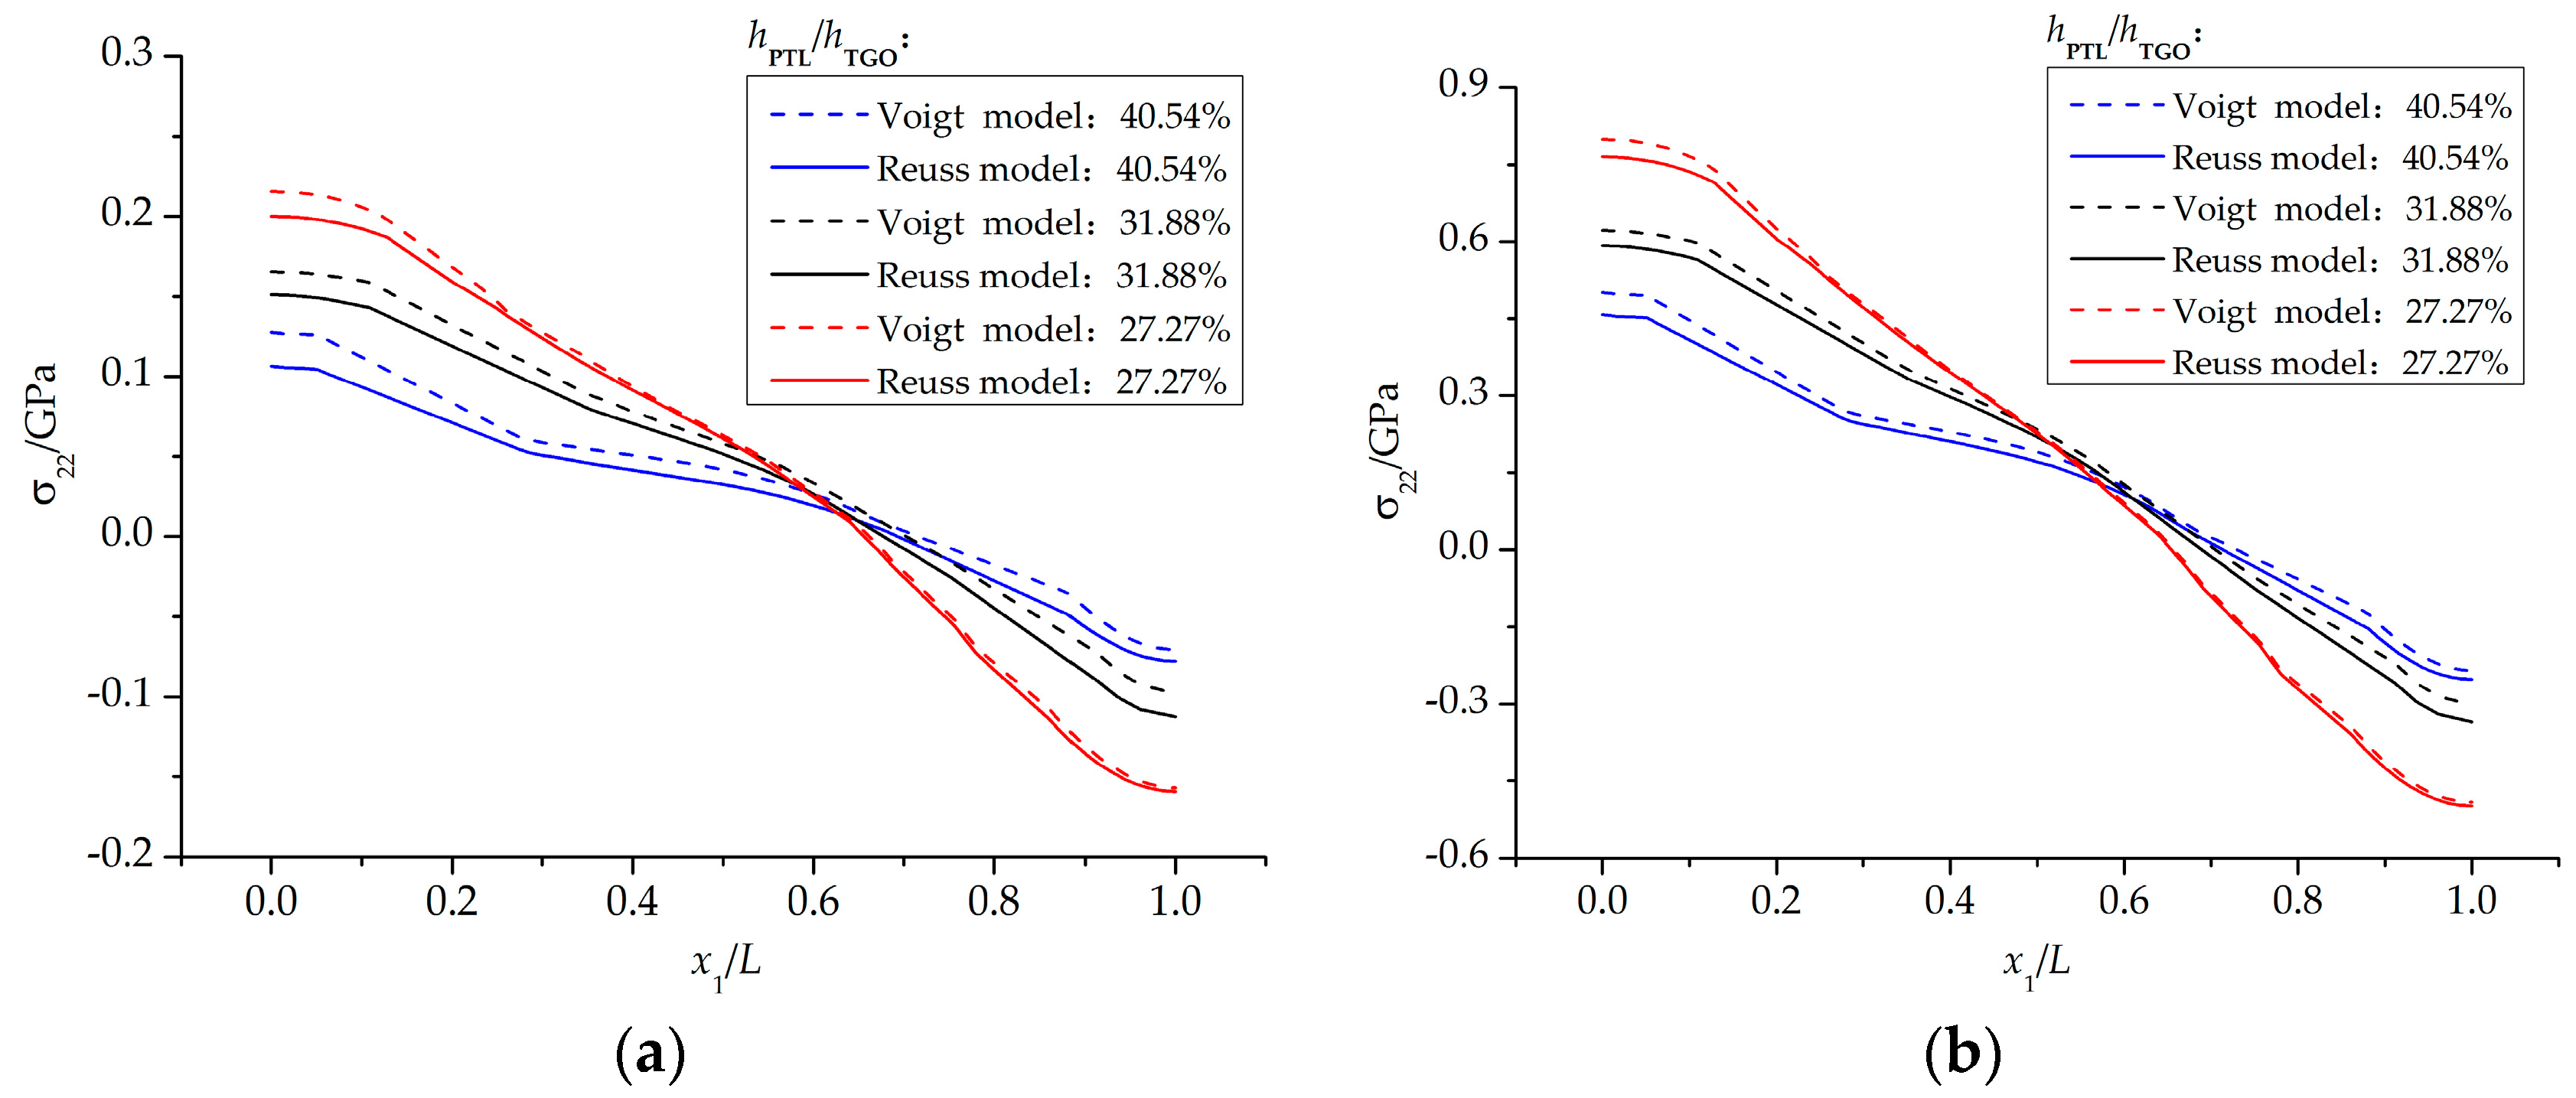
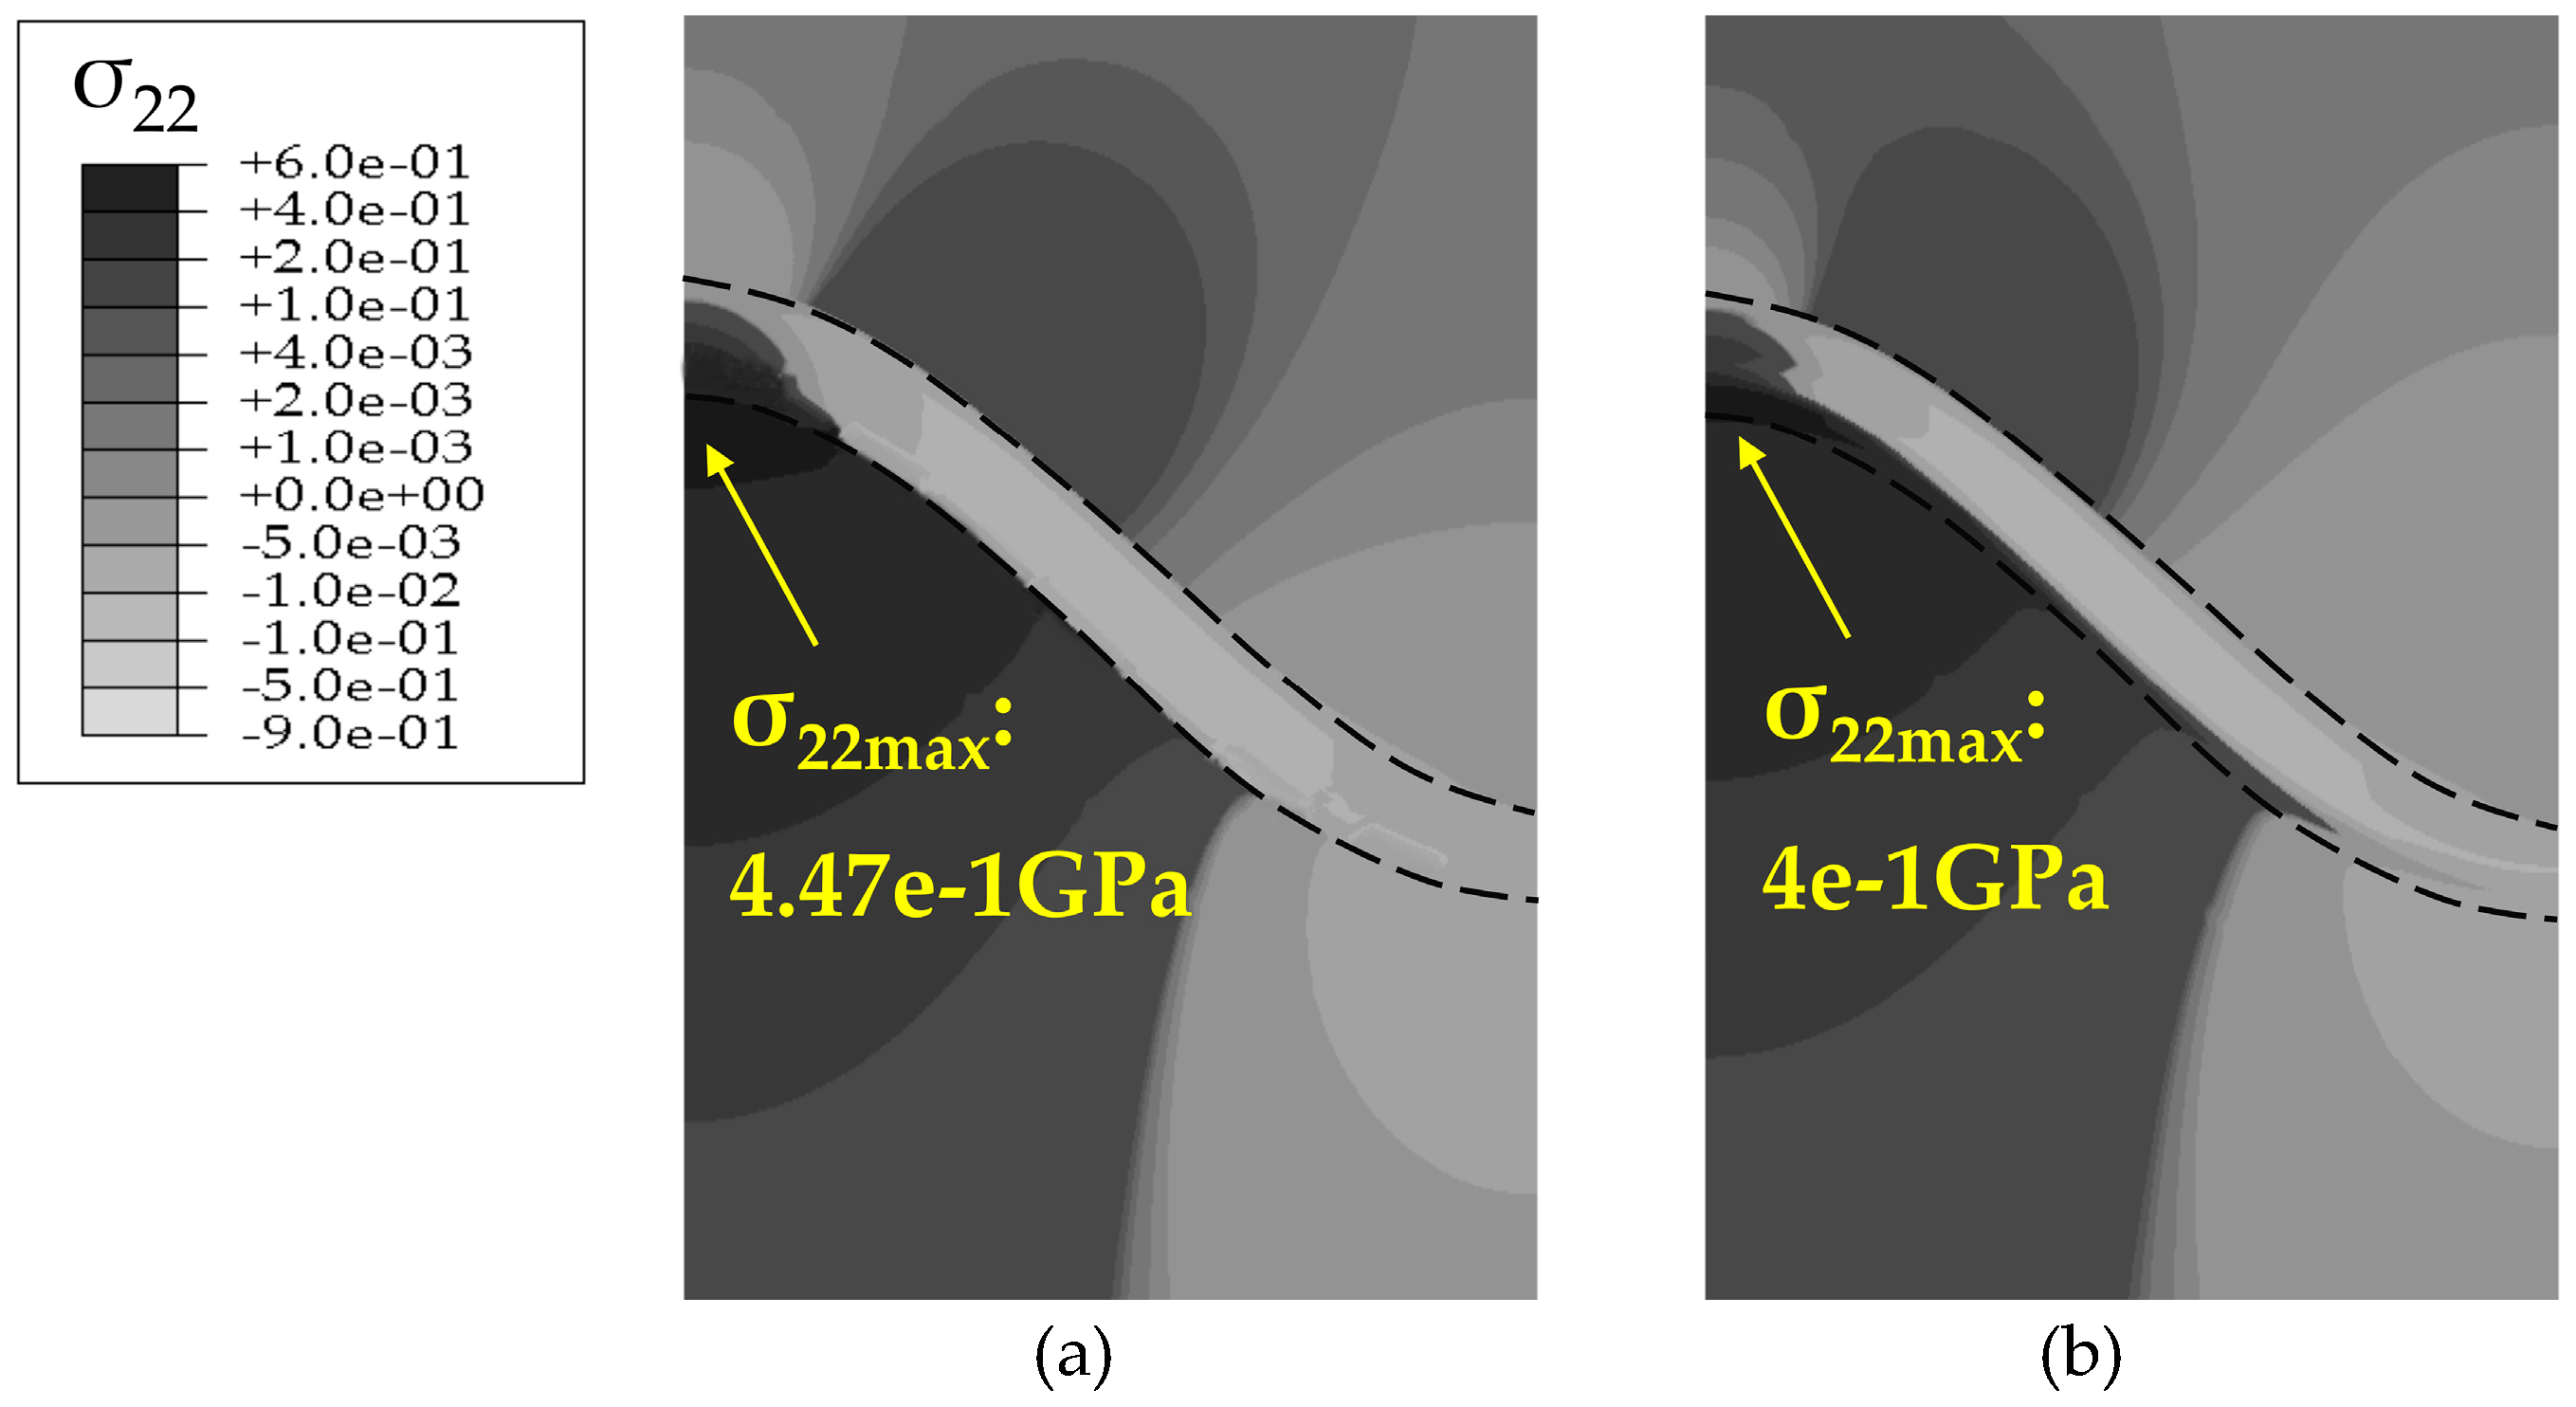
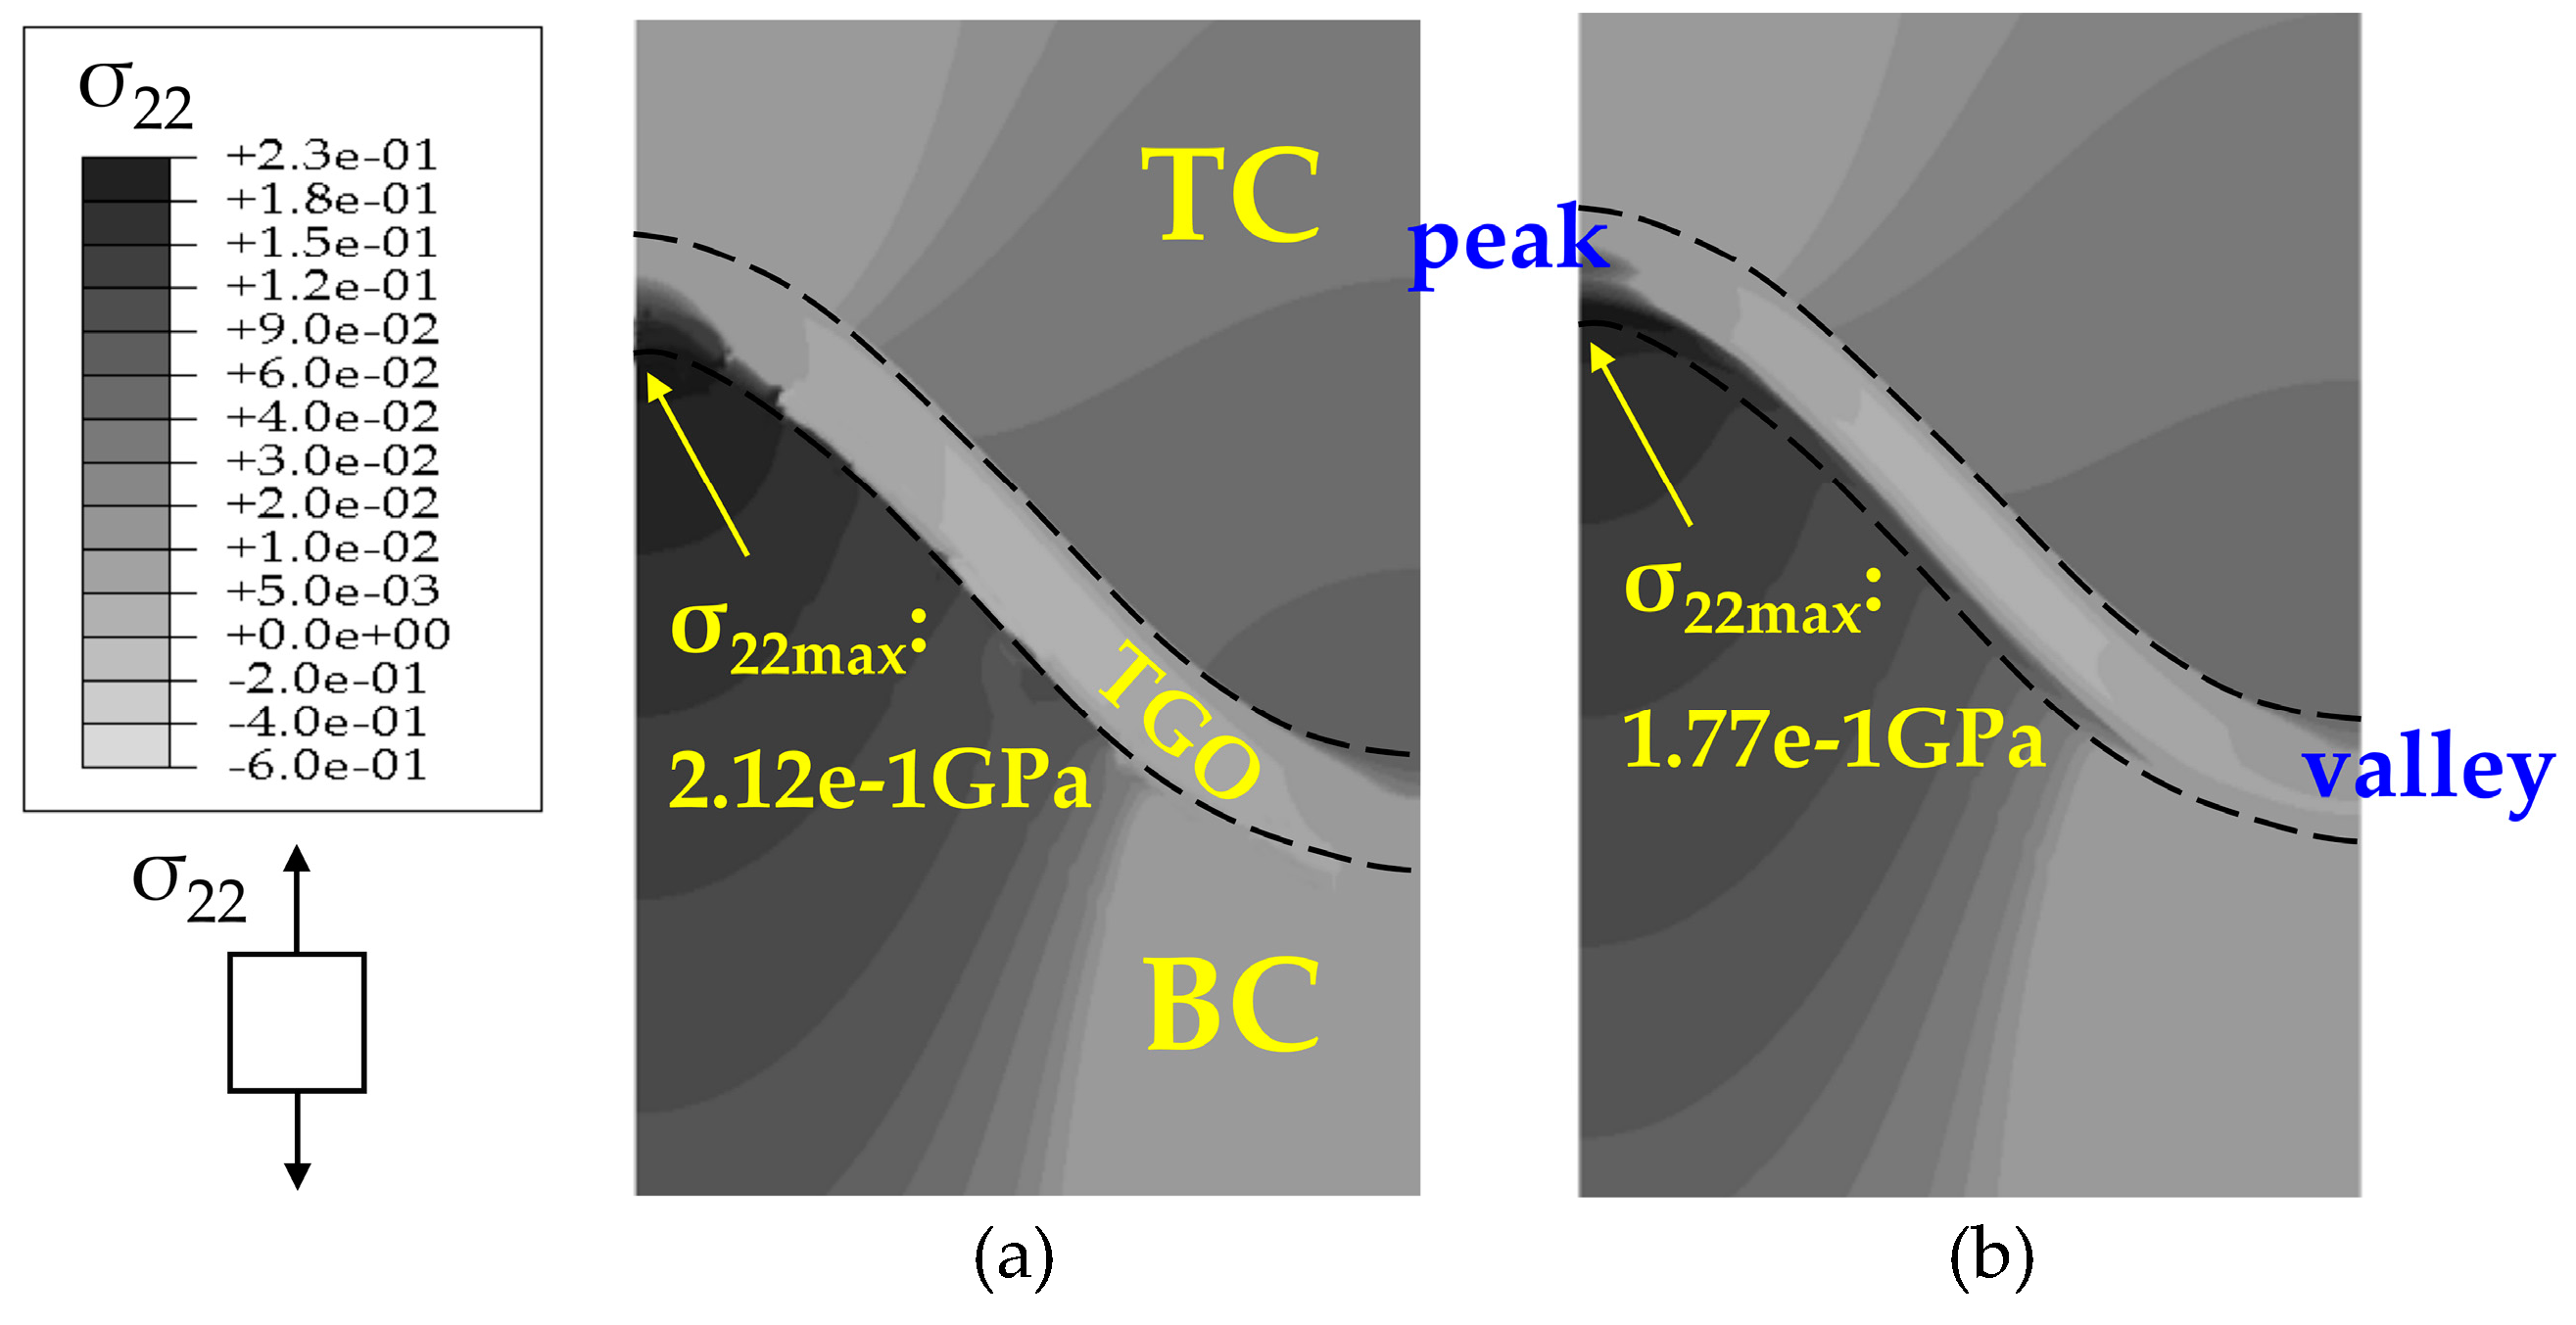
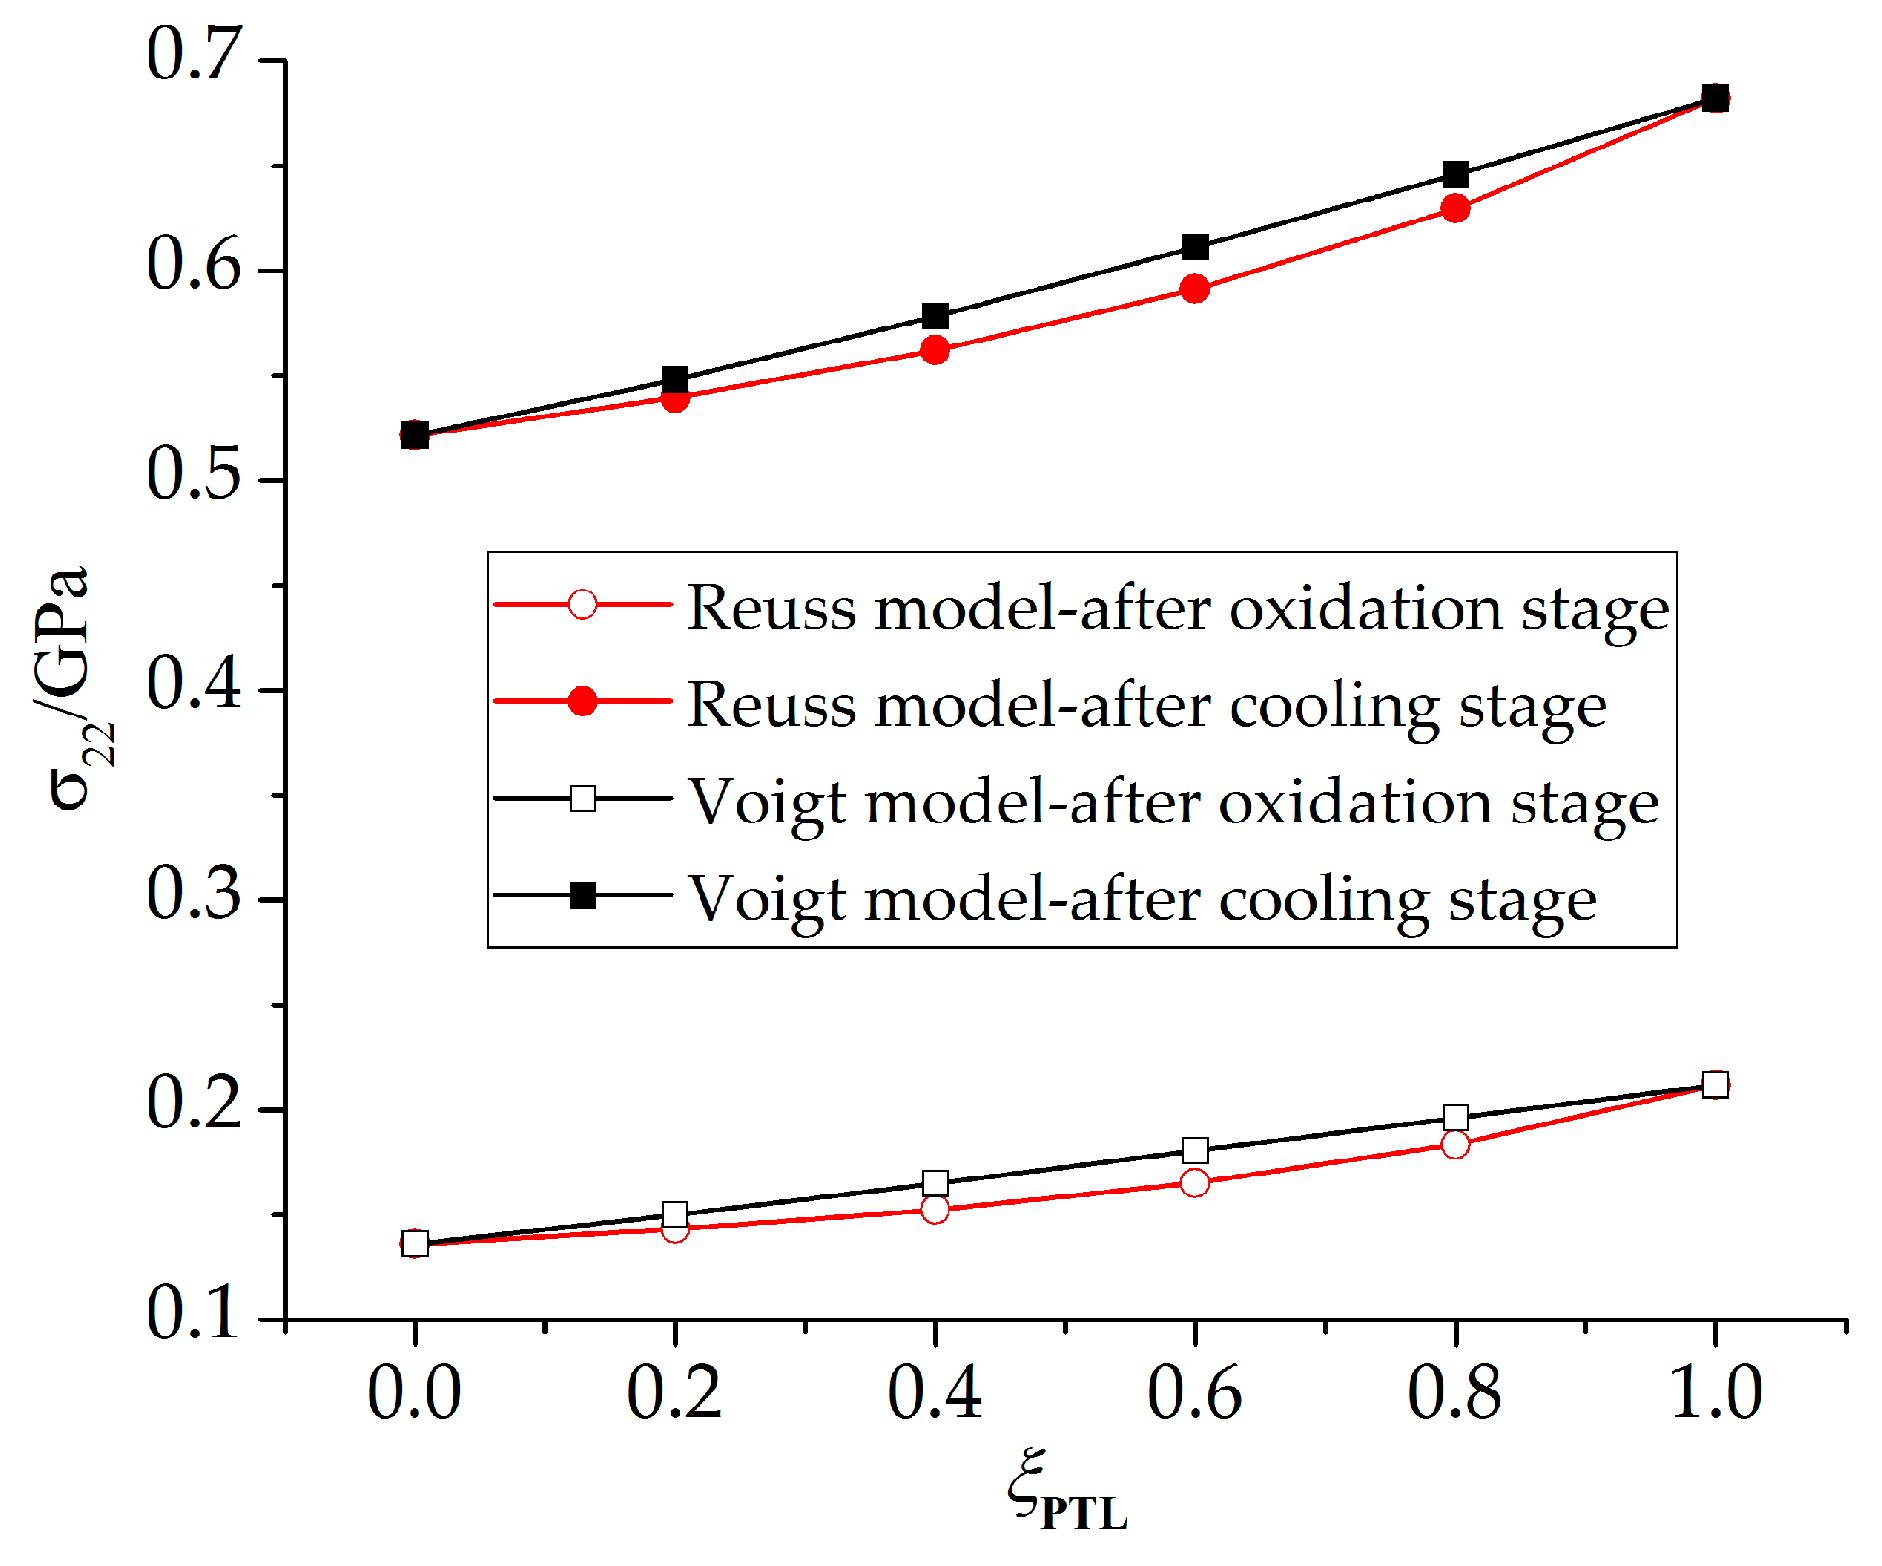
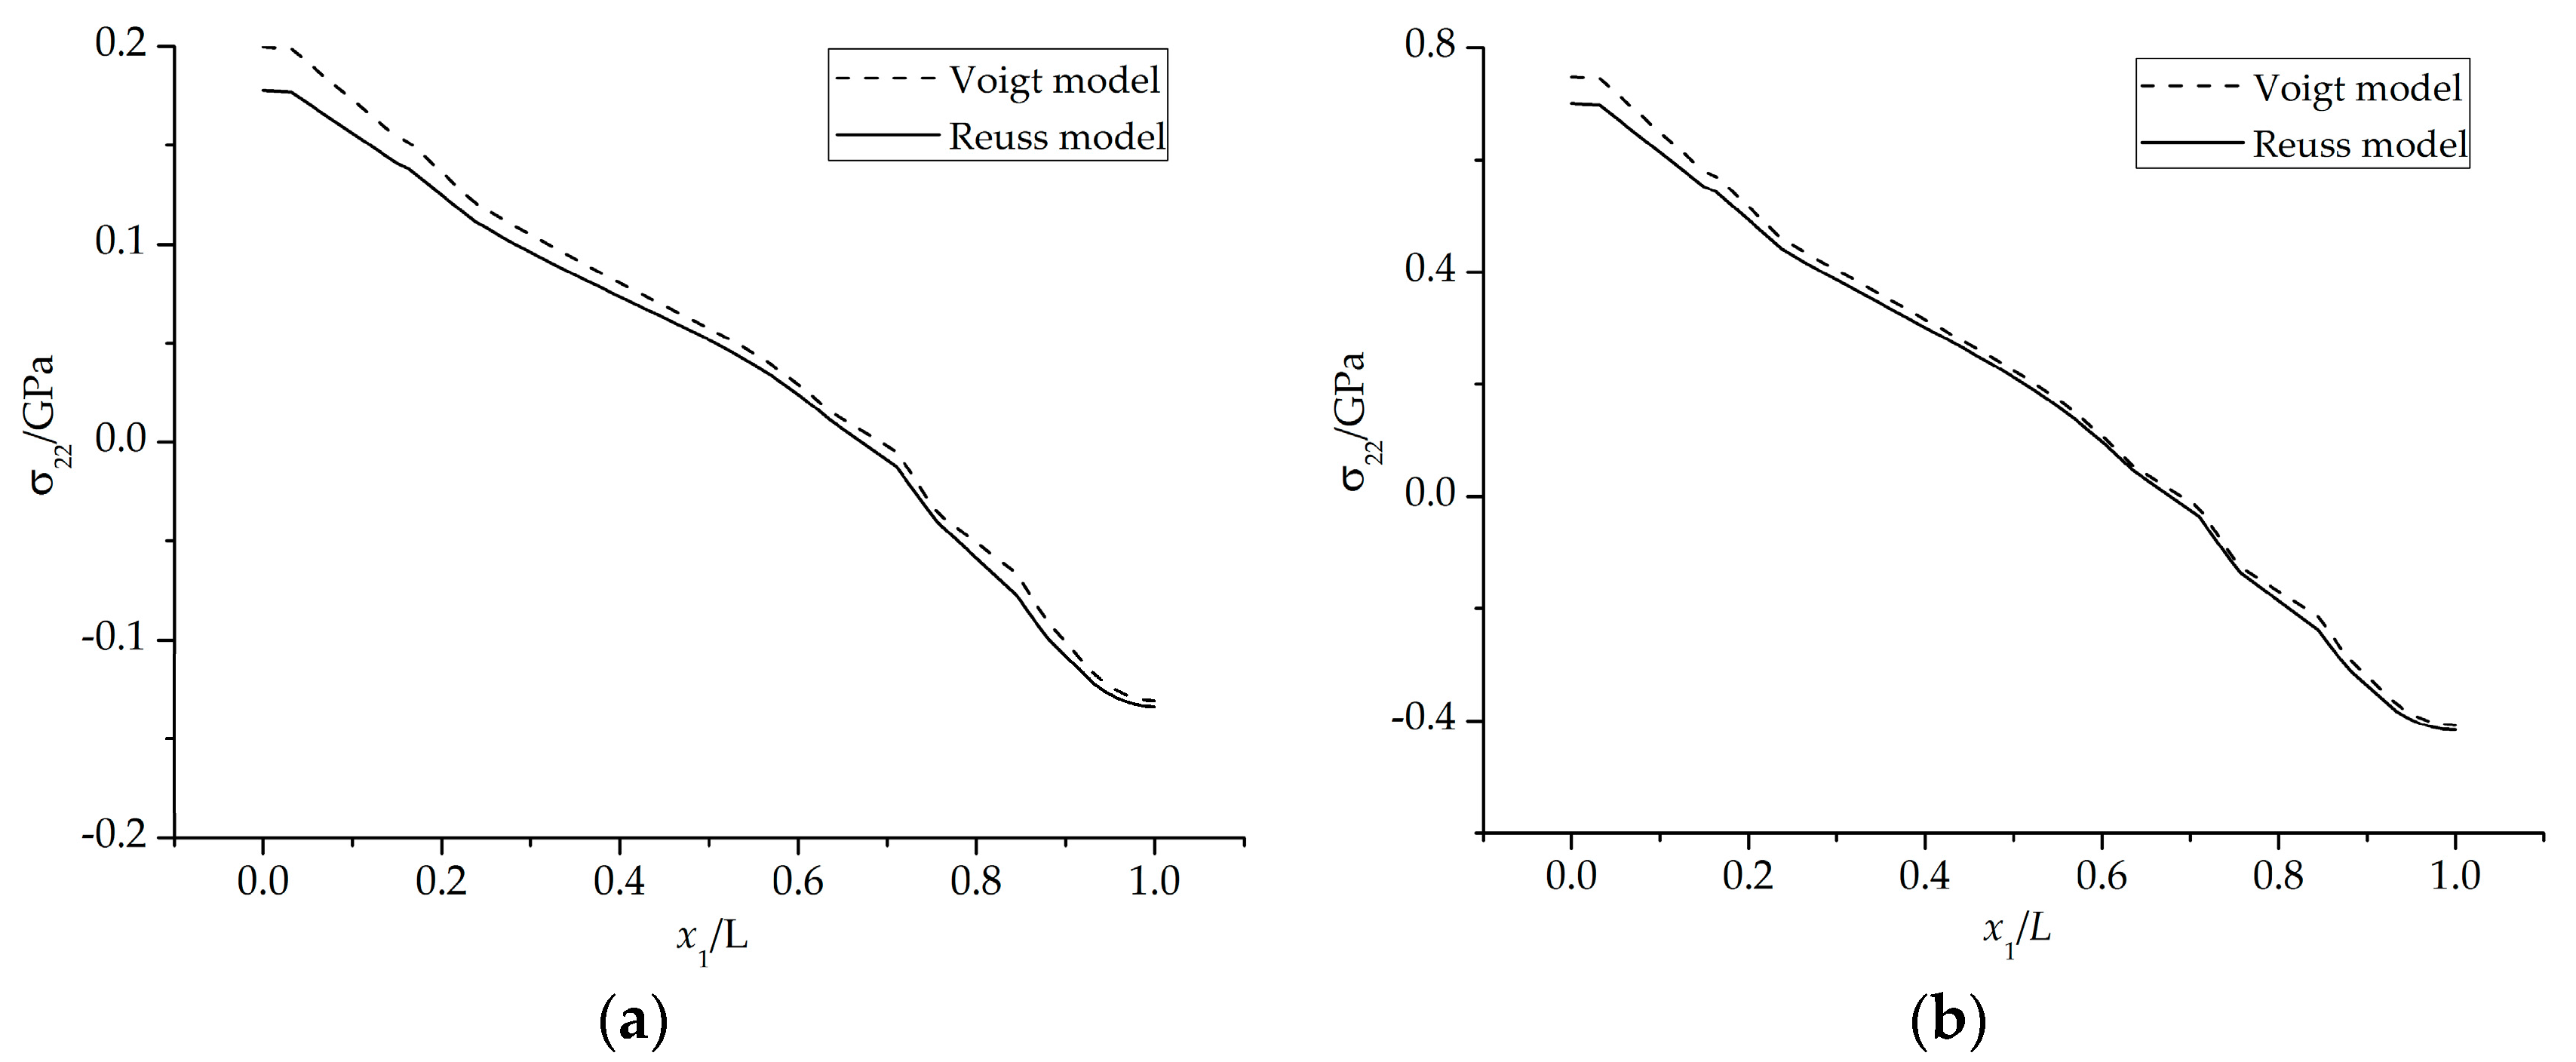
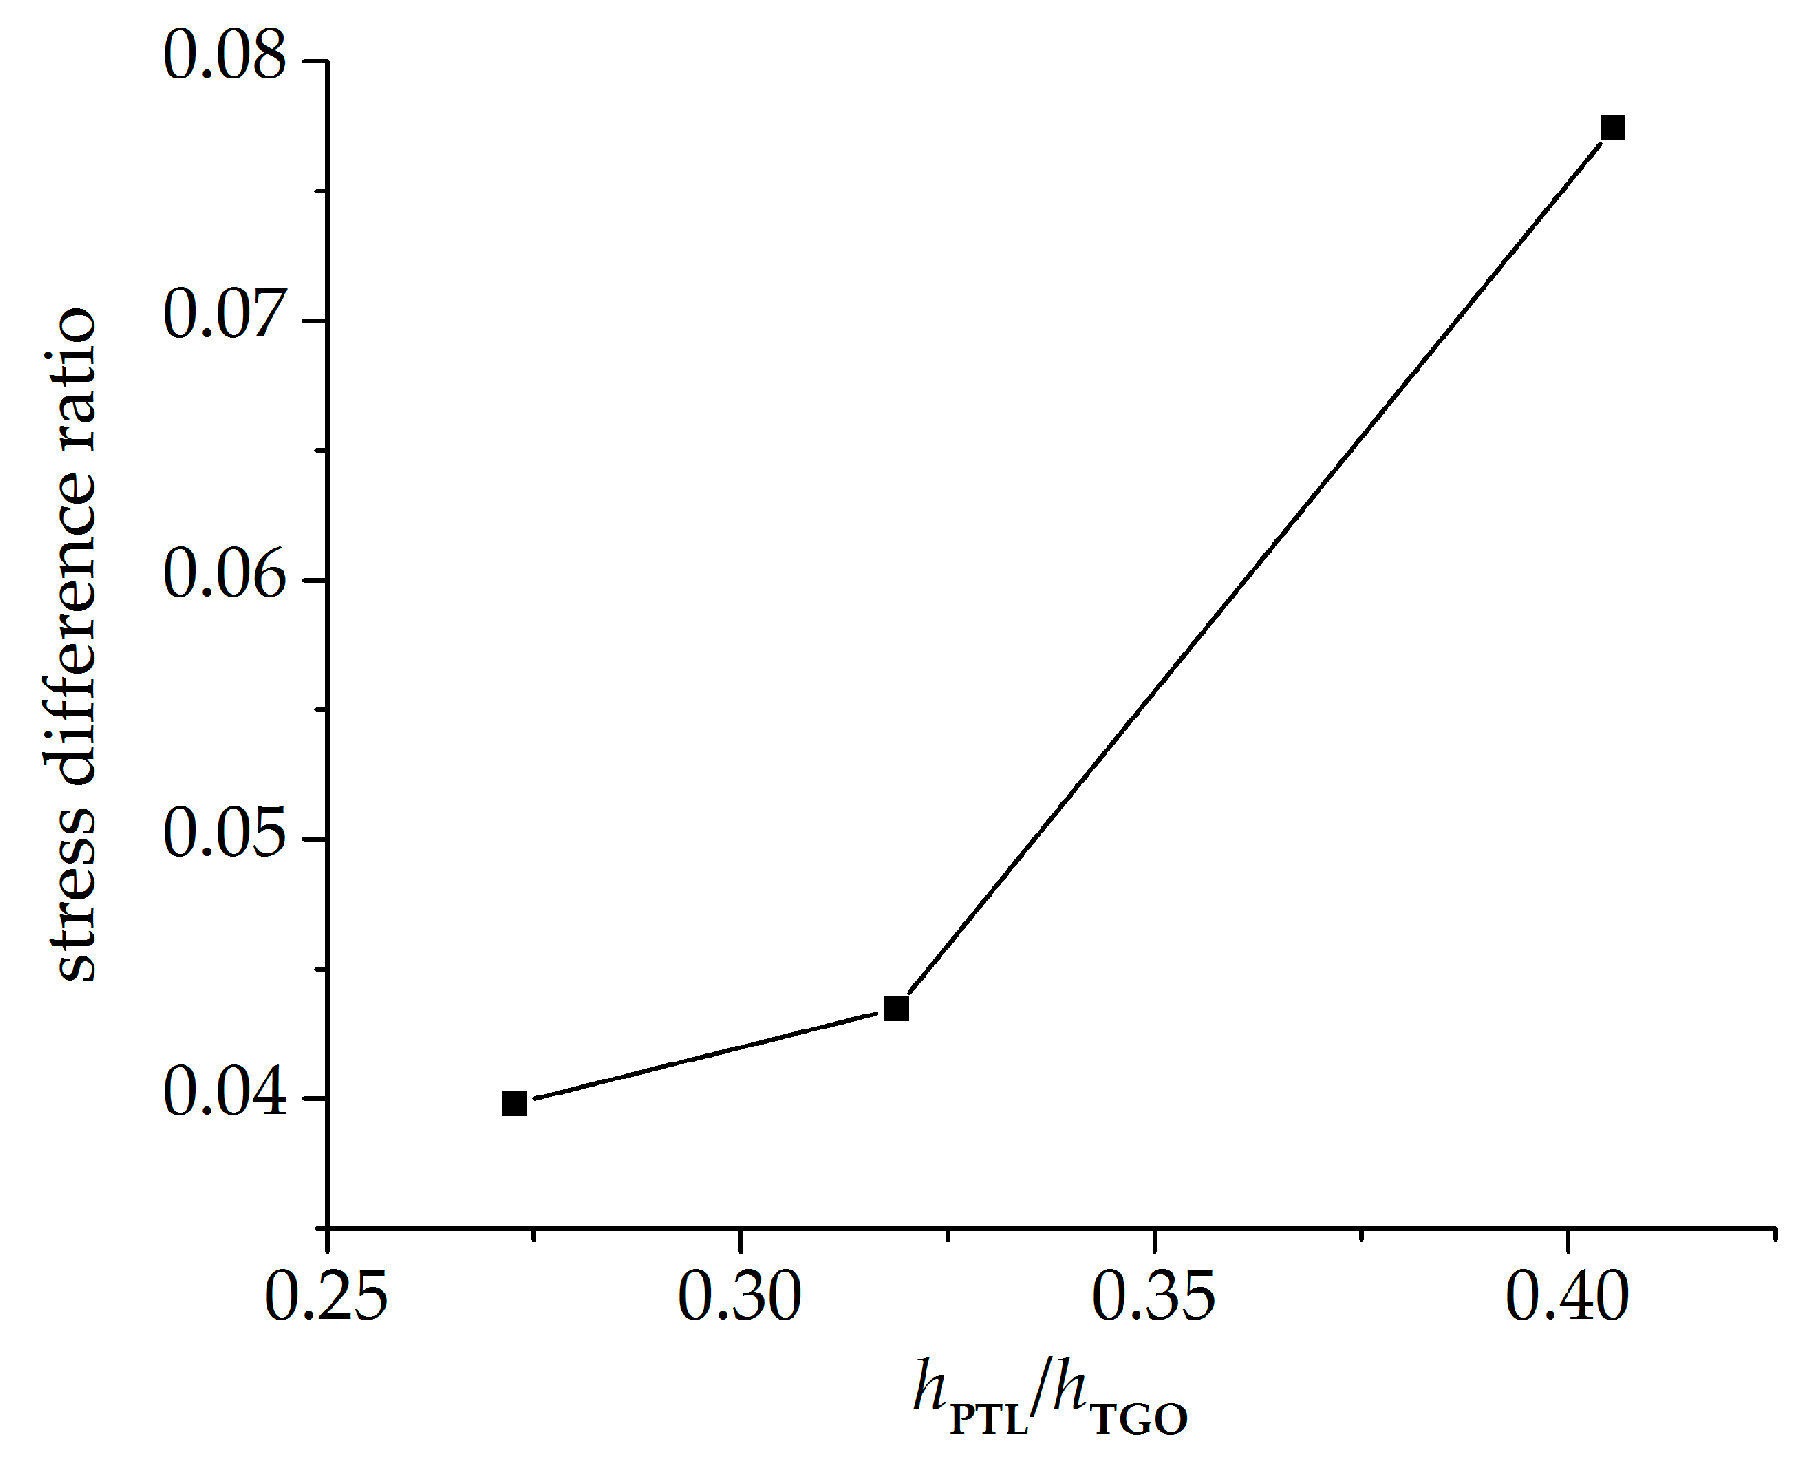
4.2. Stress State in the Phase Transition Layer

In this part, the influence of the presence of PTL on the stress state in TBCs is firstly investigated. Then, the stress states in the PTL with the constitutive equations based on the Reuss and Voigt models are studied, respectively. As the stress in x2 direction is one of the main factors leading to TBCs crack, this work is mainly aimed at exploring the stress component σ22 in TBCs.
The stress states based on the Reuss model after 200 h oxidation are summarized in Figure 7 and Figure 8. The development of stress σ22 at the high temperature of 1100 °C is induced by the deformation associated with TGO growth. At the oxidation stage, the volume expands as the TGO forms, thus, a considerable compressive growth stress generates in the TGO layer during oxidation, leading to the out-of-plane displacement of the TGO layer. This out-of-plane displacement enhances the wrinkle of the TGO layer. On one hand, the upward bulging deformation in the peak region (as shown in Figure 7) of the TGO layer causes compression on the TC-TGO interface, as well as tension on the BC interface while, on the other hand, downward extruding deformation in the valley region of TGO layer produces the opposite effect on stress development. Thus, tensile stress accumulates at the peak of the PTL, and compressive stress at the valley of the PTL [13]. During the cooling stage, there are three factors affecting the interface stress generation, usually considered is the mismatch of thermal expansion coefficient (CTE) among TC, TGO, and BC layers Since the CTE of TGO layer is the smallest in these three layers, deformation compatibility among TC, TGO and BC layer induces compressive stress in TGO layer [20]. Then, the difference to the CTE of the substrate causes further shrink deformation of the TGO in the x1 direction [21]. Associated with the temperature dependence of the Young’s modulus [17], the compressive stress in the TGO layer are further amplified, which enhances the out-of-plane displacement of TGO. Consequently, the significant change in the magnitude of interface stress will be observed in Figure 8.
With the same TGO thickness, comparisons of stresses without PTL and with PTL are made, as shown in Figure 7 and Figure 8. Figure 7a and Figure 8a are the models without PTL (i.e., hPTL = 0, see Figure 3), which is with the assumption that the Al2O3 dimensionless molar fraction in the PTL ξPTL = 1, so the PTL disappears totally and converts to be the Al2O3 layer, while the TGO with PTL in Figure 7b and Figure 8b consist of the the Al2O3 layer and the PTL (i.e., hPTL > 0, see Figure 3). Therefore, the equivalent Young’s modulus without the PTL (ξPTL = 1) is larger than that with the PTL (0 < ξPTL < 1). As a result, the stresses without the PTL appear larger, as illustrated in Figure 7 and Figure 8.
To study the effect of the PTL on the stress state in detail, more calculations are conducted with ξPTL valuing 0, 0.2, 0.4, 0.6, 0.8, 1. The maximum stresses at the peak position are extracted, as shown in Figure 9. The results show that as ξPTL increases, the stresses based on the Voigt model increase linearly, while the stresses based on the Reuss model increase non-linearly, and the stresses based on the Voigt model are higher than those based on the Reuss model. As in [12], in the two-phase composite materials, the equivalent Young’s modulus based on the Voigt model represents the upper bound among various homogenization models in a linear manner, while the equivalent Young’s modulus based on the Reuss model is non-linear and shows the lower bound.
From the above results, it can be found that as an Al2O3 and Al co-existent layer, the PTL affects the stress states in TBCs. In the following part, the stresses in the PTL based on the Reuss and Voigt models will be further investigated.
The stresses component σ22 on the interface with ξPTL = 30% in the PTL are plotted in Figure 10. The horizontal axis origin is set to be the point on the finite element model where x1 = 0 and x2 = 0 (see Figure 4), and x1 represents the coordinate values of the points on the above interface in x1 direction and L is the length of the FE model. It is found that the stresses based on the Reuss and Voigt models have very similar distribution form but different values. The stresses based on the Voigt model is generally higher than those of Reuss model. The reason lies in that, among the homogenization models, the Voigt and Reuss models represent the upper and lower bound, which demonstrates that the equivalent Young’s modulus is the largest obtained by the Voigt model, while the smallest is by the Reuss model under the same volume fraction of inclusions. Therefore, under the same growth strain of TGO, the stresses based on the Voigt model are larger.
However, due to the very thin PTL, the stress difference caused by the two constitutive equations mentioned above is generally very small. In the following part, more numerical calculations are conducted to explore the effect of the PTL growth on stress development. Different phase transition proportions hPTL/hTGO coming from Figure 6 are applied in this section. The stresses on the interface of ξPTL = 30% under three phase transition proportions (hPTL/hTGO = 27.27%, 31.88%, and 40.54%) are shown in Figure 11. A small hPTL/hTGO means that the Al2O3 layer takes a large part of the TGO layer, so the equivalent Young’s modulus is larger. As a result, the stresses on the interface become greater with a decreasing hPTL/hTGO. Moreover, due to the CTE mismatch among TBCs and the effect of substrate shrink on the further deformation of TGO, the stresses on the interface after the cooling stage are higher than those during oxidation stage. Figure 12 presents the stress difference caused by the Voigt-based and the Reuss-based constitutive equations with different phase transition proportions. Here, representative points with the maximum tensile stress on the interface under three phase transition proportions are selected. It is shown that on the case of hPTL/hTGO = 40.54%, the difference of stresses caused by the two constitutive equations seems the biggest, and gets smaller with decreasing hPTL/hTGO. Accordingly, under larger PTL thickness in the TGO layer, the effect of different constitutive relationships of PTL on the interface stress difference is more evident.
To disentangle the effects of TGO growth duringthe oxidation stage, more calculations are made assuming a stress-free state at the end of oxidation stage, and stresses on the cooling stage are paid attention. The influence of the PTL on the stress state is investigated. A comparison of stresses with PTL and without PTL is made as shown in Figure 13. As discussed above, the stress without PTL (ξPTL = 1) is higher due to the larger equivalent Young’s modulus. As well, the cooling stresses based on the Reuss and Voigt models with ξPTL variation are obtained, as shown in Figure 14. The stresses based on the Voigt model show increasing linearly as ξPTL increases, while showing a non-linear increase based on the Reuss model, which is consistent with the results that considering the effect of TGO growth during oxidation stage, as shown in Figure 8. Furthermore, the stresses without the effect of TGO growth in Figure 14 are lower than with the effect of TGO growth. Finally, it shows that with the thickness ratio of the phase transition layer in the TGO increasing, the stress difference caused by different constitutive models gets larger, as illustrated in Figure 15.

5. Conclusions

This work studies the stress development in the phase transition layer. Based on a diffusion-oxidation reaction model and the Reuss model-based constitutive equation, a user-defined subroutine in finite element ABAQUS code is developed. Numerical calculations have been conducted to study the effect of oxygen diffusion on the growth of the phase transition layer. Meanwhile, the stresses in the PTL with the constitutive equations based on two limiting homogenization methods— the Voigt model and the Reuss model—are also investigated, respectively. A further numerical analysis is then carried out to explore the influence of the phase transition growth states on the difference of stresses caused by different constitutive equations, which may provide a reference for further research on the stress development in TBCs. The results show that:
  • A large oxygen diffusion coefficient increases the oxidation rate of metal material in the phase transition layer, and leads to a smaller part of the PTL taking part in the TGO thickness.
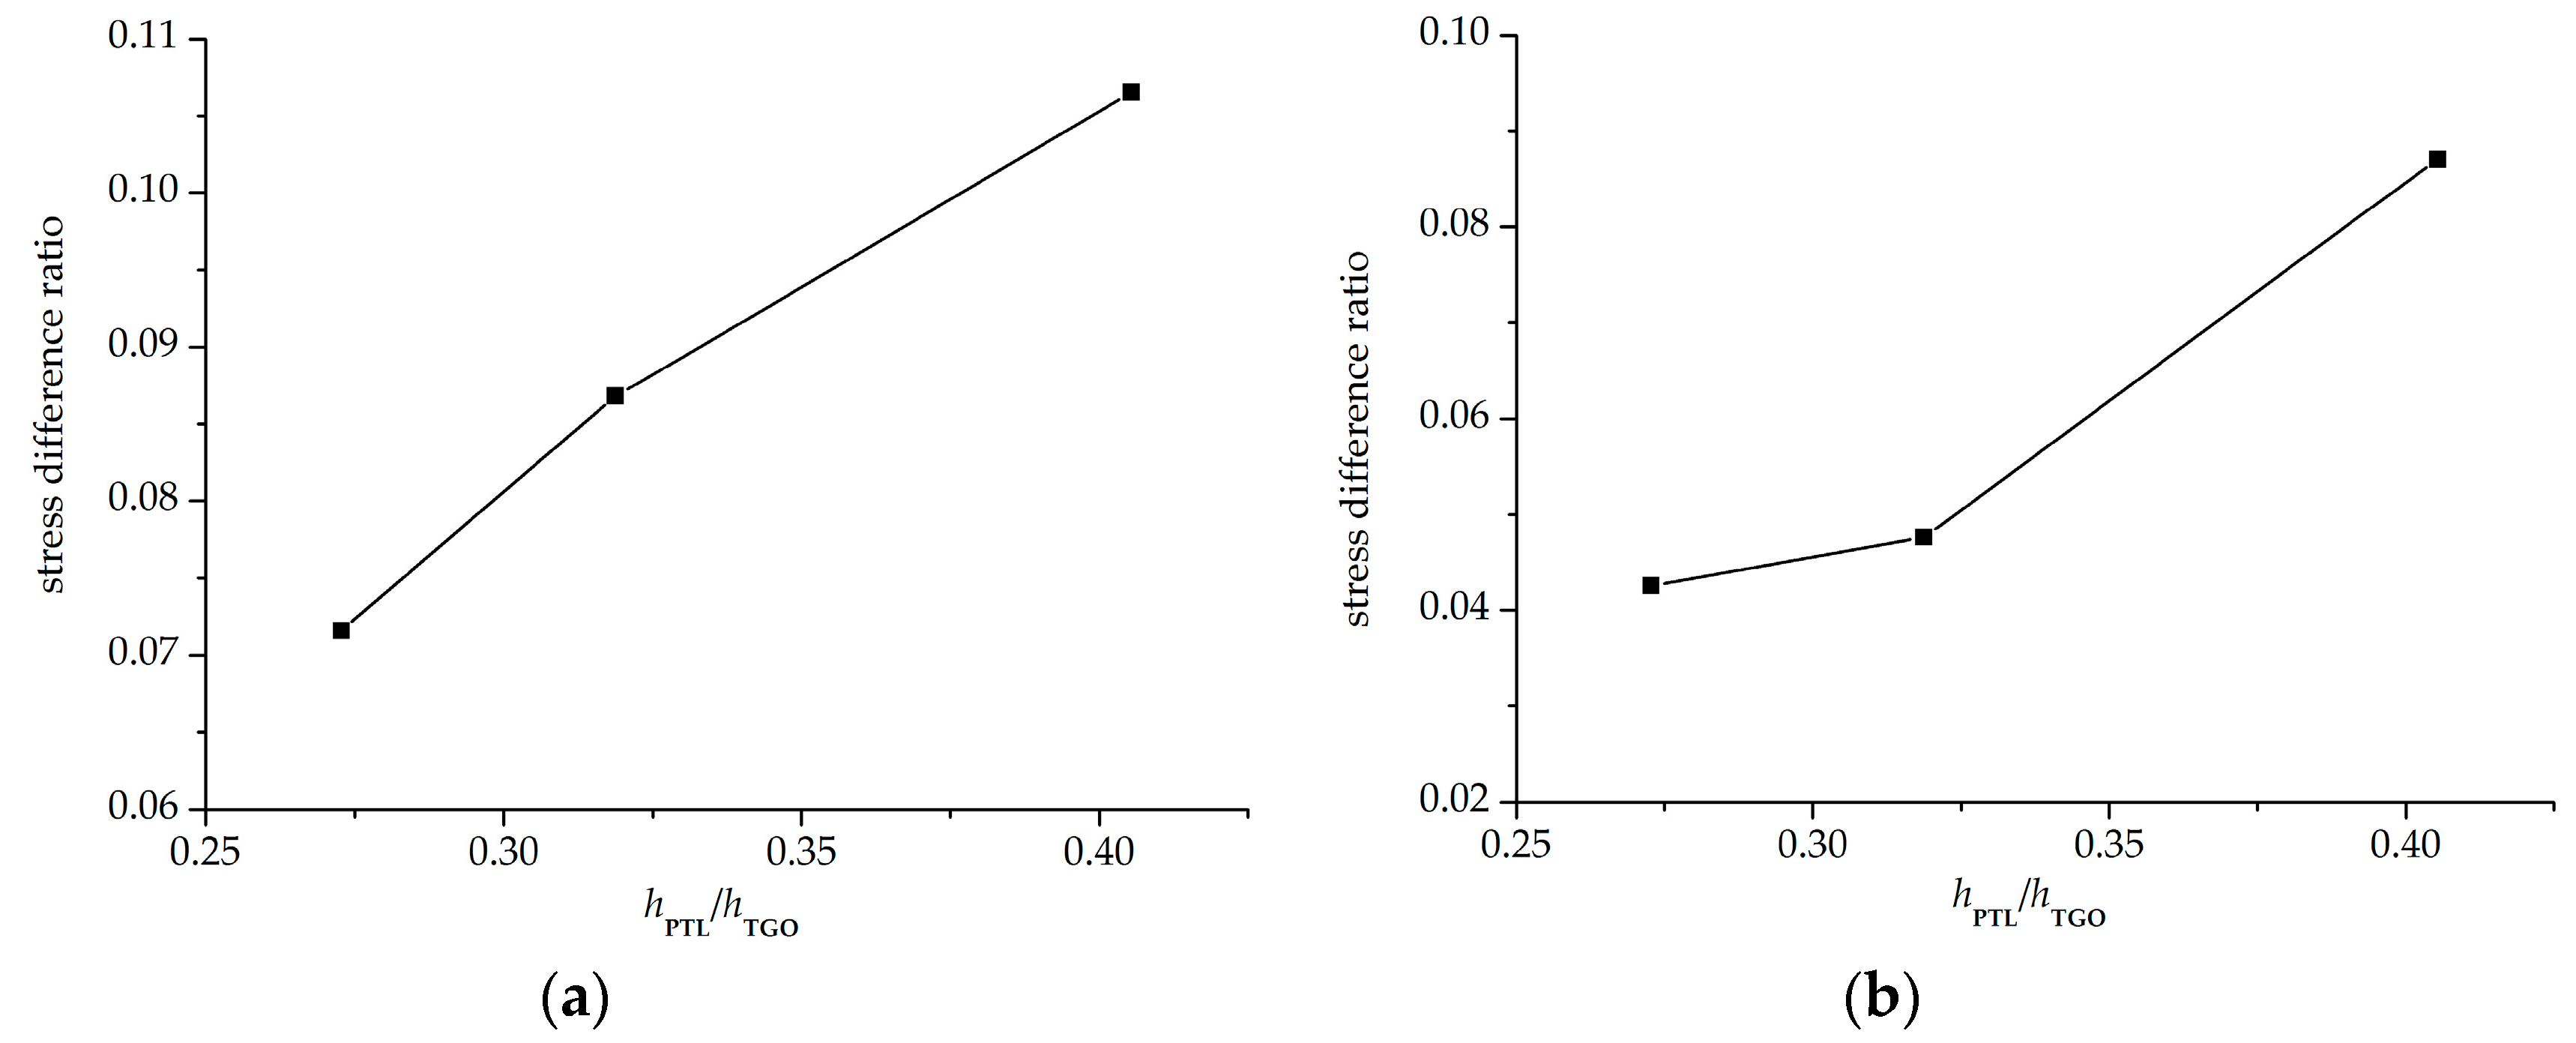
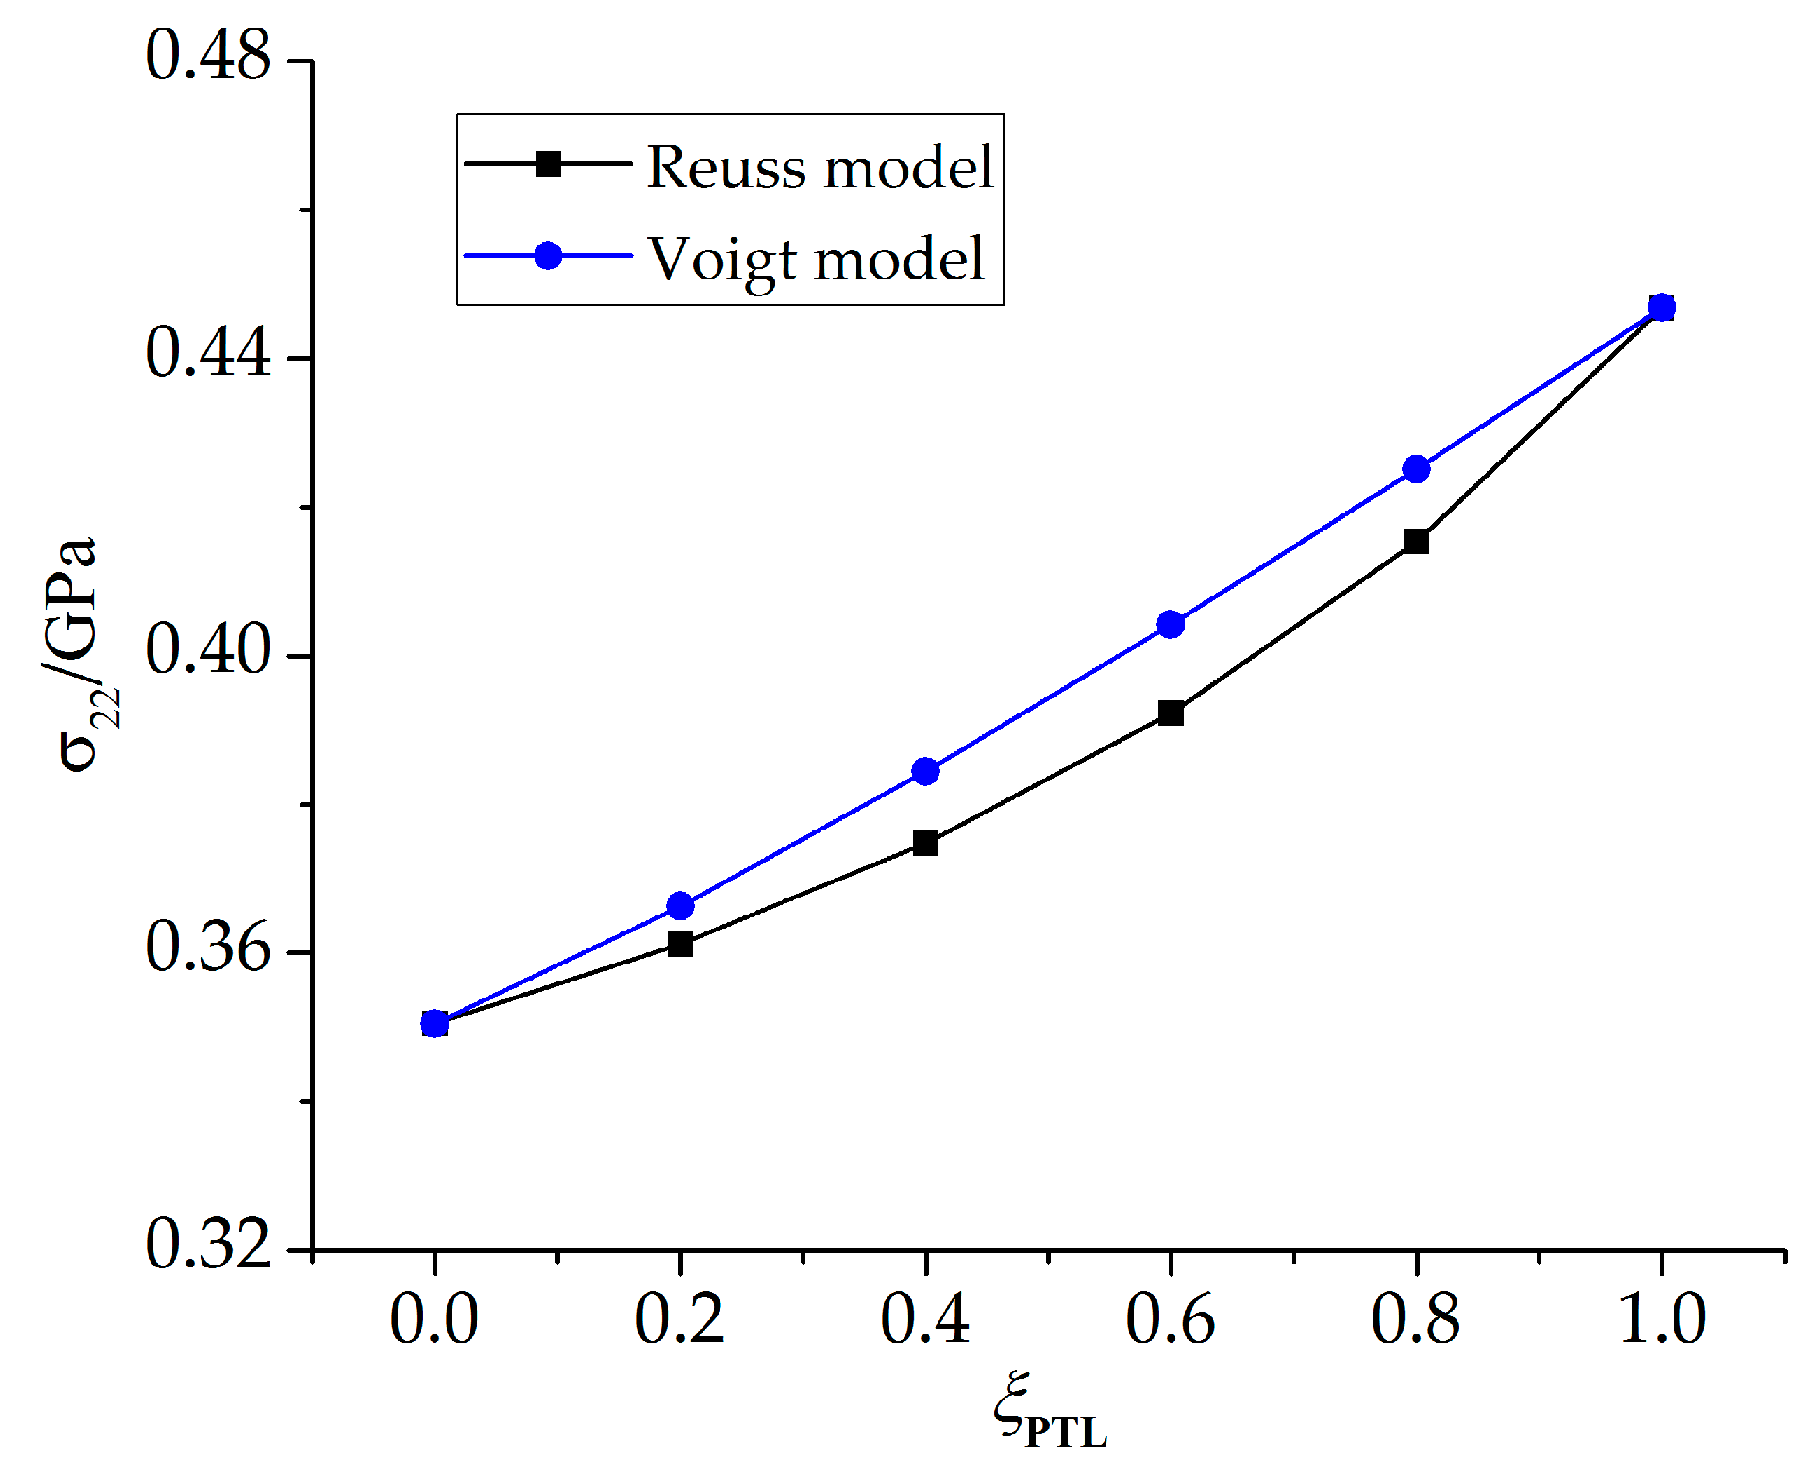
  • The stresses in the PTL based on the Reuss model are slightly smaller than those of the Voigt model. With the Al2O3 dimensionless molar fraction in the PTL ξPTL increasing, the stresses based on the Voigt model increase linearly, while the stresses based on the Reuss model increase non-linearly. Meanwhile, with the thickness ratio of phase transition layer in the TGO increasing, the stress difference caused by different constitutive models becomes more evident.
This study investigates the influence of different constitutive models on stress prediction in TBCs, with the assumption that the TC, TGO, and BC layers are all considered as linear elastic materials. Further research may consider a material’s non-linear (i.e., plastic and creep) behavior in studying the influence of constitutive models on stress prediction.

Acknowledgments

This work is financially supported by National Basic Research Program of China (2013CB035704) and Natural Science Foundation of China (11472206).

Author Contributions

Yueming Li conceived the task; Chen Lin and Yijun Chai developed the ABAQUS code; Yijun Chai conducted all the numerical calculations and wrote the paper; Yueming Li and Xian Wang provide the guidance to write the paper.

Conflicts of Interest

The authors declare no conflict of interest.

References

  1. Beele, W.; Marijnissen, G.; van Lieshout, A. The Evolution of Thermal Barrier Coatings-Status and Upcoming Solutions for Today’s Key Issues. Surf. Coat. Technol. 1999, 120, 61–67. [Google Scholar] [CrossRef]
  2. Vaßen, R.; Jarligo, M.O.; Steinke, T.; Mack, D.E.; Stöver, D. Overview on Advanced Thermal Barrier Coatings. Surf. Coat. Technol. 2010, 205, 938–942. [Google Scholar] [CrossRef]
  3. Clarke, D.R.; Oechsner, M.; Padture, N.P. Thermal Barrier Coatings for More Efficient Gas-Turbine Engines. MRS Bull. 2012, 37, 891–898. [Google Scholar] [CrossRef]
  4. Padture, N.P.; Gell, M.; Jordan, E.H. Thermal Barrier Coatings for Gas-Turbine Engine Applications. Science 2002, 296, 280–284. [Google Scholar] [CrossRef] [PubMed]
  5. Clarke, D.R.; Phillpot, S.R. Thermal Barrier Coating Materials. Mater. Today 2005, 8, 22–29. [Google Scholar] [CrossRef]
  6. Feuerstein, A.; Knapp, J.; Taylor, T.; Ashary, A.; Bolcavage, A.; Hitchman, N. Technical and Economical Aspects of Current Thermal Barrier Coating Systems for Gas Turbine Engines by Thermal Spray and EBPVD: A Review. J. Therm. Spray Technol. 2007, 17, 199–213. [Google Scholar] [CrossRef]
  7. Pollock, T.M.; Lipkin, D.M.; Hemker, K.J. Multifunctional Coating Interlayers for Thermal-Barrier Systems. MRS Bull. 2012, 37, 923–931. [Google Scholar] [CrossRef]
  8. Miller, R.A. Current Status of Thermal Barrier Coatings—An Overview. Surf. Coat. Technol. 1987, 30, 1–11. [Google Scholar] [CrossRef]
  9. Hille, T.S.; Turteltaub, S.; Suiker, A.S.J. Oxide Grown and Damage Evolution in Thermal Barrier Coatings. Eng. Fract. Mech. 2011, 78, 2139–2052. [Google Scholar] [CrossRef]
  10. Busso, E.P. Oxidation-Induced Stresses in Ceramic-Metal Interfaces. J. Phys. IV France 1999, 9, 287–296. [Google Scholar] [CrossRef]
  11. Busso, E.P.; Lin, J.; Sakurai, S. A Mechanistic Study of Oxidation-Induced Degradation in a Plasma-Sprayed Thermal Barrier Coating System: Part I: Model Formulation. Acta Mater. 2001, 49, 1515–1528. [Google Scholar] [CrossRef]
  12. Doghri, I.; Ouaar, A. Homogenization of Two-Phase Elasto-plastic Composite Materials and Structures: Study of Tangent Operators, Cyclic Plasticity and Numerical Algorithms. Int. J. Solids Struct. 2002, 40, 1681–1712. [Google Scholar] [CrossRef]
  13. Lin, C.; Li, Y.M. Stress Evolution Considering the Combined Creep-Plastic Behavior in Thermal Barrier Coatings. Mater. Des. 2016, 89, 245–254. [Google Scholar]
  14. Ammar, K.; Appolaire, B.; Cailletaud, G.; Forest, S. Combining Phase Field Approach and Homogenization Methods for Modeling Phase Transformation in Elastoplastic Media. Eur. J. Comput. Mech. 2009, 18, 485–523. [Google Scholar]
  15. Evans, H.E. Stress Effects in High-Temperature Oxidation of Metals. Int. Mater. Rev. 1995, 40, 1–40. [Google Scholar] [CrossRef]
  16. Cheng, J.; Jordan, E.H.; Barber, B.; Gell, M. Thermal/Residual Stress in an Electron Beam Physical Vapor Deposited Thermal Barrier Coating Systems. Acta Mater. 1998, 46, 5839–5850. [Google Scholar] [CrossRef]
  17. Rӧsler, J.; Bäker, M.; Volgmann, M. Stress State and Failure Mechanisms of Thermal Barrier Coatings: Role of Creep in Thermal Grown Oxide. Acta Mater. 2001, 49, 3659–3670. [Google Scholar] [CrossRef]
  18. Quested, P.N.; Brooks, R.F.; Chapman, L.; Morrell, R.; Youssef, Y.; Mills, K.C. Measurement and Estimation of Thermophysical Properties of Nickel Based Superalloys. Mater. Sci. Technol. 2009, 25, 154–162. [Google Scholar] [CrossRef]
  19. Martena, M.; Botto, D.; Fino, P.; Sabbadini, S.; Gola, M.M.; Badini, C. Modeling of TBC System Failure: Stress Distribution as a Function of TGO Thickness and Thermal Expansion Mismatch. Eng. Fail. Anal. 2006, 13, 409–426. [Google Scholar] [CrossRef]
  20. Bäker, M.; Rösler, J.; Heinze, G. A Parametric Study of the Stress State of Thermal Barrier Coatings Part II: Cooling Stresses. Acta Mater. 2005, 53, 469–476. [Google Scholar] [CrossRef]
  21. Bäker, M.; Rösler, J.; Affeldt, E. The Influence of Axial Loading on the Interface Stresses of Thermal Barrier Coatings. Comput. Mater. Sci. 2009, 47, 466–470. [Google Scholar] [CrossRef]
Figure 1. Finite element model of TBCs.
Materials 09 00773 g001
Figure 2. The TGO thickness based on the diffusion-oxidation reaction model after oxidation stage.
Materials 09 00773 g002
Figure 3. Sketch of the phase transition layer (PTL).
Materials 09 00773 g003
Figure 4. The contour plot of TGO growth after 200 h oxidation (D = 3.5 × 10⁻¹⁴ m2/s).
Materials 09 00773 g004
Figure 5. The dimensionless molar fraction of Al2O3 along x2 direction at x1 = 0 after 200 h oxidation (D = 3.5 × 10⁻¹⁴ m2/s).
Materials 09 00773 g005
Figure 6. The influence of oxygen diffusion coefficient on the growth of PTL.
Materials 09 00773 g006
Figure 7. Contour plots of the stress component σ22 at 1100 °C after 200 h oxidation (D = 3.5 × 10⁻¹⁴ m2/s) based on the Reuss model: (a) without PTL (ξPTL = 1); and (b) with PTL (0 < ξPTL < 1).
Materials 09 00773 g007
Figure 8. Contour plots of the stress component σ22 at 20 °C after 200 h oxidation (D = 3.5 × 10⁻¹⁴ m2/s) based on the Reuss model: (a) without PTL (ξPTL = 1); and (b) with PTL (0 < ξPTL < 1).
Materials 09 00773 g008
Figure 9. The maximum stress component σ22 at peak position based on the Reuss and Voigt models with a variation of ξPTL (D = 3.5 × 10⁻¹⁴ m2/s).
Materials 09 00773 g009
Figure 10. Stress σ22 in the PTL after 200 h oxidation (D = 3.5 × 10⁻¹⁴ m2/s): (a) at 1100 °C; and (b) at 20 °C.
Materials 09 00773 g010
Figure 11. Influence of different phase transition proportions hPTL/hTGO on the difference of stresses caused by the two constitutive equations: (a) at 1100 °C; and (b) at 20 °C.
Materials 09 00773 g011
Figure 12. Stress difference ratio versus the phase transition proportion hPTL/hTGO: (a) at 1100 °C; and (b) at 20 °C.
Materials 09 00773 g012
Figure 13. Contour plots of the stress component σ22 in the x2 axis at 20 °C with a stress-free state at the end of oxidation (D = 3.5 × 10⁻¹⁴ m2/s): (a) without PTL (ξPTL = 1); and (b) with PTL (0 < ξPTL < 1).
Materials 09 00773 g013
Figure 14. The maximum stress component σ22 at peak position based on the Reuss and Voigt models with variation of ξPTL (D = 3.5 × 10⁻¹⁴ m2/s) after the cooling stage (at 20 °C) with a stress-free state at the end of oxidation.
Materials 09 00773 g014
Figure 15. Stress difference ratio versus the phase transition proportion hPTL/hTGO after the cooling stage at 20 °C with a stress-free state at the end of oxidation.
Materials 09 00773 g015
Table 1. The temperature-dependent mechanics parameters.
T/°C2020040060080010001100
TCE/GPa [16]48474440342622
ν [16]0.10.10.10.110.110.120.12
α (10−6/°C) [16]9.79.89.99.91010.110.1
BCE/GPa [16]200190175160145120110
ν [16]0.30.30.310.310.320.330.33
α (10−6/°C) [16]12.313.214.215.216.317.217.7
TGOE/GPa [16]400390380370355325320
ν [16]0.230.230.240.240.250.250.25
α (10−6/°C) [16]88.28.48.799.39.5
Substrateα (10−6/°C) [16]14.815.215.616.216.917.217.6
Table 2. The diffusion and oxidation parameters.
ParameterValue
oxygen diffusion in TCDTC/(m2/s)
oxygen diffusion in BC/TGO [17]DBC = DTGO/(m2/s)3.5 × 10−14
Reference value for the diffusion-oxidation modelA [18]/(mol/m3)0.24 × 106
γ [19]/(m3/(mol·s))1.25 × 10−4
Table 3. Values of oxygen diffusion coefficient adopted in the analysis.
ParameterValue
D (3.5 × 10⁻¹⁴ m2/s)0.10.20.40.50.60.70.81.31.72345

