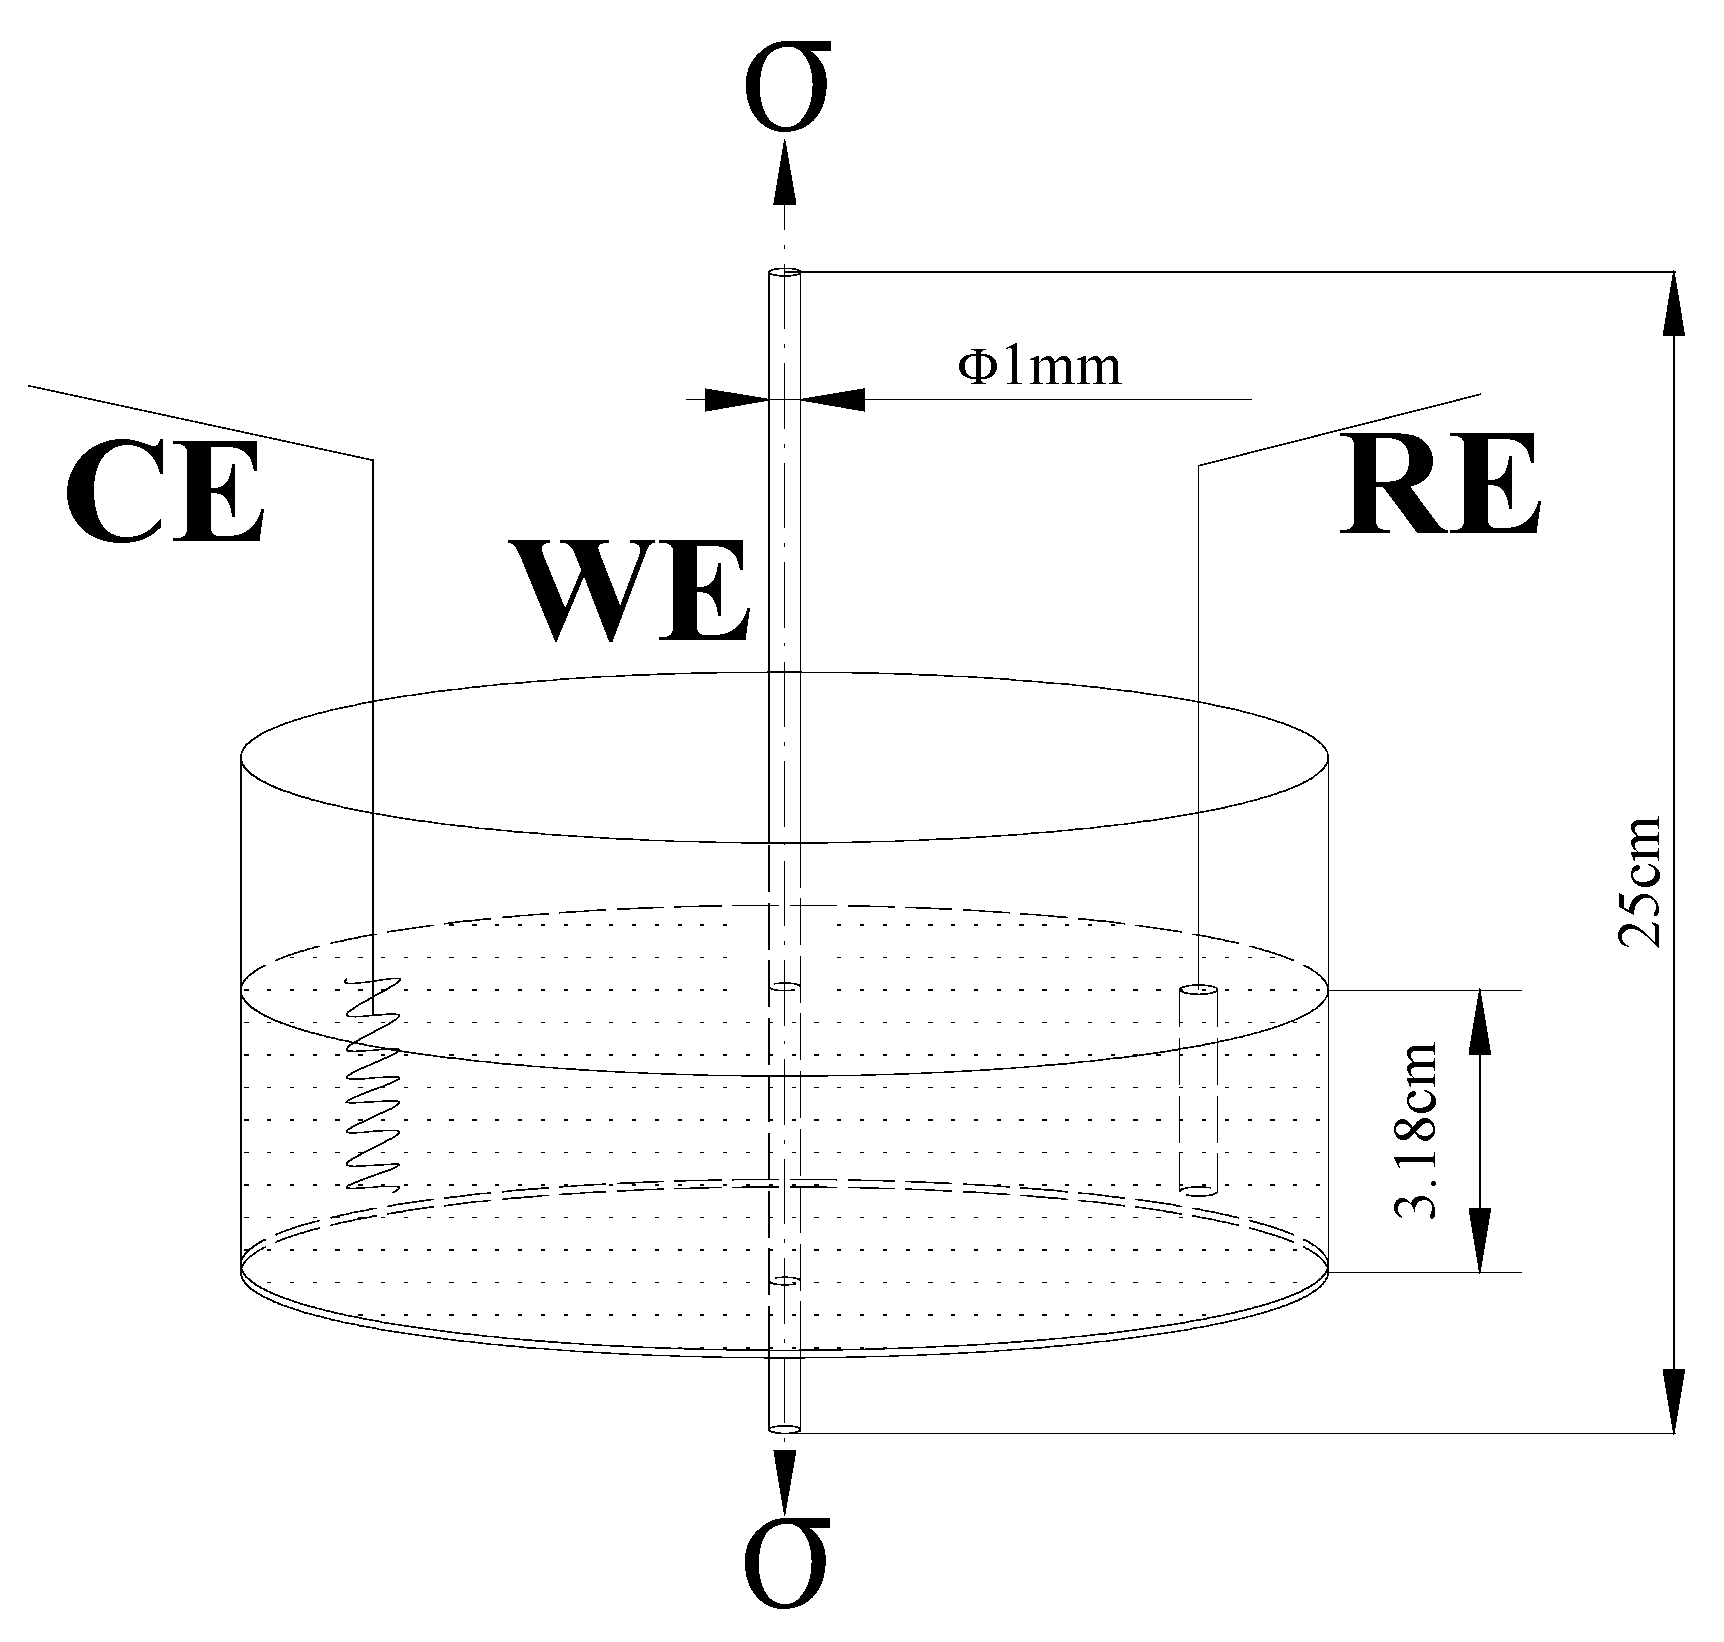
Figure 1.
Schematic of corrosion fatigue test.
Figure 1.
Schematic of corrosion fatigue test.
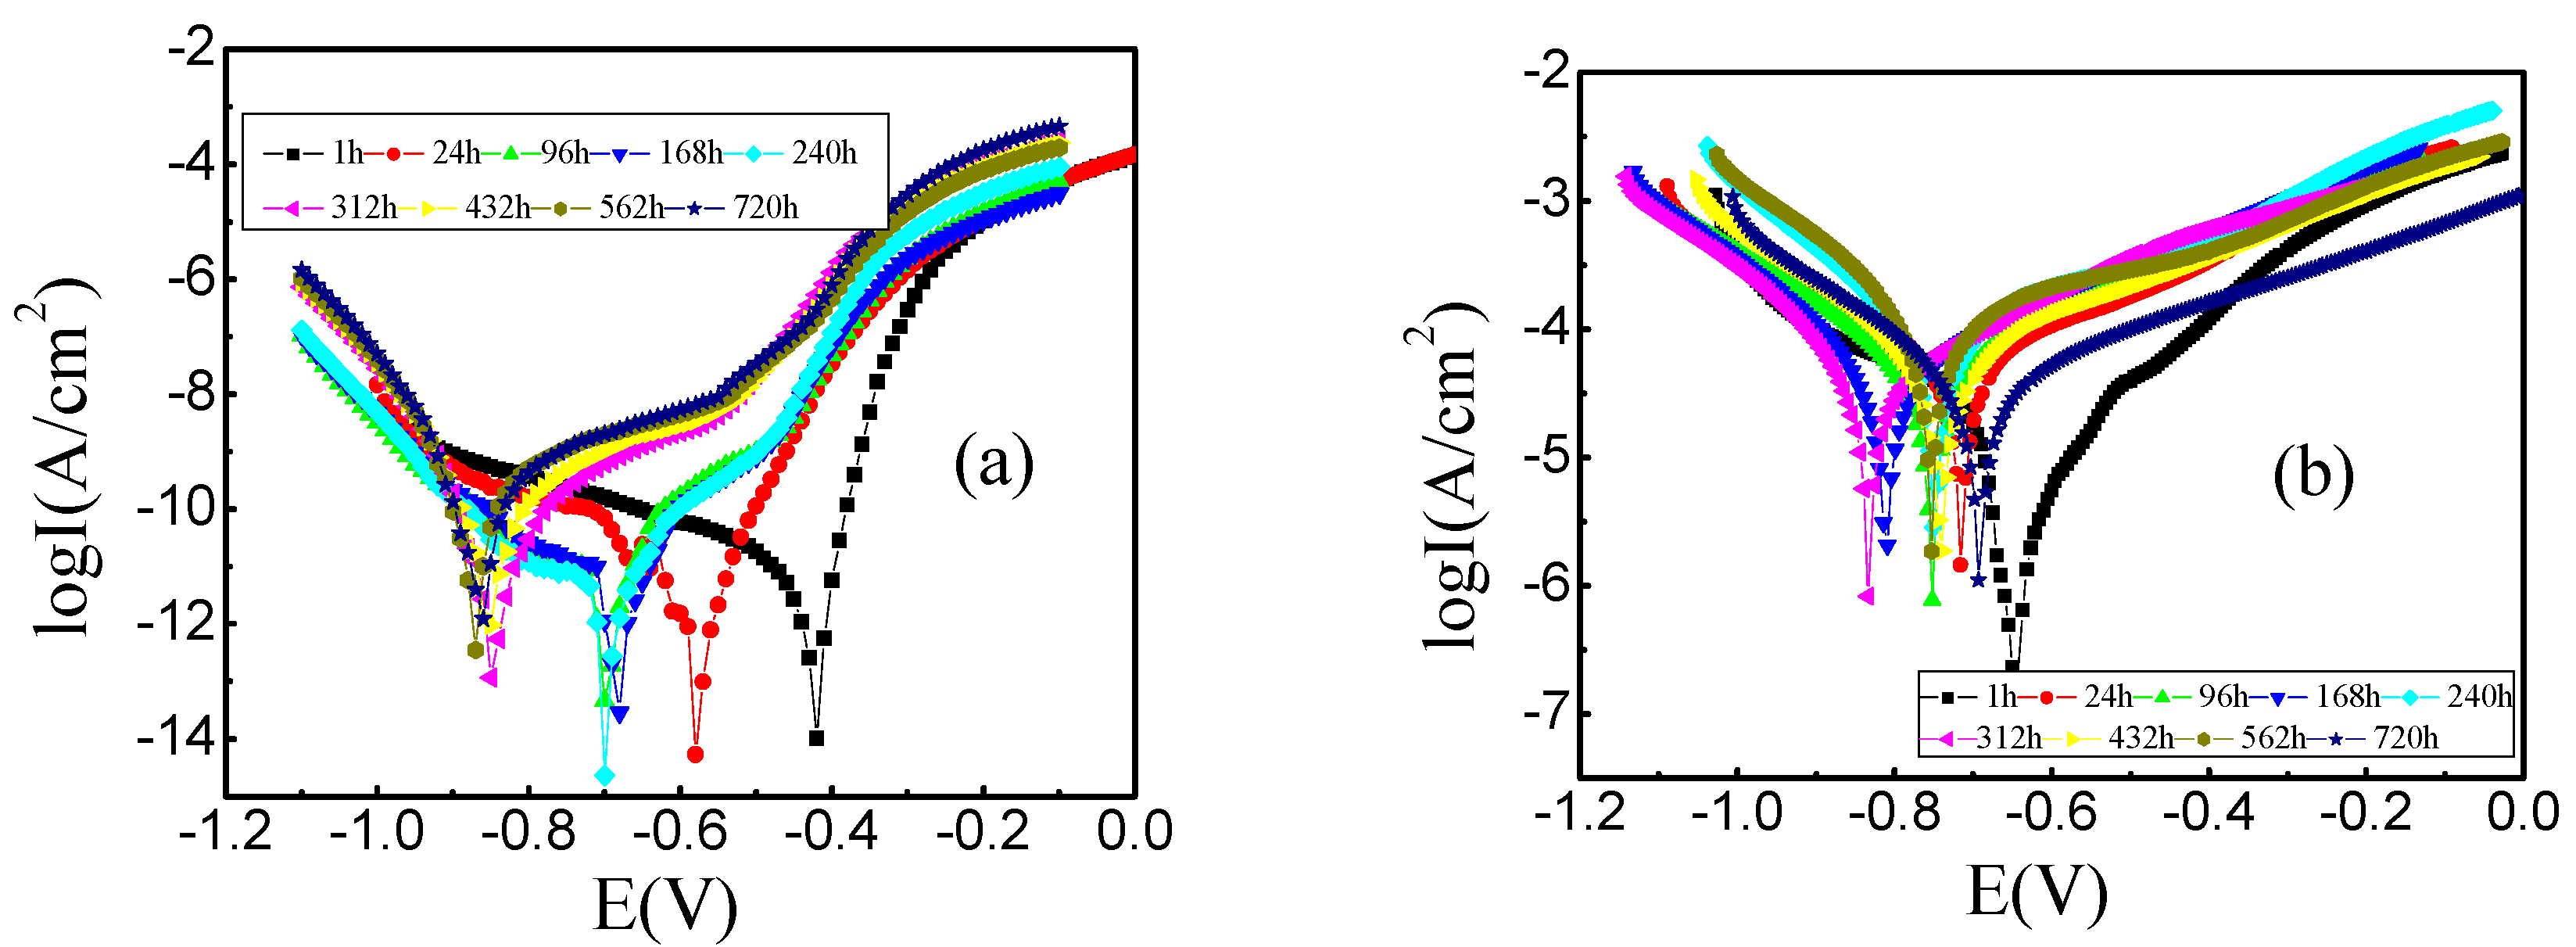
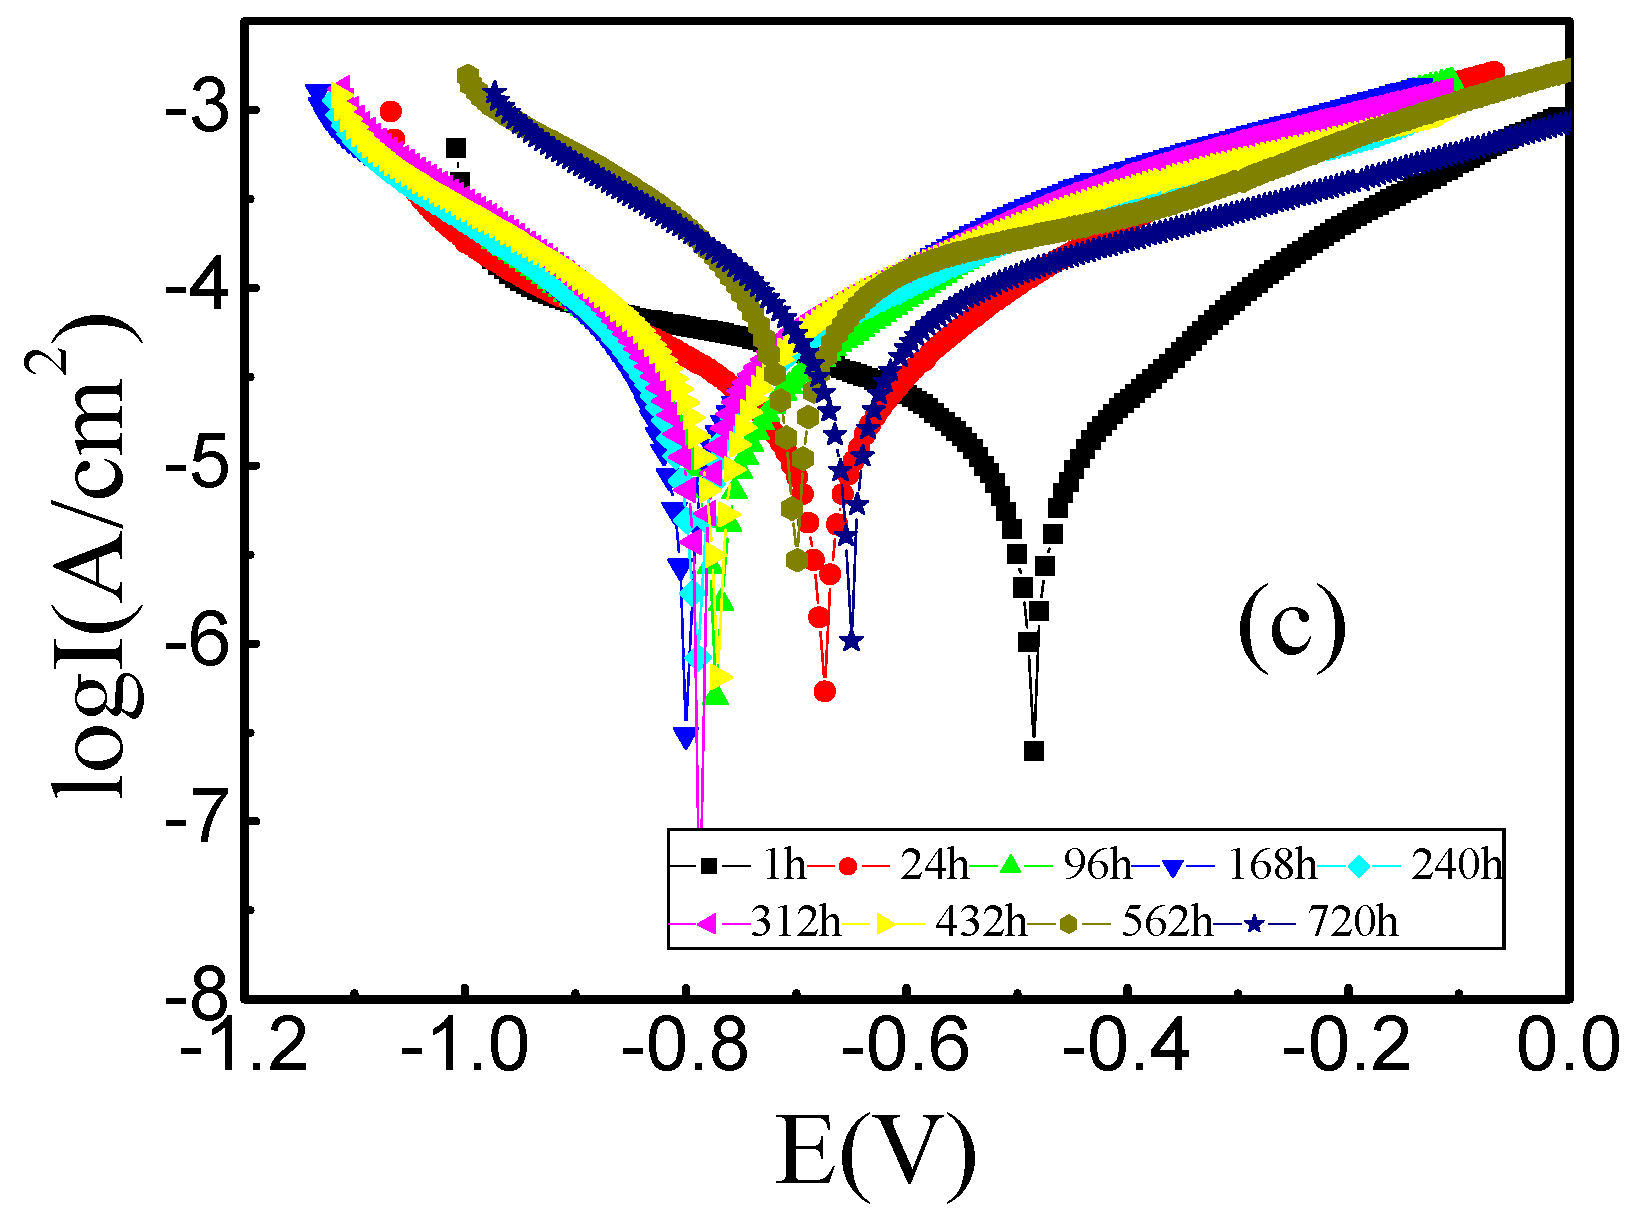
Figure 2.
Polarization curves of mine steel wire in: (a) acid solution; (b) neutral solution; and (c) alkaline solution as the time extended.
Figure 2.
Polarization curves of mine steel wire in: (a) acid solution; (b) neutral solution; and (c) alkaline solution as the time extended.
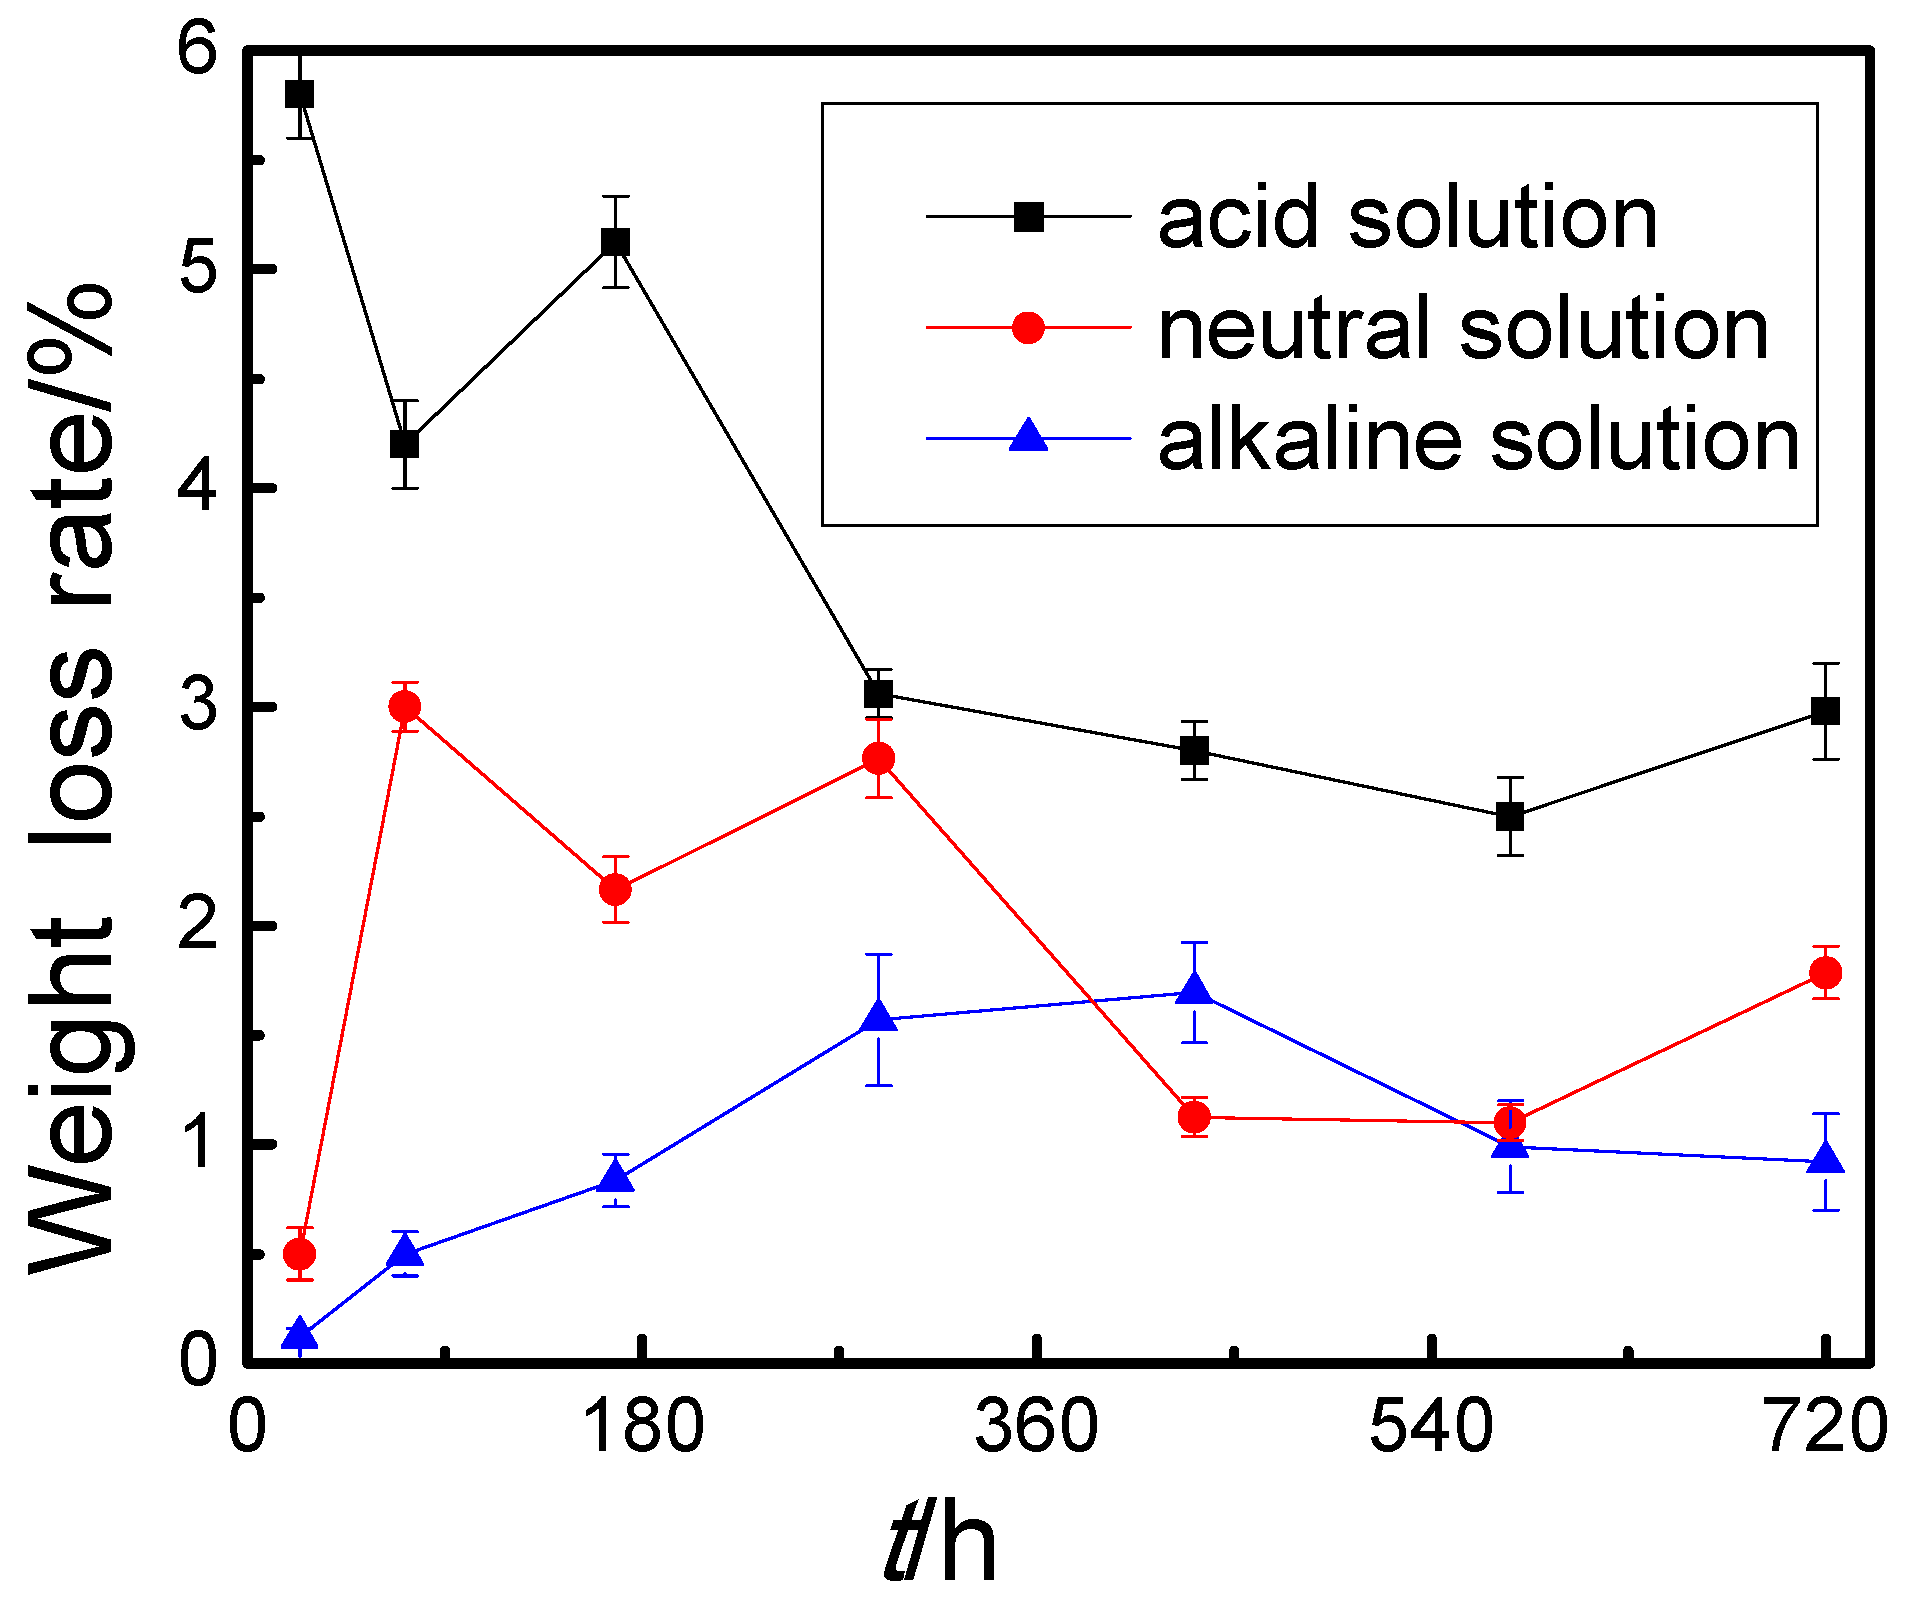
Figure 3.
Weight loss ratios of steel wires in three solutions at different immersion times.
Figure 3.
Weight loss ratios of steel wires in three solutions at different immersion times.
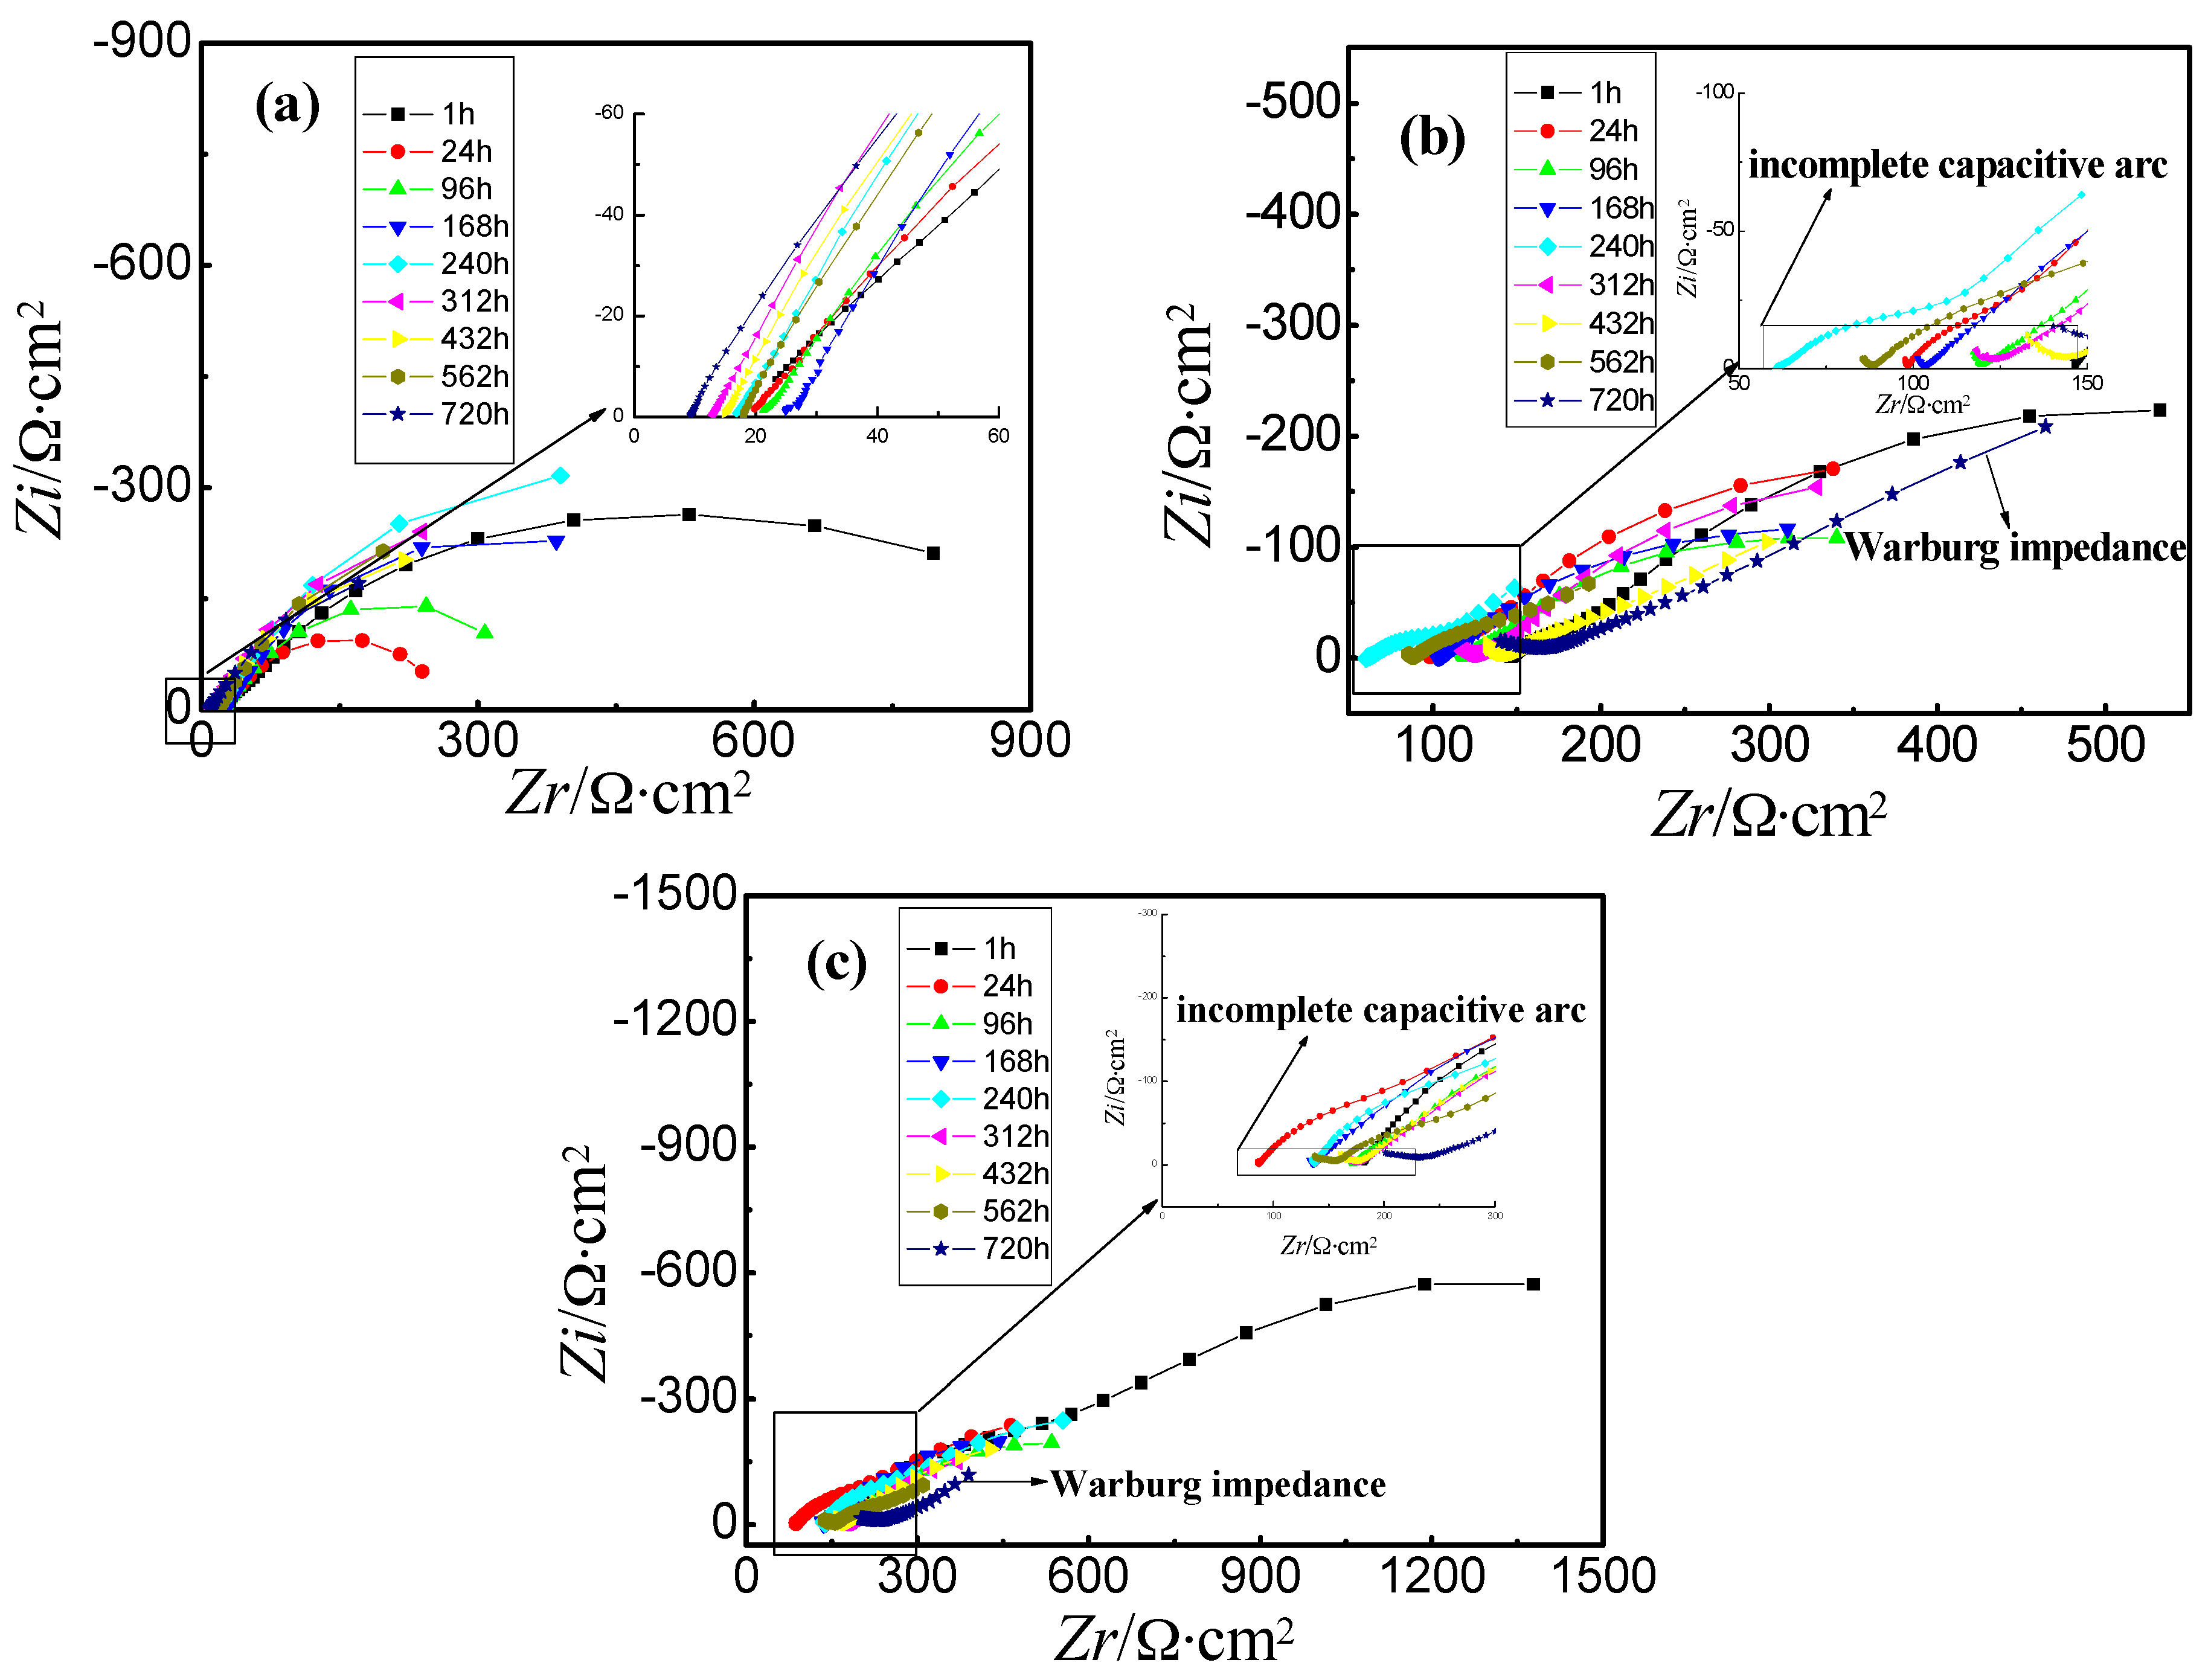
Figure 4.
Nyquist plots of untreated steel wire in three different solutions at different immersion times.
Figure 4.
Nyquist plots of untreated steel wire in three different solutions at different immersion times.
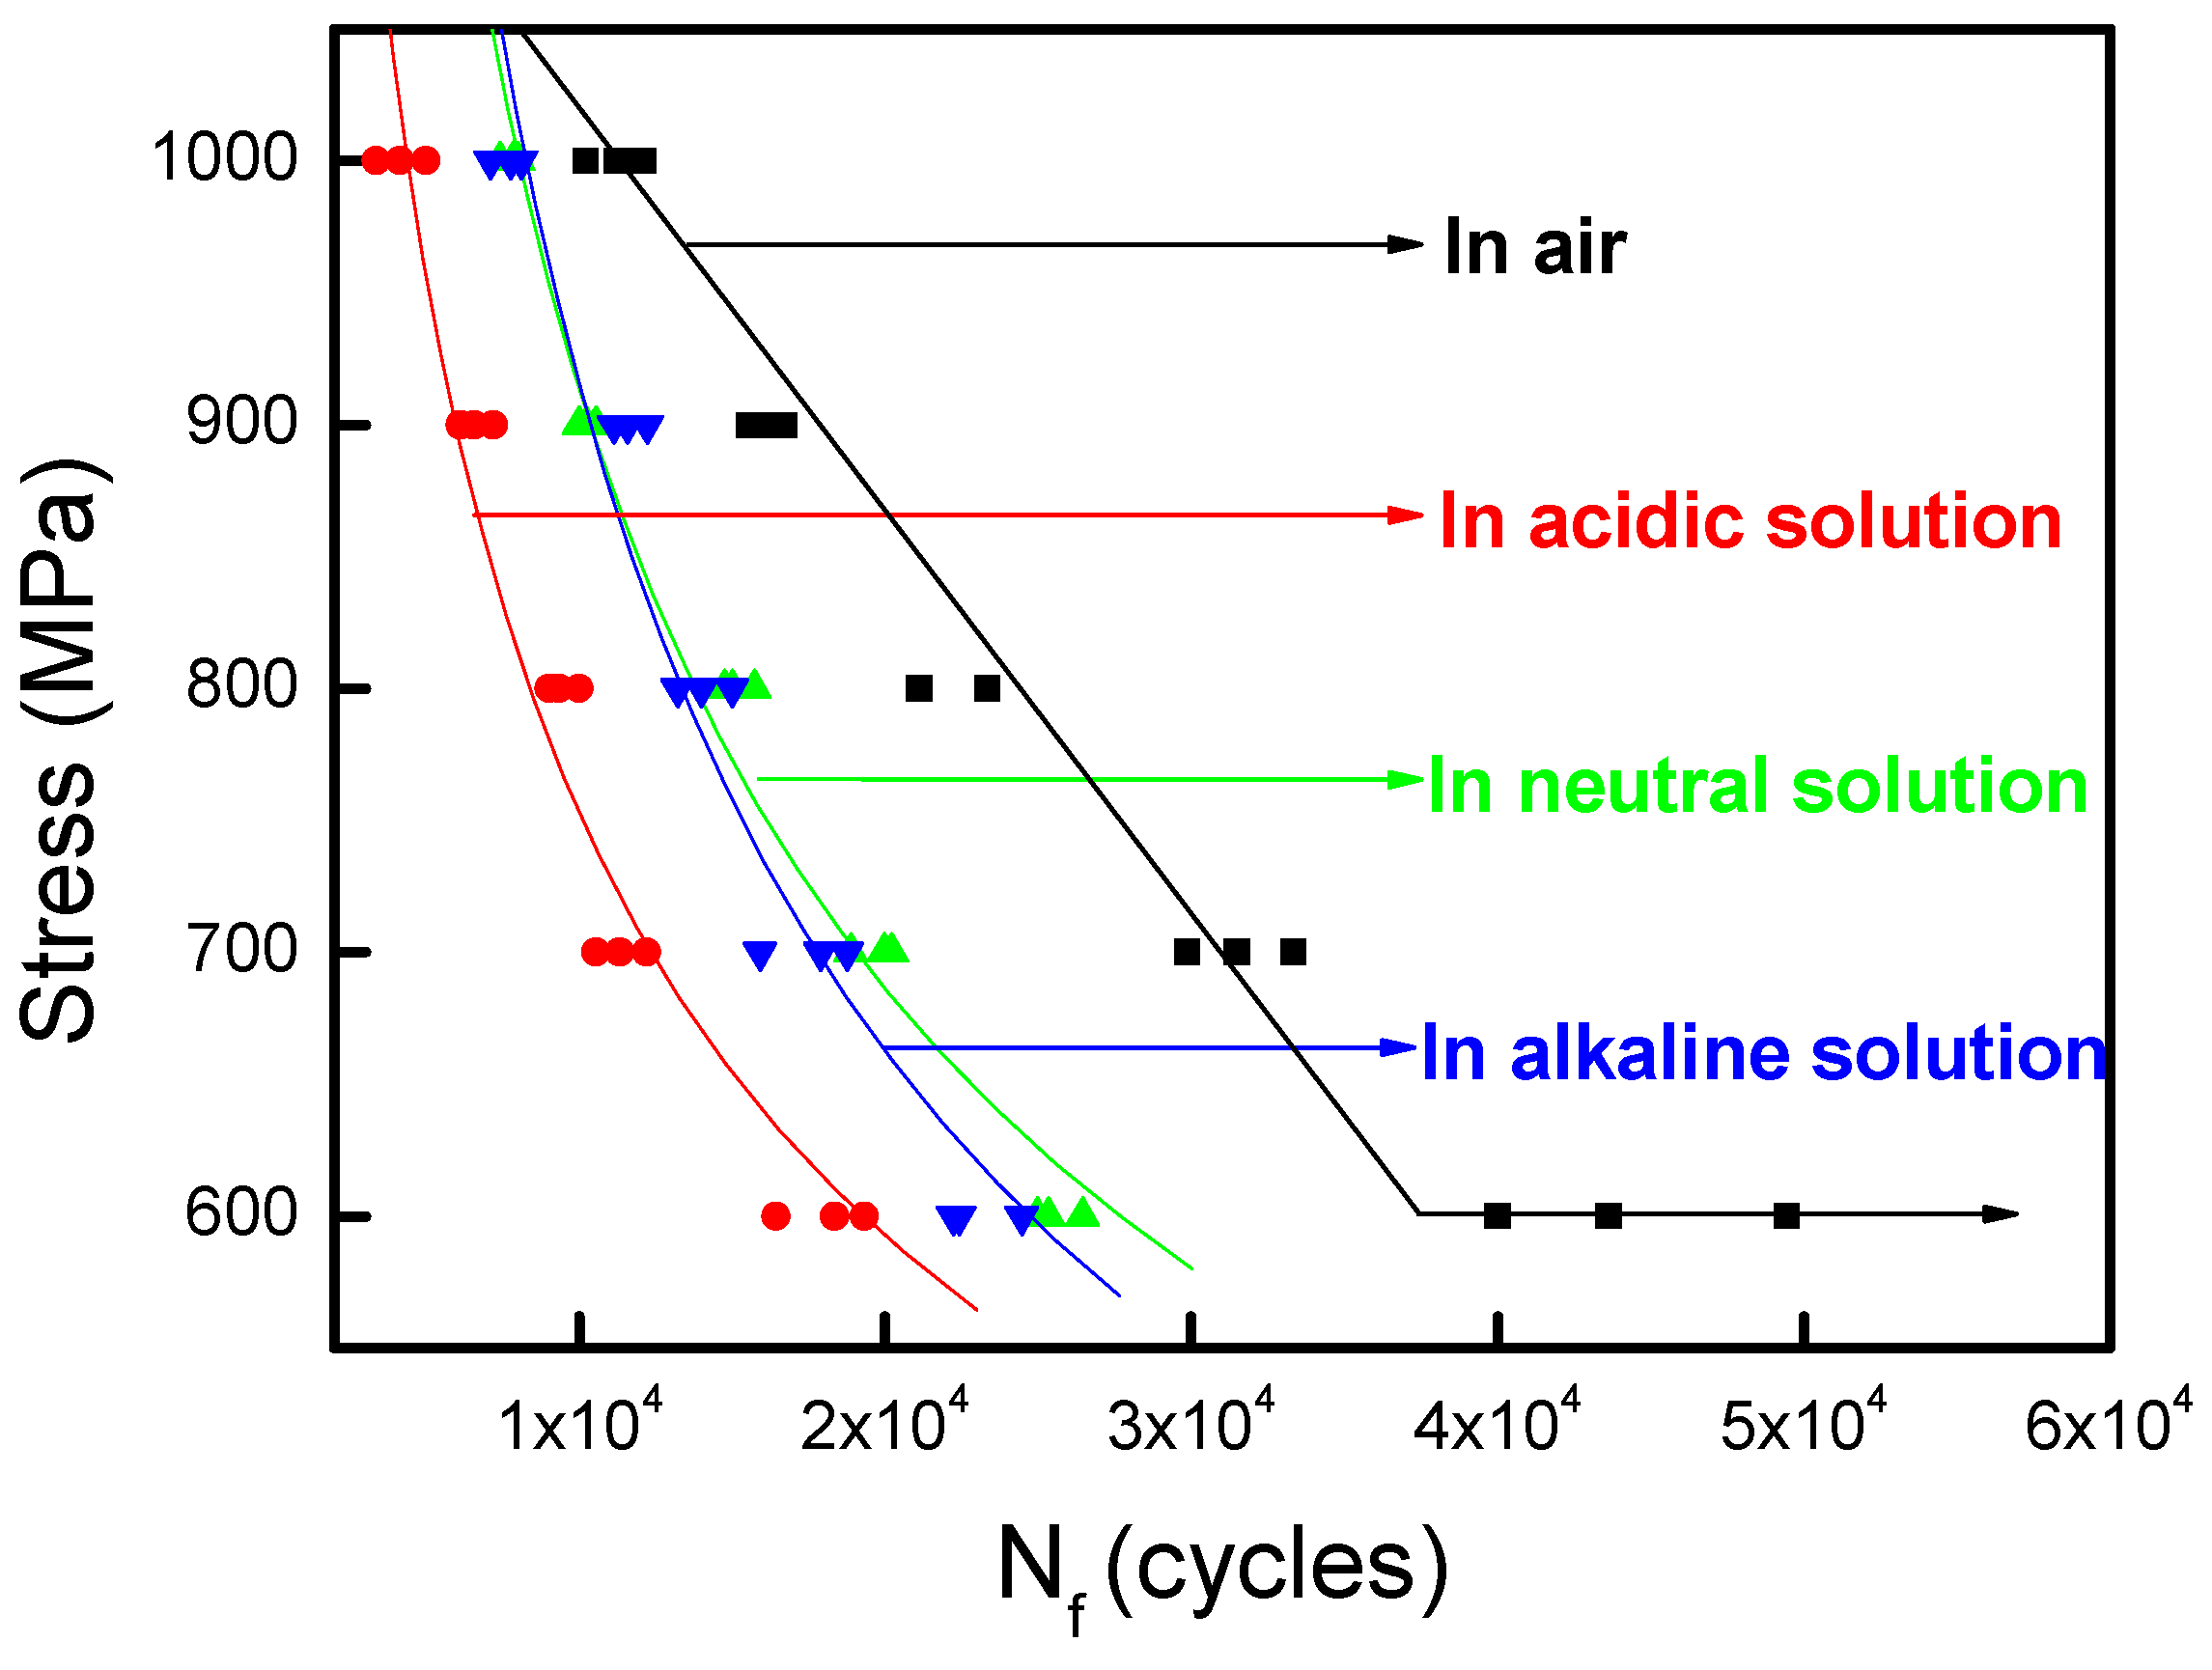
Figure 5.
S-N curves of steel wire under different environments.
Figure 5.
S-N curves of steel wire under different environments.
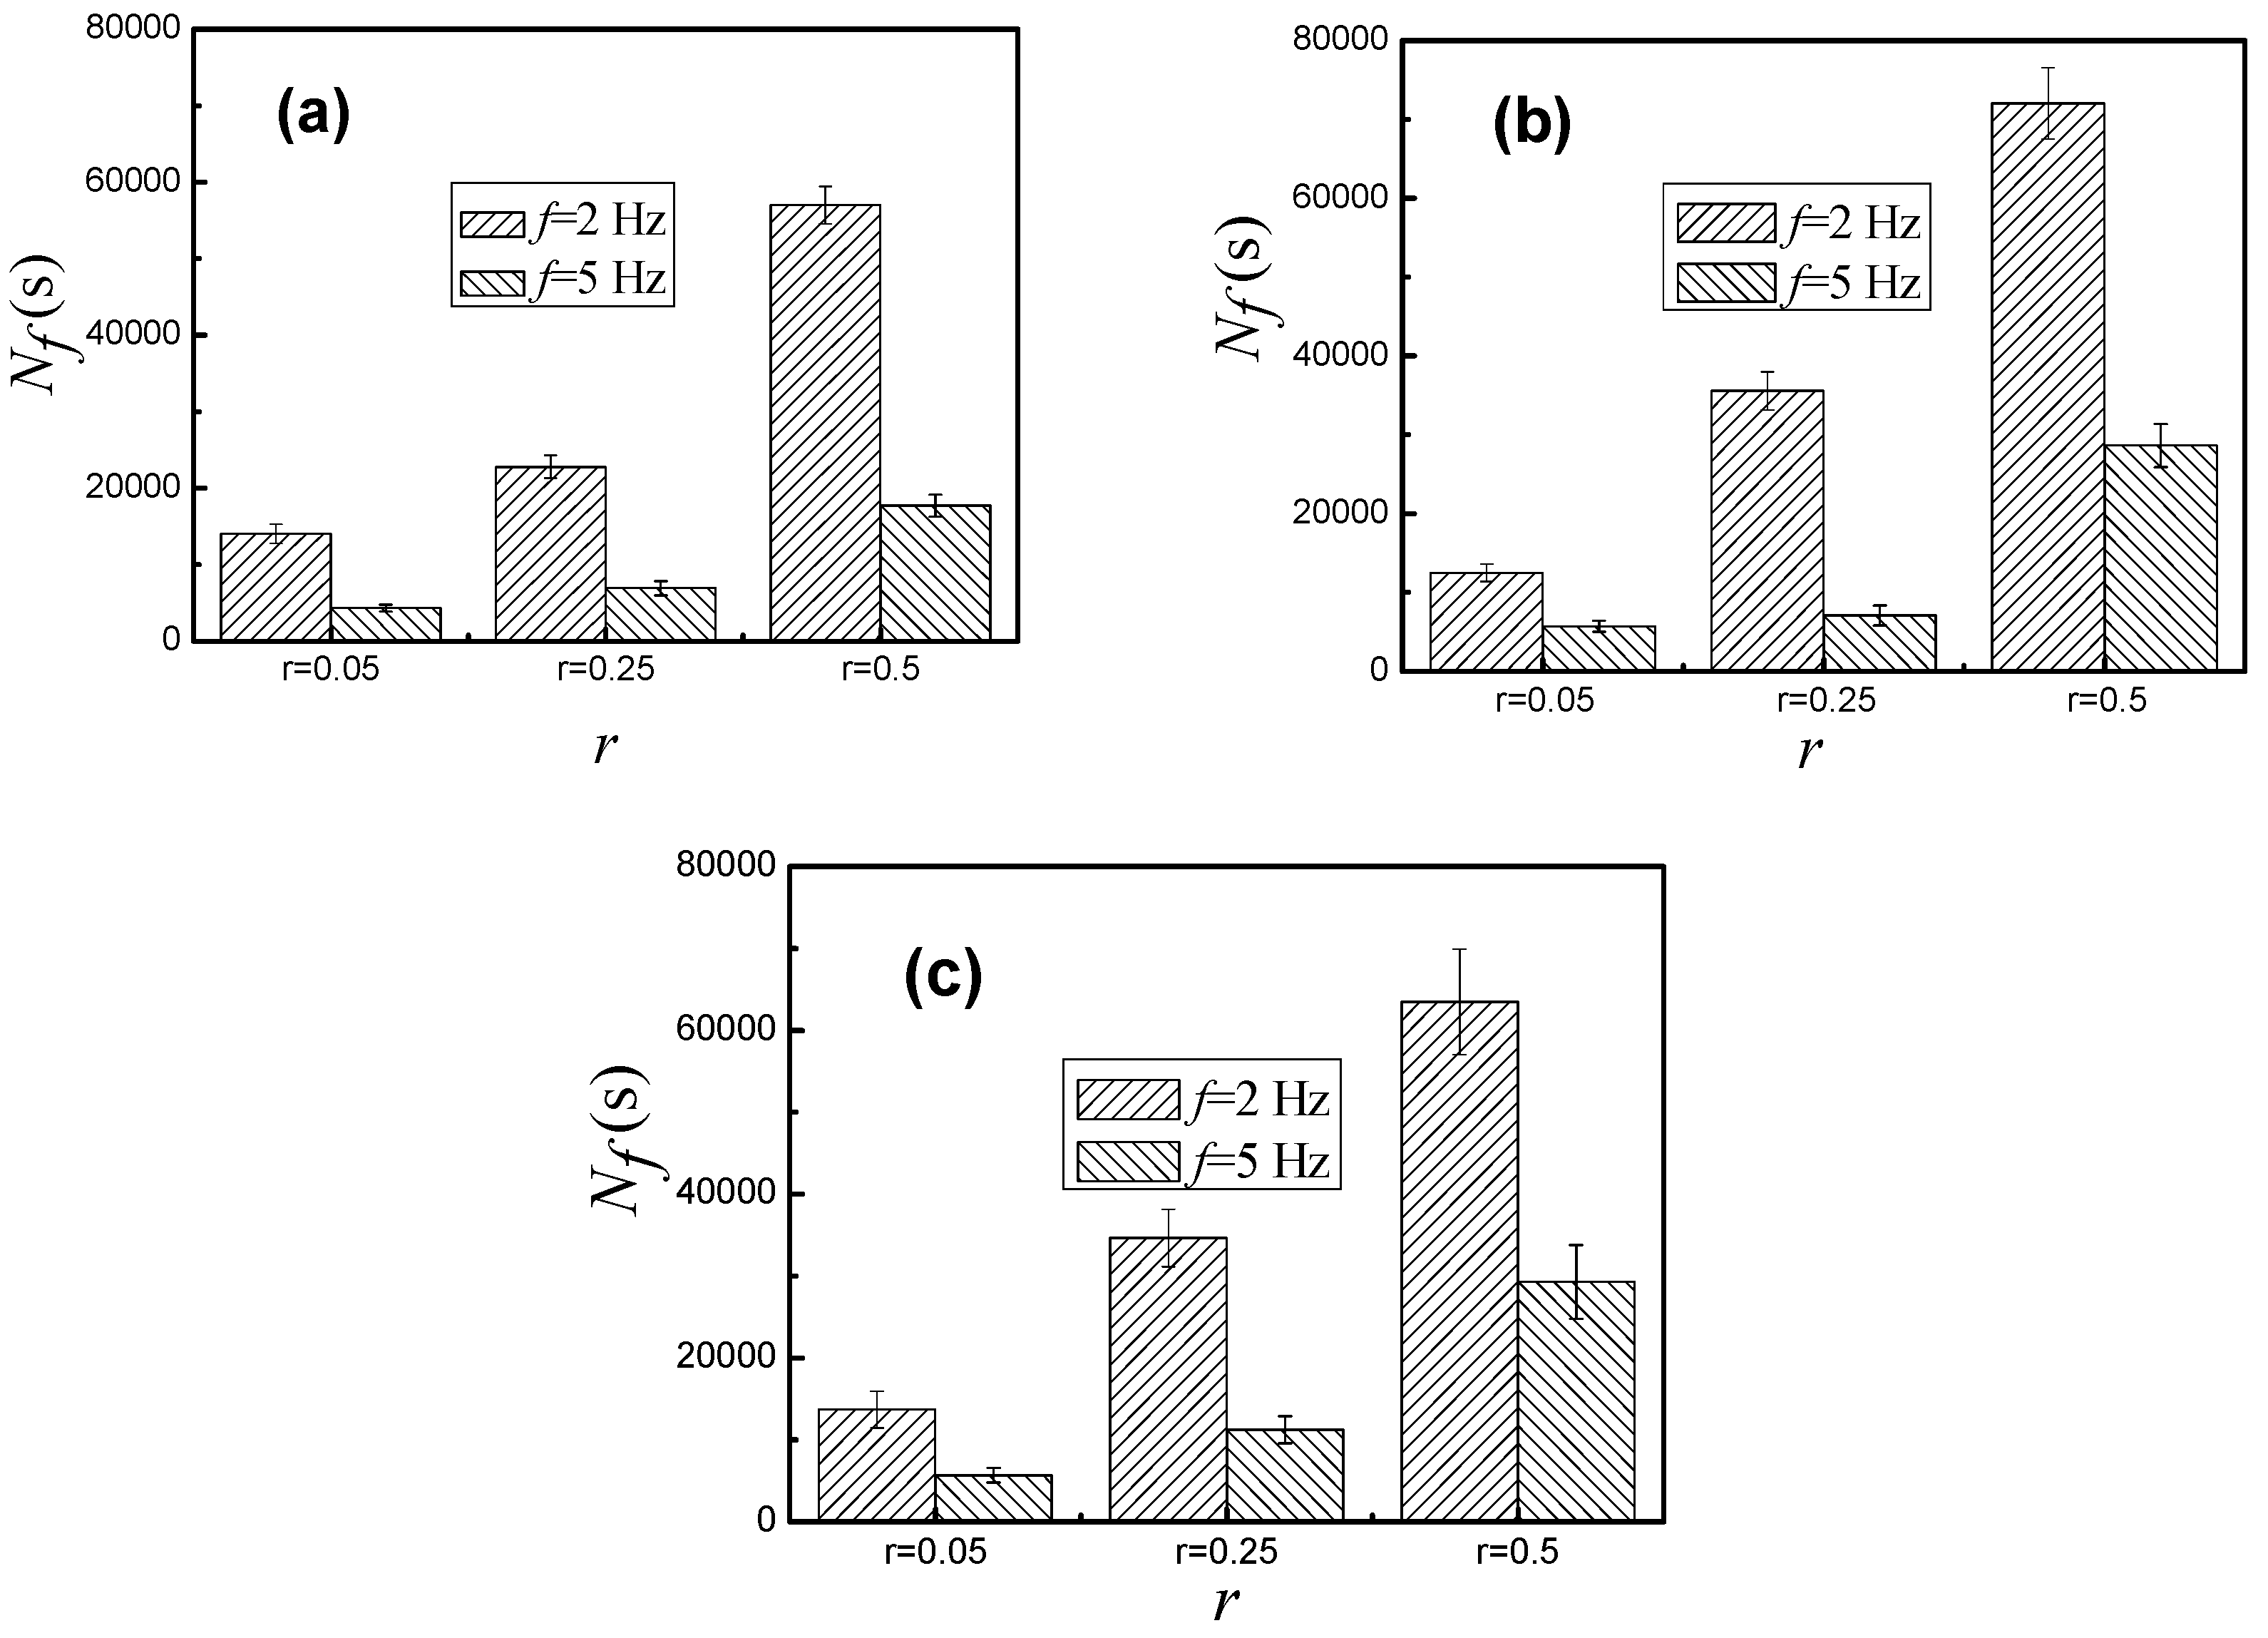
Figure 6.
Corrosion fatigue life of steel wire under different stress ratios and frequencies in: (a) acid solution; (b) neutral solution; and (c) alkaline solution.
Figure 6.
Corrosion fatigue life of steel wire under different stress ratios and frequencies in: (a) acid solution; (b) neutral solution; and (c) alkaline solution.
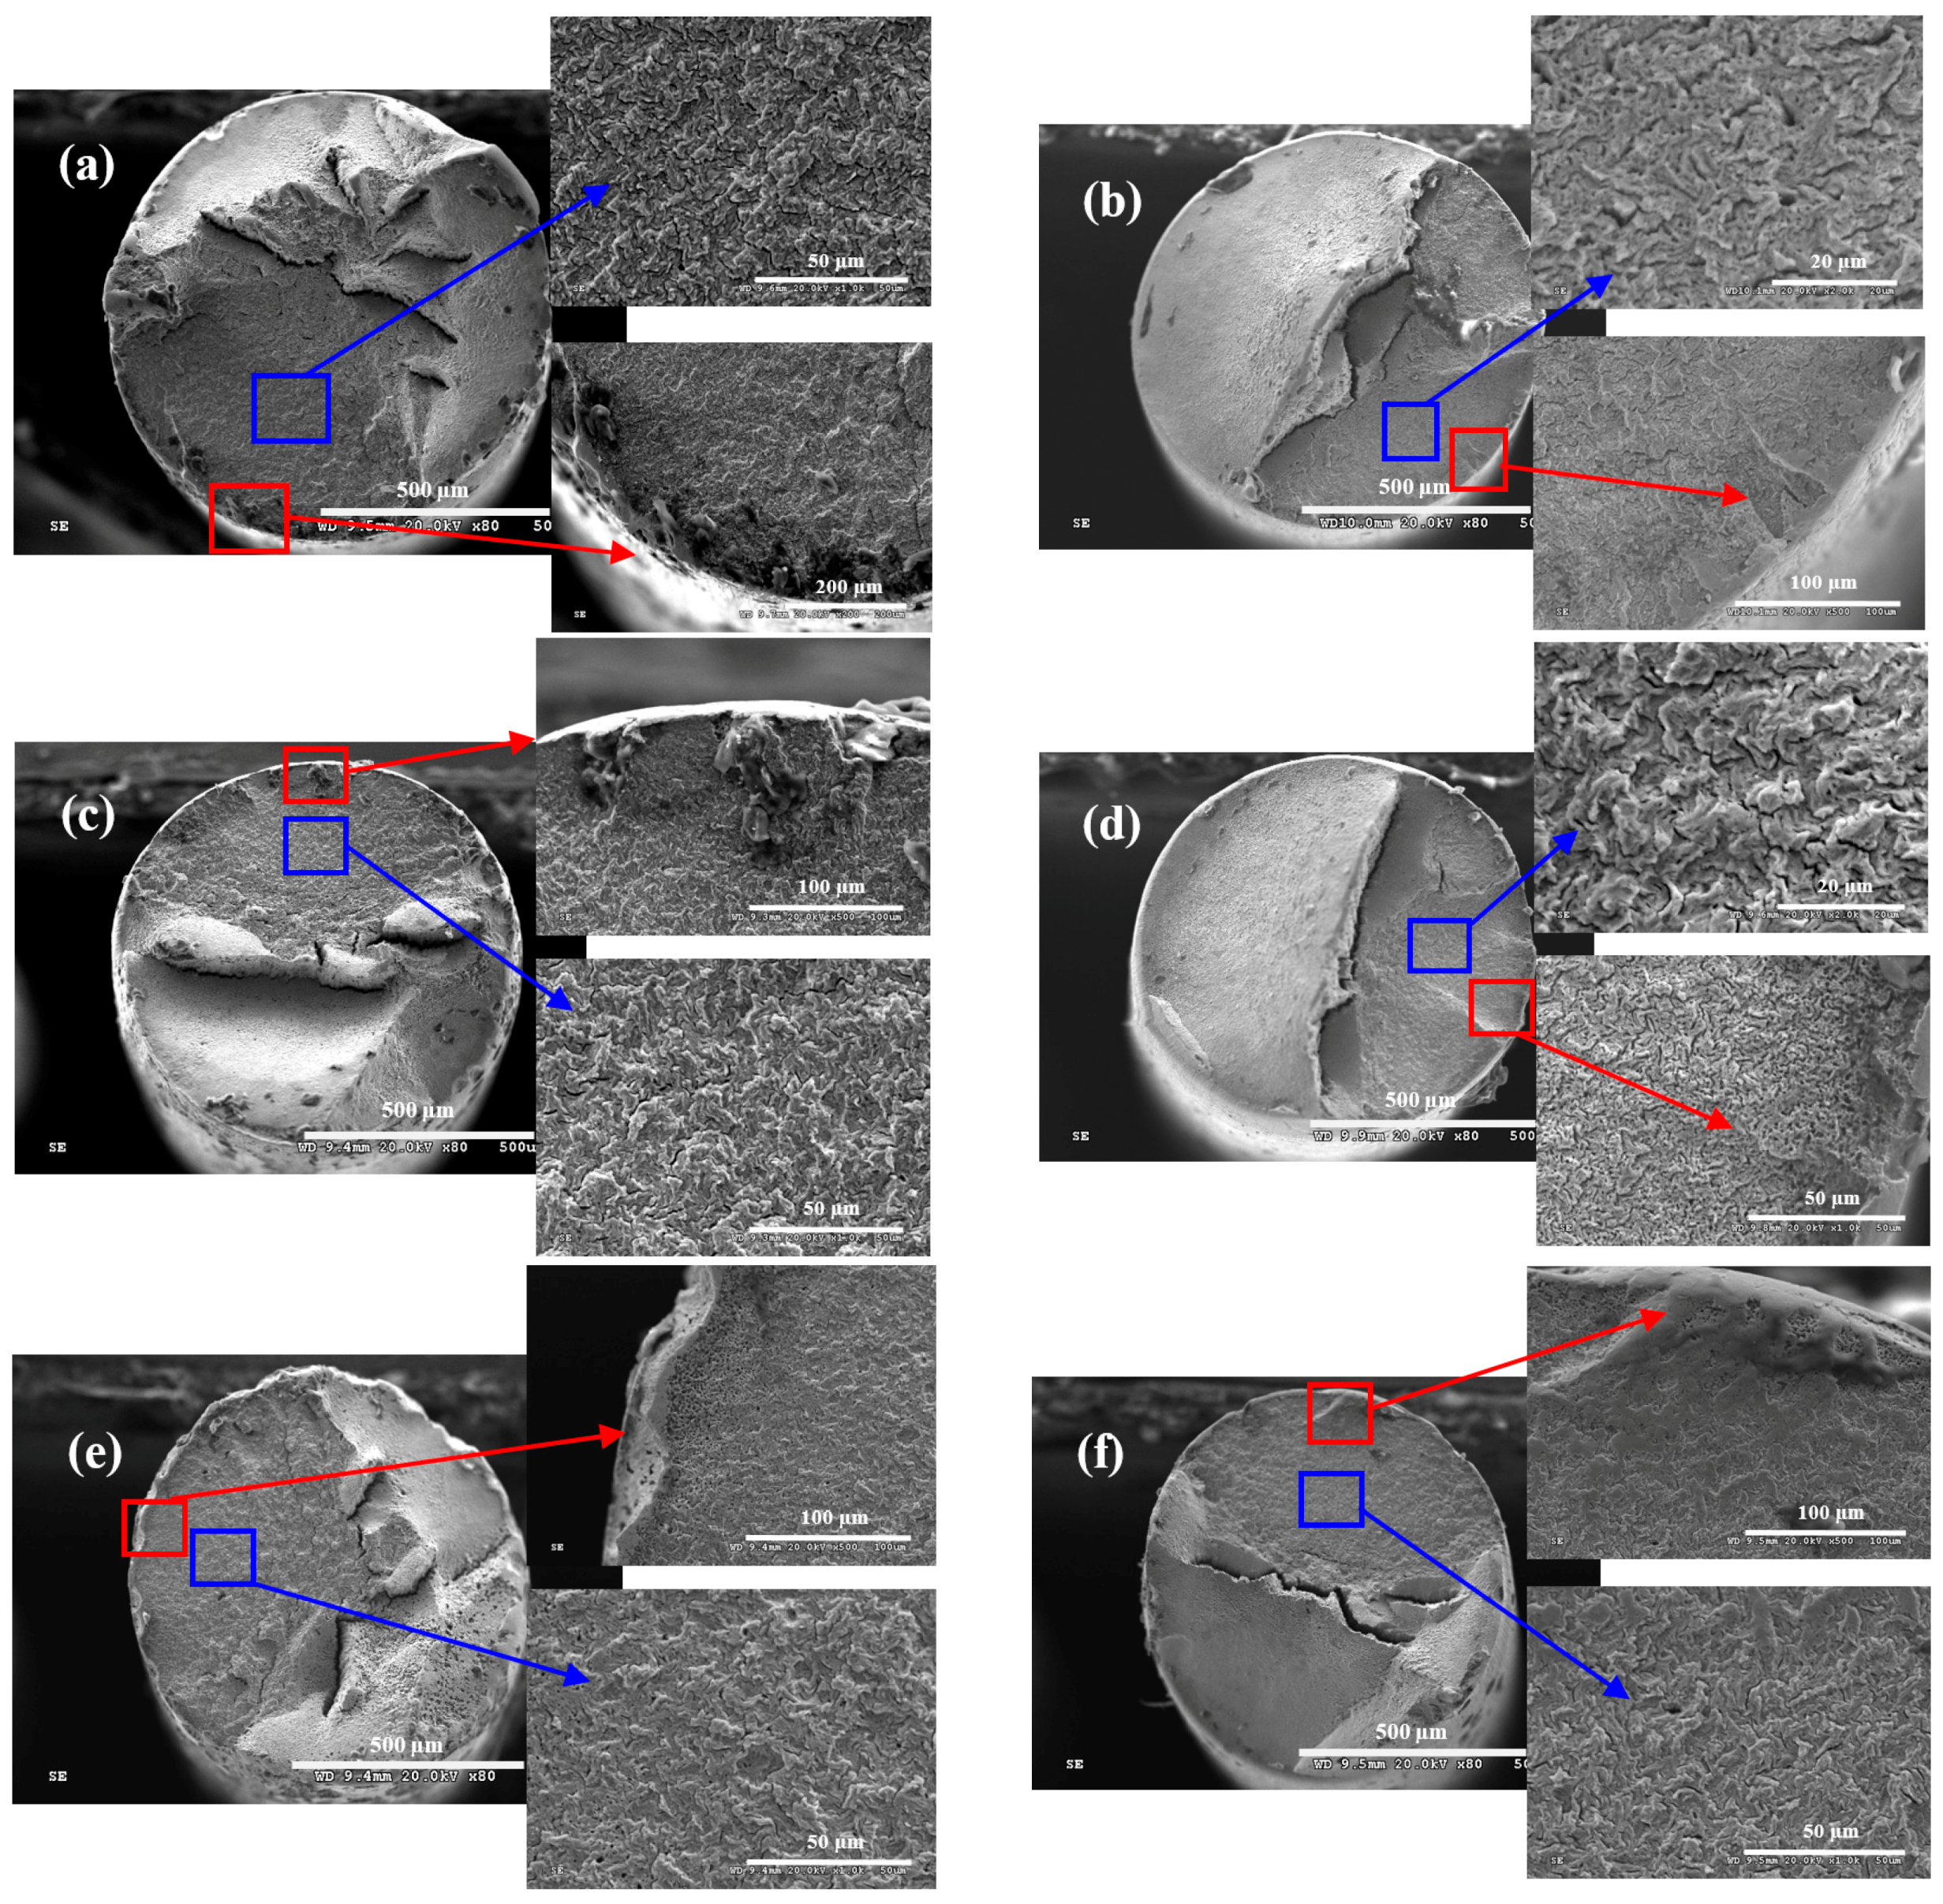
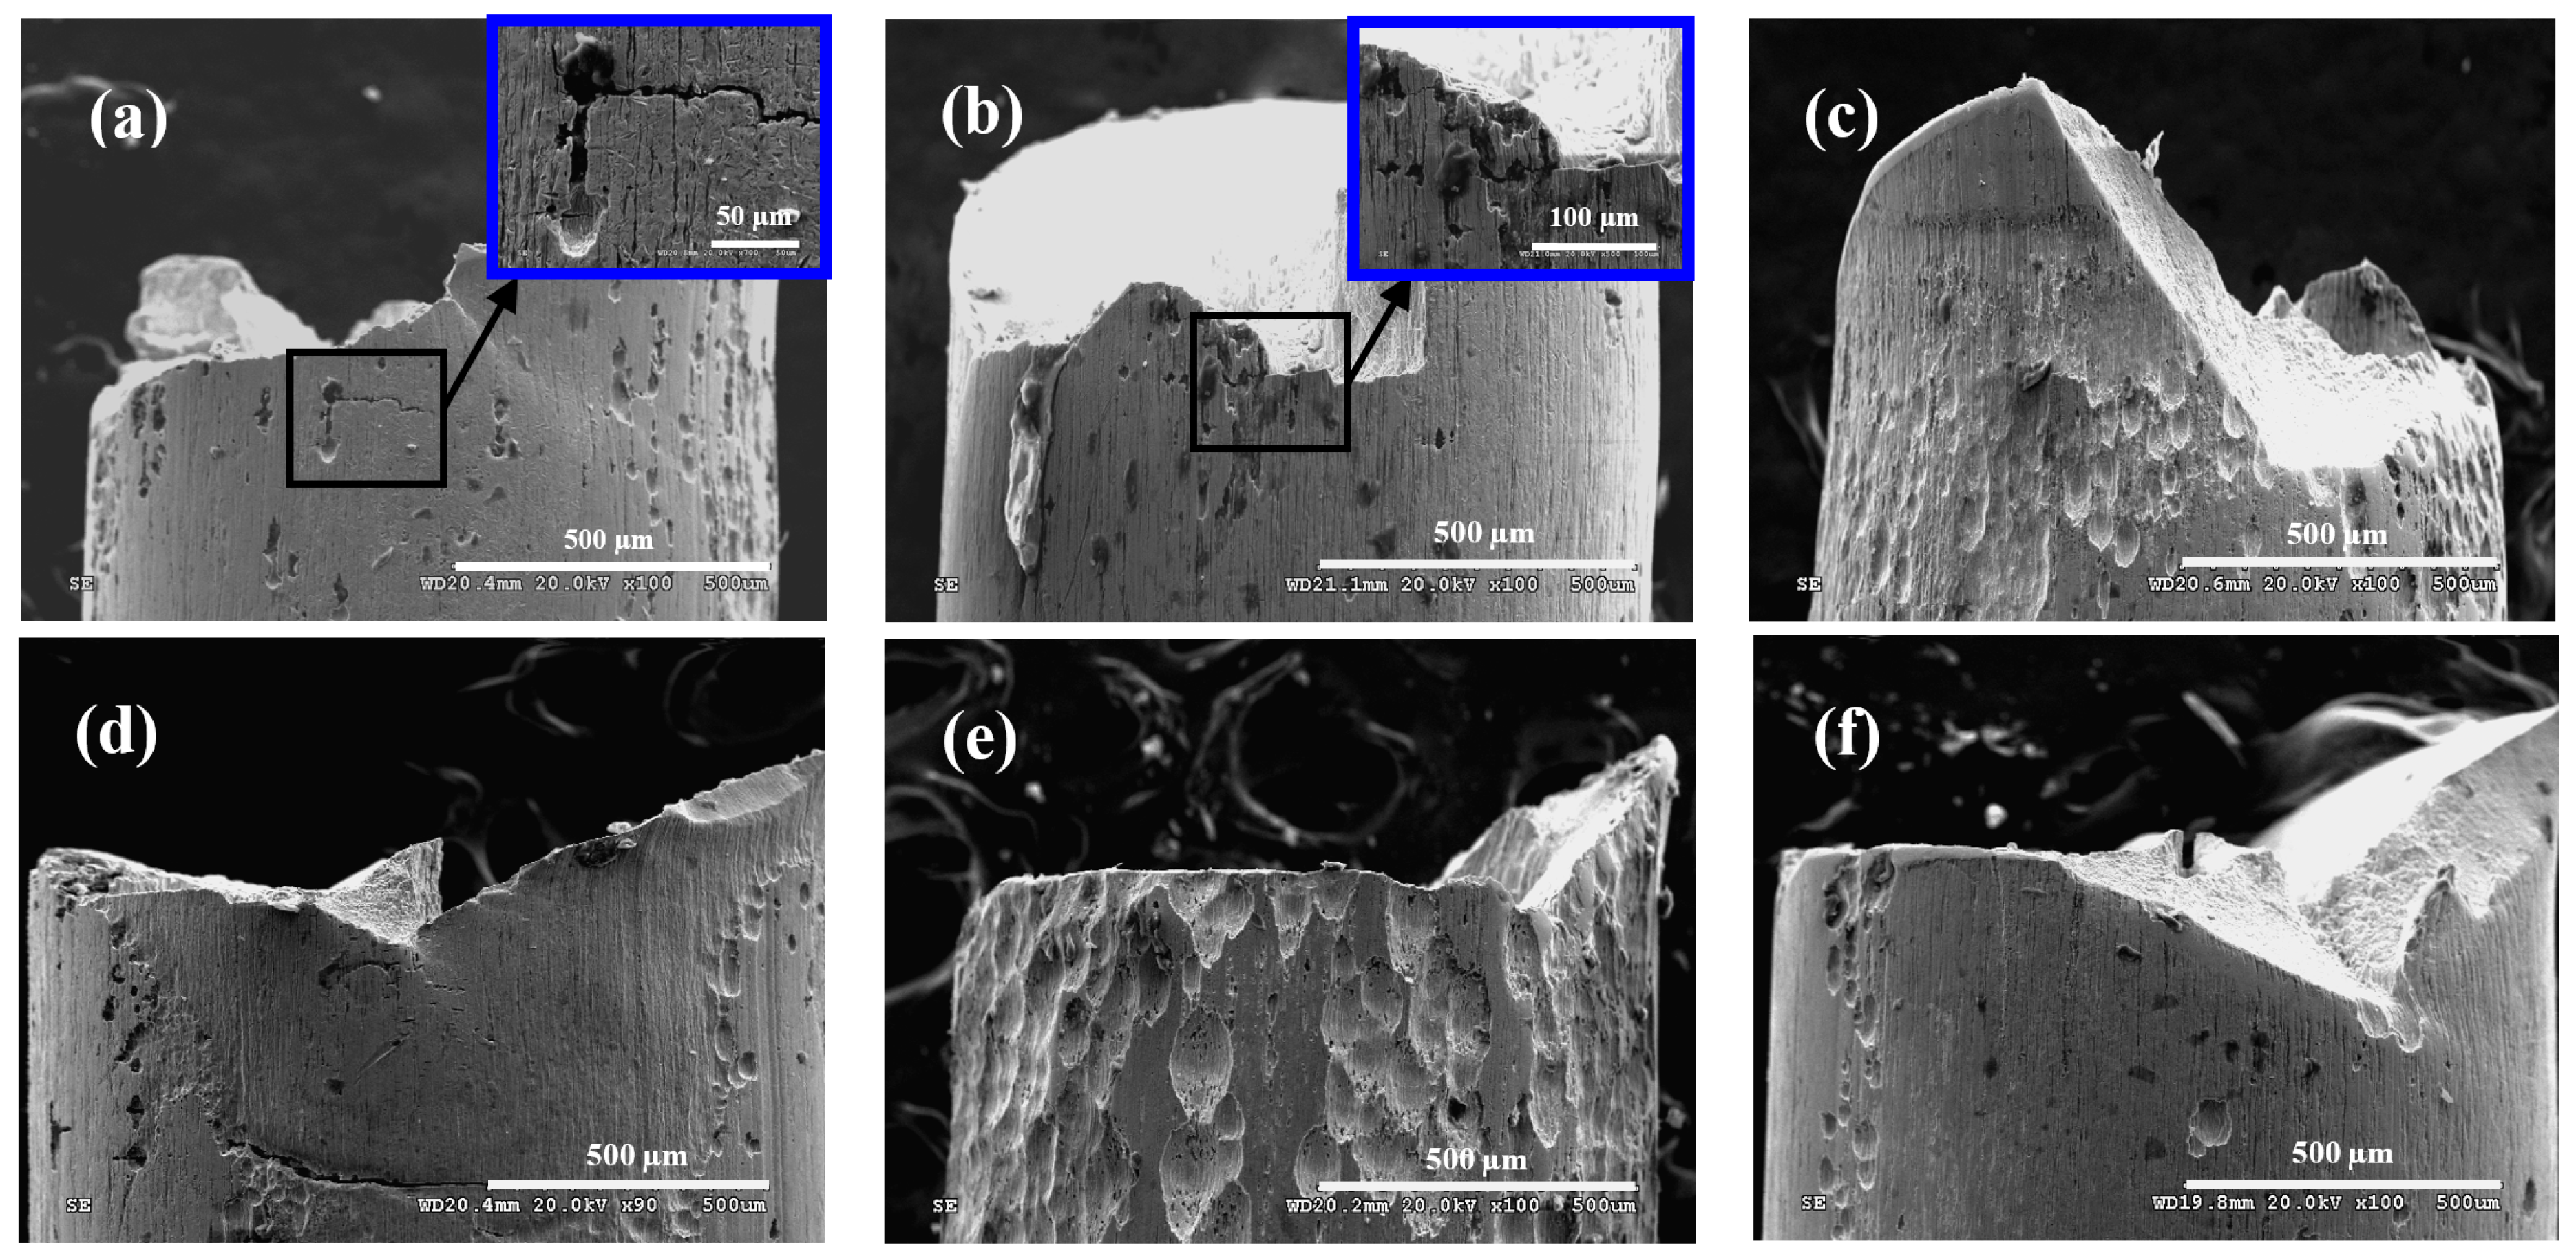
Figure 7.
Morphologies on side surface of steel wire under: (a) r = 0.05, f = 2 Hz; (b) r = 0.05, f = 5 Hz; (c) r = 0.25, f = 2 Hz; (d) r = 0.25, f = 5 Hz; (e) r = 0.5, f = 2 Hz; and (f) r = 0.5, f = 5 Hz in acid solution.
Figure 7.
Morphologies on side surface of steel wire under: (a) r = 0.05, f = 2 Hz; (b) r = 0.05, f = 5 Hz; (c) r = 0.25, f = 2 Hz; (d) r = 0.25, f = 5 Hz; (e) r = 0.5, f = 2 Hz; and (f) r = 0.5, f = 5 Hz in acid solution.
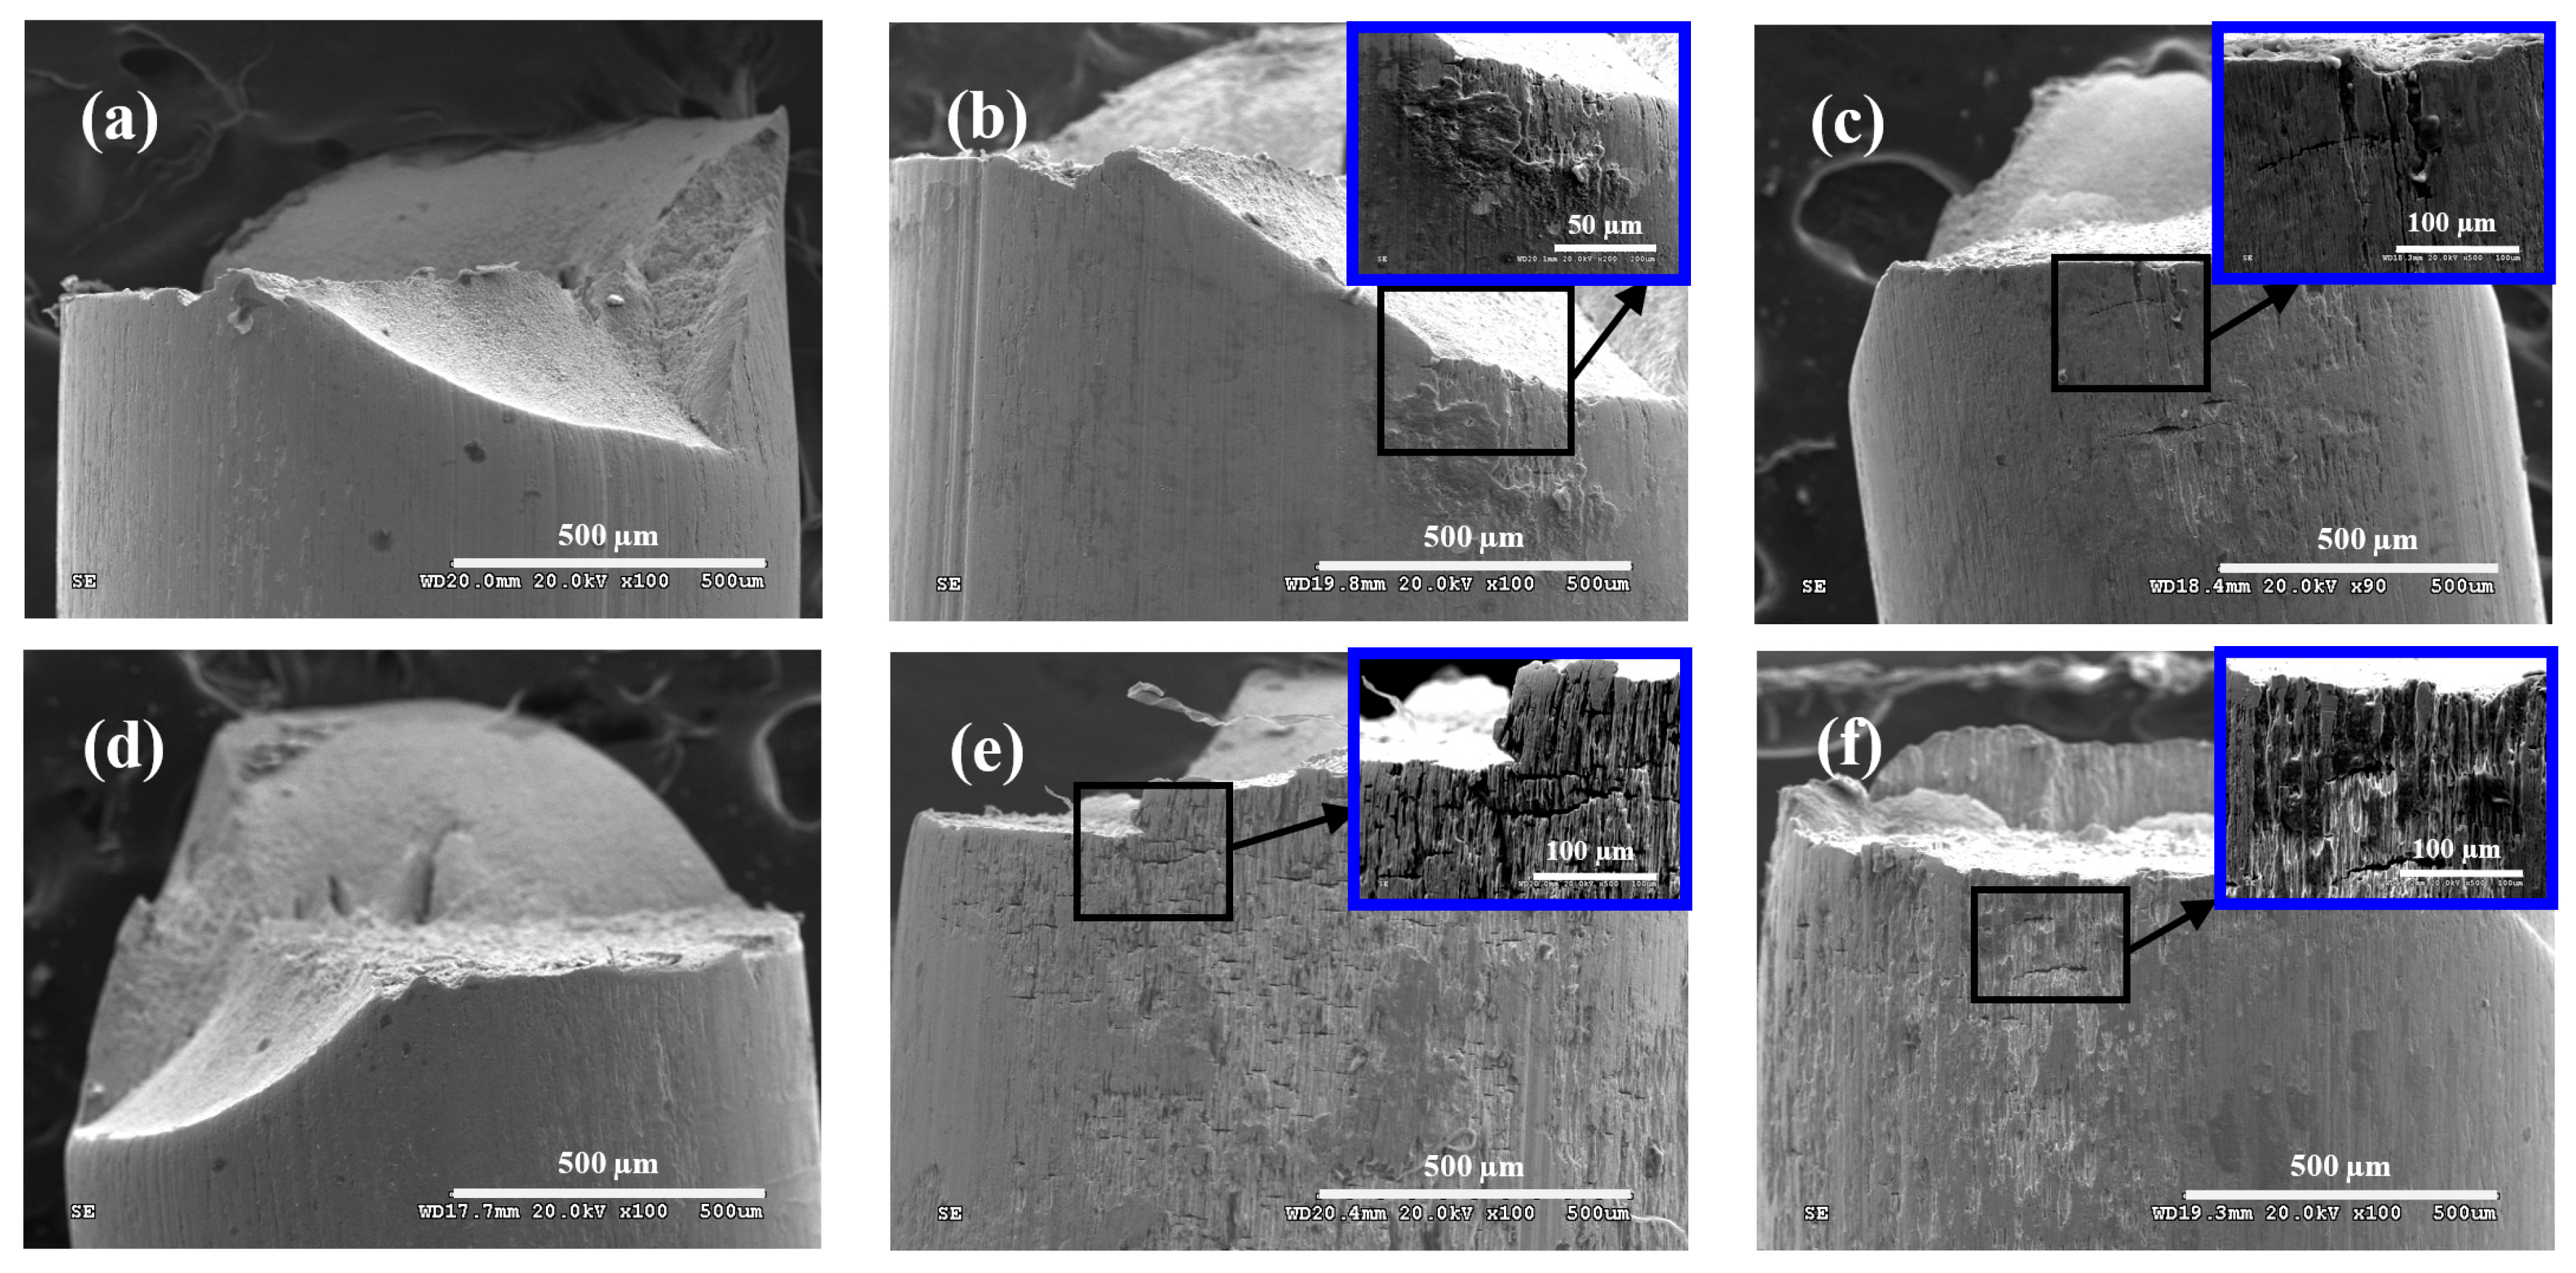
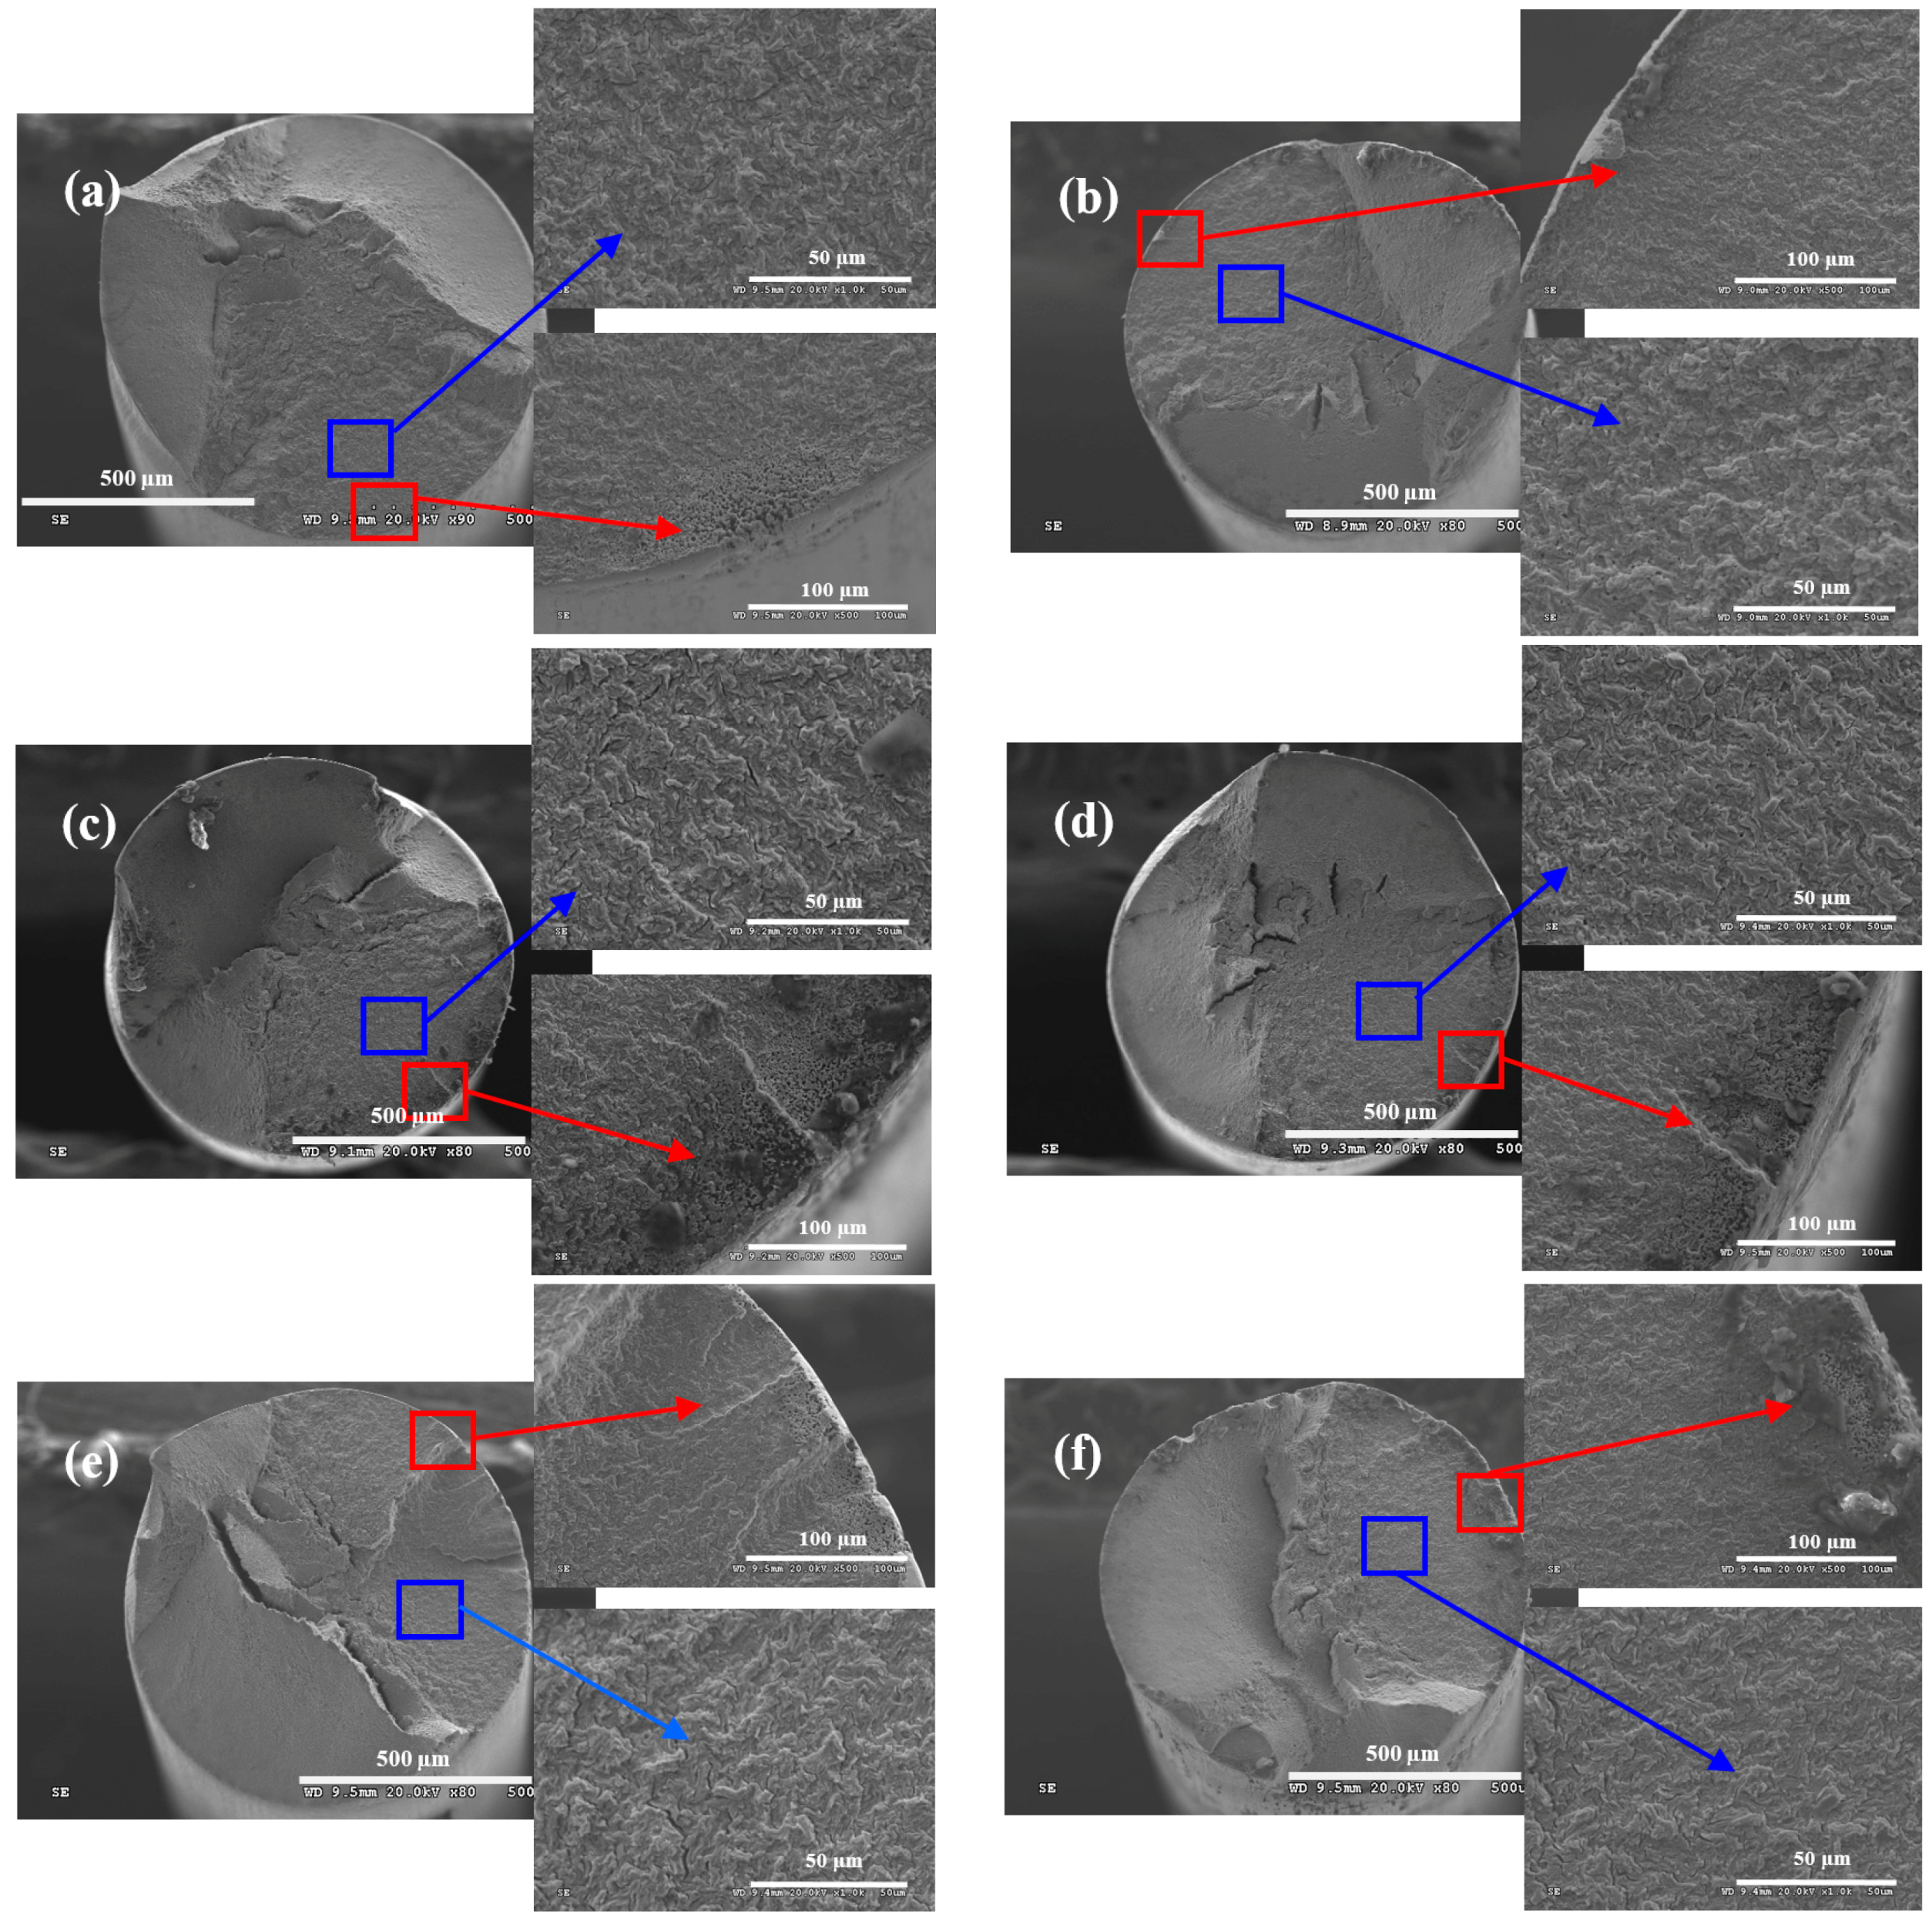
Figure 8.
Wire fracture morphologies under: (a) r = 0.05, f = 2 Hz; (b) r = 0.05, f = 5 Hz; (c) r = 0.25, f = 2 Hz; (d) r = 0.25, f = 5 Hz; (e) r = 0.5, f = 2 Hz; and (f) r = 0.5, f = 5 Hz in acid solution.
Figure 8.
Wire fracture morphologies under: (a) r = 0.05, f = 2 Hz; (b) r = 0.05, f = 5 Hz; (c) r = 0.25, f = 2 Hz; (d) r = 0.25, f = 5 Hz; (e) r = 0.5, f = 2 Hz; and (f) r = 0.5, f = 5 Hz in acid solution.
Figure 9.
Morphologies on side surface of steel wire under: (a) r = 0.05, f = 2 Hz; (b) r = 0.05, f = 5 Hz; (c) r = 0.25, f = 2 Hz; (d) r = 0.25, f = 5 Hz; (e) r = 0.5, f = 2 Hz; and (f) r = 0.5, f = 5 Hz in neutral solution.
Figure 9.
Morphologies on side surface of steel wire under: (a) r = 0.05, f = 2 Hz; (b) r = 0.05, f = 5 Hz; (c) r = 0.25, f = 2 Hz; (d) r = 0.25, f = 5 Hz; (e) r = 0.5, f = 2 Hz; and (f) r = 0.5, f = 5 Hz in neutral solution.
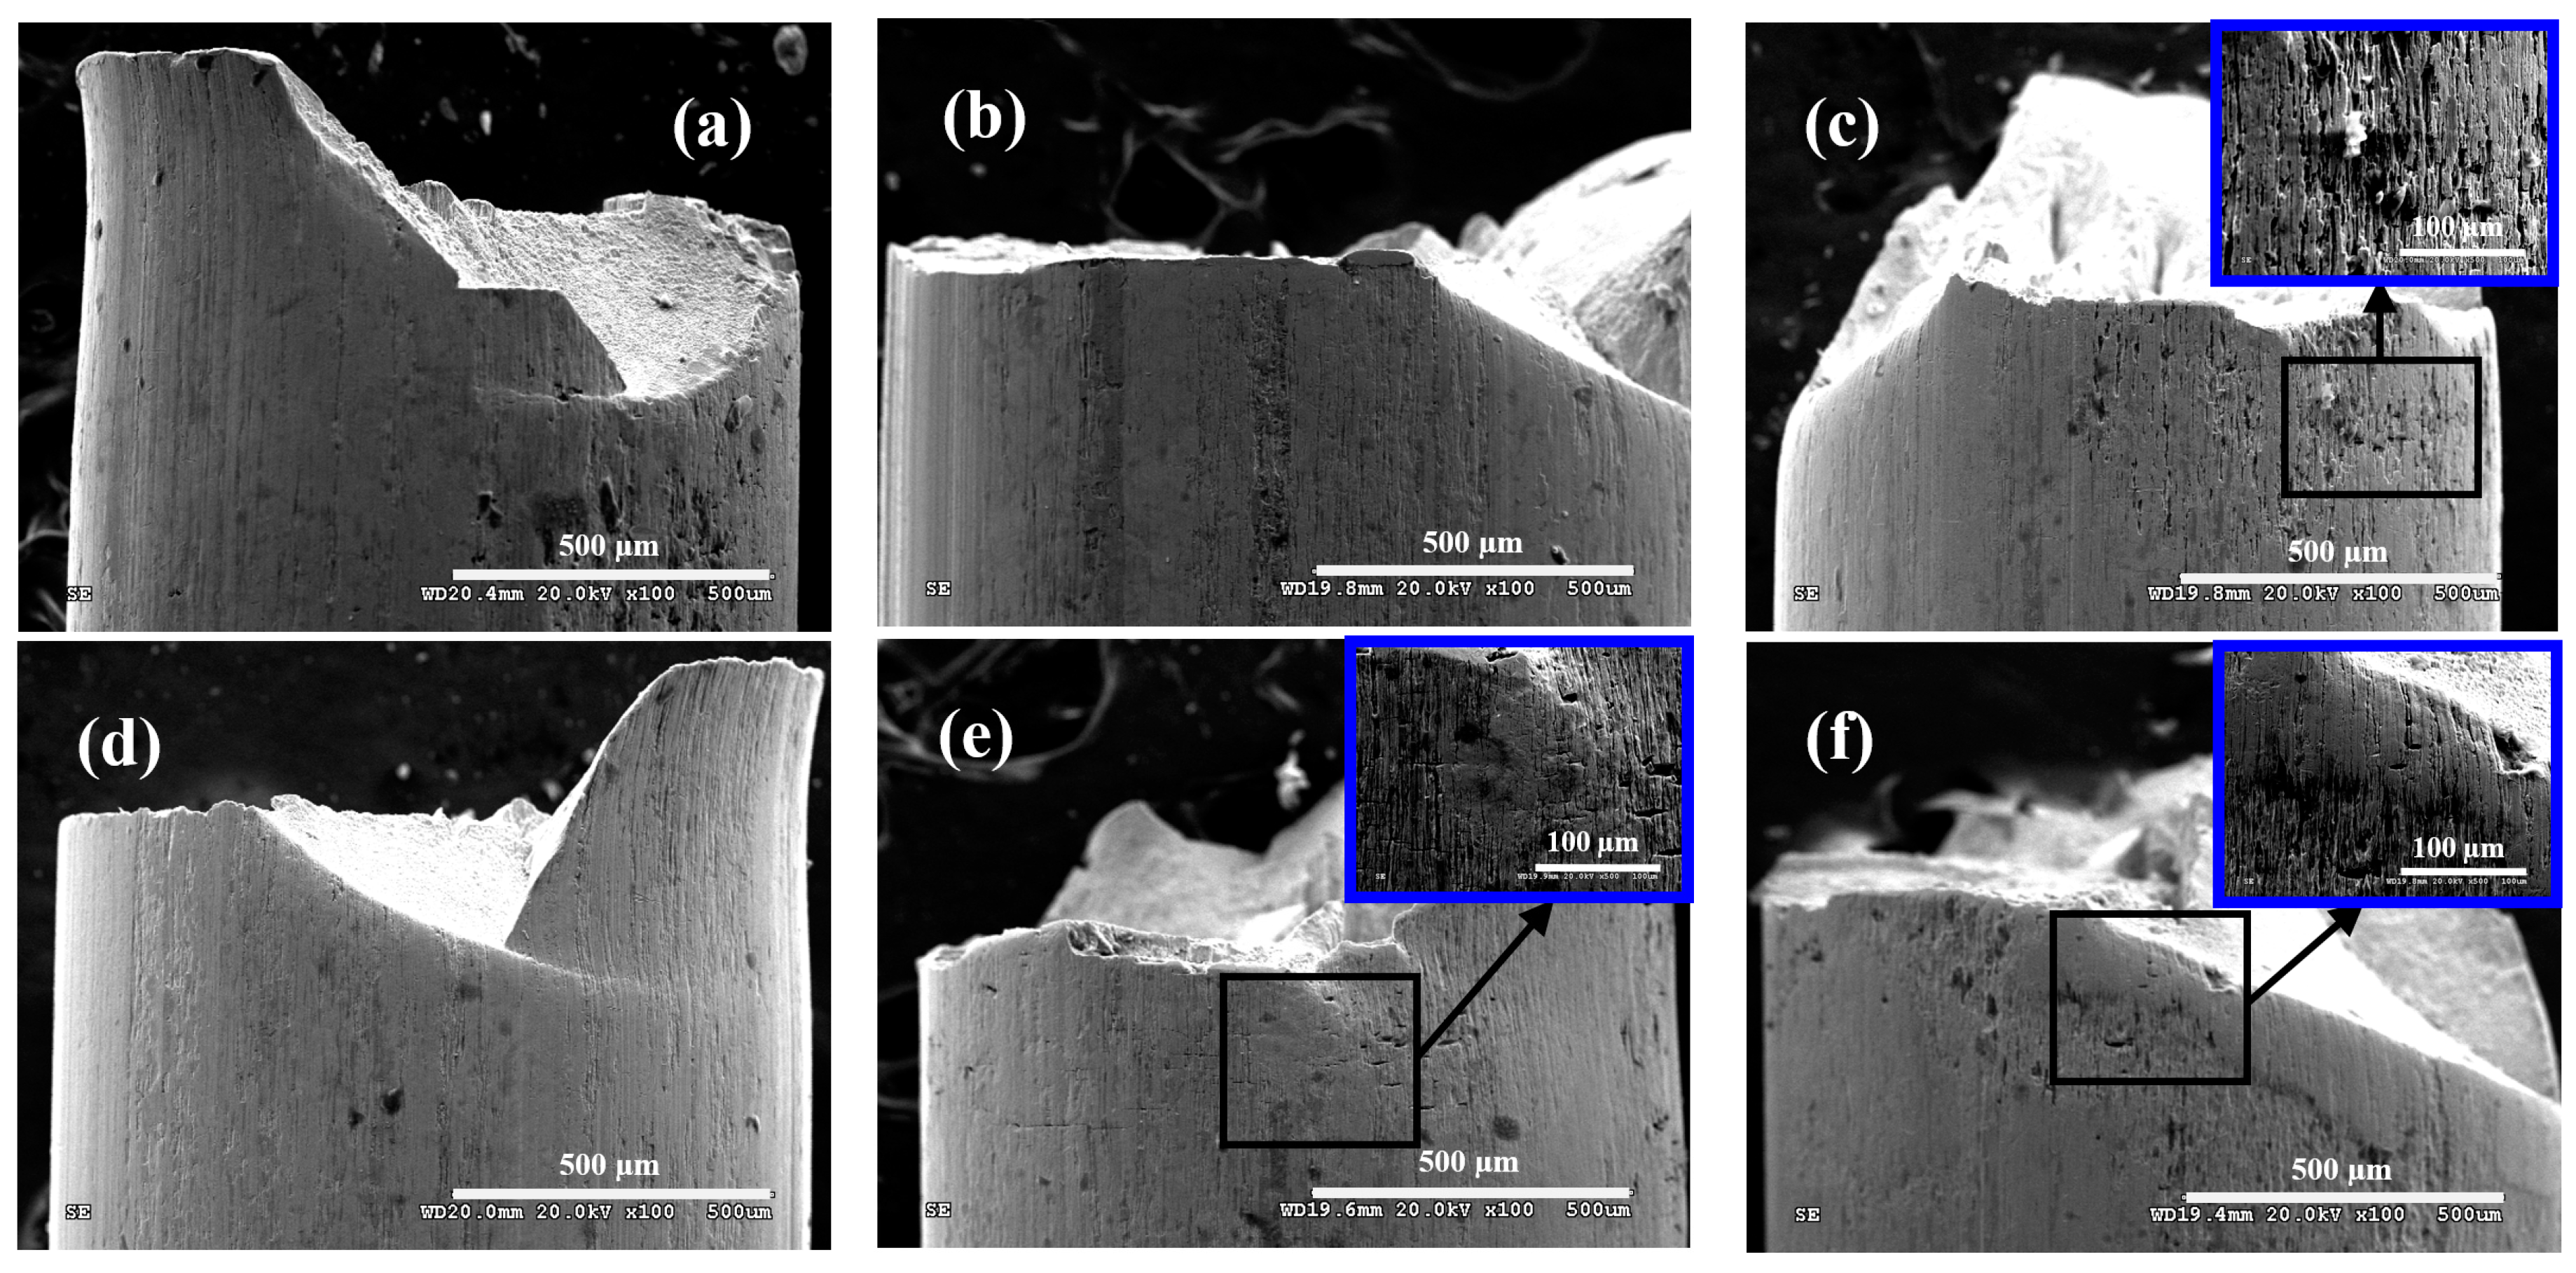
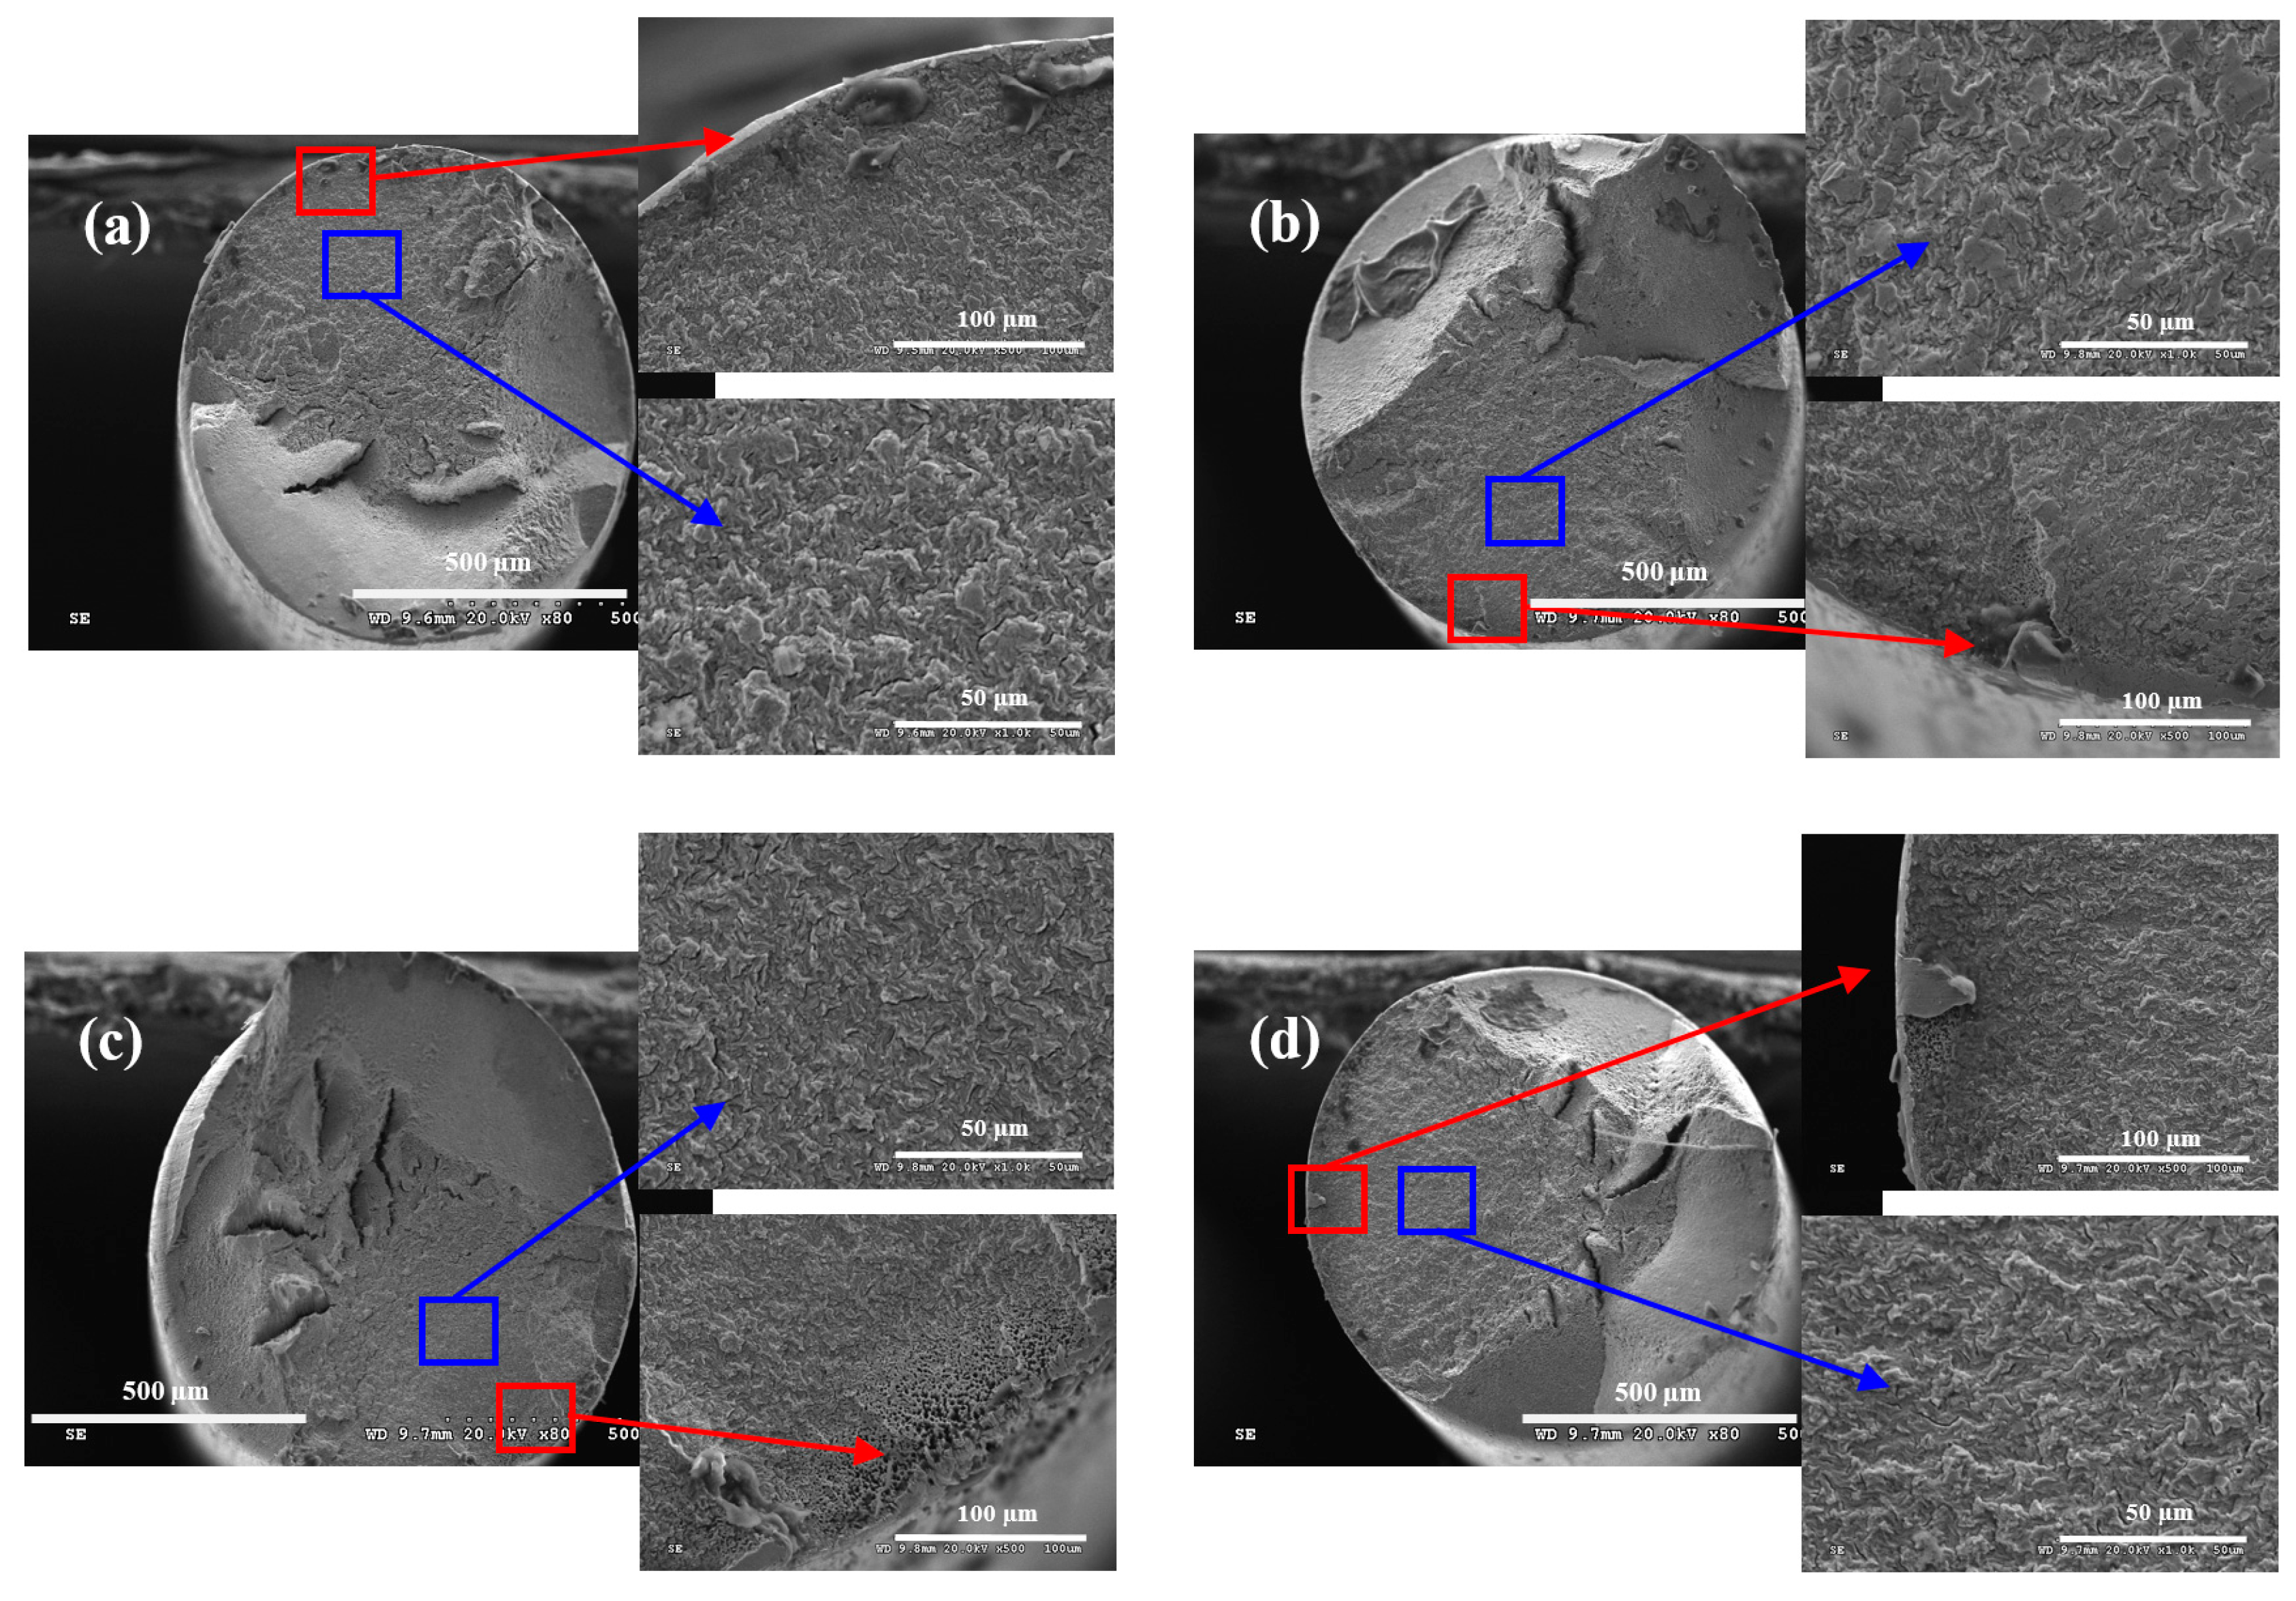
Figure 10.
Wire fracture morphologies under: (a) r = 0.05, f = 2 Hz; (b) r = 0.05, f = 5 Hz; (c) r = 0.25, f = 2 Hz; (d) r = 0.25, f = 5 Hz; (e) r = 0.5, f = 2 Hz; and (f) r = 0.5, f = 5 Hz in neutral solution.
Figure 10.
Wire fracture morphologies under: (a) r = 0.05, f = 2 Hz; (b) r = 0.05, f = 5 Hz; (c) r = 0.25, f = 2 Hz; (d) r = 0.25, f = 5 Hz; (e) r = 0.5, f = 2 Hz; and (f) r = 0.5, f = 5 Hz in neutral solution.
Figure 11.
Morphologies on side surface of steel wire under: (a) r = 0.05, f = 2 Hz; (b) r = 0.05, f = 5 Hz; (c) r = 0.25, f = 2 Hz; (d) r = 0.25, f = 5 Hz; (e) r = 0.5, f = 2 Hz; and (f) r = 0.5, f = 5 Hz in alkaline solution.
Figure 11.
Morphologies on side surface of steel wire under: (a) r = 0.05, f = 2 Hz; (b) r = 0.05, f = 5 Hz; (c) r = 0.25, f = 2 Hz; (d) r = 0.25, f = 5 Hz; (e) r = 0.5, f = 2 Hz; and (f) r = 0.5, f = 5 Hz in alkaline solution.
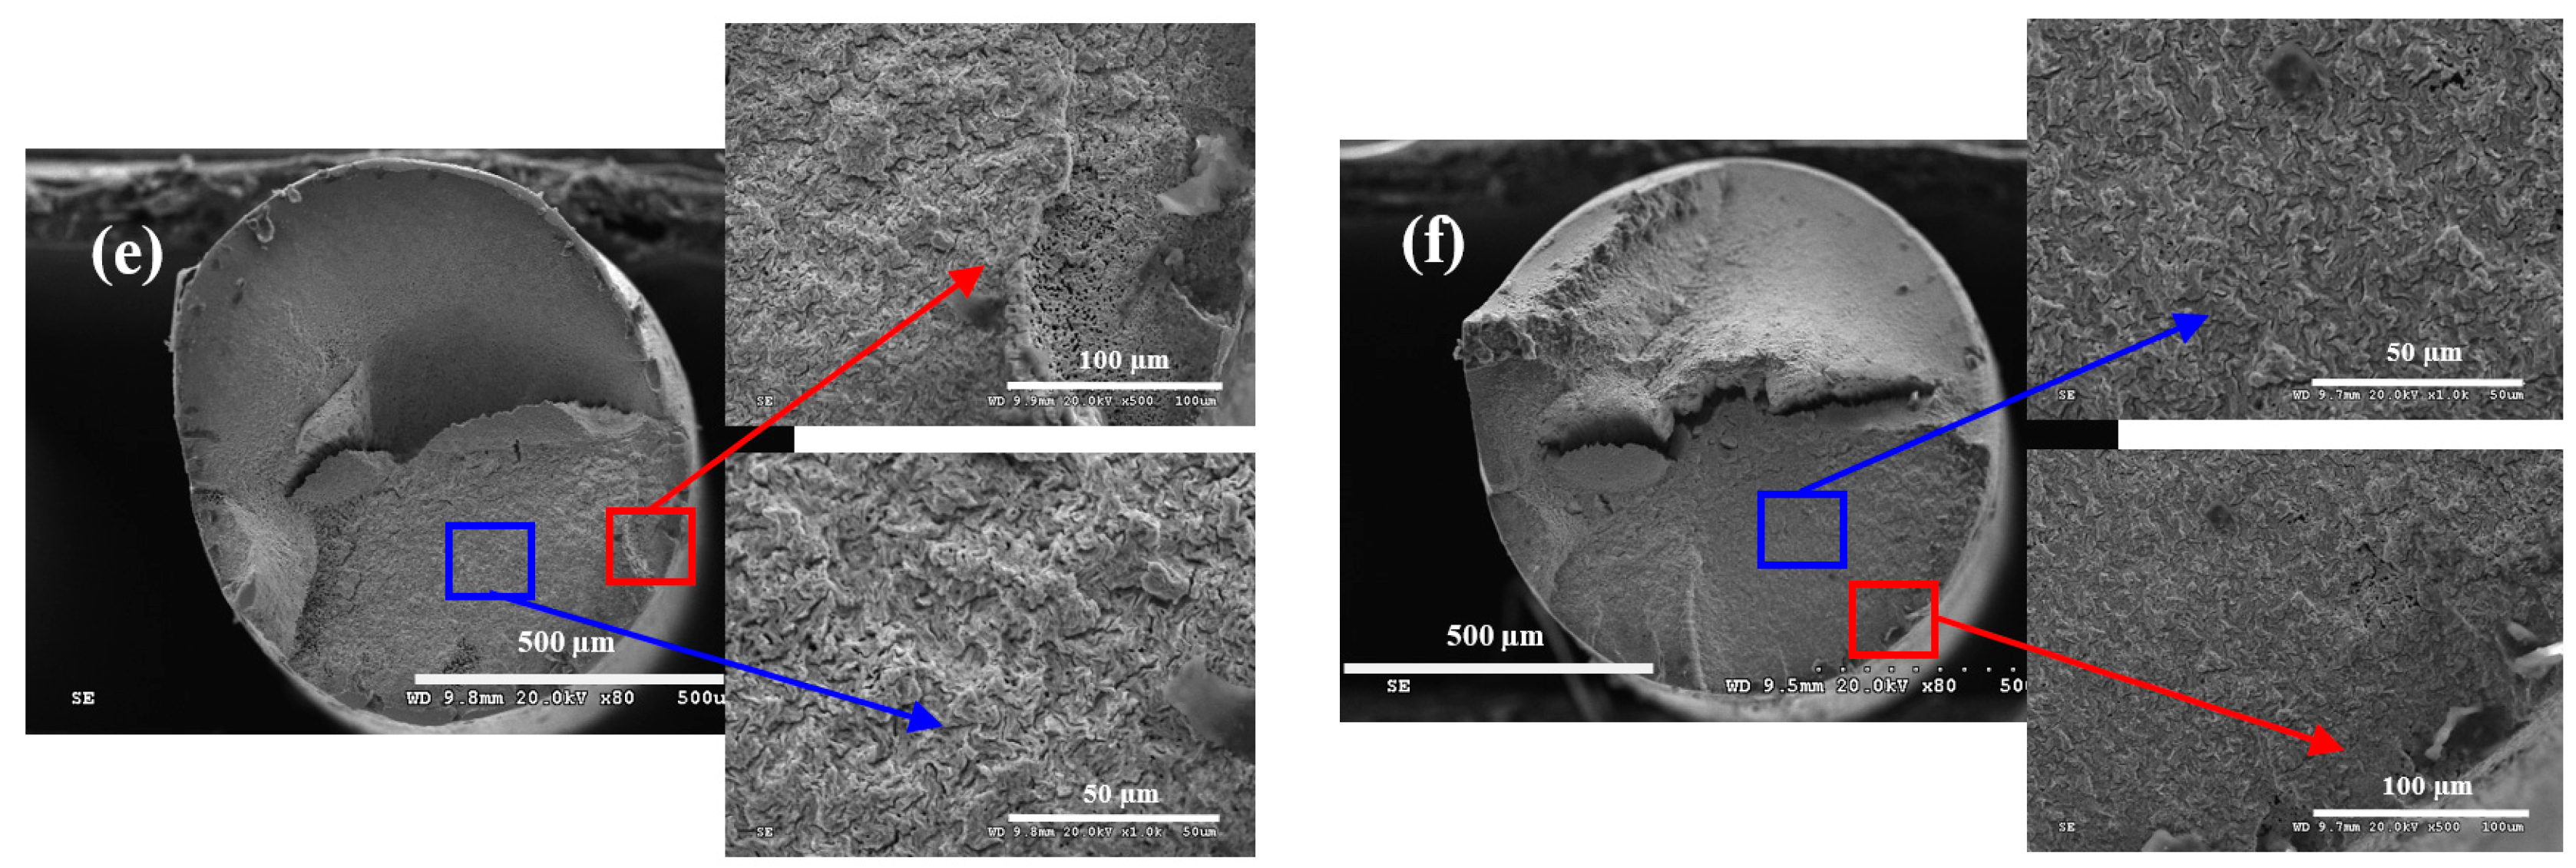
Figure 12.
Wire fracture morphologies under: (a) r = 0.05, f = 2 Hz; (b) r = 0.05, f = 5 Hz; (c) r = 0.25, f = 2 Hz; (d) r = 0.25, f = 5 Hz; (e) r = 0.5, f = 2 Hz; and (f) r = 0.5, f = 5 Hz in alkaline solution.
Figure 12.
Wire fracture morphologies under: (a) r = 0.05, f = 2 Hz; (b) r = 0.05, f = 5 Hz; (c) r = 0.25, f = 2 Hz; (d) r = 0.25, f = 5 Hz; (e) r = 0.5, f = 2 Hz; and (f) r = 0.5, f = 5 Hz in alkaline solution.
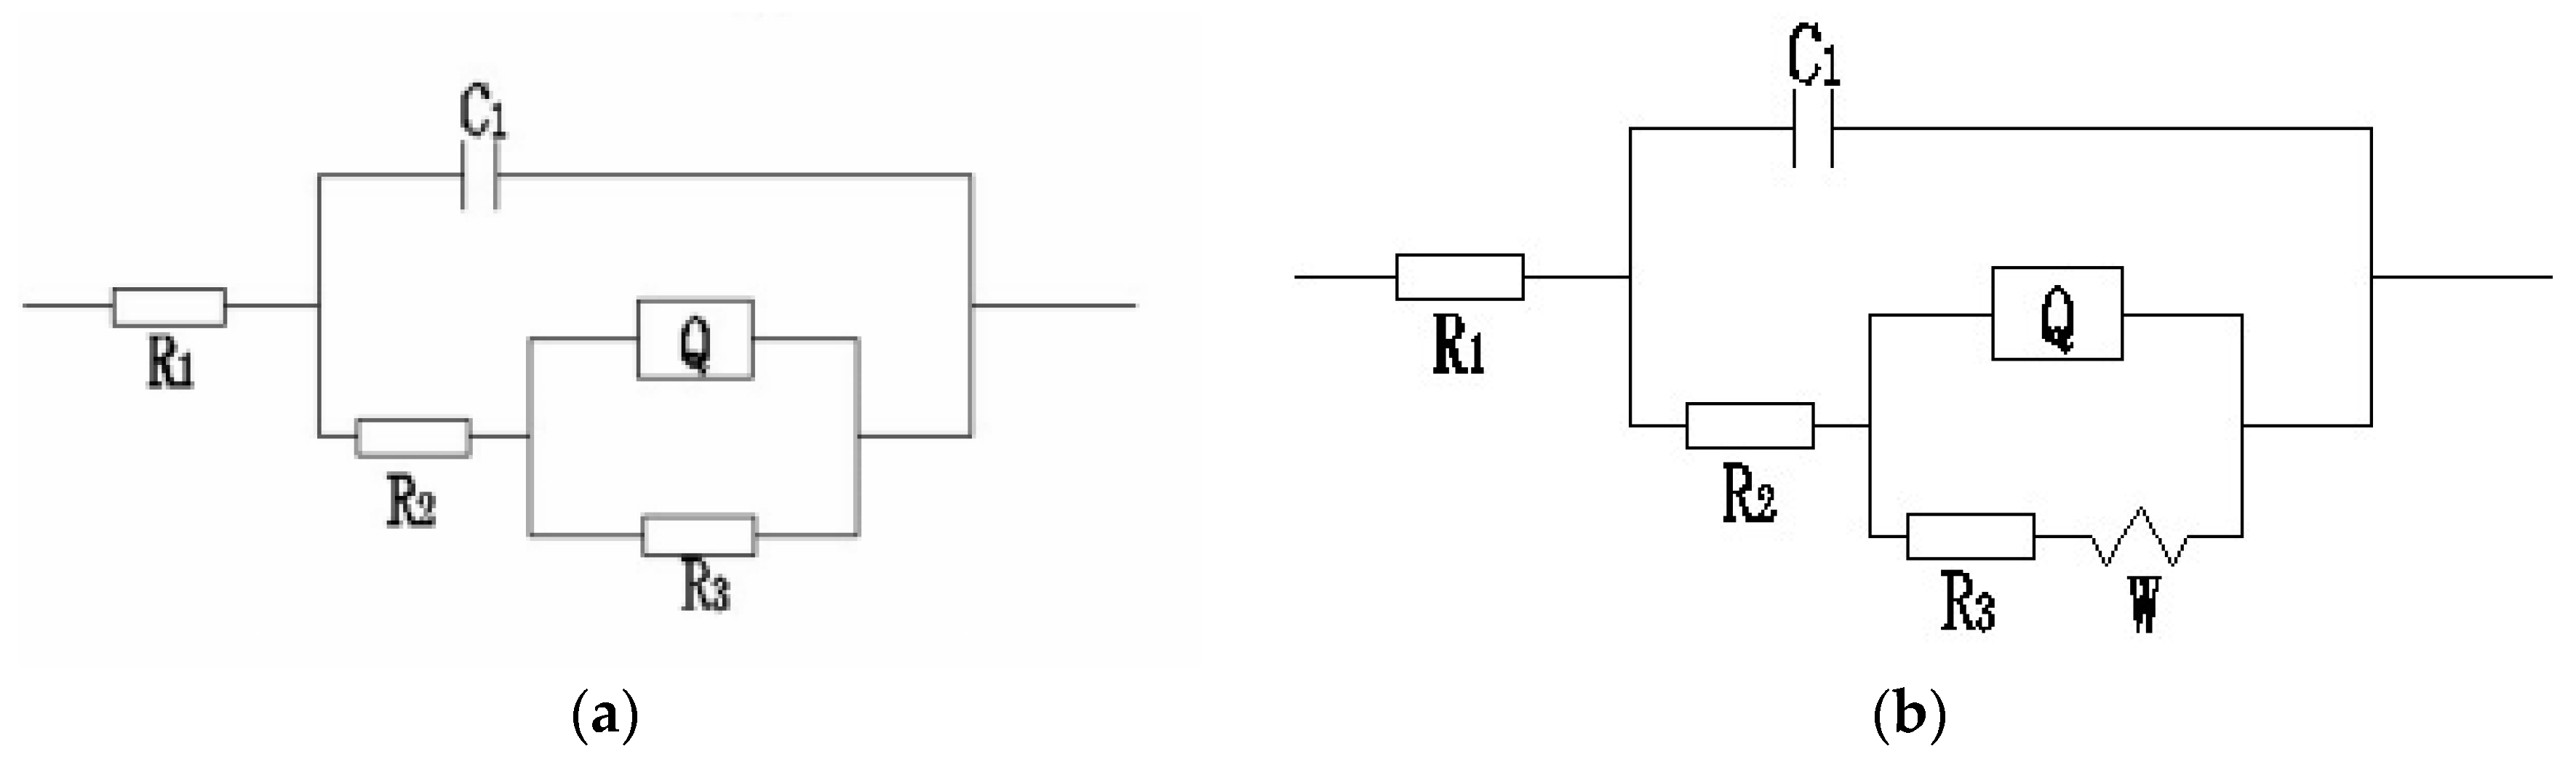
Figure 13.
Equivalent circuits obtained by Nyquist plots. (a) R(C(R(QR))); (b) R(C(R(Q(RW)))).
Figure 13.
Equivalent circuits obtained by Nyquist plots. (a) R(C(R(QR))); (b) R(C(R(Q(RW)))).
Table 1.
Chemical composition of steel wire (in wt. %).
Table 1.
Chemical composition of steel wire (in wt. %).
| Composition | Fe | Mn | Si | Ni | C | S | P |
|---|
| Percentage | 94.62 | 4.53 | 0.02 | 0.01 | 0.84 | 0.001 | <0.001 |
Table 2.
Mechanical properties of steel wire.
Table 2.
Mechanical properties of steel wire.
| Mechanical Properties | Tensile Strength | Yield Strength | Young Modulus | Elongation Ratio | Section Shrinkage |
|---|
| Value | 1750 MPa | 1300 MPa | 210 GPa | 24.19% | 34.78% |
Table 3.
Typical water quality composition of coalmine.
Table 3.
Typical water quality composition of coalmine.
| pH | Ion Content/mg/L |
|---|
| H+ | K+ | Na+ | Ca2+ | Mg2+ | Cl− | SO42− | OH− | HCO3− |
|---|
| 2.97 | 1.28 | 11.73 | 92.42 | 676.55 | 364.74 | 28.36 | 3283.81 | | |
| 6.97 | | 11.73 | 141.16 | 80.56 | 49.33 | 89.33 | 551.38 | | |
| 9.97 | | 11.73 | 35.63 | 54.43 | 36.45 | 89.33 | 232.95 | 3.33 | 18.92 |
Table 4.
Corrosion kinetic parameters of steel wires in acid solution.
Table 4.
Corrosion kinetic parameters of steel wires in acid solution.
| Time | R1 | C1 | R2 | Q | R3 |
|---|
| h | Ω·cm2 | F·cm−2 | Ω·cm2 | C2/F·cm−2 | n | Ω·cm2 |
|---|
| 1 | 21.25 | 2.012 × 10⁻⁵ | 21.8 | 4.993 × 10⁻⁴ | 0.6385 | 952.8 |
| 24 | 19.97 | 1.43 × 10⁻⁴ | 10.09 | 1.397 × 10⁻³ | 0.7225 | 260.8 |
| 96 | 21.03 | 1.213 × 10⁻⁴ | 4.484 | 1.698 × 10⁻³ | 0.7212 | 411.1 |
| 168 | 24.78 | 1.394 × 10⁻⁴ | 4.189 | 1.908 × 10⁻³ | 0.7383 | 719.8 |
| 240 | 16.89 | 2.537 × 10⁻⁴ | 5.005 | 1.932 × 10⁻³ | 0.7171 | 1051 |
| 312 | 12.89 | 5.191 × 10⁻⁴ | 4.404 | 3.063 × 10⁻³ | 0.7176 | 887.3 |
| 432 | 14.08 | 7.231 × 10⁻⁵ | 1.063 | 3.814 × 10⁻³ | 0.7472 | 712.7 |
| 562 | 17.75 | 7.686 × 10⁻⁵ | 1.299 | 4.315 × 10⁻³ | 0.7289 | 990 |
| 720 | 9.023 | 1.643 × 10⁻⁴ | 0.306 | 4.783 × 10⁻³ | 0.7136 | 717.8 |
Table 5.
Corrosion kinetic parameters of steel wires in neutral solution.
Table 5.
Corrosion kinetic parameters of steel wires in neutral solution.
| Time | R1 | C1 | R2 | Q | R3 | W |
|---|
| h | Ω·cm2 | F·cm−2 | Ω·cm2 | C2/F·cm−2 | n | Ω·cm2 | |
|---|
| 1 | 147.4 | 5.386 × 10⁻⁵ | 29.38 | 2.013 × 10⁻³ | 0.6414 | 854.1 | |
| 24 | 99 | 6.955 × 10⁻⁵ | 24.12 | 1.878 × 10⁻³ | 0.6708 | 632.9 | |
| 96 | 110.6 | 1.407 × 10⁻⁶ | 9.886 | 3.065 × 10⁻³ | 0.5822 | 470.1 | |
| 168 | 97.64 | 2.968 × 10⁻⁷ | 5.959 | 3.394 × 10⁻³ | 0.5783 | 504 | |
| 240 | 60.96 | 1.5 × 10⁻⁵ | 3.075 | 1.373 × 10⁻³ | 0.7108 | 39.51 | 1.472 × 10⁻² |
| 312 | 114.1 | 3.37 × 10⁻⁷ | 9.592 | 4.666 × 10⁻³ | 0.5183 | 1905 | |
| 432 | 119 | 6.962 × 10⁻⁷ | 20.37 | 6.12 × 10⁻³ | 0.3636 | 1713 | |
| 562 | 81.4 | 2.378 × 10⁻⁷ | 6.553 | 3.516 × 10⁻³ | 0.5668 | 101.5 | 1.249 × 10⁻² |
| 720 | 123 | 4.683 × 10⁻⁸ | 23.19 | 2.103 × 10⁻³ | 0.3135 | 98.1 | 1.097 × 10⁻³ |
Table 6.
Corrosion kinetic parameters of steel wires in alkaline solution.
Table 6.
Corrosion kinetic parameters of steel wires in alkaline solution.
| Time | R1 | C1 | R2 | Q | R3 | W |
|---|
| h | Ω·cm2 | F·cm−2 | Ω·cm2 | C2/F·cm−2 | n | Ω·cm2 | |
|---|
| 1 | 183.9 | 1.341 × 10⁻⁴ | 547.2 | 0.0008045 | 0.6958 | 1764 | |
| 24 | 87.81 | 2.89 × 10⁻⁸ | 242.8 | 0.001643 | 0.7307 | 679.8 | |
| 96 | 136.9 | 1.21 × 10⁻⁸ | 34.69 | 0.002154 | 0.7212 | 994.7 | |
| 168 | 122.5 | 7.41 × 10⁻⁸ | 13.53 | 0.002572 | 0.5383 | 931.1 | |
| 240 | 137.6 | 4.32 × 10⁻⁸ | 5.005 | 0.001932 | 0.7171 | 536.8 | |
| 312 | 148.6 | 5.251 × 10⁻⁸ | 23.79 | 0.005063 | 0.5176 | 651.1 | |
| 432 | 157.1 | 3.231 × 10⁻⁷ | 17.15 | 0.003478 | 0.5472 | 1439 | |
| 562 | 127.5 | 9.686 × 10⁻⁸ | 5.509 | 0.003954 | 0.4289 | 39.21 | 1.704 × 10⁻³ |
| 720 | 189.6 | 7.537 × 10⁻⁸ | 18.5 | 0.002326 | 0.5136 | 98.73 | 3.888 × 10⁻³ |
Table 7.
Equivalent circuits of steel wires in different solutions at different immersion times.
Table 7.
Equivalent circuits of steel wires in different solutions at different immersion times.
| Solution | Initial Immersion (1 h) | Medium-Term Immersion (24–240 h) | Late Immersion (312–720 h) |
|---|
| Acid solution | R(C(R(QR))) | R(C(R(QR))) | R(C(R(QR))) |
| Neutral solution | R(C(R(QR))) | R(C(R(QR))) | R(C(R(Q(RW)))) |
| Alkaline solution | R(C(R(QR)))) | R(C(R(QR))) | R(C(R(Q(RW)))) |
Table 8.
Morphological property on the side surface of steel wire.
Table 8.
Morphological property on the side surface of steel wire.
| Conditions | Acid Solution | Neutral Solution | Alkaline Solution |
|---|
| r = 0.05, f = 2 Hz | P/C | None | None |
| r = 0.05, f = 5 Hz | Unobvious | None | None |
| r = 0.25, f = 2 Hz | P | C | C |
| r = 0.25, f = 5 Hz | P/C | None | None |
| r = 0.5, f = 2 Hz | P | C | C |
| r = 0.5, f = 5 Hz | P | C | C |
Table 9.
Initiation mechanism of corrosion fatigue crack under different conditions.
Table 9.
Initiation mechanism of corrosion fatigue crack under different conditions.
| Conditions | Acid Solution | Neutral Solution | Alkaline Solution |
|---|
| r = 0.05, f = 2 Hz | A | A | D |
| r = 0.05, f = 5 Hz | A/D | D | D |
| r = 0.25, f = 2 Hz | A/D | A | A |
| r = 0.25, f = 5 Hz | A | A | D |
| r = 0.5, f = 2 Hz | A | A/D | A |
| r = 0.5, f = 5 Hz | A | A | D |


