Article

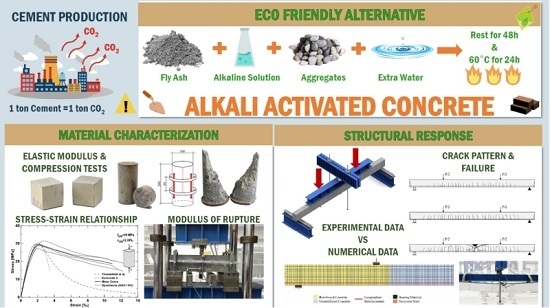
Experimental Study on Full-Scale Beams Made by Reinforced Alkali Activated Concrete Undergoing Flexure

DICATAM—Department of Civil Engineering, Architecture, Environment, Land Planning and Mathematics, University of Brescia, 25123 Brescia, Italy
*
Author to whom correspondence should be addressed.
Materials 2016, 9(9), 739; https://doi.org/10.3390/ma9090739
Submission received: 15 May 2016 / Revised: 24 July 2016 / Accepted: 22 August 2016 / Published: 30 August 2016
(This article belongs to the Special Issue Advances in Geopolymers and Alkali-Activated Materials)

Abstract

:
Alkali Activated Concrete (AAC) is an alternative kind of concrete that uses fly ash as a total replacement of Portland cement. Fly ash combined with alkaline solution and cured at high temperature reacts to form a binder. Four point bending tests on two full scale beams made with AAC are described in this paper. Companion small material specimens were also casted with the aim of properly characterizing this new tailored material. The beam’s length was 5000 mm and the cross section was 200 mm × 300 mm. The AAC consisted of fly ash, water, sand 0–4 mm and coarse aggregate 6–10 mm; and the alkaline solution consisted of sodium hydroxide mixed with sodium silicate. No cement was utilized. The maximum aggregate size was 10 mm; fly ash was type F, containing a maximum calcium content of 2%. After a rest period of two days, the beam was cured at 60 °C for 24 h. Data collected and critically discussed included beam deflection, crack patterns, compressive and flexural strength and elastic modulus. Results show how AAC behavior is comparable with Ordinary Portland Cement (OPC) based materials. Nonlinear numerical analyses are finally reported, promoting a better understanding of the structural response.

Graphical Abstract

1. Introduction

Concrete is an essential material in the building industry with a global consumption estimated around 25 billion tons every year [1]; it is considered one of the most widely used materials in the world. The production process of concrete, however, has a significant impact on global warming; this is especially due to the use of Ordinary Portland Cement (OPC), the main component of concrete. The cement industry is in fact responsible for about 6%–7% of CO2 emissions worldwide [2], which is especially due to fossil fuel used during manufacturing processes that emit greenhouses gases. It has been estimated that the production of one ton of cement releases about one ton of CO2 [3] and, moreover, OPC production uses large amounts of raw materials, especially limestone.
The need for environmentally friendly building materials for sustainable development is now a major environmental issue in the construction industry; over the last decades, there has been a remarkable development of alkali activated materials as an alternative kind of concrete that uses an aluminosilicate powder as a total replacement of cement. Alkali activated cements are synthetized from powders rich in alumina and silica which are soluble in highly alkaline solutions. The combination of an aluminosilicate source and alkaline solution react to form a binder, playing a similar role of cement combined with water in the ordinary concrete. The aluminosilicate base that could be activated through the alkaline solution could be a metakaolin or industrial byproduct material such as fly ash and ground-granulated blast furnace slags. The remaining mixture ingredients are ordinary coarse and fine aggregates and eventually extra water to improve workability.
Early research about alkali activated materials began in the 1940s with Purdon’s [4] studies, in which activation through sodium hydroxide solution of blast furnace slag was analyzed. Later, in the 1959, Gluchovskij [5] investigated the synthesis of new binding materials through the reaction of aluminosilicate raw materials with alkaline compounds. In 1976, Davidovits [6] defined the term “geopolymer” to classify the geosynthesis that produces inorganic polymeric materials used for a number of industrial applications.
Regarding the mechanical characterization of AAC there is a significant amount of literature. Different authors [7,8] demonstrated that the combination of different materials composing AAC is fundamental for compressive strength development; similarly to OPC, a main role is played by the equivalent water/geopolymer solids ratio; compressive strength increases when this ratio decreases. An increase in sodium hydroxide molarity is favorable for strength. Compressive strength investigated reached values close to 80 MPa.
Curing at high temperature allows AAC to achieve good mechanical performance in a short period of time. The curing process takes place after mold removal, AAC is heated up to 60 °C or more, a rapid polymerization occurs and the compressive strength slightly increases over time, showing almost the same values between 7 and 28 days [9,10]. On the other hand, under ambient curing, an increase of compressive strength of about 10–15 MPa between 7 and 28 days occurs due to protraction of polymerization reaction [11].
Elastic modulus has been investigated by different authors [9,10,11,12] and compared with different national standards. In general, experimental elastic modulus has found to be lower than that predicted by standard codes, depending on the coarse aggregate used in the mixture.
Experimental data on the complete stress–strain curve of AAC are scarce in literature; Hardjito et al. [9] found a good fitting between experimental data and analytical curves for OPC concrete. Sarker [13] modified the post-peak existing stress–strain model originally proposed by Popovics [14] for OPC concrete to predict AAC behavior, evidencing a slightly more brittle post-peak behavior.
As found by different authors [9,11], tensile and flexural strength present a better performance than that obtained through standards for OPC-based concretes. Sarker [15] investigated the bond between AAC and steel rebar: AAC presents a better bond strength because of higher splitting tensile strength. In addition, the interfacial transition zone (ITZ) between aggregate and paste is denser compared to the one in OPC. Fernandez provided similar results [10].
Regarding the addition of superplasticizers, there are different theories in literature on their efficiency: some authors [16] experimented an improvement in workability, others did not find any enhancement [17,18]. Nematollahi [19] concluded that efficiency of superplasticizer admixtures on the workability and strength of fly ash-based mixtures directly depend on the type of alkaline activator and the chemistry of the superplasticizer.
Data about structural behavior of AAC full-scale elements are scarce in literature: Yost et al. [12,20] investigated the behavior in shear of reinforced AAC beams: data collected included load-displacement plot, analysis of strain and crack patterns that showed a behavior very similar to OPC-based structural elements. Similar results have been found by Sumajow et al. [21] who tested AAC beams; experimental data were in agreement with Australian standards for concrete structures. Sumajow et al. [22,23] focused on the behavior of AAC columns loaded with an eccentric axial load; the failure was due, as expected, to AAC crushing. Results showed good correlation with American Concrete Institute Building Code ACI 318-02 [24] and the Australian Standard AS3600 [25].
NG et al. [26] investigated the shear behavior of AAC beams reinforced with steel fibers in various volumetric dosages. They found an increase in the final shear strength and in the cracking load with increasing fiber volume.
The project described herein, which comprises two full-scale tests on beams under flexure and a set of tests for material characterization, was aimed at evaluating the AAC’s mechanical properties, under both a structural and material point of view, in order to foresee its utilization in the construction field, especially in structural applications related to both light (duct elements, manholes, etc.) and heavy (beams, columns, roof elements, etc.) prefabrication.

2. Materials and Methods

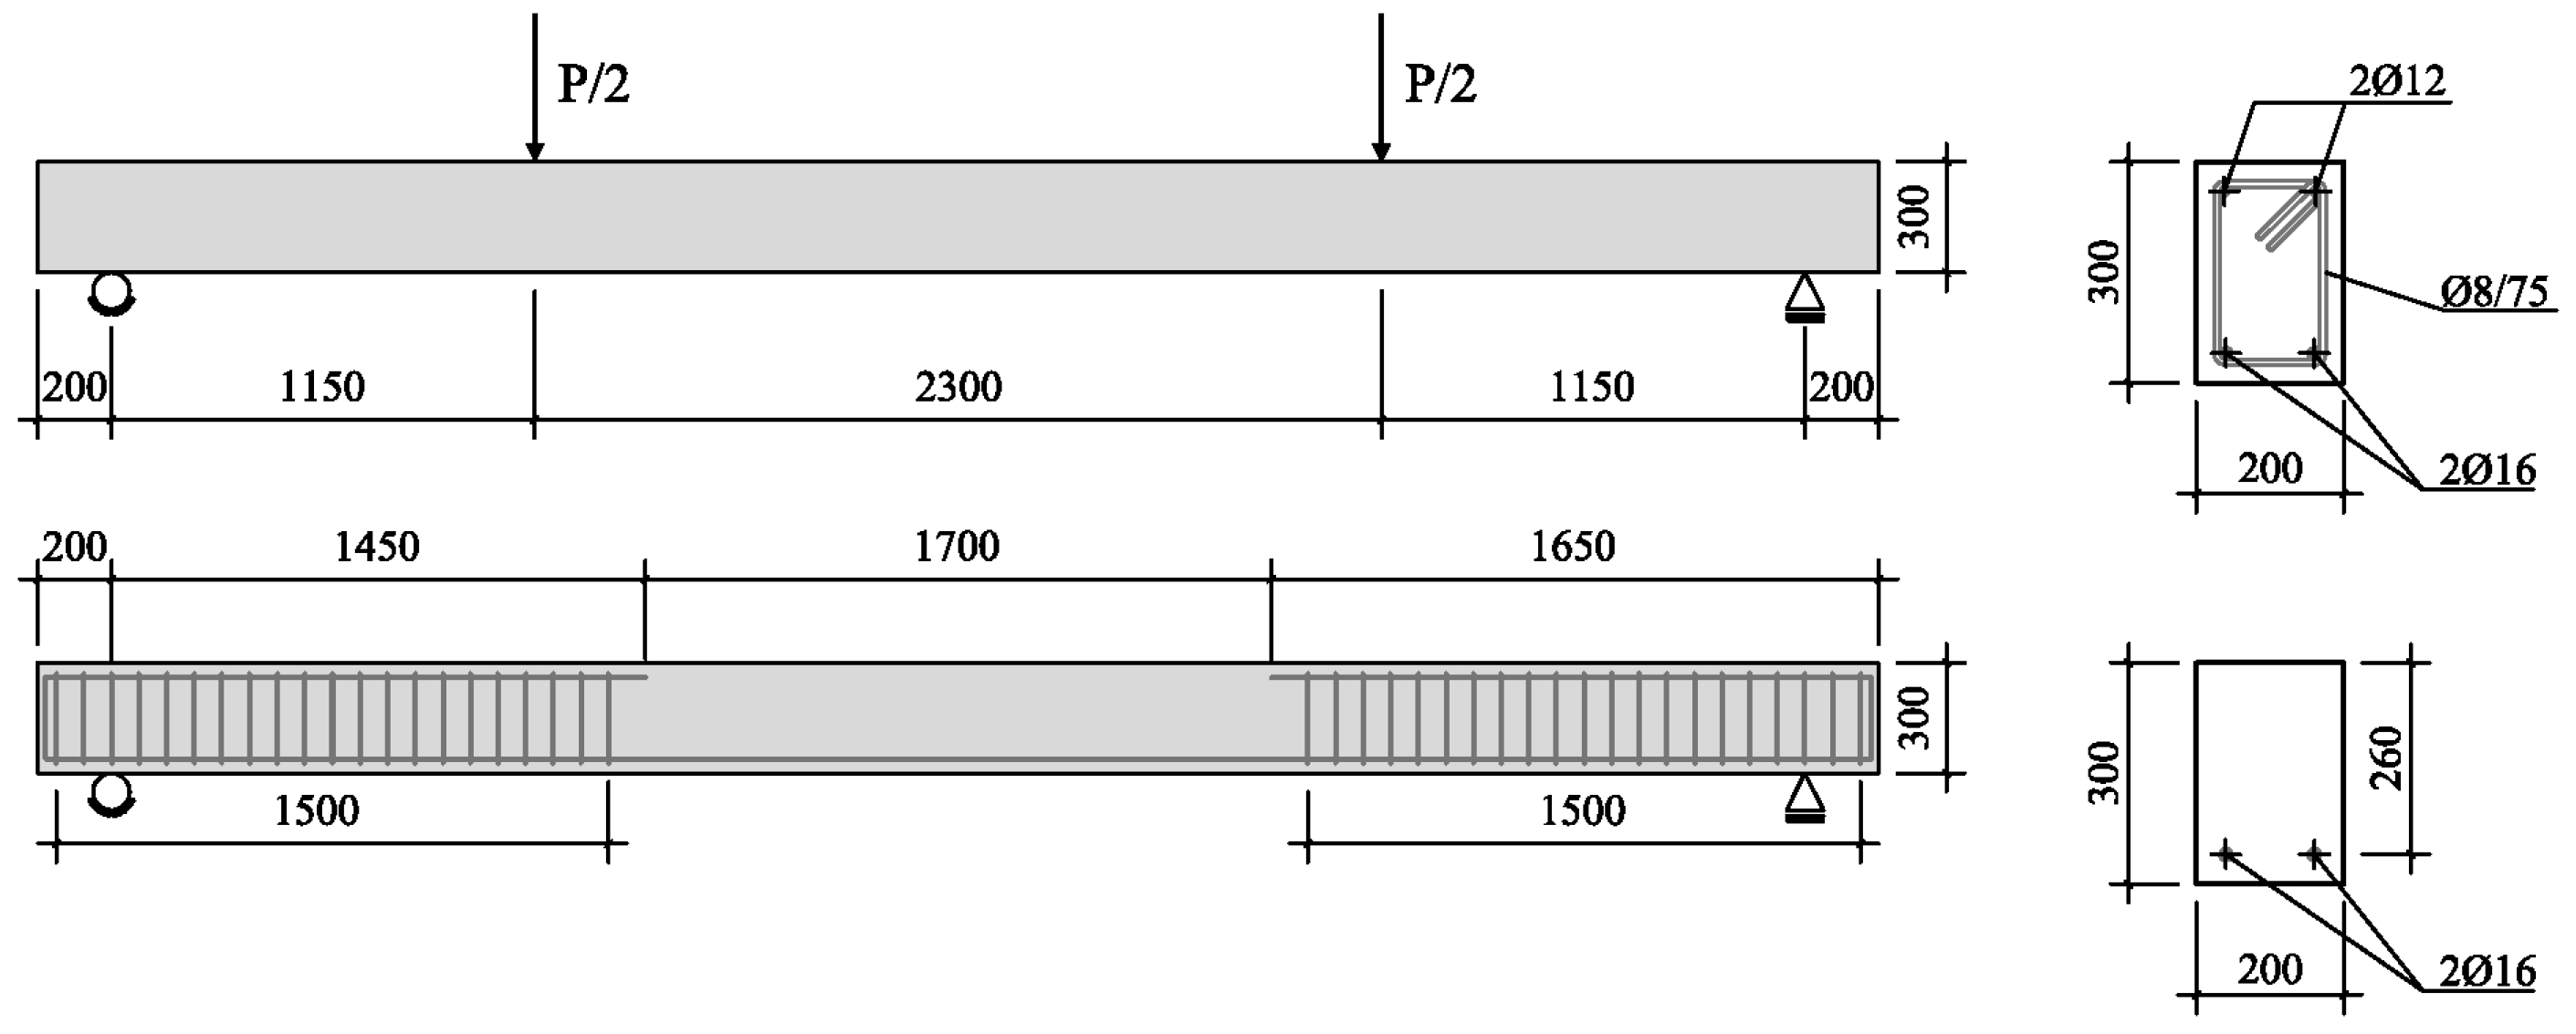
2.1. Specimens Geometry

Two full-scale beams (AAC1-HC and AAC2-HC) entirely made by AAC were produced and tested under a four point loading system; beams had an overall length of 5000 mm, a span length of 4600 mm and a cross section of 200 mm × 300 mm. Specimens were longitudinally reinforced with two Ф16 mm (As,long = 402 mm2) bars in tension; as for OPC design, flexural longitudinal reinforcement was designed by imposing a minimum steel percentage ρs (0.77%) that provides good ductility to the structural element and promotes rebar yielding. In the middle portion of the element (in the flexural span between the two point loads), no stirrups and reinforced bars in compression were provided in a way to have a flexural collapse, depending only on the concrete crushing. In the remaining portions of the beam, two Ф12 mm bars were provided in the compression zone to hold stirrups in position; closed stirrups (Ф8 mm@75 mm) were supplied to avoid brittle collapse due to shear. The resulting transversal steel ratio ρv is 0.67% and the clear concrete cover is 24 mm. Figure 1 summarizes the main characteristics of the structural element.
For each beam, companion specimens were casted for compression and Modulus of Rupture (MOR) material tests. Cylinder specimens (D = 100 mm, H = 200 mm) were tested in compression to derive Young’s modulus [27] and the complete stress-strain behavior; in addition, compressive strength was also calculated over time through cube specimens (L = 100 mm). As far as MOR is concerned, beam notched specimens (150 mm × 150 mm × 600 mm) were tested according to EN14651-5 [28].

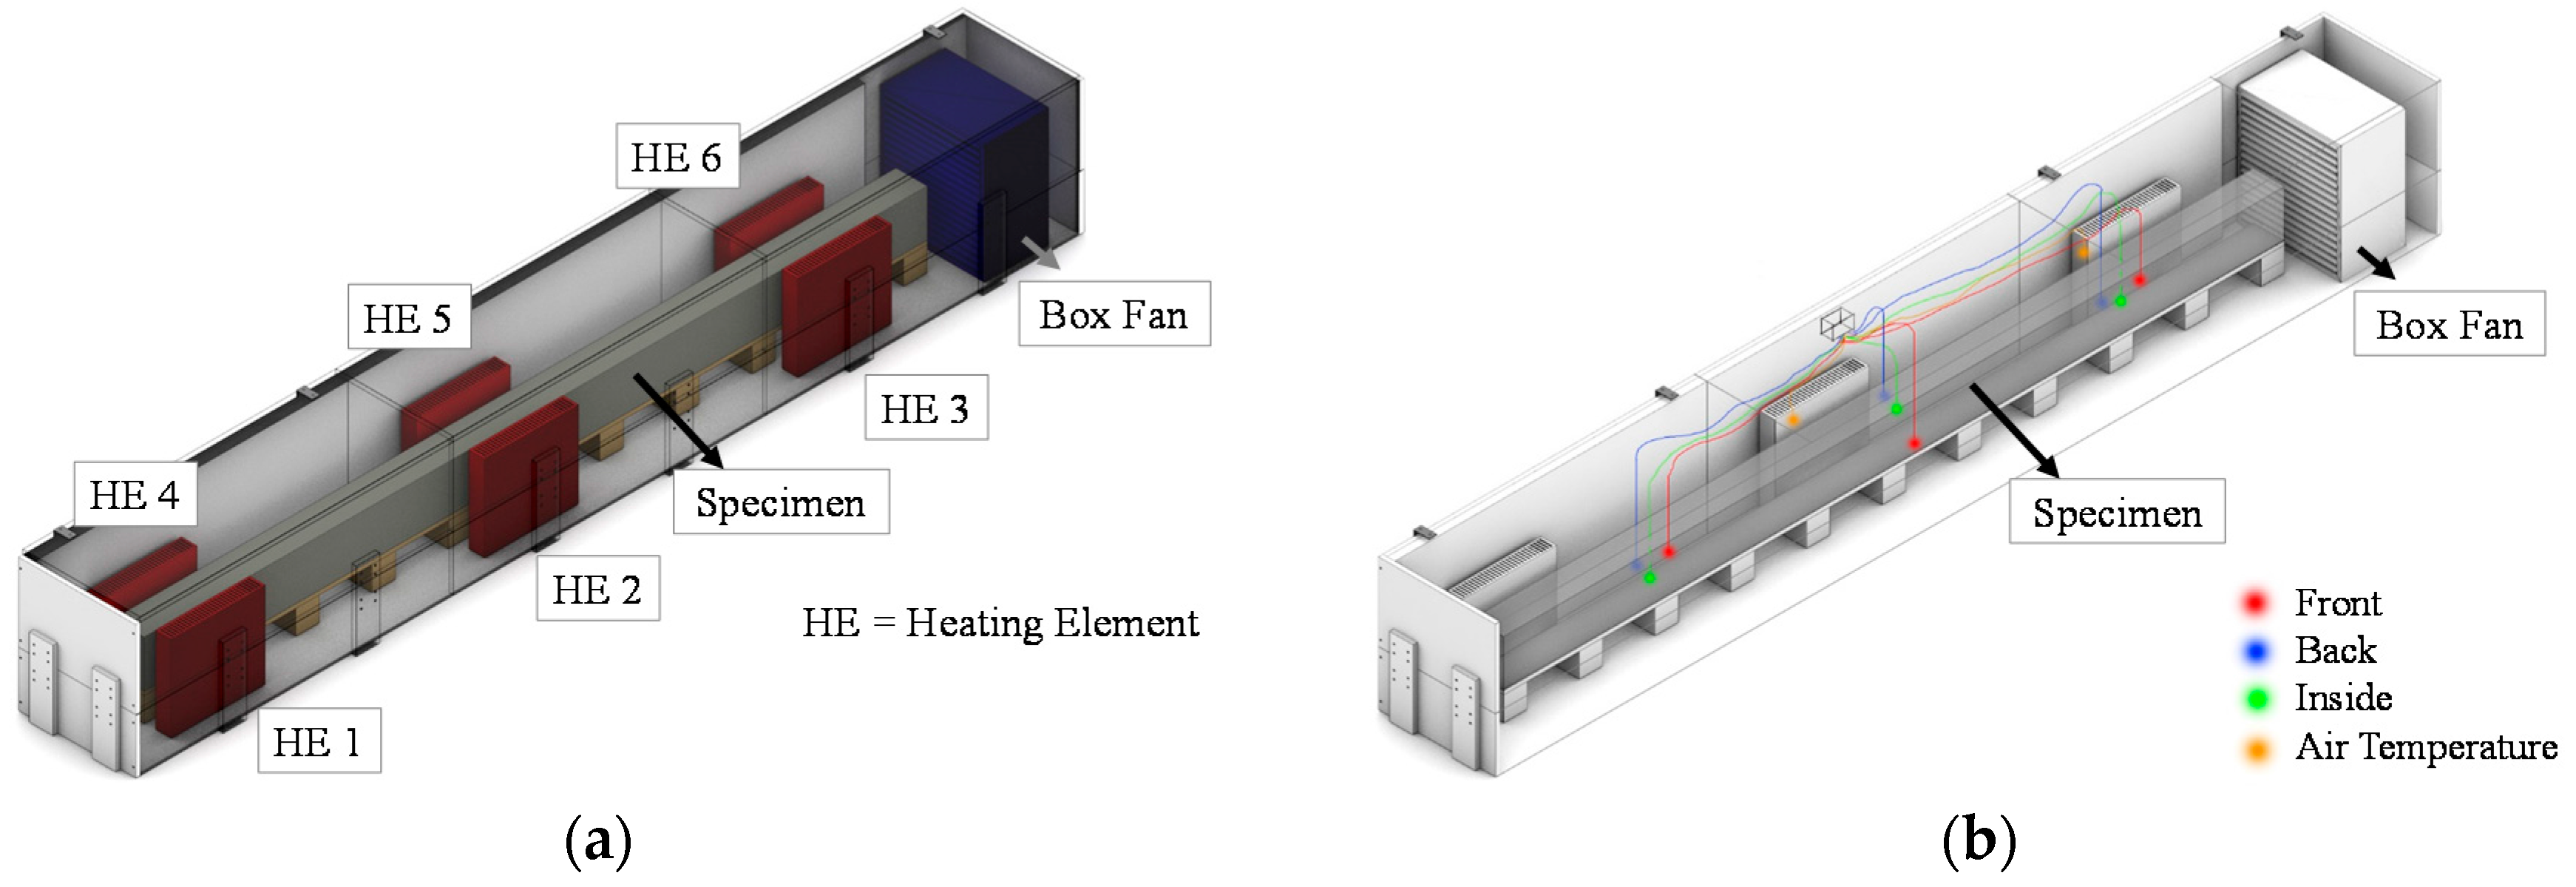
2.2. Material Properties and Curing Conditions

The AAC beams and companion specimens were fabricated at the Material Laboratory of the University of Brescia. A single mix design was used for both castings. Coarse aggregate 6–10 mm (1201 kg/m3), sand 0–4 mm (647 kg/m3) and class F fly ash (408 kg/m3) were mixed with 8 M sodium hydroxide (41 kg/m3), sodium silicate (103 kg/m3) and extra water (35 kg/m3); the resulting volumetric mass density (2435 kg/m3) is comparable to ordinary concrete. The mixture presents an alkaline solution/fly ash ratio of 0.35 and alkaline solution + extra water/fly ash ratio of 0.42. In order to fit structural applications, Davidovits [29] suggested a Si/Al ratio equal to 2: the resulting Si/Al ratio of the mixture is equal to 2.26 considering both contribution from fly ash and sodium silicate.
Class F fly ash was provided by a local supplier: the typical chemical composition is shown in Table 1. A low content (<5%) of CaO was required in a way to avoid fast setting and consequently to have better workability conditions; moreover, Loss of Inhibition (LOI) should be less than 5% not to inhibit the alkali reaction [30]. No superplasticizer was used in the final mixture since it was found from several pilot mixtures that no contribution in terms of workability was achieved with many commercial products for OPC.
Alkaline solution, composed of sodium hydroxide in solution (8 M) and sodium silicate (Weight Ratio WR = 1.99), was prepared a few hours before the pouring and left at room temperature until the use; coarse aggregates with a maximum size of 10 mm were used not to reduce workability. Aggregates humidity was calculated in a way to adjust extra water amount during casting. Due to the large quantity used in both castings, few kilograms of aggregates were utilized. The water content obtained from the drying process was considered representative for the overall humidity definition.
The material was produced through a planetary mixer: solid parts (fly ash + aggregates) were added first and, after 4 min of mixing, remaining liquid parts (alkaline solution + extra water for workability) were incorporated, and another 4–5 min of mixing followed.
This mix design currently used was the result of several previous pilot experiments carried out to obtain a normal strength AAC with a good workability. To define the optimal mix design, different curing parameters have been investigated, as summarized in Table 2. Parameter values have been chosen according to the greatest compressive strength they determined at 7 days.
AAC was poured into wood formworks; cylinder formworks were the only ones made of steel; their internal surface was covered by greaseproof paper in order to simplify removal. Because of the high consistency of the concrete, good compaction was achieved using a rod and a vibrating needle. Workability was evaluated after cast, using an Abram’s cone; concrete was in class S1 for AAC1-HC batch (slump: 40 mm) and class S2 for AAC2-HC (slump: 70 mm).
After a rest period of 48 h, beams and companion specimens were covered with two layers of plastic and a saturated cotton sheet in the middle of them; covering layers had the aim of retaining moisture during the curing. Curing at an elevated temperature followed: specimens were placed in a hand-made climatic chamber (Figure 2) for 24 h at 60 °C. The source of heat consisted of three radiators placed on each side of the beam length; a fan was also provided with the aim of uniformly heating the chamber, whereas temperature was monitored through sensors placed both inside and outside the volume of the beams.
Regarding reinforcement, typical Italian B450C steel was used for the entire steel reinforcement cage; Ф16 mm rebar had measured yield (fy) and ultimate (fu) strengths of 546 and 649 MPa, respectively; properties were evaluated according to EN-15630-1 [31], testing two 600 mm long coupons.

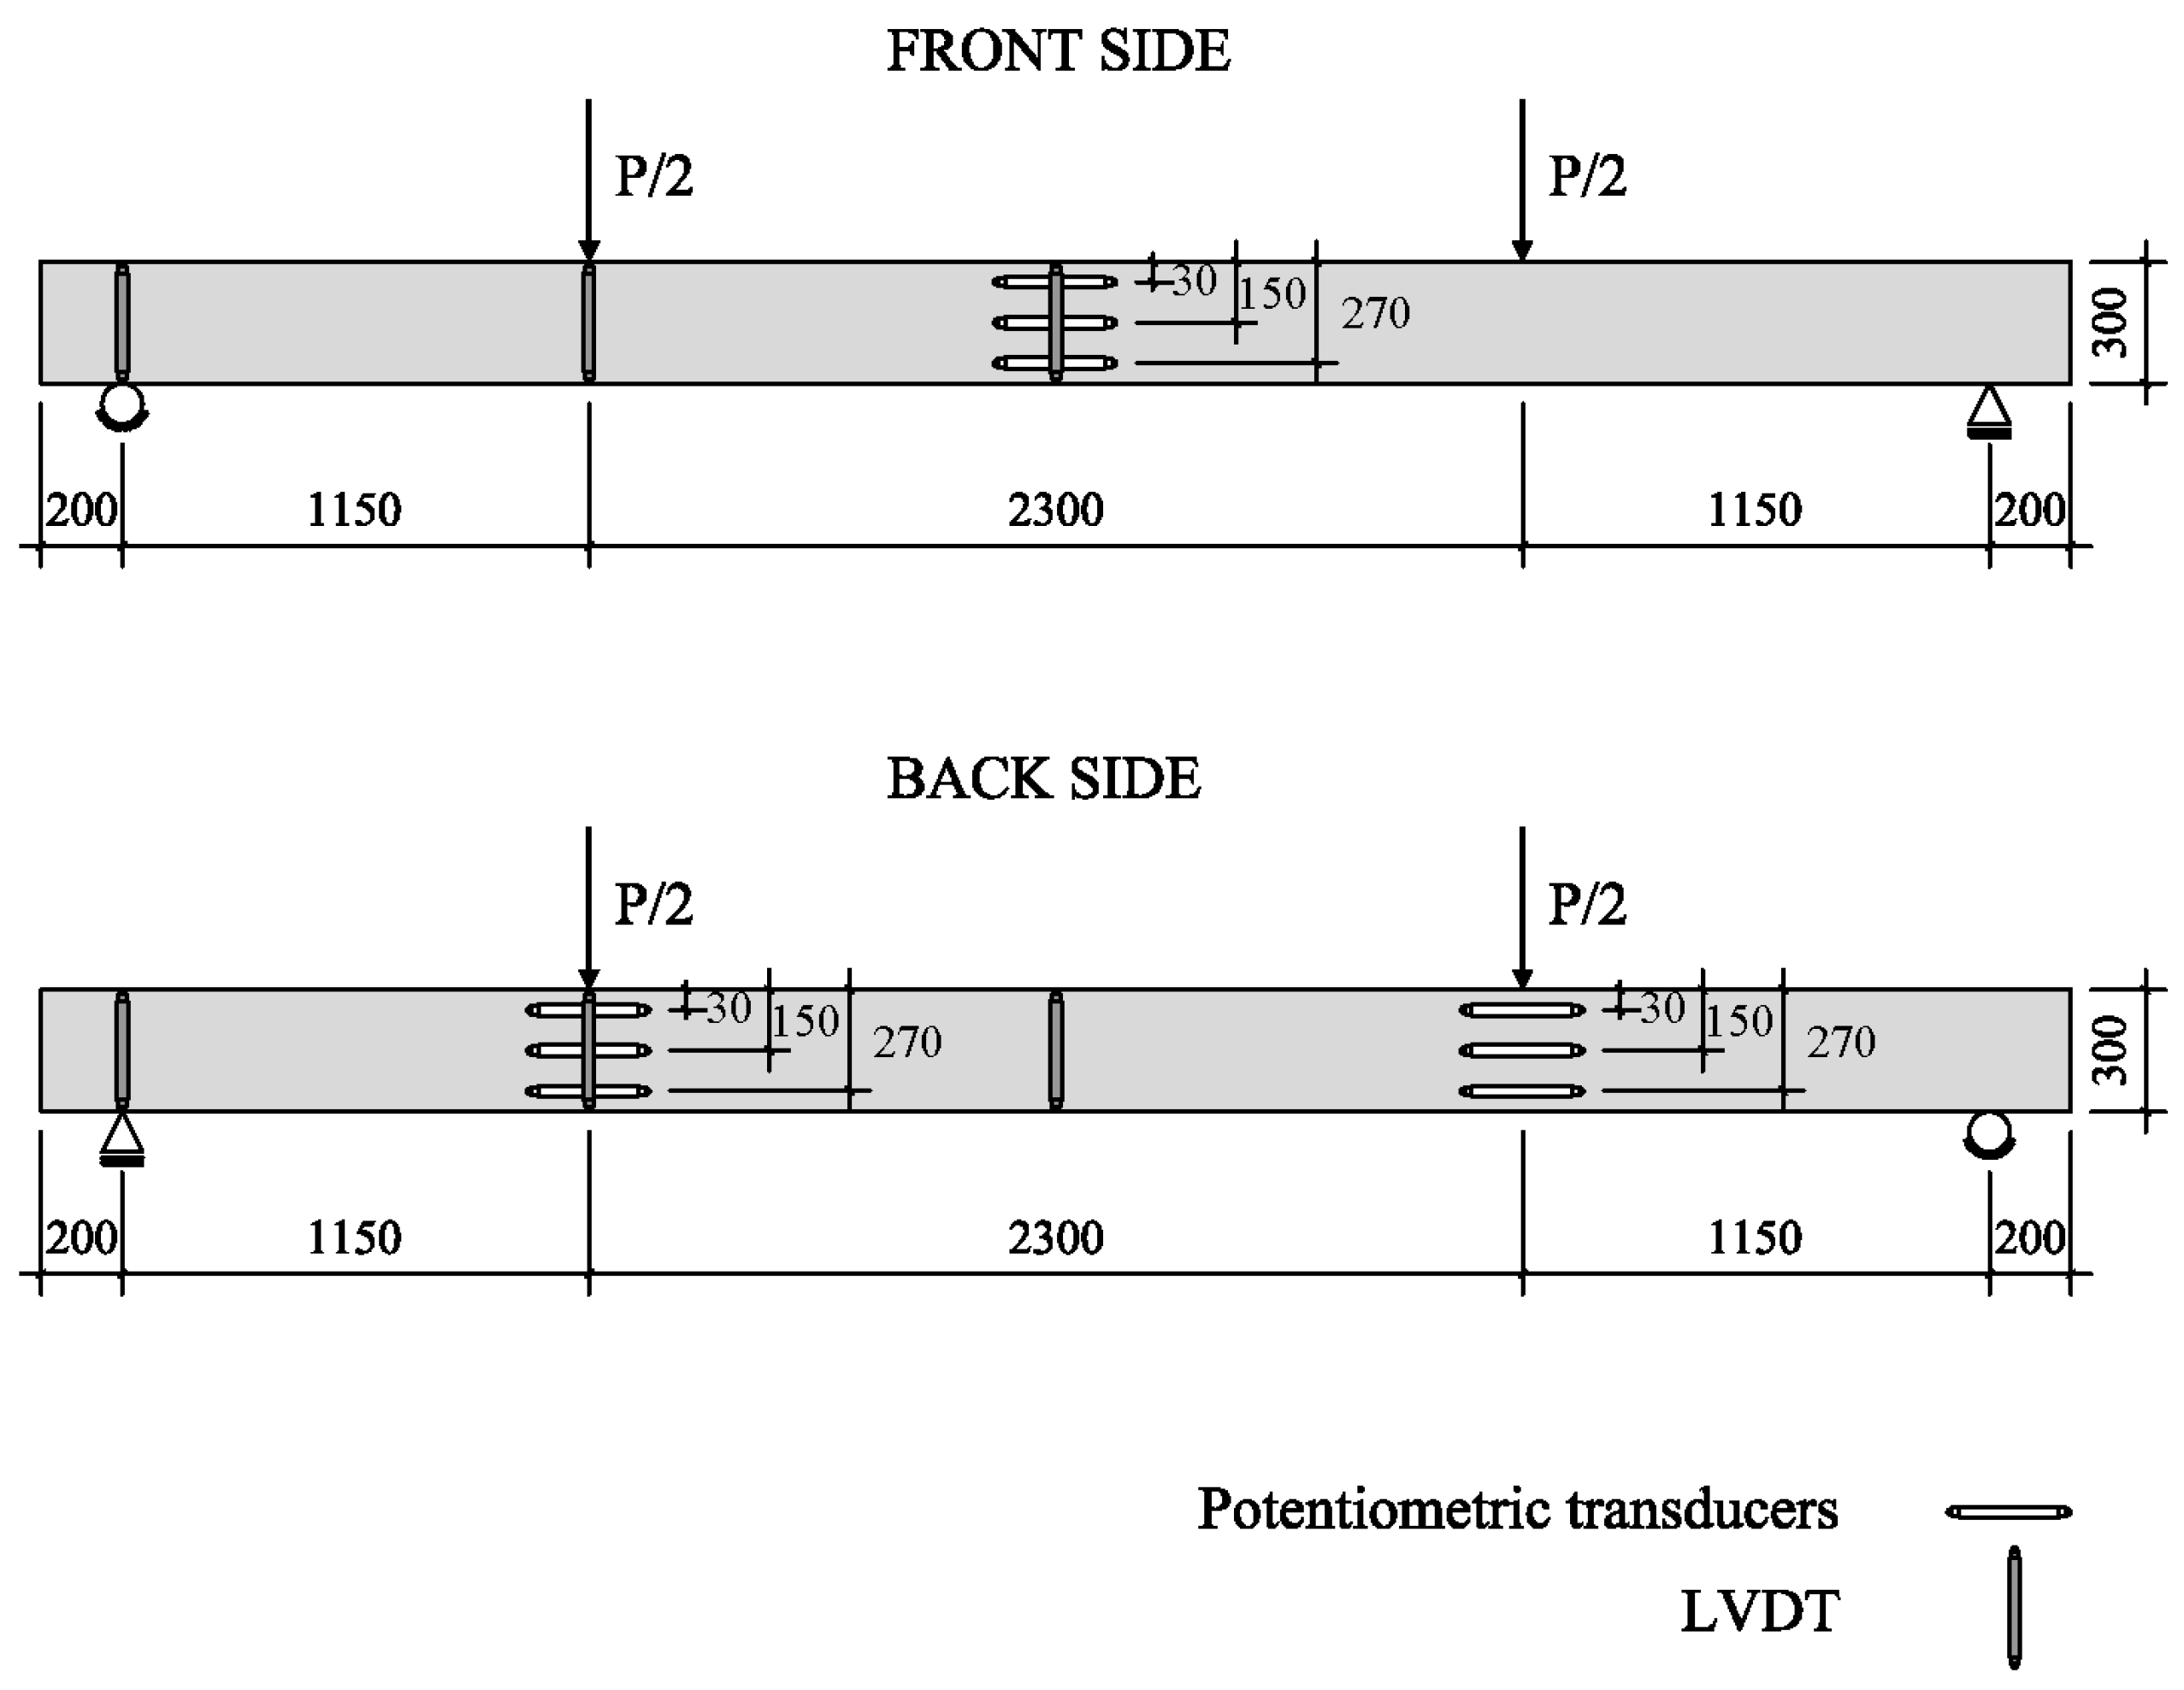
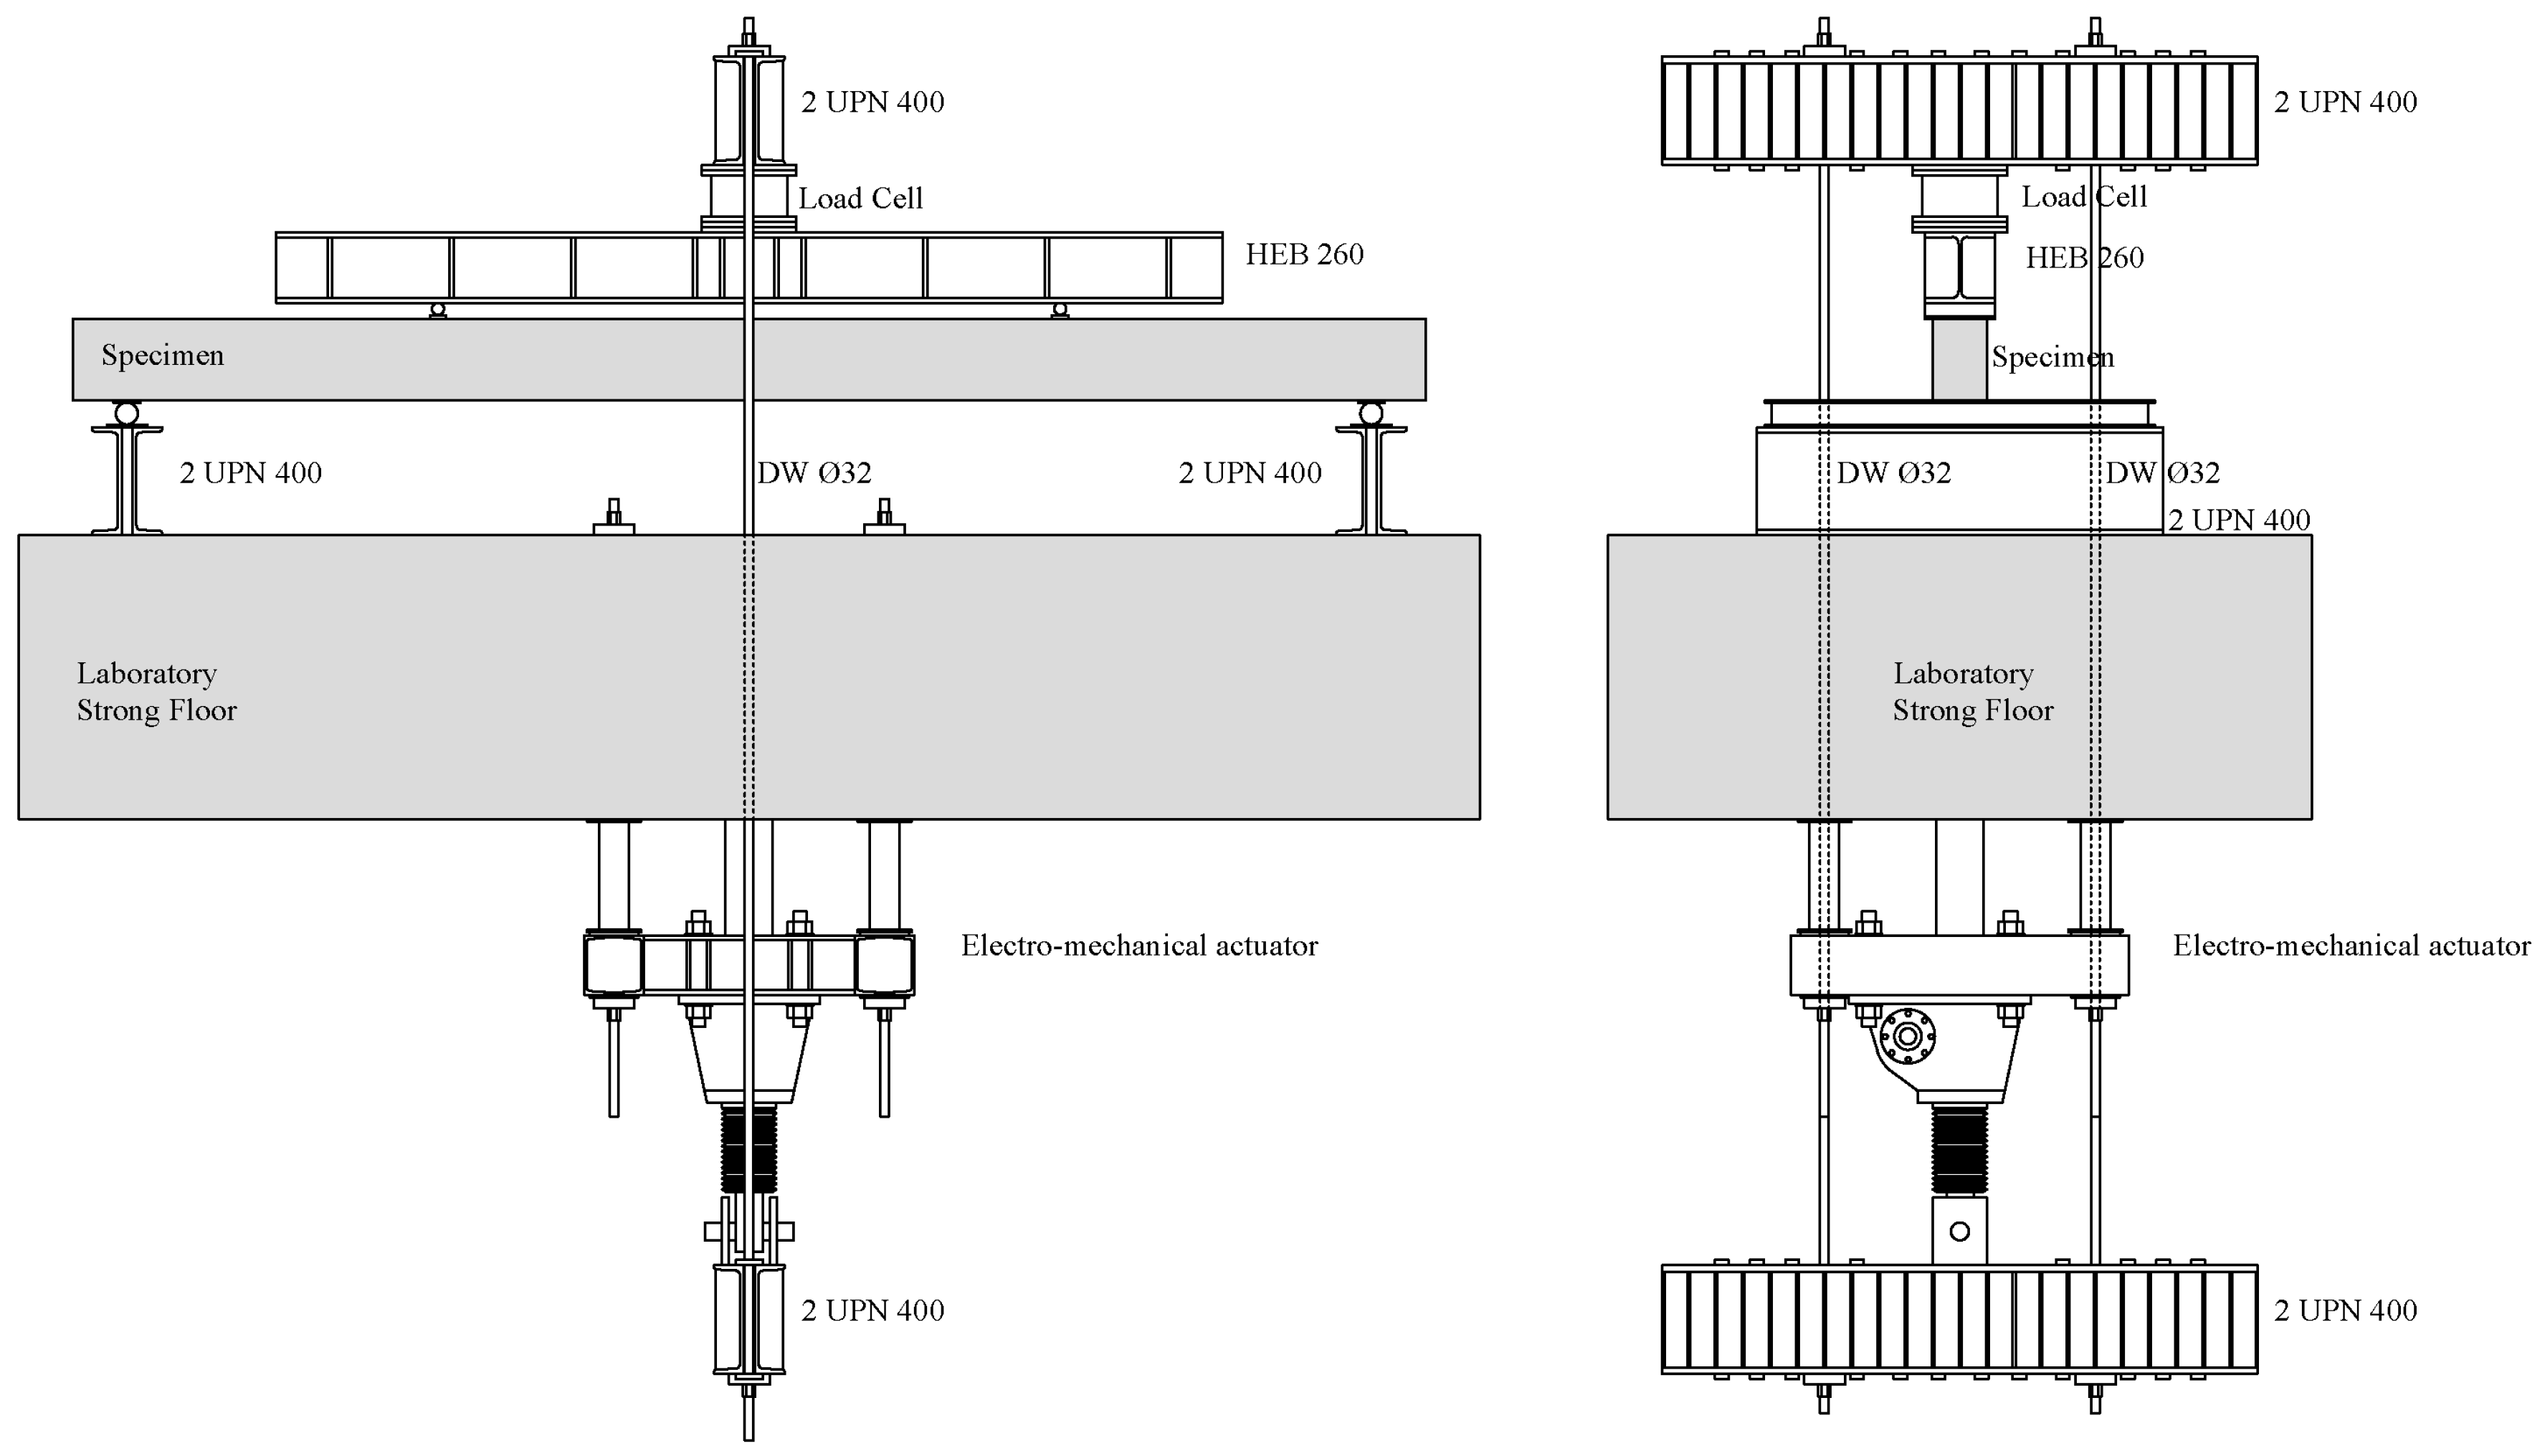
2.3. Test Setup and Investigation

Beam AAC1-HC and Beam AAC2-HC were tested under flexure, respectively, at 31 and 8 days after casting. A displacement controlled test was guaranteed allowing for a suitable and stable control during critical steps, such as in the case of abrupt cracking phenomena or load drops. The applied load was measured by a single load cell. In the setup used for testing under a four point loading system (Figure 3), both the two point loads and the two supports were modeled though steel profiles; they were continuous on the entire specimen width. In order to avoid load concentration and possible local failure, a suitable steel plate on a mortar bed was disposed at each loading point.
Linear Variable Differential Transformers (LVDTs) were utilized for measuring deflections at mid-span (front and back side), under the load points and at supports. Potentiometric transducers were adopted for measuring the flexural strains, hence the curvature; three were located at front mid-span, whereas the other two groups (of three each) were positioned in the back side under the two concentrated loads (Figure 4). After preliminary elastic cycles, all tests were conducted by loading the beams under monotonically increasing screw displacement up to failure. The screw rate was set at 1 mm/min in the initial stage, reduced to 0.75 mm/min from 80 kN. Load applied during elastic cycles was lower than the first cracking load; elastic cycles were meant for the instrumentation final control and calibration. The test was stopped at different load values in order to track the development of crack pattern.
Beams and cylinders were tested at 28 days in flexure and in compression respectively; flexural tensile stress vs. Crack Mouth Opening Displacement (CMOD) curves were obtained according to EN 14651-5 [28], which requires that three point bending tests on notched specimens be performed under strain control. Even though this test is meant firstly for characterizing fiber reinforced concrete (FRC) materials, it was considered useful for investigating the post-peak regime of AAC materials.
Cylinders were tested to investigate both elastic modulus [27] and stress–strain relationship. In order to obtain constitutive law, the same instrumentation setup of elastic modulus was used. Three LVDTs were used to measure the axial deformation of the concrete cylinders. This test was run in stroke control using a universal closed-loop Instron machine. Cubic compressive strength was measured 7, 14 and 28 days after casting.

3. Results and Discussion

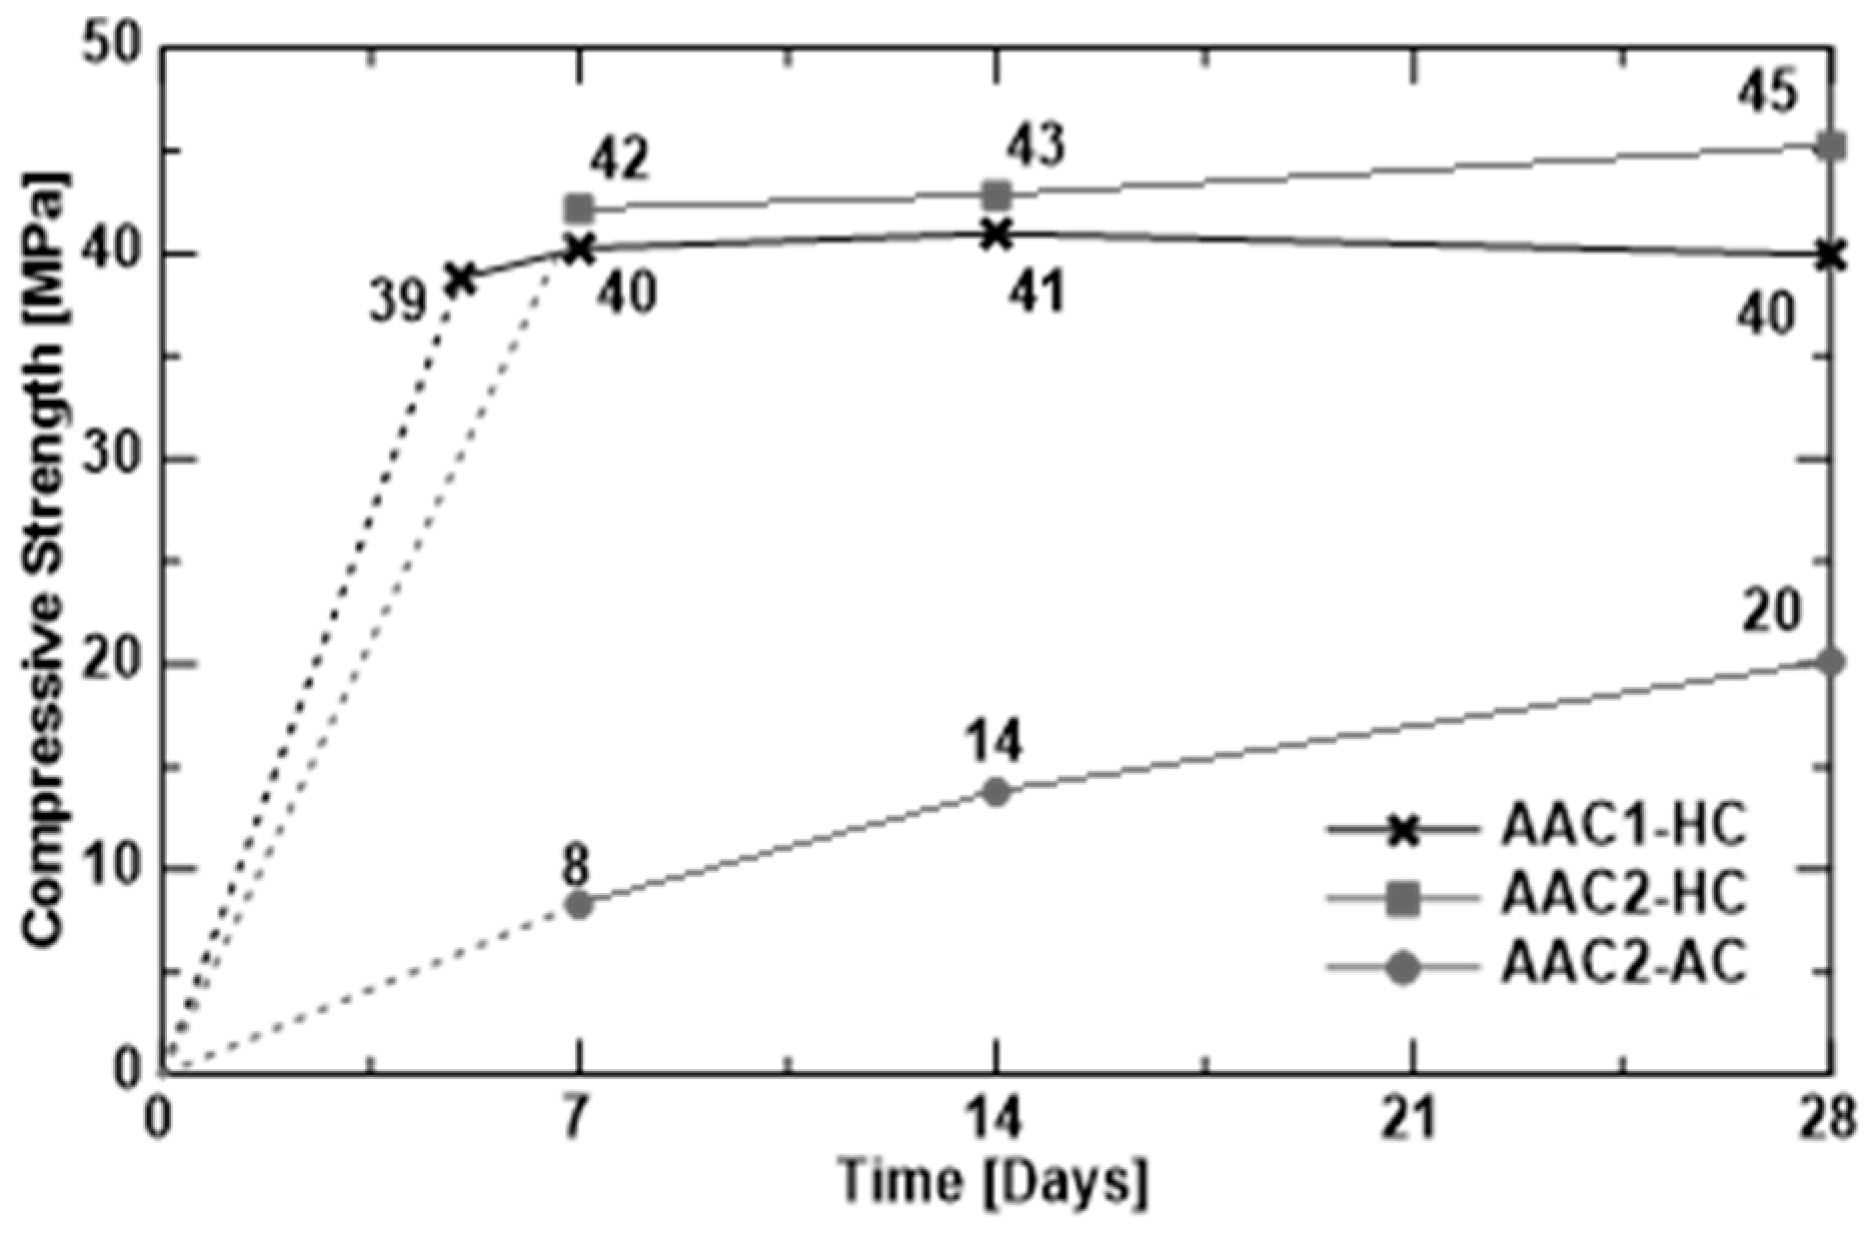
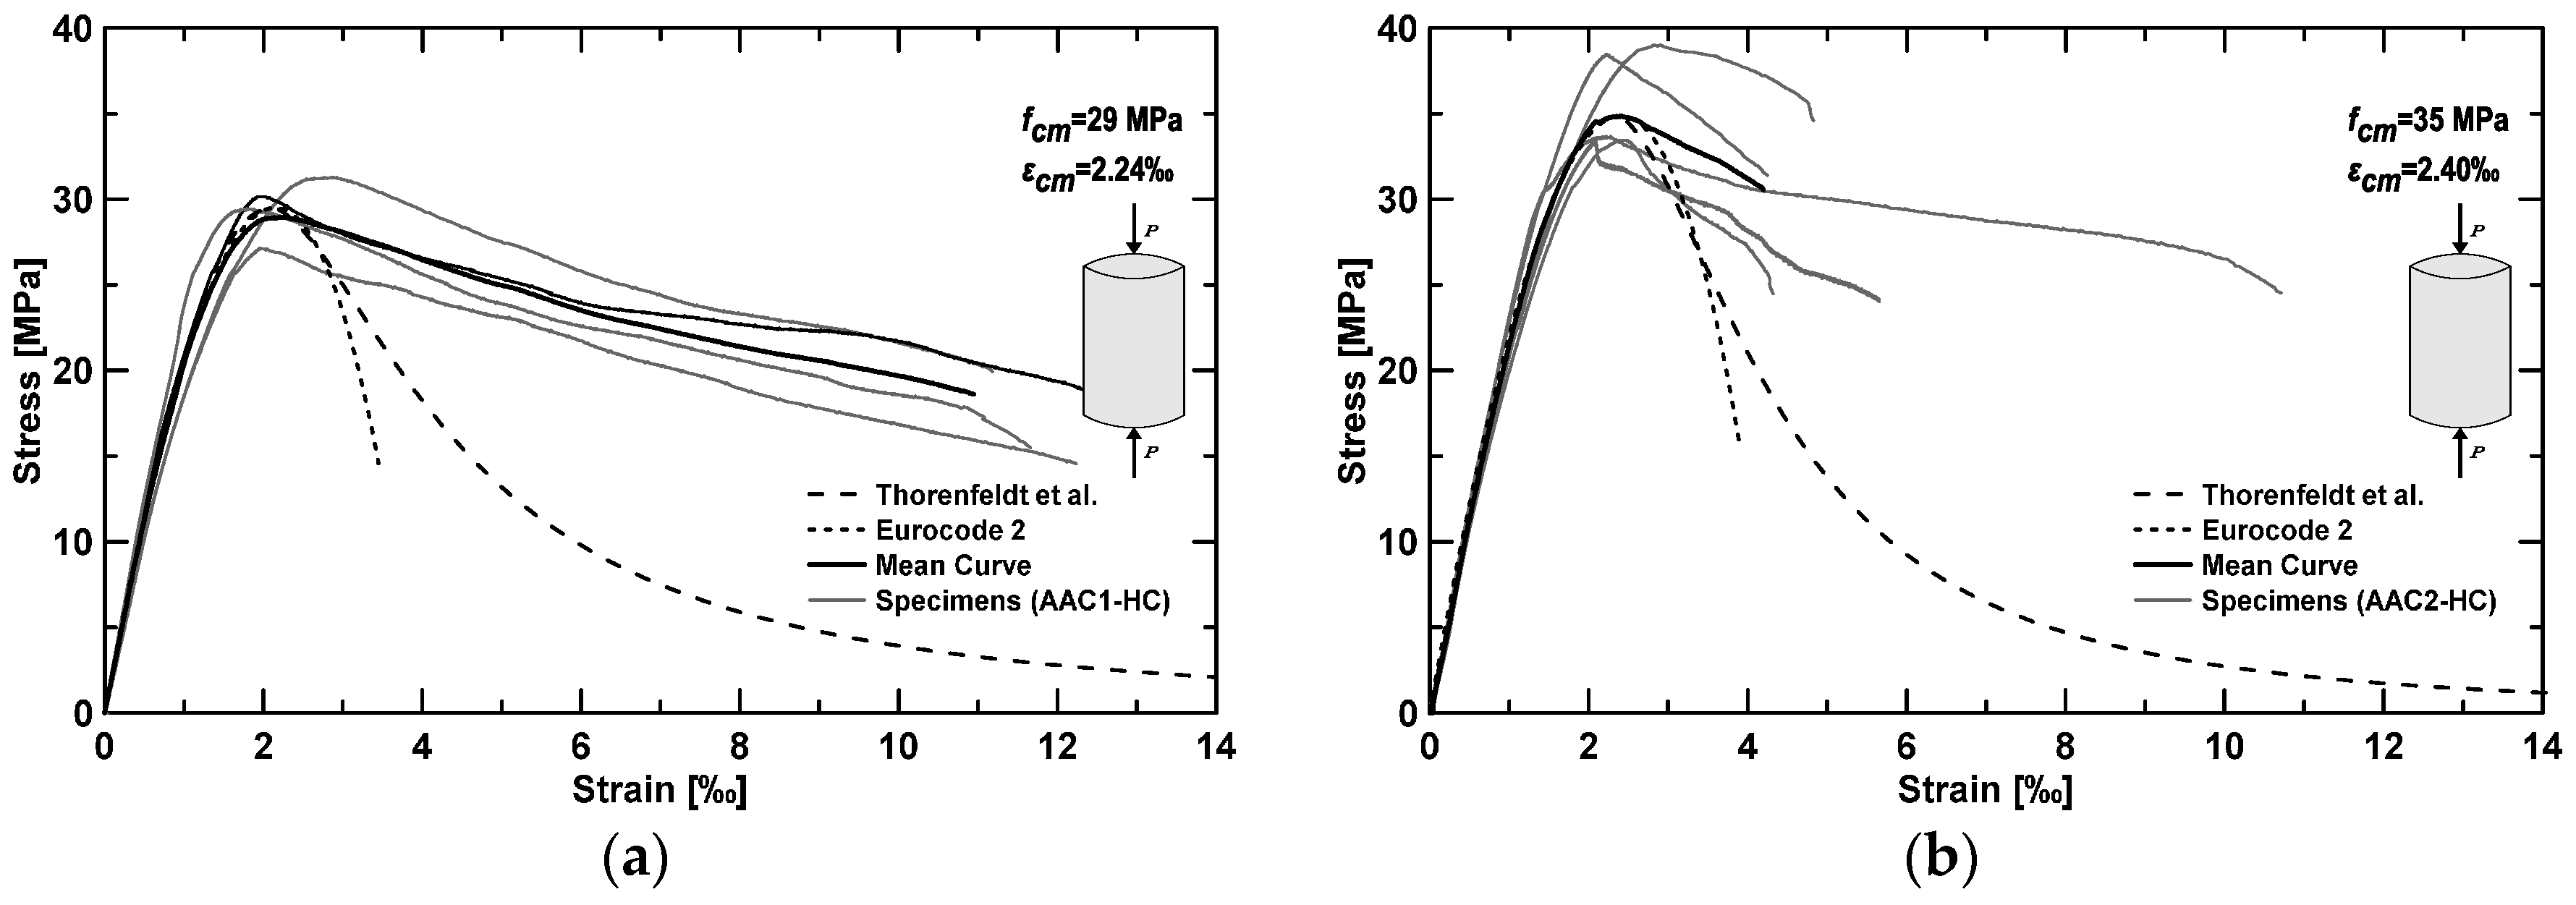
3.1. Modulus of Elasticity and Compression Tests

Figure 5 shows the development of the cubic compressive strength over time; because of the heat curing (HC), compressive strength did not have an increase in time but it maintained almost constant. The mean cubic compressive strength measured on 28th day was 40 MPa (COV 3.67% on three specimens) for AAC1-HC and 45 MPa (COV 5.46% on three specimens) for AAC2-HC.
Some cubes from AAC2 casting were cured at ambient condition (AC). Unlike the previous case, they did not show a constant value of compressive strength: they act like OPC concrete, showing a gradual increase over time; however, compressive strength after 28 days was almost half of that obtained from heat curing (HC) conditions. As reported in the literature [32], the compressive strength of ambient-cured specimens increases with age, depending on the average ambient temperature: the higher the ambient average temperature, the higher the strength.
The corresponding cylinder compressive strength was analytically determined, according to OPC concrete, using the following relation [33]:
f c m = 0.83   R c m
where Rcm represents the average cubic compressive strength on 28th day; results show a cylinder compressive strength equal to 33.2 and 37.3 MPa, respectively, for AAC1-HC and AAC2-HC specimens. Compression tests on cylinders (Figure 6) provided slightly lower cylinder compressive strength (29 and 35 MPa, COV 5.21% and 7.26% on four and five specimens, respectively, for AAC1-HC and AAC2-HC) with a mean value of 32 MPa. The scatter between experimental and analytical values from Equation (1) ranges between 6% and 12%.
Young’s modulus, determined from cylinder specimens according to [27], was equal to 24 GPa for AAC1-HC (COV 8.32% on five specimens) and 25.2 GPa (COV 5.19% on six specimens) for AAC2-HC, resulting in a mean value of 24.6 GPa.
For OPC concrete, Eurocode 2 (EC2) [34] recommends the following relation:
E c m = 22000 ( f c m 10 ) 0.3 ( M P a ) ,
where fcm represents the mean cylindrical strength on 28th day.
Using the above equation for the range of fcm experimentally obtained (29 and 35 MPa), an analytical value of Ecm comprised between 30.2 and 32 GPa would be determined. Therefore, the experimental Young’s modulus is in both cases about 80% of that predicted by EC2 [34] for OPC concretes, which might be due to the lower value of the maximum aggregate size (10 mm) herein utilized.
The experimental stress–strain relationships in compression are illustrated, for both materials, in Figure 6. Experimental results have been compared with the following two analytical formulas for OPC concretes: Thorenfeldt et al. [35] and the current EC2 [34]. The first relationship is as follows:
σ c = f c m ε c ε c m n n 1 + ( ε c ε c m ) n k
where
  • fcm = peak stress;
  • εcm = strain corresponding at peak stress;
  • n = 0.8 + (fcm/17);
  • k = 0.67 + (fcm/62), if εccm > 1; and
  • k = 1, if εccm ≤ 1;
while the EC2 [35] formulation is:
σ c = f c m k η η 2 1 + ( k 2 ) η
where
  • fcm = peak stress;
  • η = εccm;
  • εcm = strain corresponding at peak stress; and
  • k = 1.05 Ecmcm|/fcm.
Values included in the previous analytical formulas refer to experimental results. Analytical formulas fit well with the experiments only in the pre-peak phase, whereas, in the post-peak phase, AAC shows a much more ductile behavior. This is in clear contrast with a previously published study [13], which showed a similar trend (slightly more brittle) compared to OPC.

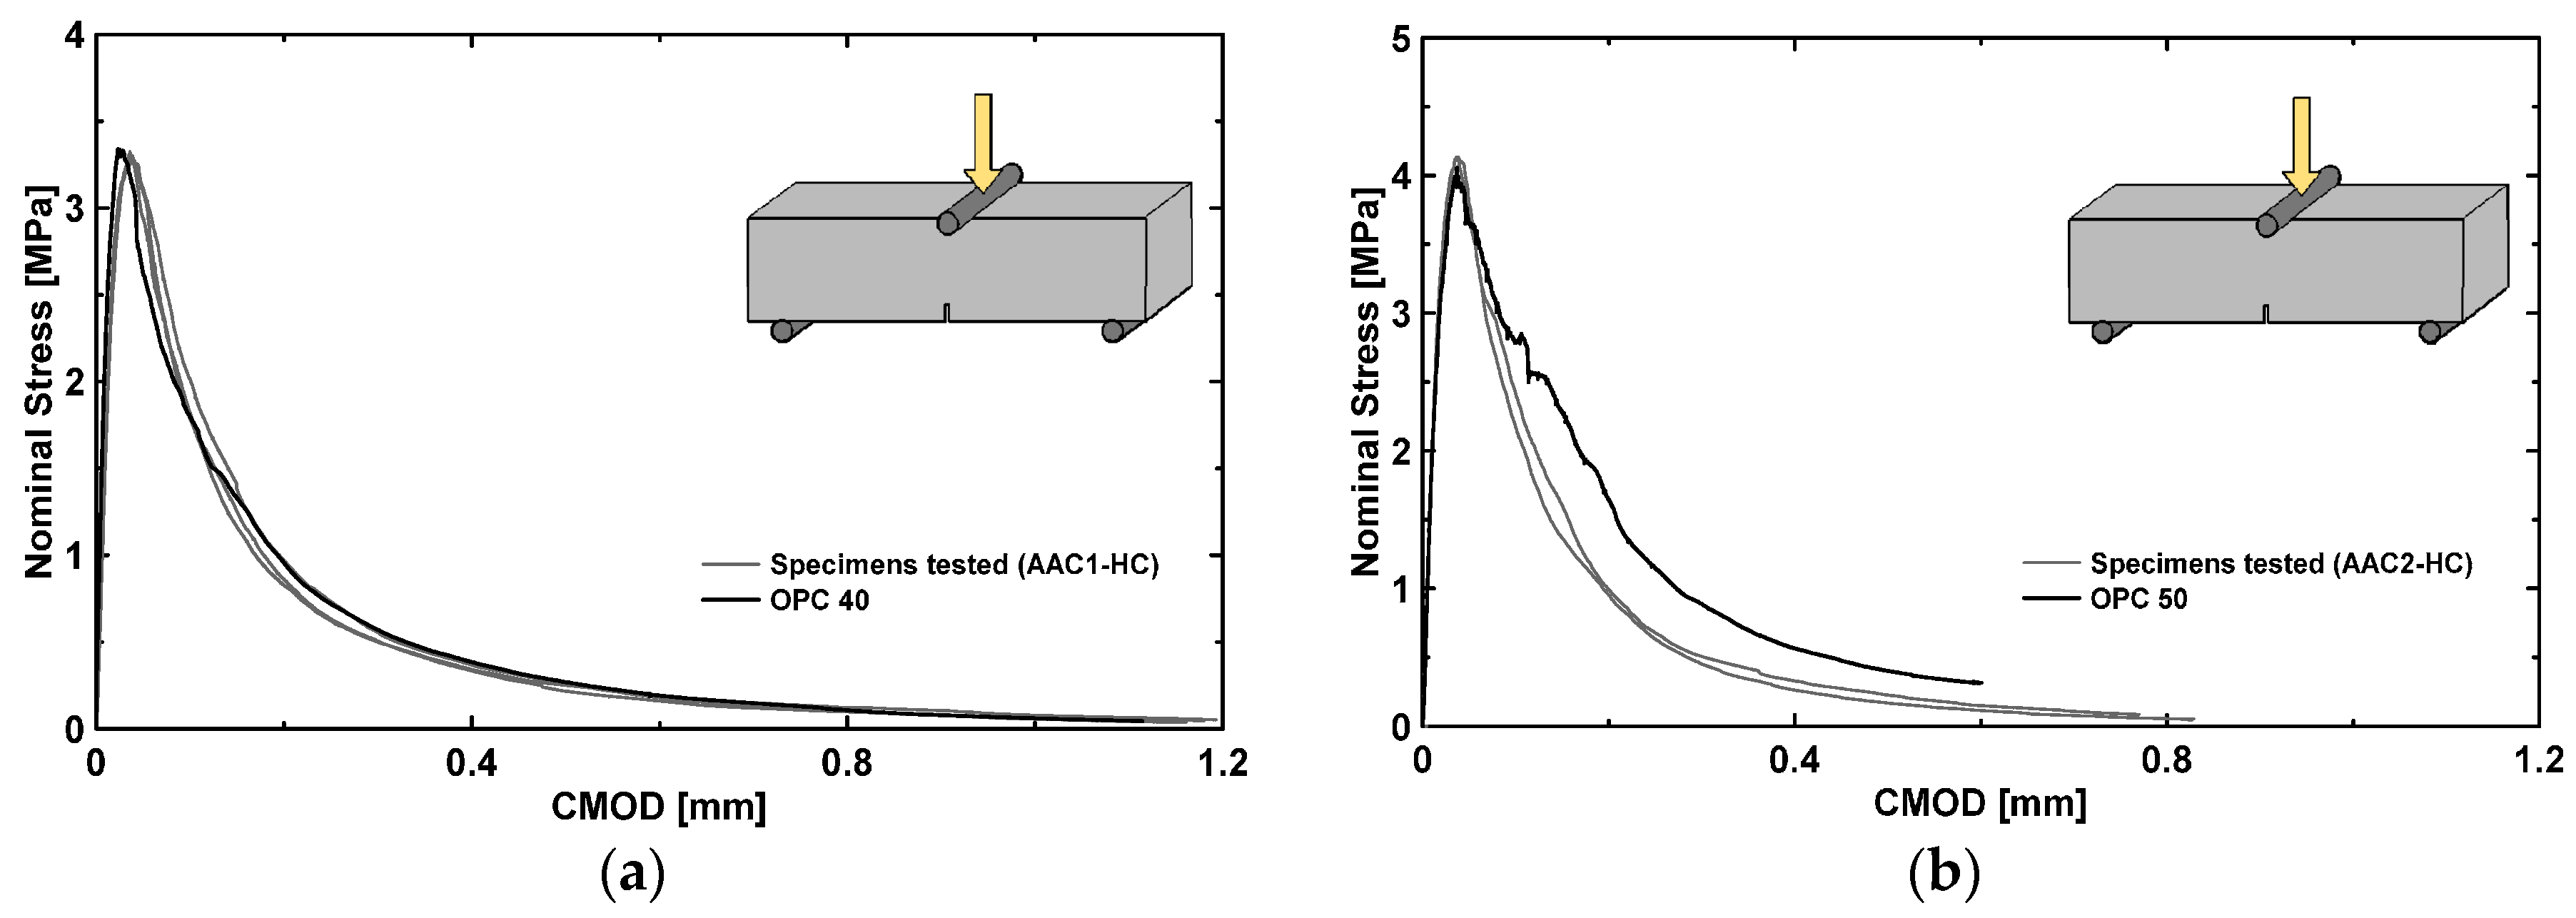
3.2. Material Flexural Behavior (MOR Tests)

Flexural tensile stress–CMOD relationship for both materials is shown in Figure 7; two or more AAC samples for each casting have been tested. In this picture, a classical OPC concrete beam response (having similar peak strength) is also provided for comparison: no significant differences in the behavior of the two tested materials were observed. Unlike the behavior in compression, AAC materials and OPC concretes are both extremely brittle in tension, showing a fast decrease in strength, with residual stresses lower than 0.3 MPa for CMOD values greater than 0.6 mm.

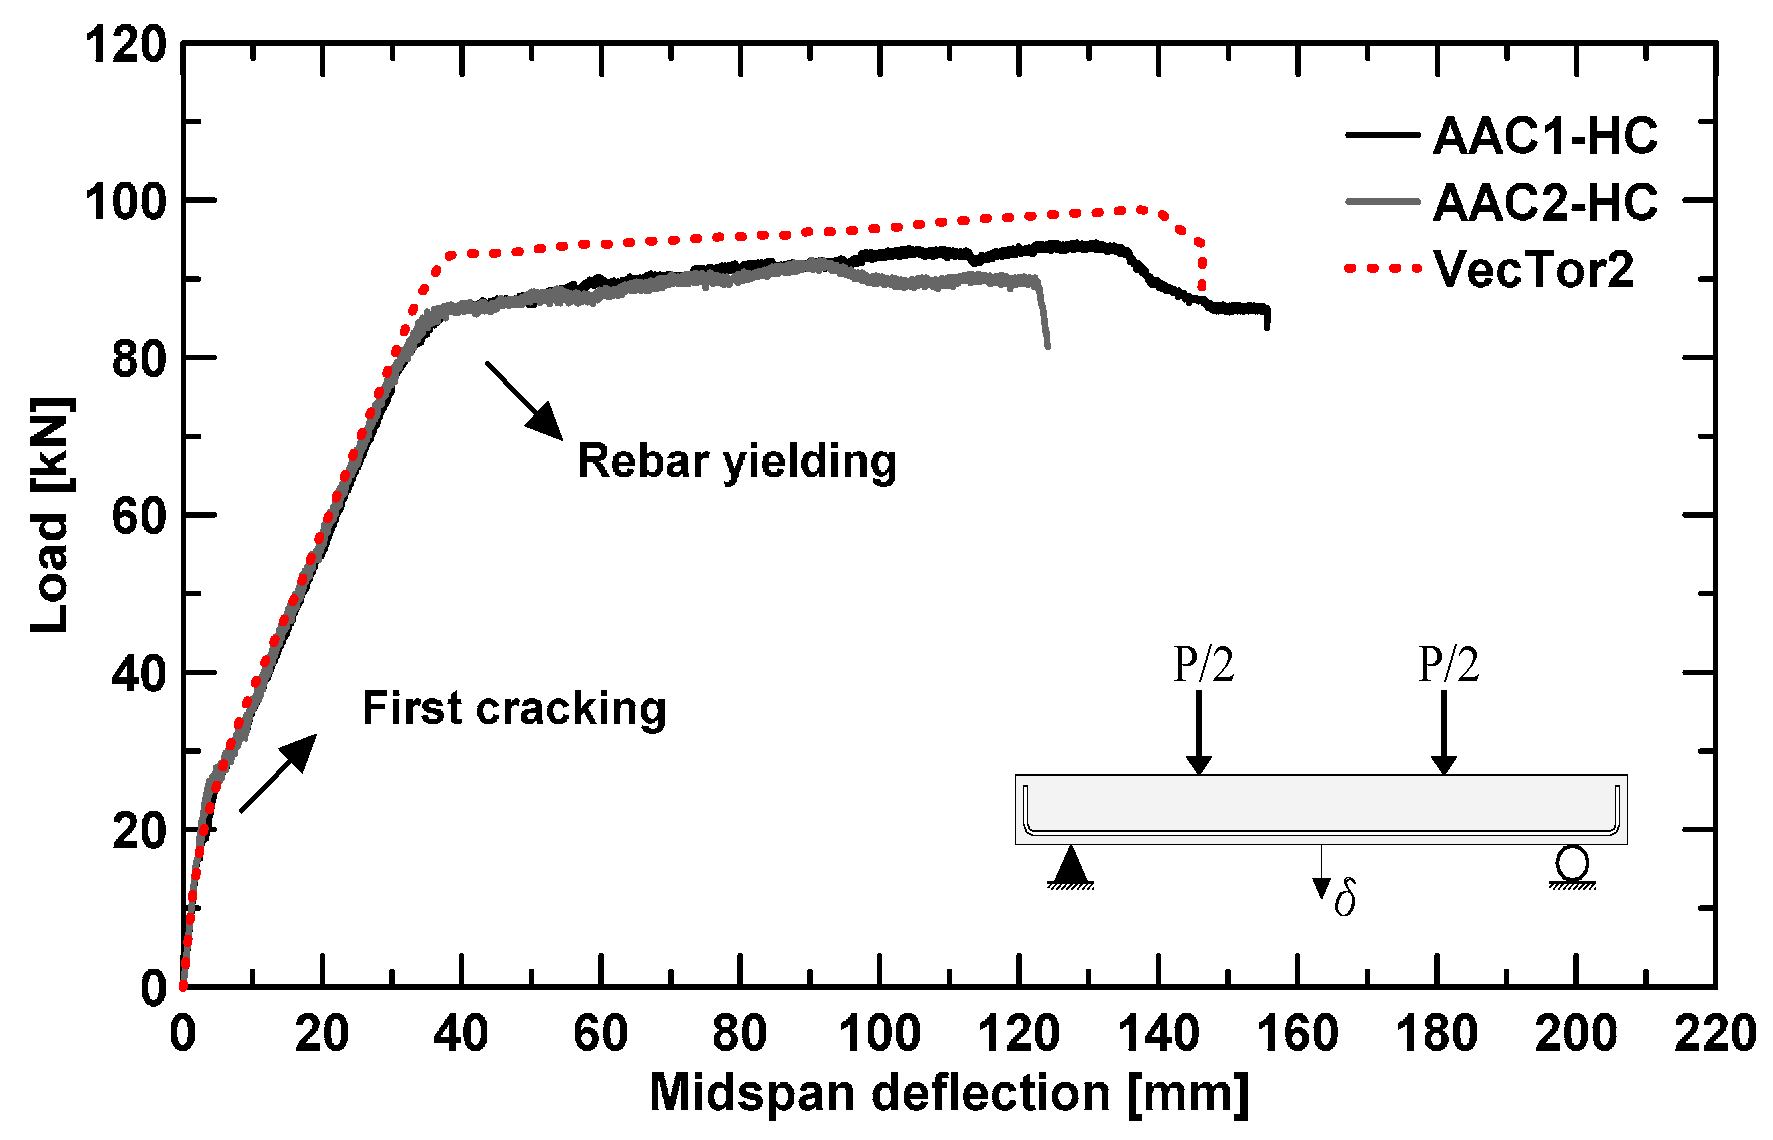
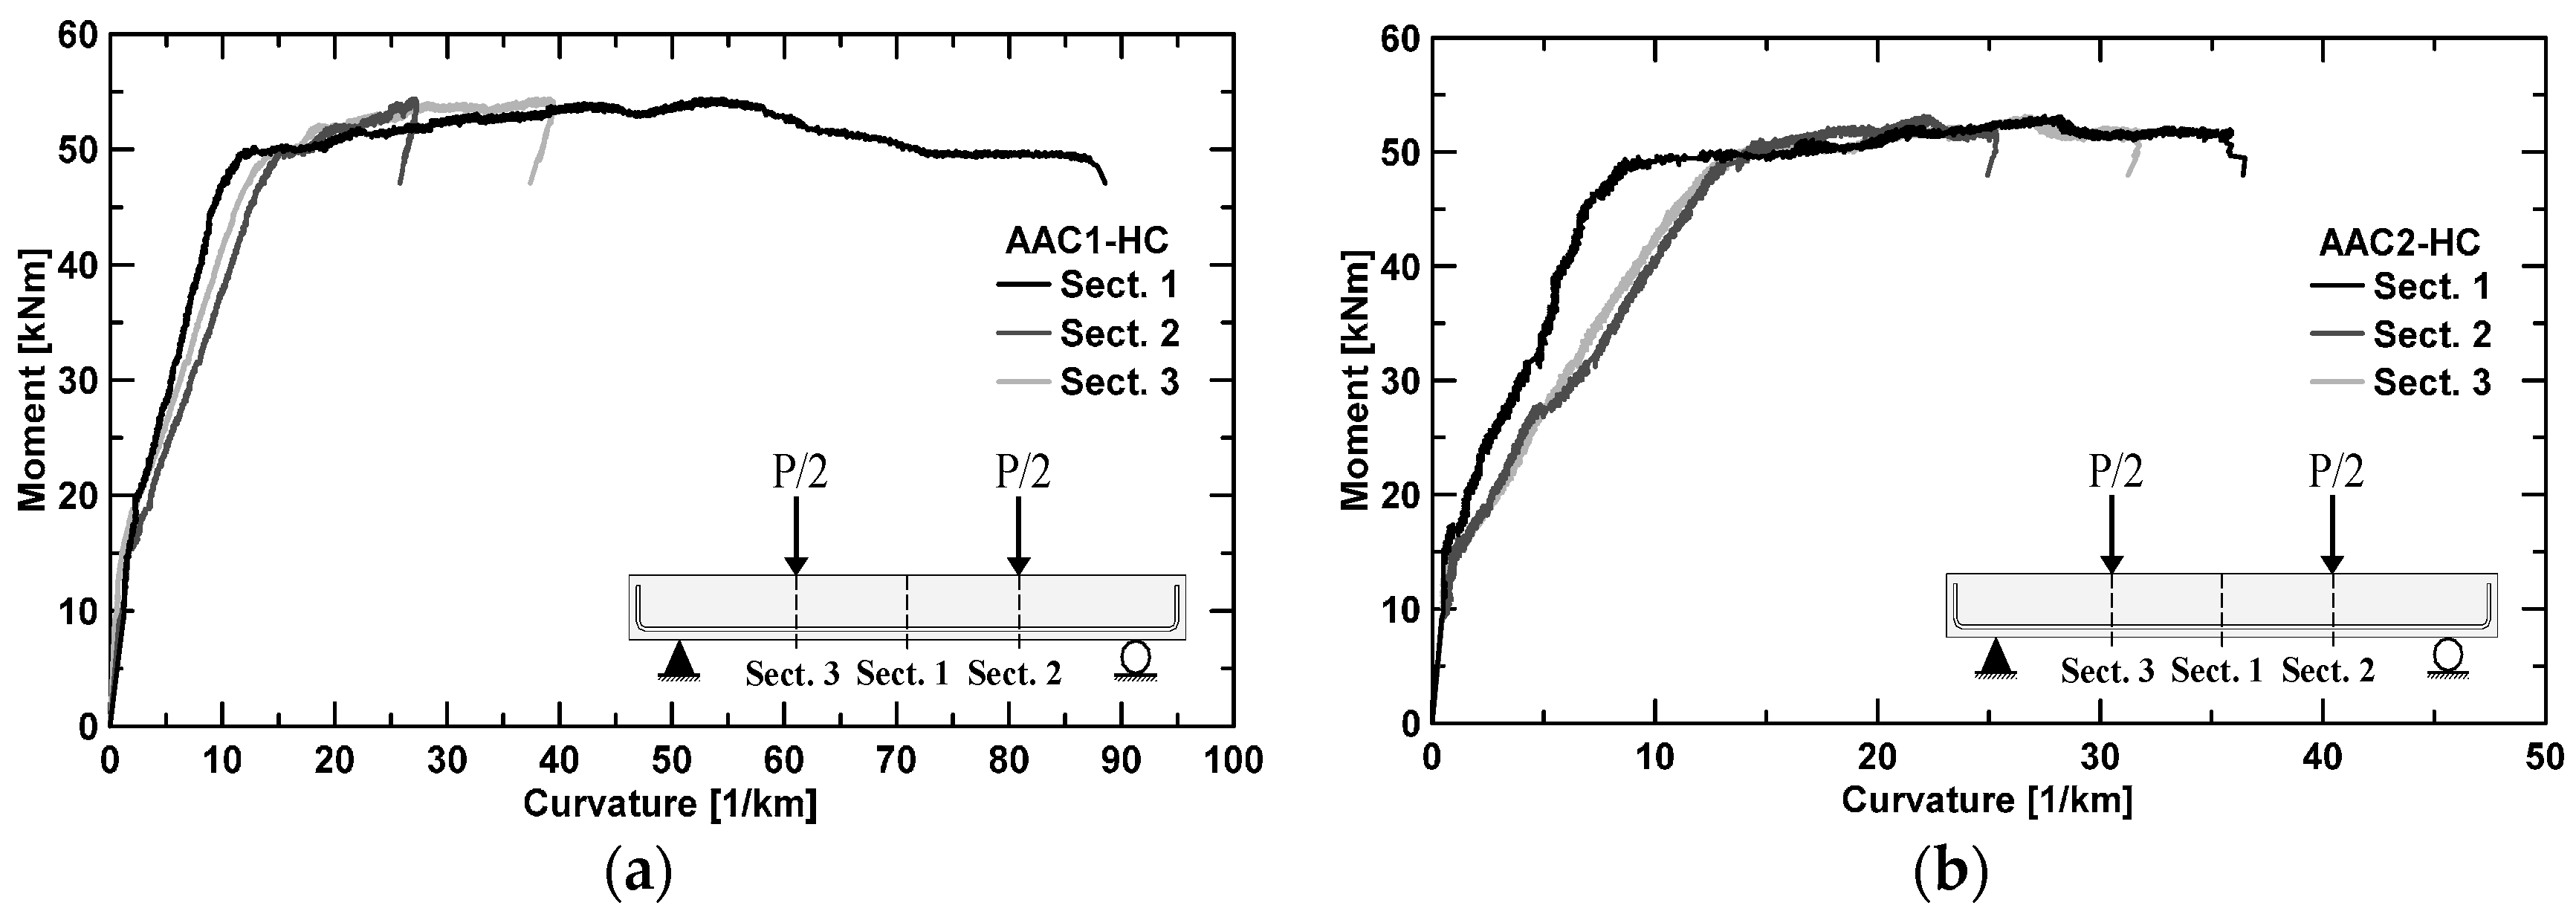
3.3. Structural Response

The load–midspan deflection curves of AAC1-HC and AAC2-HC full-scale beams are reported in Figure 8. AAC beams act like OPC showing an elastic range (uncracked stage), followed by a cracked-elastic stage up to a clear yielding of rebar.
Mid-span deflections have been monitored by two LVDTs, located in the front and in the back of the beam at midspan (Figure 4 for details); for the deflection calculation, the influence of support displacement was also taken into account.
Despite the different Young’s modulus and testing time (AAC1-HC has been tested 31 days after pouring, whereas AAC2-HC after eight days only), beams behavior is almost identical; experimental curves fit very well especially in the pre-yielding phase. Table 3 summarizes all the main experimental results for both beams.
A prediction of both ultimate load Pu and flexural moment Mu was provided using the following formula that assumes the rebar yielding, as experimentally observed:
M u = 0.9 d A s f y = 51  kNm ,
P u = 2 M u a = 89  kN ,
where
  • d = effective depth (260 mm);
  • As = longitudinal reinforcement (402 mm2);
  • fy = steel yield strengths (546 MPa); and
  • a = shear span (1150 mm).
Figure 9 illustrates the experimental local moment–curvature curves at different cross sections obtained for the two structural elements; the moment was directly derived by the applied load and curvature from potentiometers readings. For the curvature calculations, only the top and bottom potentiometers were considered. Again, moment–curvature development has the typical trend of OPC materials; the difference in the flexural stiffness EJ is due to the number of cracks developed along the instrumentation position (Figure 10); a greater number of cracks produced a decrease in the stiffness.
Both the load–midspan deflection and moment–curvature curves were obtained considering the self weight of the beam and the loading system, the latter weighting 16 kN.
Ultimate load values obtained from the test are 95 and 92 kN, respectively, for AAC1-HC and AAC2-HC. Therefore, experimental data slightly exceed the prediction by 6.7% (AAC1-HC) and 3.4% (AAC2-HC). The moment at yielding is for both beam around 50 kNm, as well predicted by Equation (5).
Ductility values, calculated as a ratio between ultimate and yielding displacement, are, respectively, equal to 4.22 and 3.24 for AAC1-HC and AAC2-HC, as also shown in Table 3.
As expected, even though well beyond rebar yielding, collapse was due to concrete crushing at midspan, as shown in Figure 11.

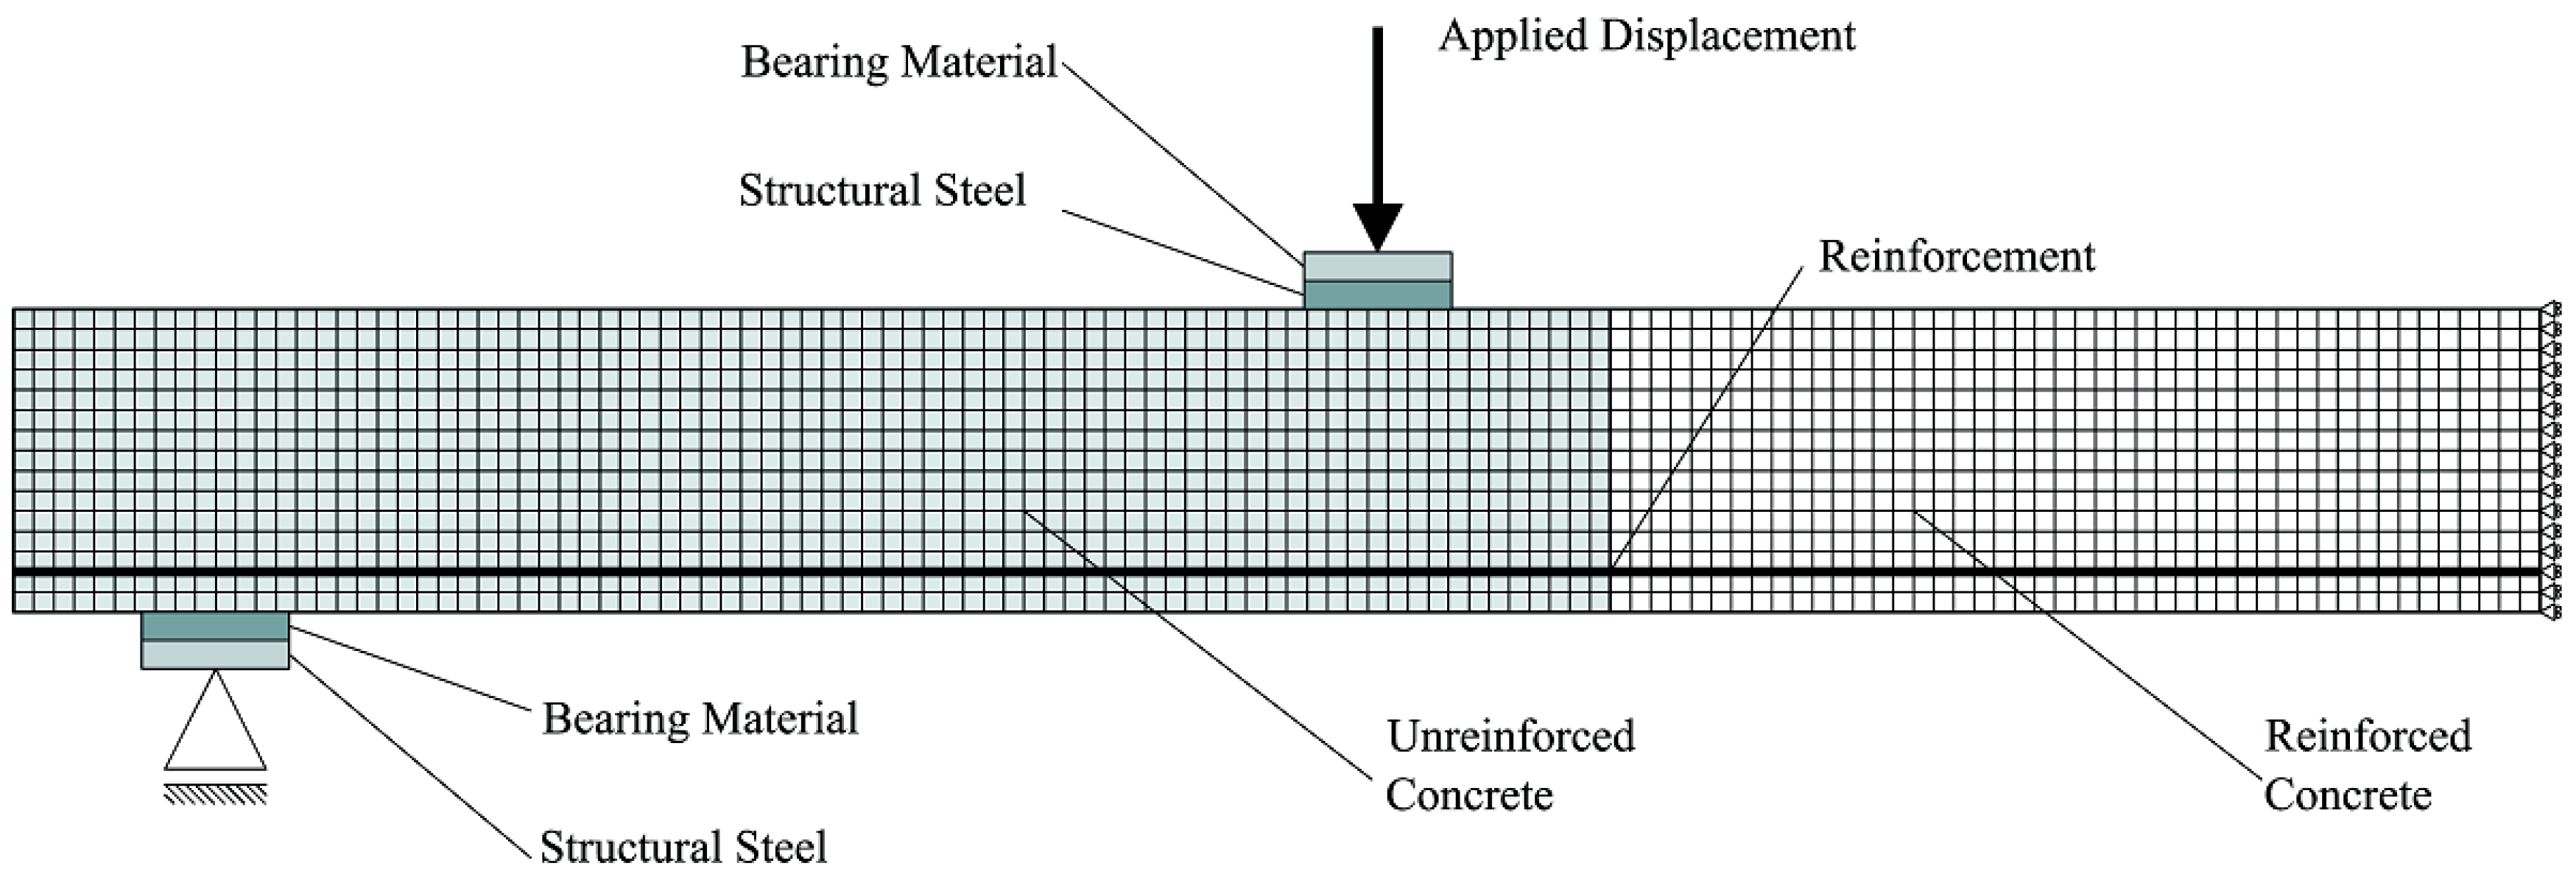
3.4. Numerical Analyses
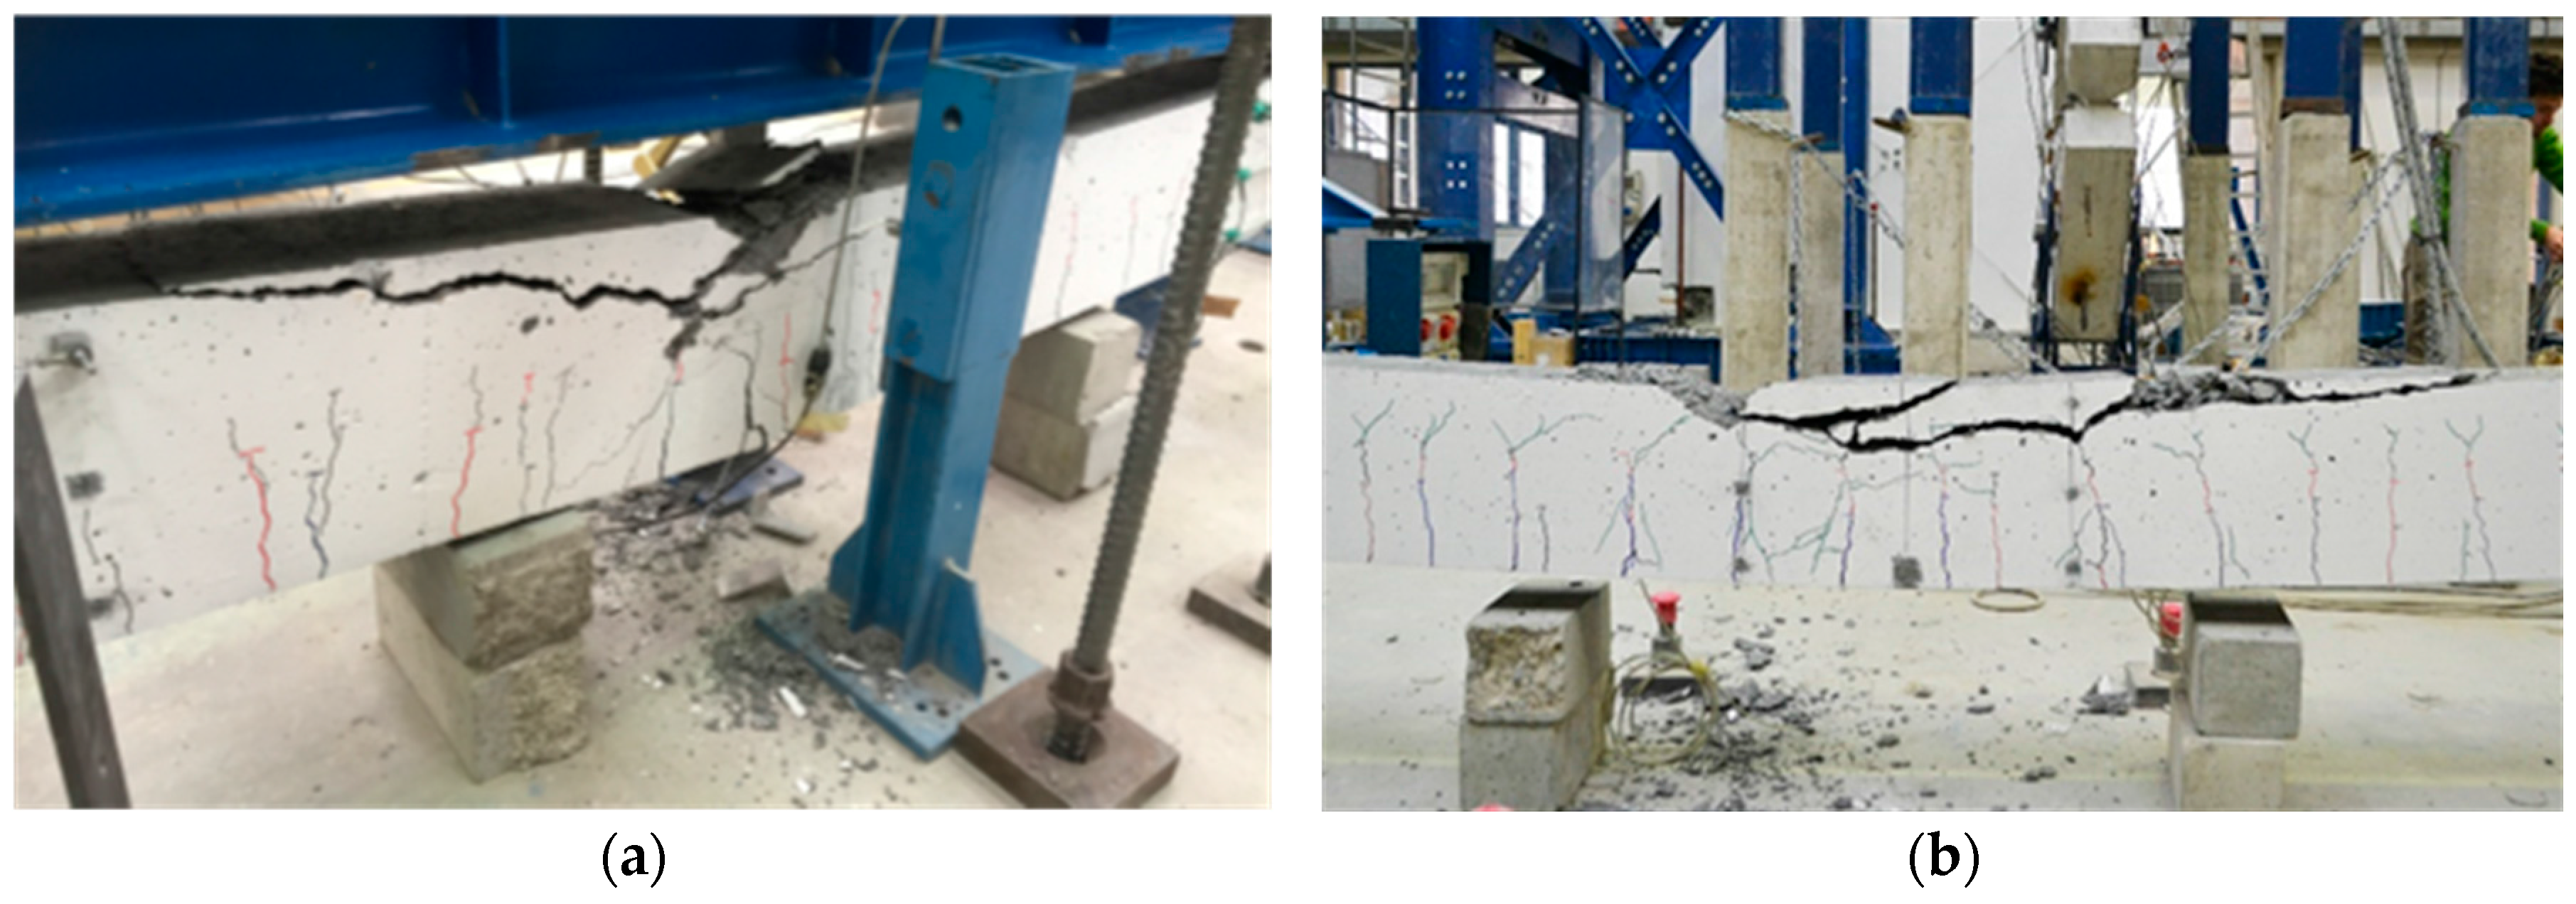
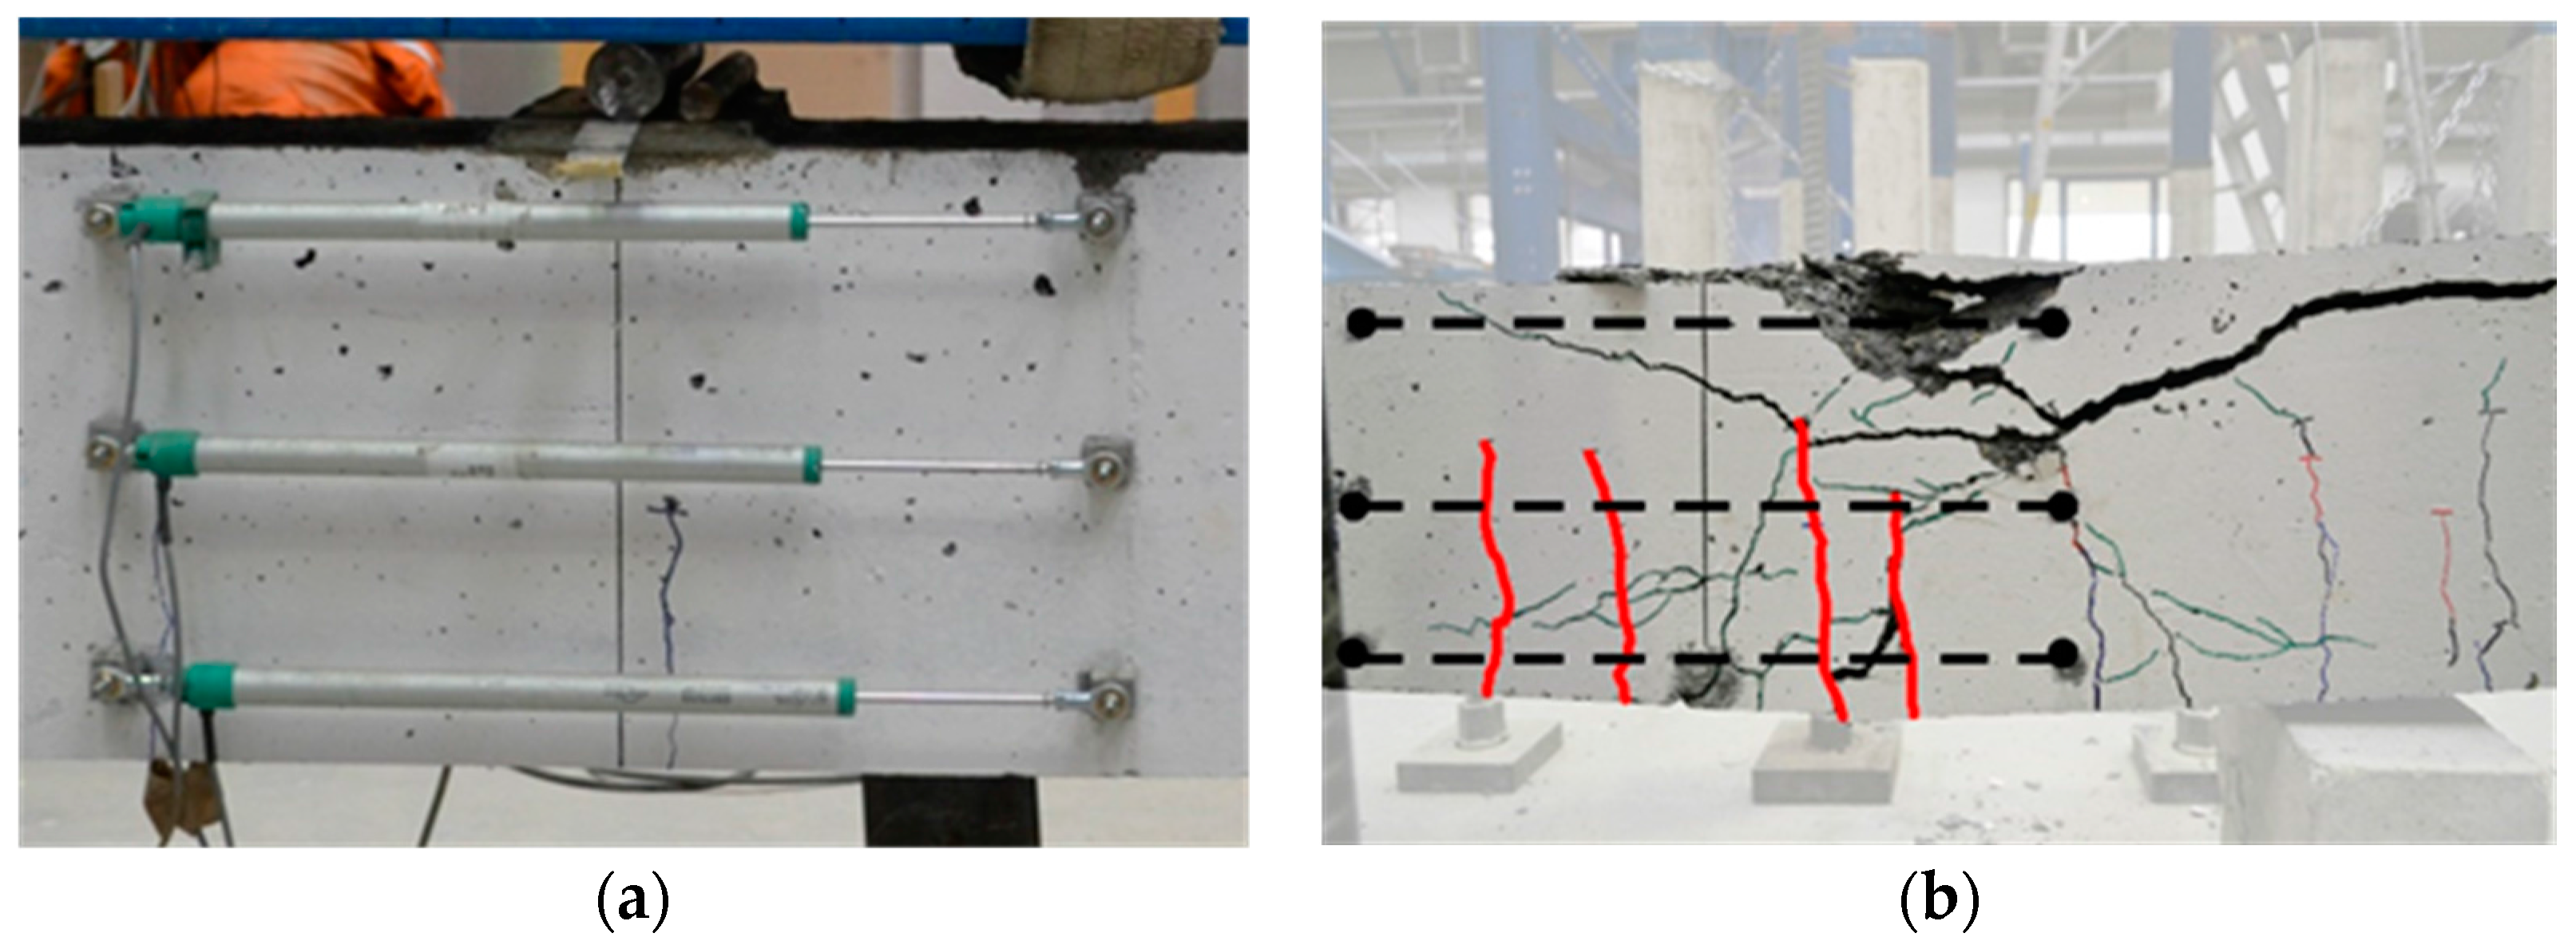
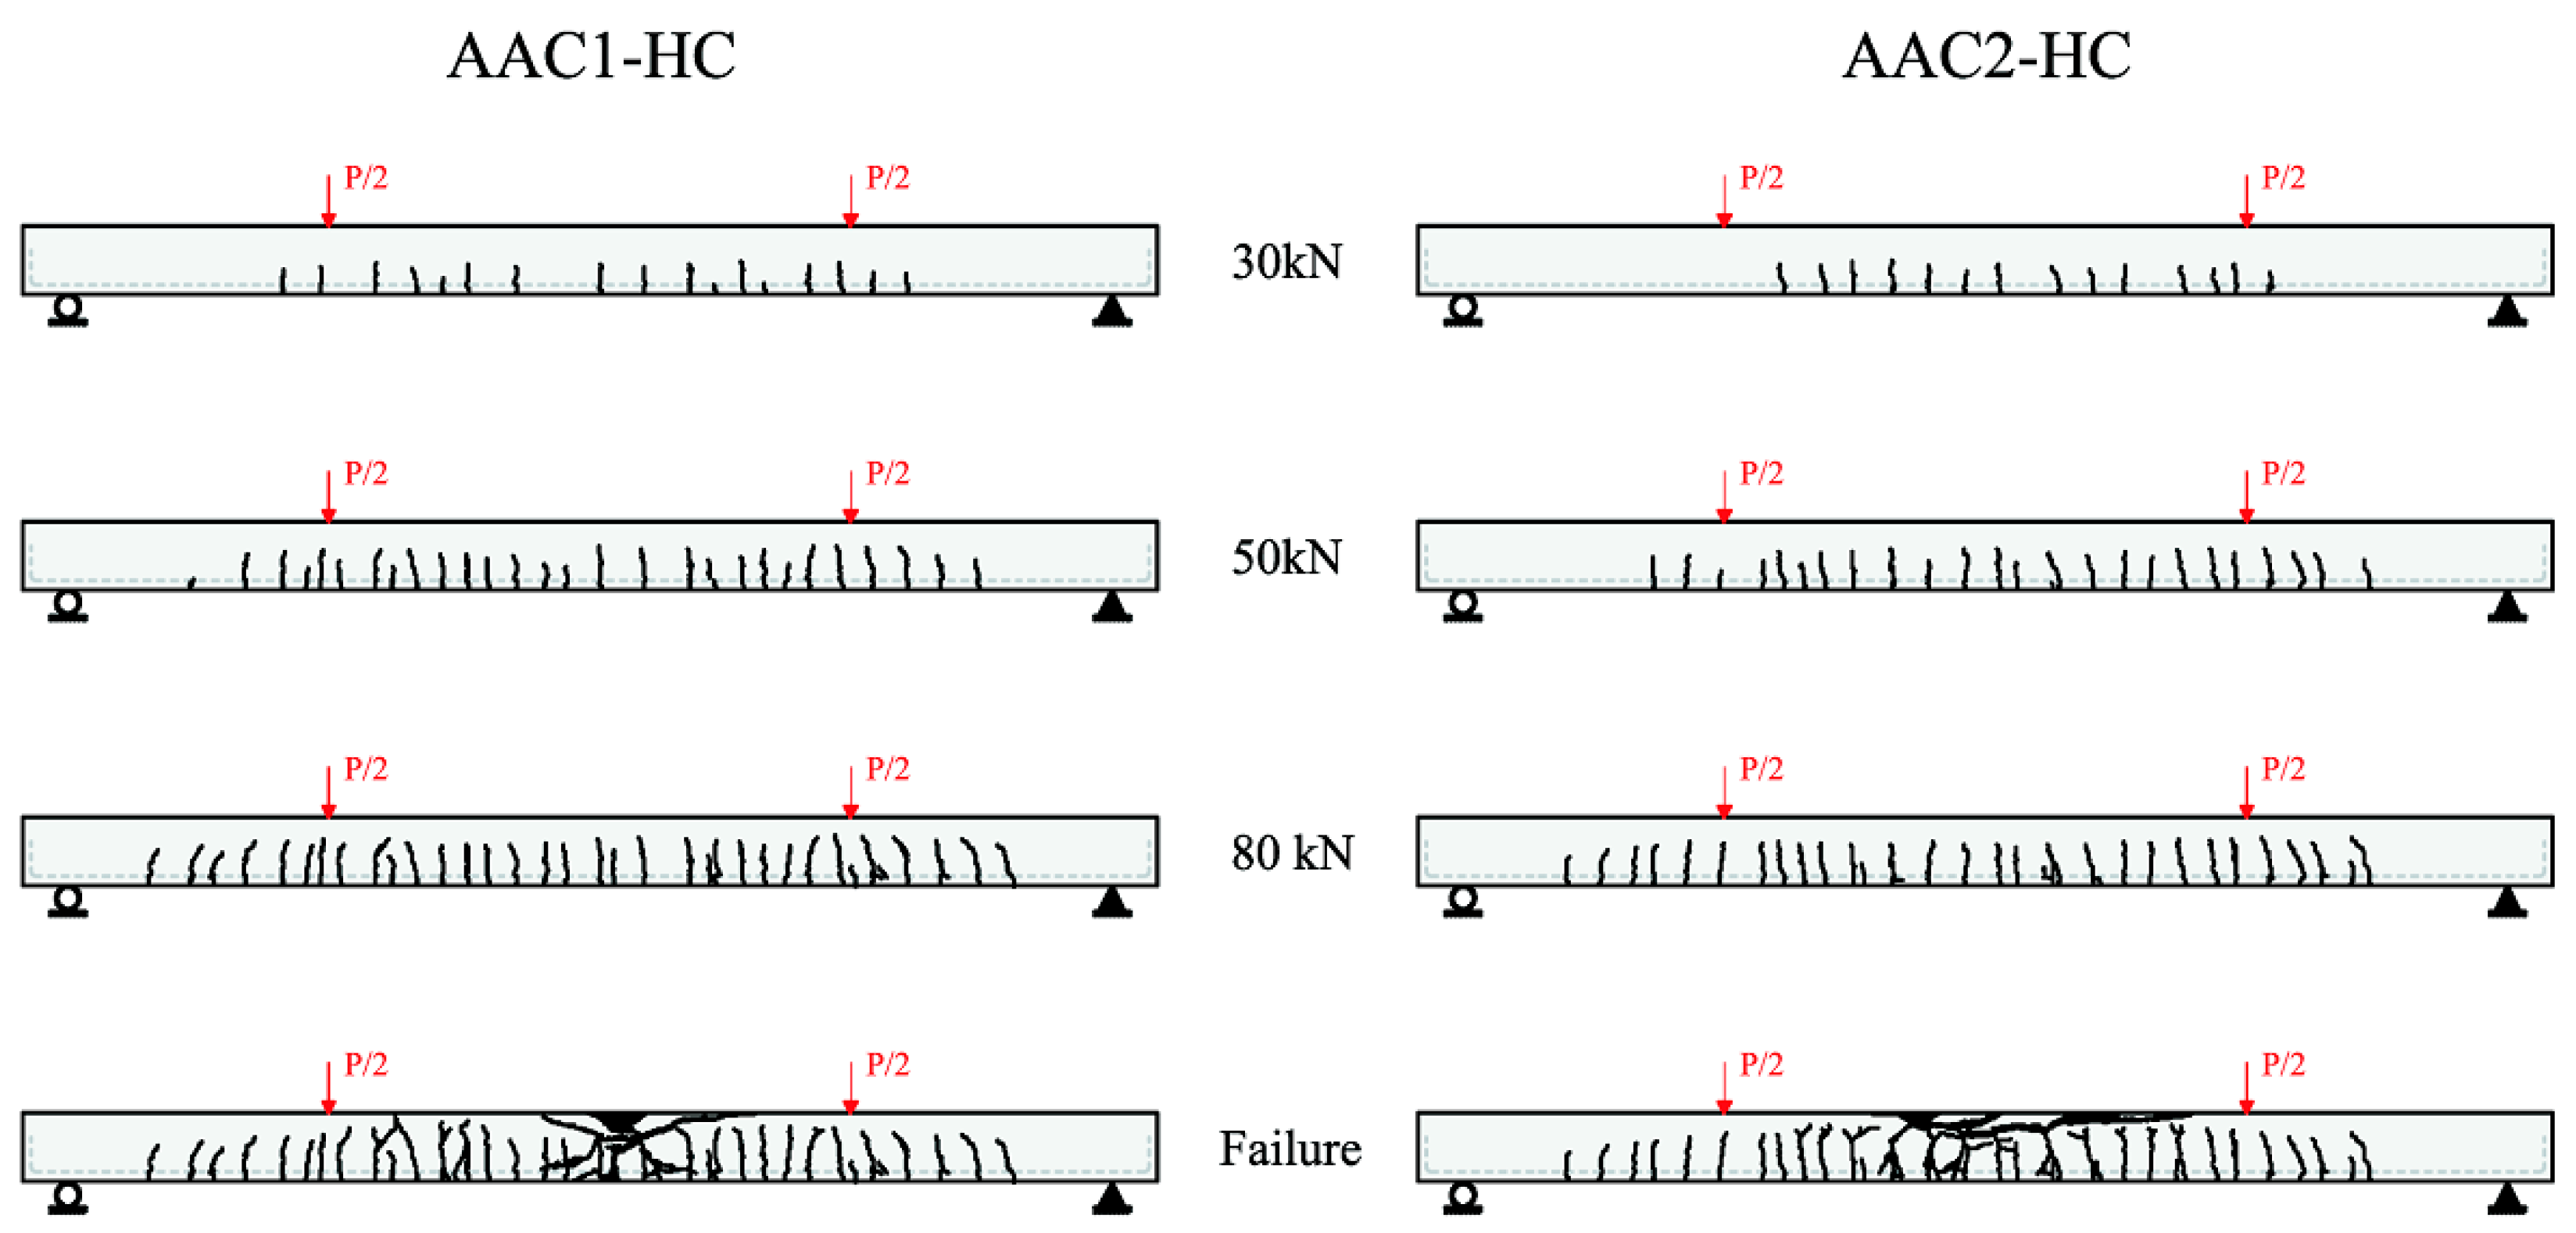
Experimental load–midspan deflection curves are compared with an analytical curve obtained through the nonlinear finite element analysis program VecTor2 (VT2), developed by Professor Vecchio at the University of Toronto [36] and based on the Modified Compression Field Theory [37]. Since the mixture design is the same for both beams and experimental curves are almost identical, only one numerical curve was derived by averaging all material input data derived from material characterization tests.
Input data for VT2 for both concrete and steel materials are illustrated in Table 4. A 2D plane stress finite element model was adopted; moreover, the finite element mesh was characterized by having four-noded elements (around 20 mm × 20 mm in size) with uniform thickness (200 mm). In order to obtain consistent numerical predictions (no mesh sensitivity), at least 15 elements were modeled along the depth of the specimens after a pilot sensitivity study. Reinforcing bars were defined as an elasto-plastic material, with hardening, by means of a multi-linear stress–strain curve representing the actual response of several bars tested. Rebar were modeled as truss reinforcement, perfectly bonded to the surrounding concrete.
The crack spacing was numerically evaluated by the classical formulation, implemented in the program VT2 and adapted from Model Code 1978 [38].
Figure 12 depicts a typical mesh constructed for the numerical analyses.
In order to avoid unrealistic punching (or local) failure and numerical instability due to load concentration, point load and supports were simulated as nodal loads acting on a steel plate having a longitudinal dimension of six finite elements, connected to the concrete elements through a bearing material (Figure 12), for simulating mortar beds that were experimentally provided between specimen and any support/loading plate.
The obtained analytical curve fits quite well with the experimental data, especially in the uncracked and cracked-elastic stage, with a good modeling of the phenomena related to the post-cracking stiffness, cracking formation and progression, tension stiffening effect and others. The modeling, on the other hand, tends to slightly overestimate the load at yielding and the maximum capacity by about 7.5%–8.6% and 4%–7.1%, respectively.
Main load and displacement values are summarized in Table 3, where a comparison with experimental results is also provided.
Based on this preliminary study, it can be said that the set of nonlinear constitutive models, typical of classical reinforced concrete elements, are also able to satisfactorily model alkali activated reinforced concrete beams, hence envisaging a safe utilization of these available tools for a better understanding of structural implications of these new materials.

3.5. Crack Pattern

Figure 13 shows crack patterns for both beams at four different load levels: 30, 50, and 80 kN, and at collapse. The three values refer to a loading condition just after the first cracking (30 kN), at a typical service condition (50 kN) in which the cracking phenomenon is stabilized, and just before the rebar yielding (80 kN). As expected, flexure cracks initiated in the pure bending zone (flexural span). As the load increased, existing cracks propagated and new cracks developed along the span. The crack patterns observed for AAC beams were similar to those reported in the literature for reinforced OPC beams.
Cracks were able to penetrate into the member depth even for low loads: mean depth of cracks for the first load level (30 kN) was comprised between 10 and 15 cm. In the following load steps, pre-existing cracks further developed and new cracks formed (none after 80 kN). Some of these cracks, especially at mid-span, opened widely near failure. After rebar yielding, minor shear cracks also started to develop, as shown in Figure 13.
Mean crack spacing was experimentally evaluated and compared with CEB-FIP Model Code 1978 [38] formula, developed for OPC structural elements:
S m = 2 ( c + s 10 ) + k 1 k 2 Ф ρ e f f
where
  • c = concrete clear cover;
  • s = distance between longitudinal reinforcement bars;
  • k1 = coefficient regarding bond between bars and concrete (k1 = 0.4)
  • k2 = coefficient regarding stress distribution in the cross section (k2 = 0.125);
  • Ф = longitudinal reinforcement bars diameter; and
  • ρeff = effective reinforcement ratio.
The previous formula in Equation (7) predicts a crack spacing of 115 mm, which is almost coincident with the mean experimental crack spacing, varying from 102 to 113 mm (see Table 3). The cracking formation and development are therefore rather similar to well acknowledged classical reinforced concrete beams.

4. Conclusions

The experimental results of two flexure tests on full-scale beams made of AAC were presented and discussed in this paper, focusing on the material characterization, on the structural response and on a preliminary analytical investigation.
Based on the results of this experimental investigation, the following conclusions can be drawn regarding material characterization:
(1)
Due to heat process, no increase in compressive strength over time (between 7 and 28 days) was noticed.
(2)
MOR tests, besides the peak strength, pointed out a rather brittle behavior in tension of the AAC herein considered, coincident to OPC.
(3)
Experimental Young’s modulus resulted around 20% lower than OPC concrete, which might be due to the use of a 10 mm maximum aggregate size in the mix design.
(4)
Constitutive law in compression was found to have a trend similar to analytical formulas proposed for OPC only in the pre-peak response. On the contrary, in the post-peak response, AAC presented rather higher ductility, in contrast with other authors.
About structural behavior:
(5)
Despite a difference in testing time, flexural behavior of full-scale beams did not show significant differences in terms of the overall response, uncracked and cracked-elastic parameters, yielding and ultimate load.
(6)
The overall behavior under flexure (cracking formation and development included) was seen to be similar to an ordinary reinforced beam made of OPC concrete, showing failure due to concrete crushing after rebar yielding.
(7)
The preliminary nonlinear finite element analyses performed, using a set of equations describing the linear and nonlinear phenomena of classical OPC reinforced concrete elements, gave a rather good modeling of the AAC tested beams, promoting the utilization of these already available tools for further analyses able to improve the structural understanding of ACC members.

Acknowledgments

The authors would like to give their appreciation to General Admixtures Spa, BASF Construction Chemicals Italy and R.a.m. Italia Srl for supplying some of the materials. The authors would also like to thank Engineer Daniel Spada, Engineer Nicola Taddei and the technicians Luca Martinelli and Domenico Caravaggi from Material Laboratory of the University of Brescia for their precious contribution in the experiments. Giovanni A. Plizzari and Gaurav N. Sant are finally gratefully acknowledged for the fruitful discussion regarding this research project.

Author Contributions

Linda Monfardini and Fausto Minelli conceived and designed the experiments; Linda Monfardini performed the experiments; Linda Monfardini and Fausto Minelli analyzed the data and wrote the paper.

Conflicts of Interest

The authors declare no conflict of interest.

References

  1. The Cement Sustainable Initiative. Report from WBCSD: Business Solution for a Sustainable World. Available online: http://www.wbcsd.org/Pages/EDocument/EDocumentDetails.aspx?ID=11133&NoSearchContextKey=true (accessed on 23 August 2016).
  2. Malhotra, V.M. Introduction: Sustainable Development and Concrete Technology. ACI Concr. J. 2002, 24, 1147–1165. [Google Scholar]
  3. Mahasenan, N.; Smith, S.; Humphreys, K. The cement industry and global climate change: Current and potential future cement industry CO2 emissions. In Proceedings of the 6th International Conference on Greenhouse Gas Control Technologies, Kyoto, Japan, 1–4 October 2002; Gale, J., Kaya, Y., Eds.; Volume II, pp. 995–1000.
  4. Purdon, A.O. The action of alkalis on blast furnace slag. J. Soc. Chem. Ind. 1940, 59, 191–202. [Google Scholar]
  5. Glukhovsky, V.D. Gruntosilikaty (Soil Silicates); Gosstroyizdat: Kiev, Ukraine, 1959. [Google Scholar]
  6. Davidovits, J. Solid-Phase Synthesis of a Mineral Blockpolymer by Low Temperature Polycondensation of Alumino-Silicate Polymers: Na-poly(sialate) or Na-PS and Characteristics. In Proceedings of the IUPAC Symposium on Long-Term Properties of Polymers and Polymeric Materials, Stockholm, Sweden, 30 August–1 September 1976.
  7. Vora, P.R.; Dave, U.V. Parametric studies on compressive strength of geopolymer concrete. Procedia Eng. 2013, 51, 210–219. [Google Scholar] [CrossRef]
  8. Rangan, B.V. Geopolymer concrete for environmental protection. Indian Concr. J. 2014, 88, 41–58. [Google Scholar]
  9. Hardjito, D.; Rangan, B.V. Development and Properties of Low-Calcium Fly Ash Based Geopolymer Concrete; Research Report GC-1; Faculty of Engineering, Curtin University of Technology: Perth, Australia, 2005. [Google Scholar]
  10. Fernandez-Jimenez, A.M.; Palomo, A.; Lopez-Hombrados, C. Engineering properties of alkali-activated fly ash concrete. ACI Mater. J. 2006, 103, 106–112. [Google Scholar]
  11. Sofi, M.; Van Deventer, J.S.J.; Mendis, P.A.; Lukey, G.C. Engineering properties of inorganic polymer concretes (IPCs). Cem. Concr. Res. 2007, 37, 251–257. [Google Scholar] [CrossRef]
  12. Yost, J.R.; Radlinska, A.; Ernst, S.; Salera, M. Structural behavior of alkali activated fly ash concrete. Part 1: Mixture design, material properties and sample fabrication. Mater. Struct. 2013, 46, 435–447. [Google Scholar] [CrossRef]
  13. Sarker, P.K. Analysis of geopolymer concrete columns. Mater. Struct. 2009, 42, 715–724. [Google Scholar] [CrossRef]
  14. Popovics, S. A numerical approach to the complete stress–strain curve of concrete. Cem. Concr. Res. 1979, 3, 583–599. [Google Scholar] [CrossRef]
  15. Sarker, P.K. Bond strength of reinforcing steel embedded in fly ash-based geopolymer concrete. Mater. Struct. 2011, 44, 1021–1030. [Google Scholar] [CrossRef]
  16. Hardjito, D.; Wallah, S.E.; Sumajouw, D.M.J.; Rangan, B.V. On the development of fly ash-based geopolymer concrete. ACI Mater. J. Am. Concr. Inst. 2004, 101, 467–472. [Google Scholar]
  17. Kong, D.L.; Sanjayan, J.G. Effect of elevated temperatures on geopolymer paste, mortar and concrete. Cem. Concr. Res. 2010, 40, 334–339. [Google Scholar] [CrossRef]
  18. Puertas, F.; Palomo, A.; Fernández-Jiménez, A.; Izquierdo, J.; Granizo, M. Effect of superplasticisers on the behaviour and properties of alkaline cements. Adv. Cem. Res. 2003, 15, 23–28. [Google Scholar] [CrossRef]
  19. Nematollahi, B.; Sanjayan, J. Effect of different superplasticizers and activator combinations on workability and strength of fly ash based geopolymer. Mater. Des. 2014, 57, 667–672. [Google Scholar] [CrossRef]
  20. Yost, J.R.; Radlinska, A.; Ernst, S.; Salera, M. Structural behavior of alkali activated fly ash concrete. Part 2: Structural testing and experimental findings. Mater. Struct. 2013, 46, 449–462. [Google Scholar] [CrossRef]
  21. Sumajouw, D.M.J.; Rangan, B.V. Low Calcium Fly Ash Based Geopolymer Concrete: Reinforced Beams and Columns; Research Report GC-3; Faculty of Engineering, Curtin University of Technology: Perth, Australia, 2006. [Google Scholar]
  22. Sumajouw, D.M.J.; Hardjito, D.; Wallah, S.; Rangan, B.V. Behavior of Geopolymer Concrete Columns under Equal Load Eccentricities; American Concrete Institute: Farmington Hills, MI, USA, 2005; pp. 577–594. [Google Scholar]
  23. Sumajouw, D.M.J.; Hardjito, D.; Wallah, S.; Rangan, B.V. Fly ash-based geopolymer concrete: Study of slender reinforced columns. J. Mater. Sci. 2007, 42, 3124–3130. [Google Scholar] [CrossRef]
  24. American Concrete Institute (ACI). ACI 318-02; Building Code Requirements for Structural Concrete; ACI Committee: Farmington Hills, MI, USA, 2002; p. 318. [Google Scholar]
  25. Standards Association of Australia. AS3600; Concrete Structures Code; Standards Association of Australia: Sydney, Australia, 2001. [Google Scholar]
  26. Ng, T.S.; Amin, A.; Foster, S.J. The behaviour of steel-fibre-reinforced geopolymer concrete beams in shear. Mag. Concr. Res. 2013, 65, 308–318. [Google Scholar] [CrossRef]
  27. UNI 6556-1976. Tests on Concrete: Determination of the Secant Modulus of Elasticity in Compression; UNI-Ente Nazionale Italiano di Unificazion: Milano, Italy, 1976. [Google Scholar]
  28. EN 14651-5. Precast Concrete Products—Test Method for Metallic Fibre Concrete-Measuring the Flexural Tensile Strength; CEN-European Committee for Standardization: Brussels, Belgium, 2005. [Google Scholar]
  29. Davidovits, J. Geopolymer: Chemistry and Applications, 3rd ed.; Geopolymer Institute: Saint Quentin, France, 2011; p. 612. [Google Scholar]
  30. Davidovits, J.; Izquierdo, M.; Querol, X.; Antennuci, D.; Nugteren, H.; Butselaar-Orthlieb, V.; Fernández-Pereira, C.; Luna, Y. The European Research Project GEOASH: Geopolymer Cement Based On European Coal Fly Ashes. Available online: https://www.geopolymer.org/fichiers_pdf/GEOASH.pdf (accessed on 29 August 2016).
  31. EN 15630-1. Steel for the Reinforcement and Prestressing of Concrete—Part I: Test Methods; International Organization for Standardization: Geneva, Switzerland, 2004. [Google Scholar]
  32. Wallah, S.E.; Rangan, B.V. Low-Calcium Fly Ash-Based Geopolymer Concrete: Long-Term Properties; Research Report GC-2; Faculty of Engineering, Curtin University of Technology: Perth, Australia, 2006. [Google Scholar]
  33. NTC2008. Norme Tecniche per le Costruzioni. Decreto Ministeriale 14 Gennaio 2008. Available online: http://www.ingegneriasoft.com/NTC2008_Norme_tecniche_per_le_costruzioni.htm (accessed on 23 August 2016).
  34. EUROCODE 2. Design of Concrete Structures; EN-1992-1-1; CEN-European Committee for Standardization: Brussels, Belgium, 2004. [Google Scholar]
  35. Thorenfeldt, E.; Tomaszewicz, A.; Jensen, J.J. Mechanical properties of high strength concrete and application in design. In Proceedings of the Symposium Utilization of High Strength Concrete, Stravanger, Norway, 15–18 June 1987; Trondheim, T., Ed.; pp. 149–159.
  36. Wong, P.S.; Vecchio, F.J. VecTor2 and FormWorks User’s Manual; Technical Report of the Department of Civil Engineering; University of Toronto: Toronto, ON, Canada, 2002. [Google Scholar]
  37. Vecchio, F.J.; Collins, M.P. The Modified Compression Field Theory for Reinforced Concrete Elements Subjected to Shear. ACI J. 1986, 83, 219–231. [Google Scholar]
  38. Comité Euro-Internationale du Béton. CEB-FIP Model Code-Design Code; Comité Euro-International du Béton, CEB Bulletin d’ Information; Thomas Telford: London, UK, 1978; pp. 124–125. [Google Scholar]
Figure 1. Sample details for full-scale beams, dimensions in mm.
Materials 09 00739 g001
Figure 2. Hand-made curing chamber: position of heating elements (a); and monitoring instrumentation (b).
Materials 09 00739 g002
Figure 3. Scheme of loading system adopted.
Materials 09 00739 g003
Figure 4. Instrumentation position. Potentiometers (±125 mm range), LVDTs at midspan (±100 mm range), under load point (±50 mm range) and at supports (±20 mm range).
Materials 09 00739 g004
Figure 5. Compressive cubic strength versus time (HC = Heat Curing, and AC = Ambient curing).
Materials 09 00739 g005
Figure 6. Stress–strain relationship in compression for: AAC1-HC (a); and AAC2-HC (b).
Materials 09 00739 g006
Figure 7. Tensile stress–CMOD relationship for: AAC1-HC (a); and AAC2-HC (b).
Materials 09 00739 g007
Figure 8. Experimental and numerical load–deflection curves.
Materials 09 00739 g008
Figure 9. Moment-Curvature curves for: AAC1-HC (a); and AAC2-HC (b), at different sections.
Materials 09 00739 g009
Figure 10. Example of potentiometers position before the test (a); and cracks developed along instrumentation (b).
Materials 09 00739 g010
Figure 11. Concrete crushing, with yielding of rebar, for: AAC1-HC (a); and AAC2-HC (b).
Materials 09 00739 g011
Figure 12. Finite element model adopted.
Materials 09 00739 g012
Figure 13. Crack pattern at different load levels (front side) of AAC1-HC and AAC2-HC beams.
Materials 09 00739 g013
Table 1. Chemical composition of Class F fly ash.
ComponentAl2O3SiO2 *CaOFe2O3MgOK2ONa2OTiO2SO3
(%)(%)(%)(%)(%)(%)(%)(%)(%)
Percent Composition285625.50.2 ÷ 30.2 ÷ 20.1 ÷ 0.60.1 ÷ 1.70.2 ÷ 2
* where 40% is composed by reactive silica, representative of pozzolanic potential of fly ash.
Table 2. Choice of curing and mixing parameters.
Parameter InvestigatedBest Value
Extra water content, kg/m325–35
Total mixing time, min8–10
Rest period, h48
Curing time at 60 °C, h24
Table 3. Comparison between experimental and analytical results.
Results InvestigatedAAC1-HCAAC2-HCVT2Comparison AAC1-HC-VT2 (%)Comparison AAC2-HC-VT2 (%)
Maximum Load, kN9592994.07.1
Displacement at maximum load, mm131901363.733.8
Ultimate displacement, mm156123146−6.815.8
Ultimate load, kN8688948.56.4
Ultimate displacement/span length1/291/371/32−10.313.5
Yielding displacement, mm3738382.60.0
Yielding load, kN8586938.67.5
Ductility4.223.243.84−9.715.8
Mean crack spacing, mm102113---
Table 4. Input data for VT2.
Unreinforced Concrete Parameters
Cylinder compressive Strength fc32 MPa
Elastic modulus E24.6 GPa
Maximum aggregate size10 mm
Reinforced Concrete Parameters
Cylinder compressive strength fc32 MPa
Elastic modulus E24.6 GPa
Maximum aggregate size10 mm
Reinforcement direction90 deg
Reinforcement ratio0.67%
Transverse reinforcement yield strength fy545 MPa
Transverse reinforcement ultimate strength fu649 MPa
Transverse reinforcement elastic modulus Es206 GPa
Transverse reinforcement strain hardening εsh7 millistrain
Transverse reinforcement ultimate strain εu100 millistrain
Longitudinal Steel Reinforcement Parameters
Yield Strength fy545 MPa
Ultimate Strength fu649 MPa
Elastic Modulus Es206 GPa
Strain Hardening εsh7 millistrain
Ultimate Strain εu100 millistrain
Bearing Material Parameters
Direction90° to the horizontal
Structural Steel Parameters
Yield Strength fy500 MPa

