
Superplasticizer Addition to Carbon Fly Ash Geopolymers Activated at Room Temperature


Abstract
:1. Introduction
2. Materials and Methods
2.1. Raw Materials
2.2. Geopolymer Preparation
2.3. Geopolymer Mortar Preparation
2.4. Testing Methods of Fresh Properties
2.5. Testing Methods of Hardened Properties
2.6. Admixtures Characterization
3. Results
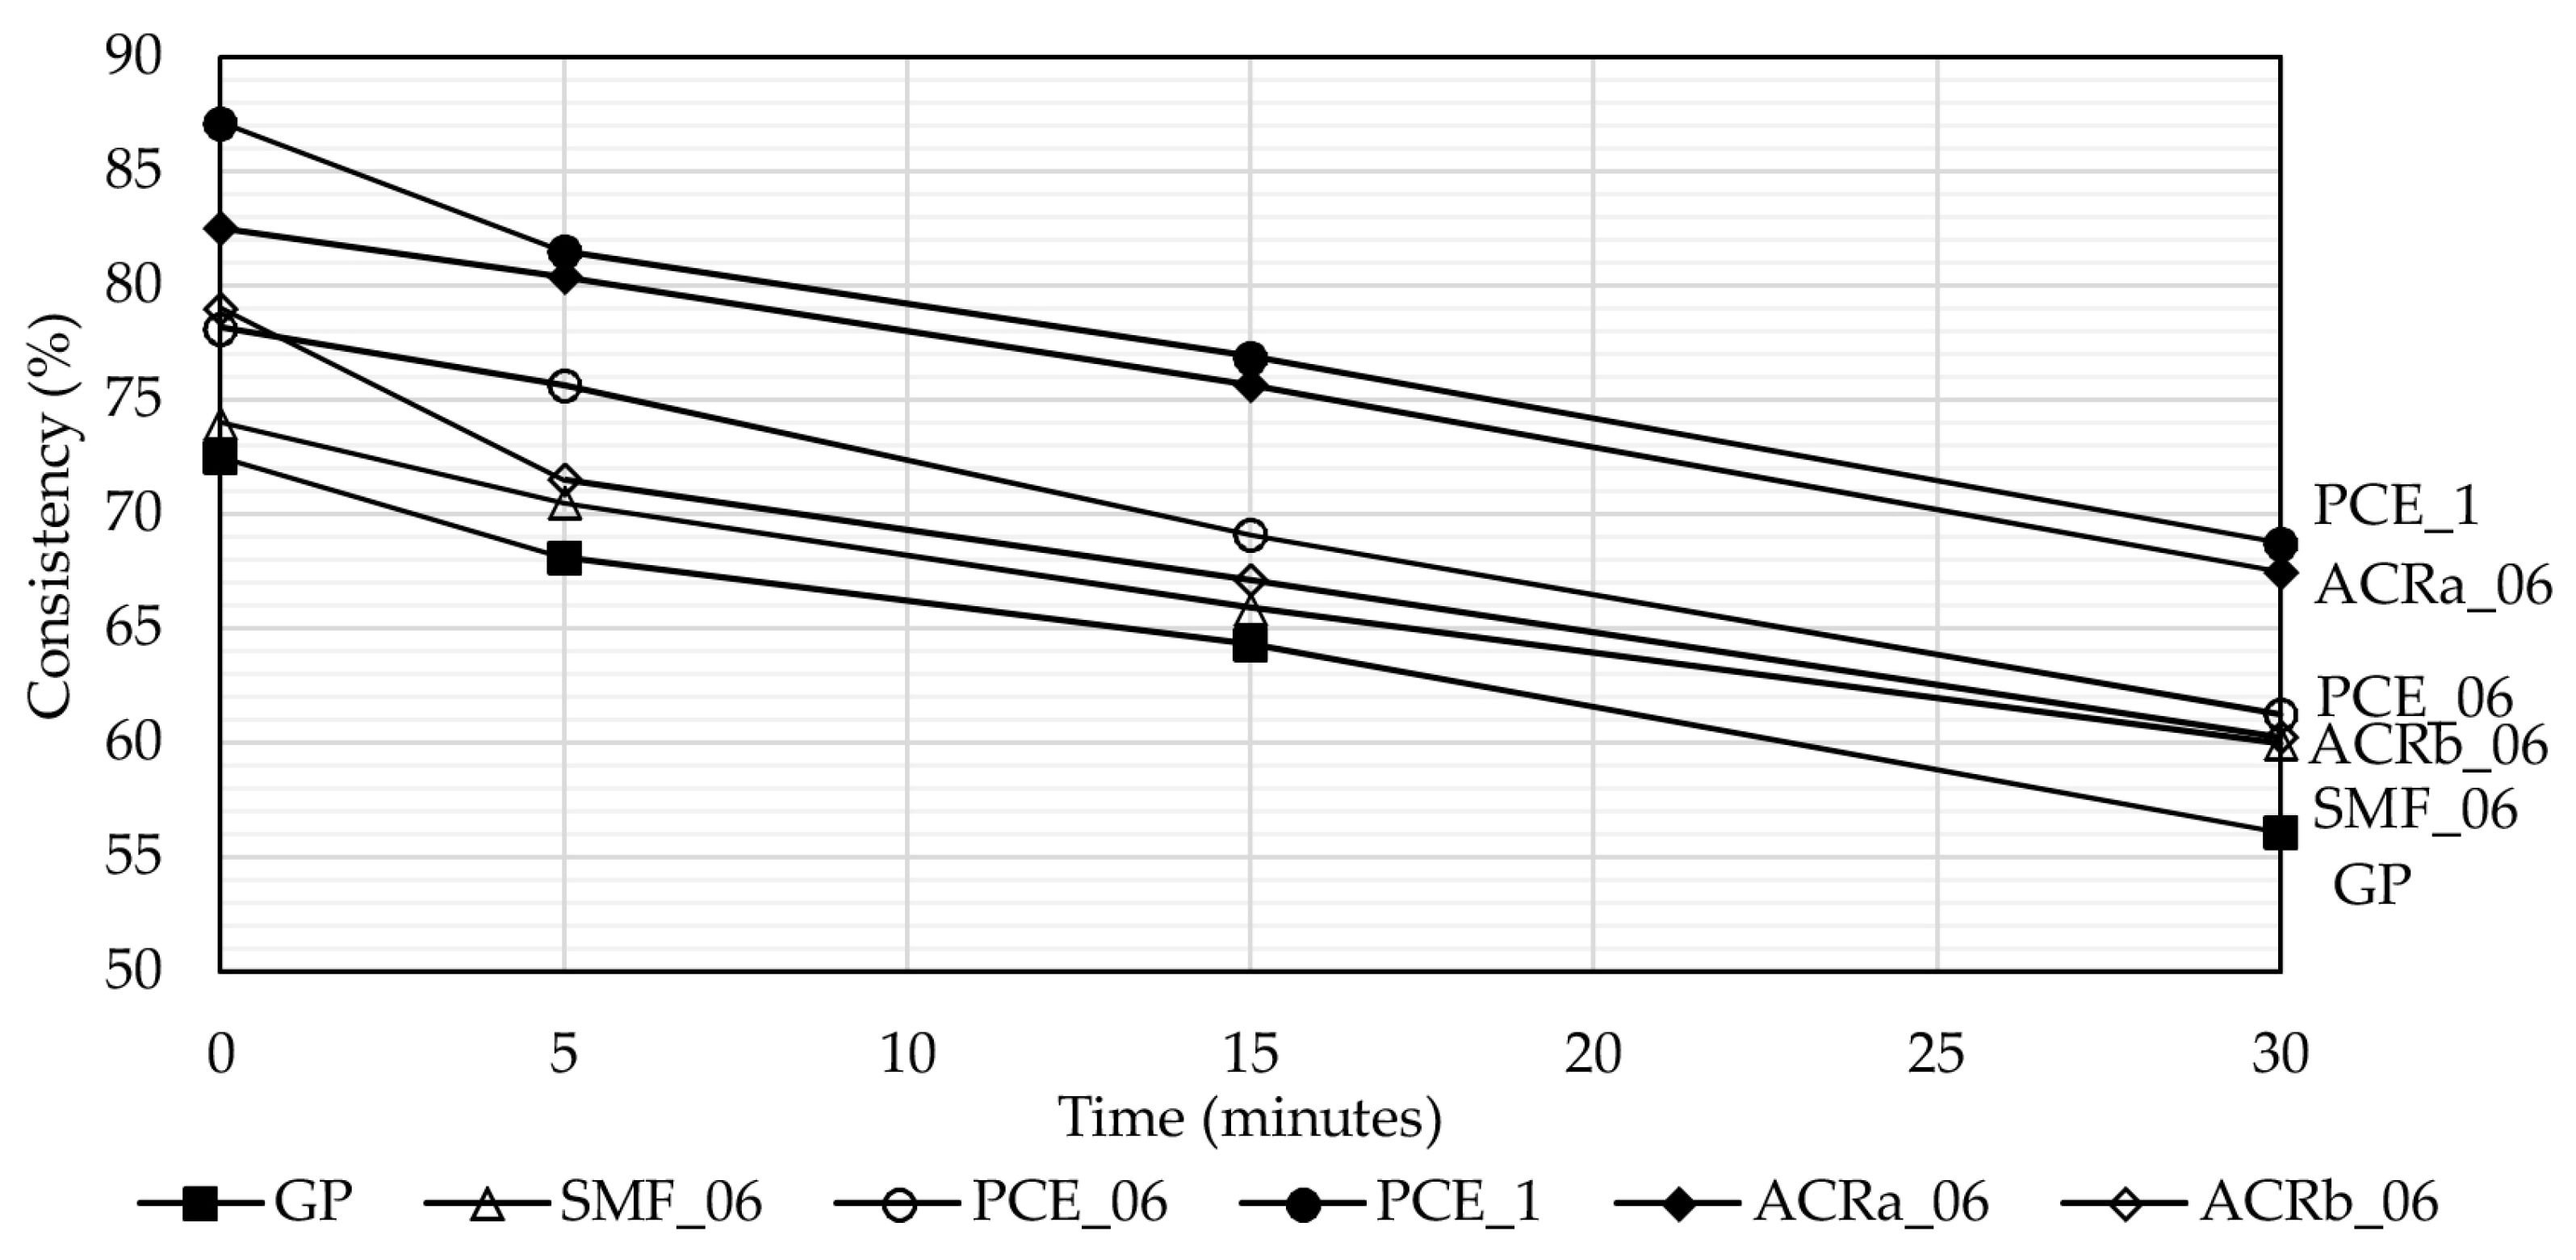
3.1. Workability
3.2. Air Content
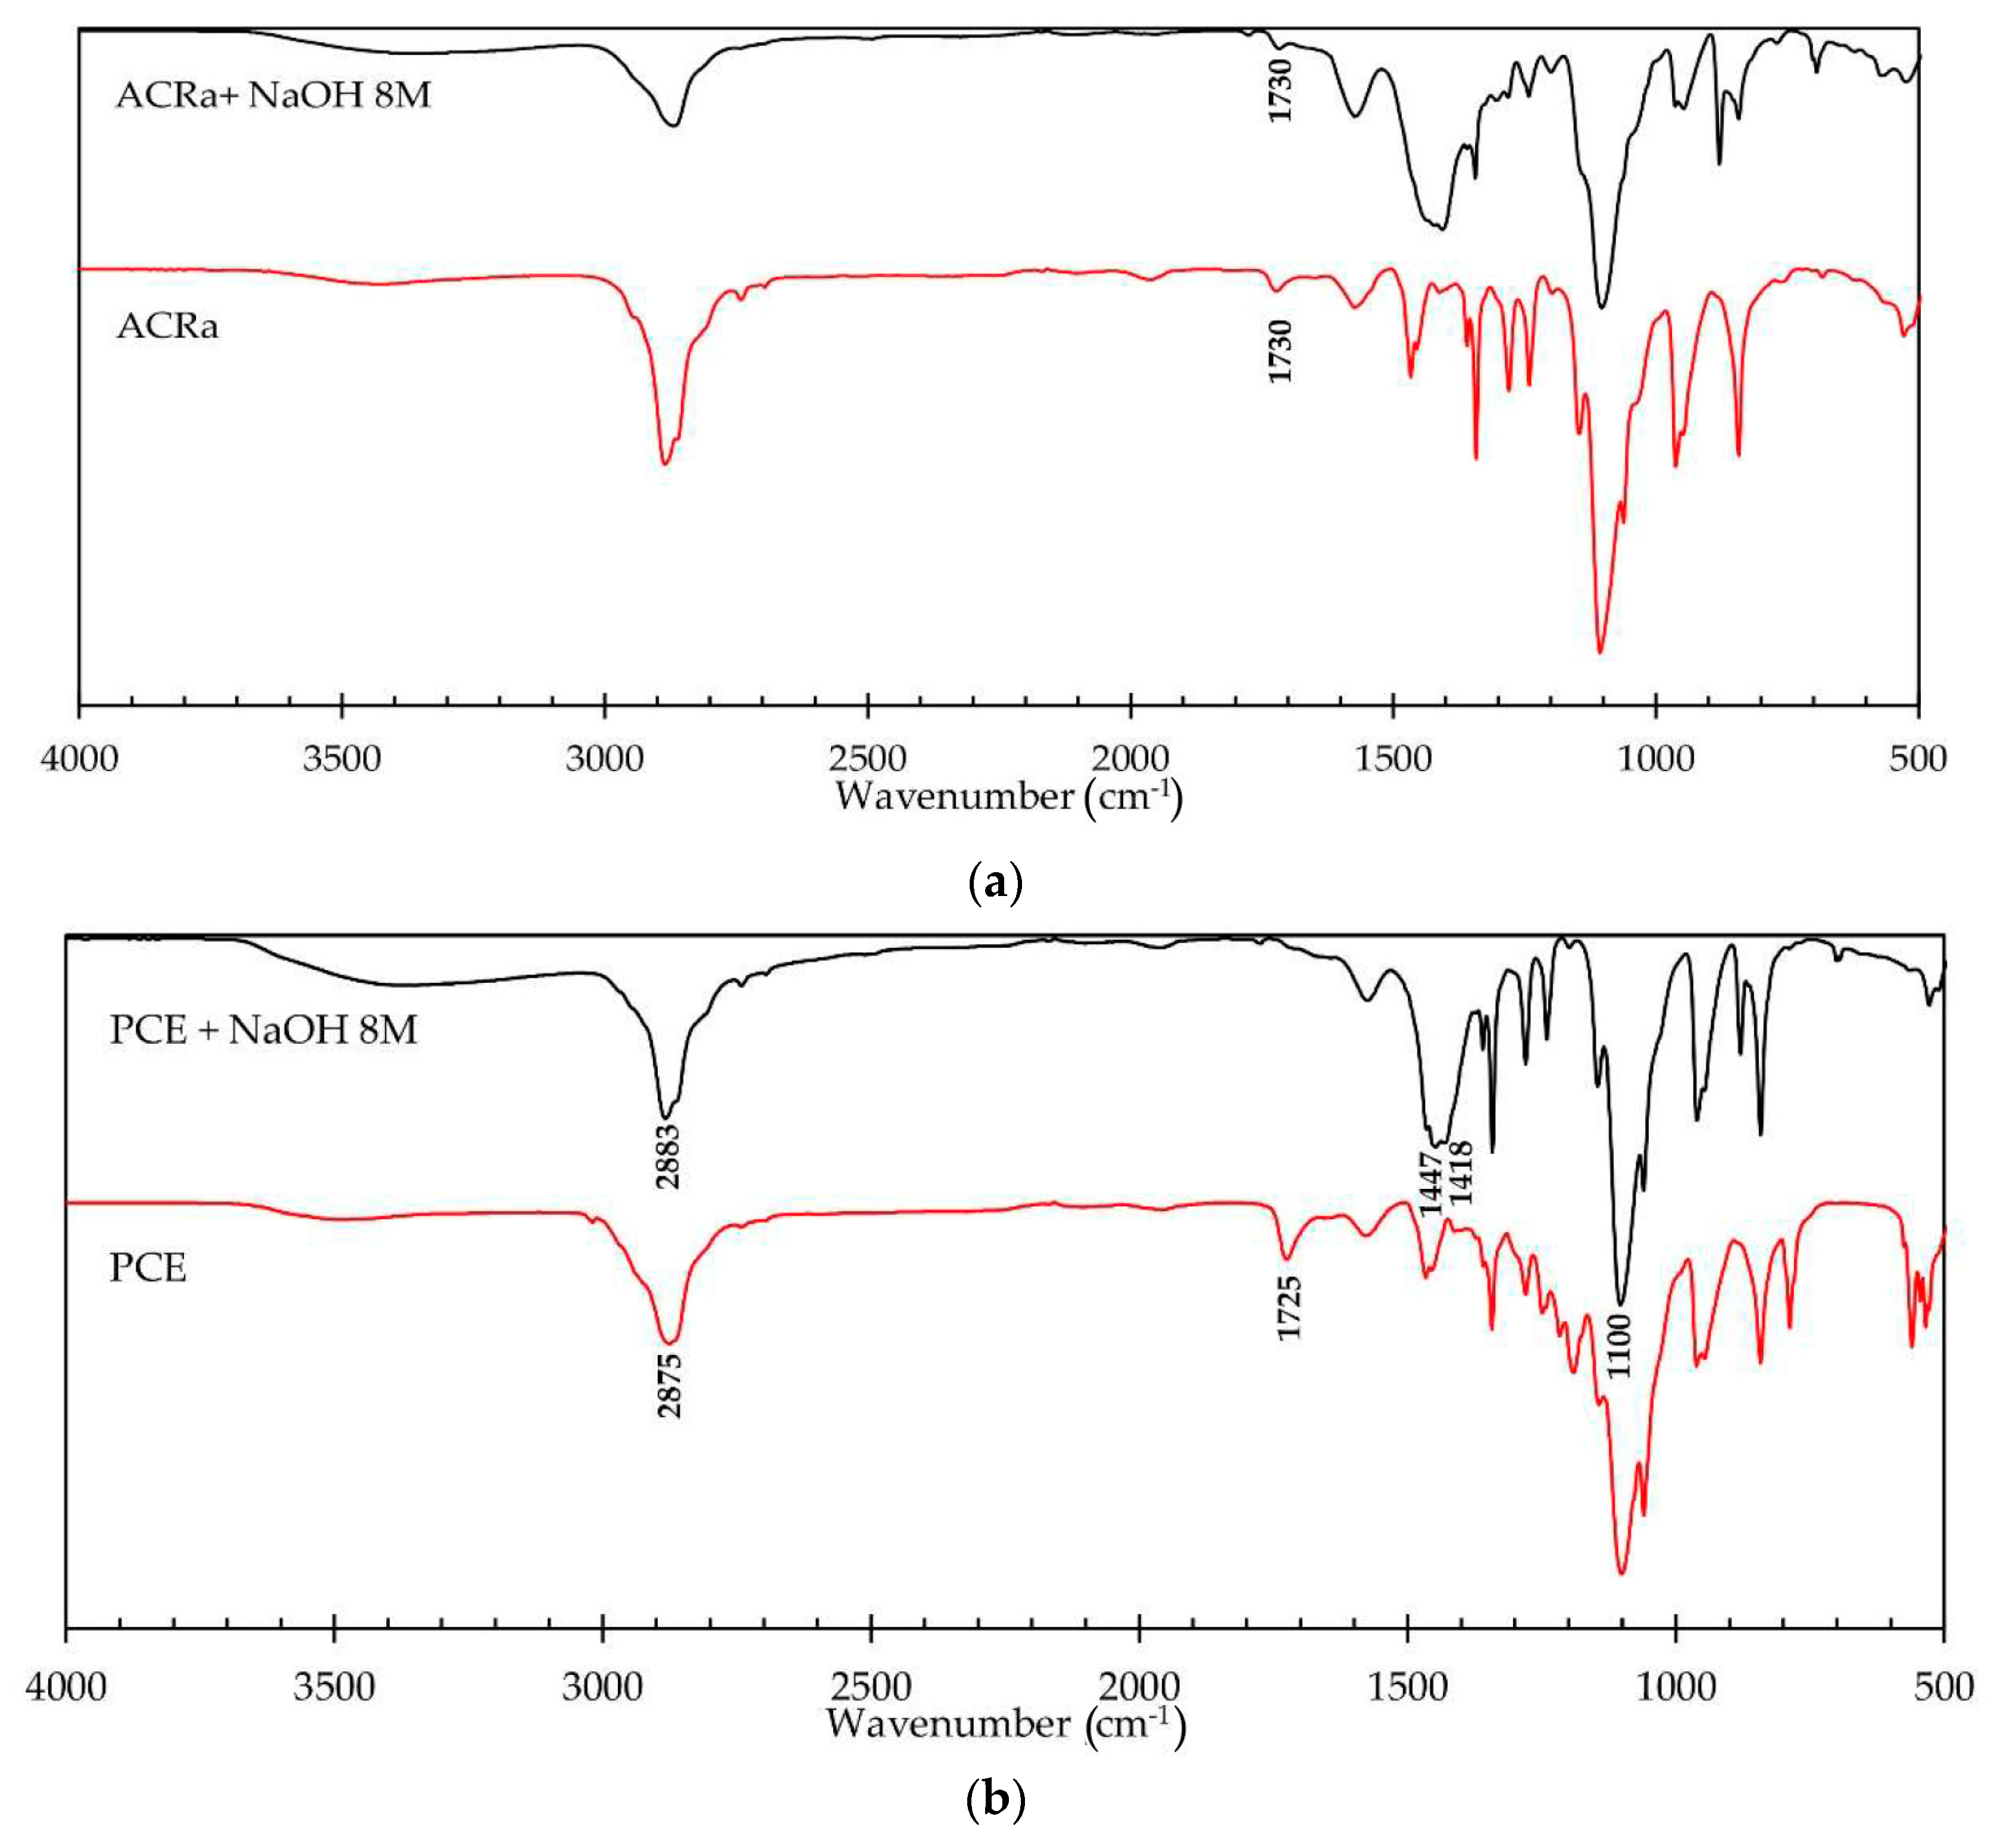
3.3. Superplasticizer Chemical Stability
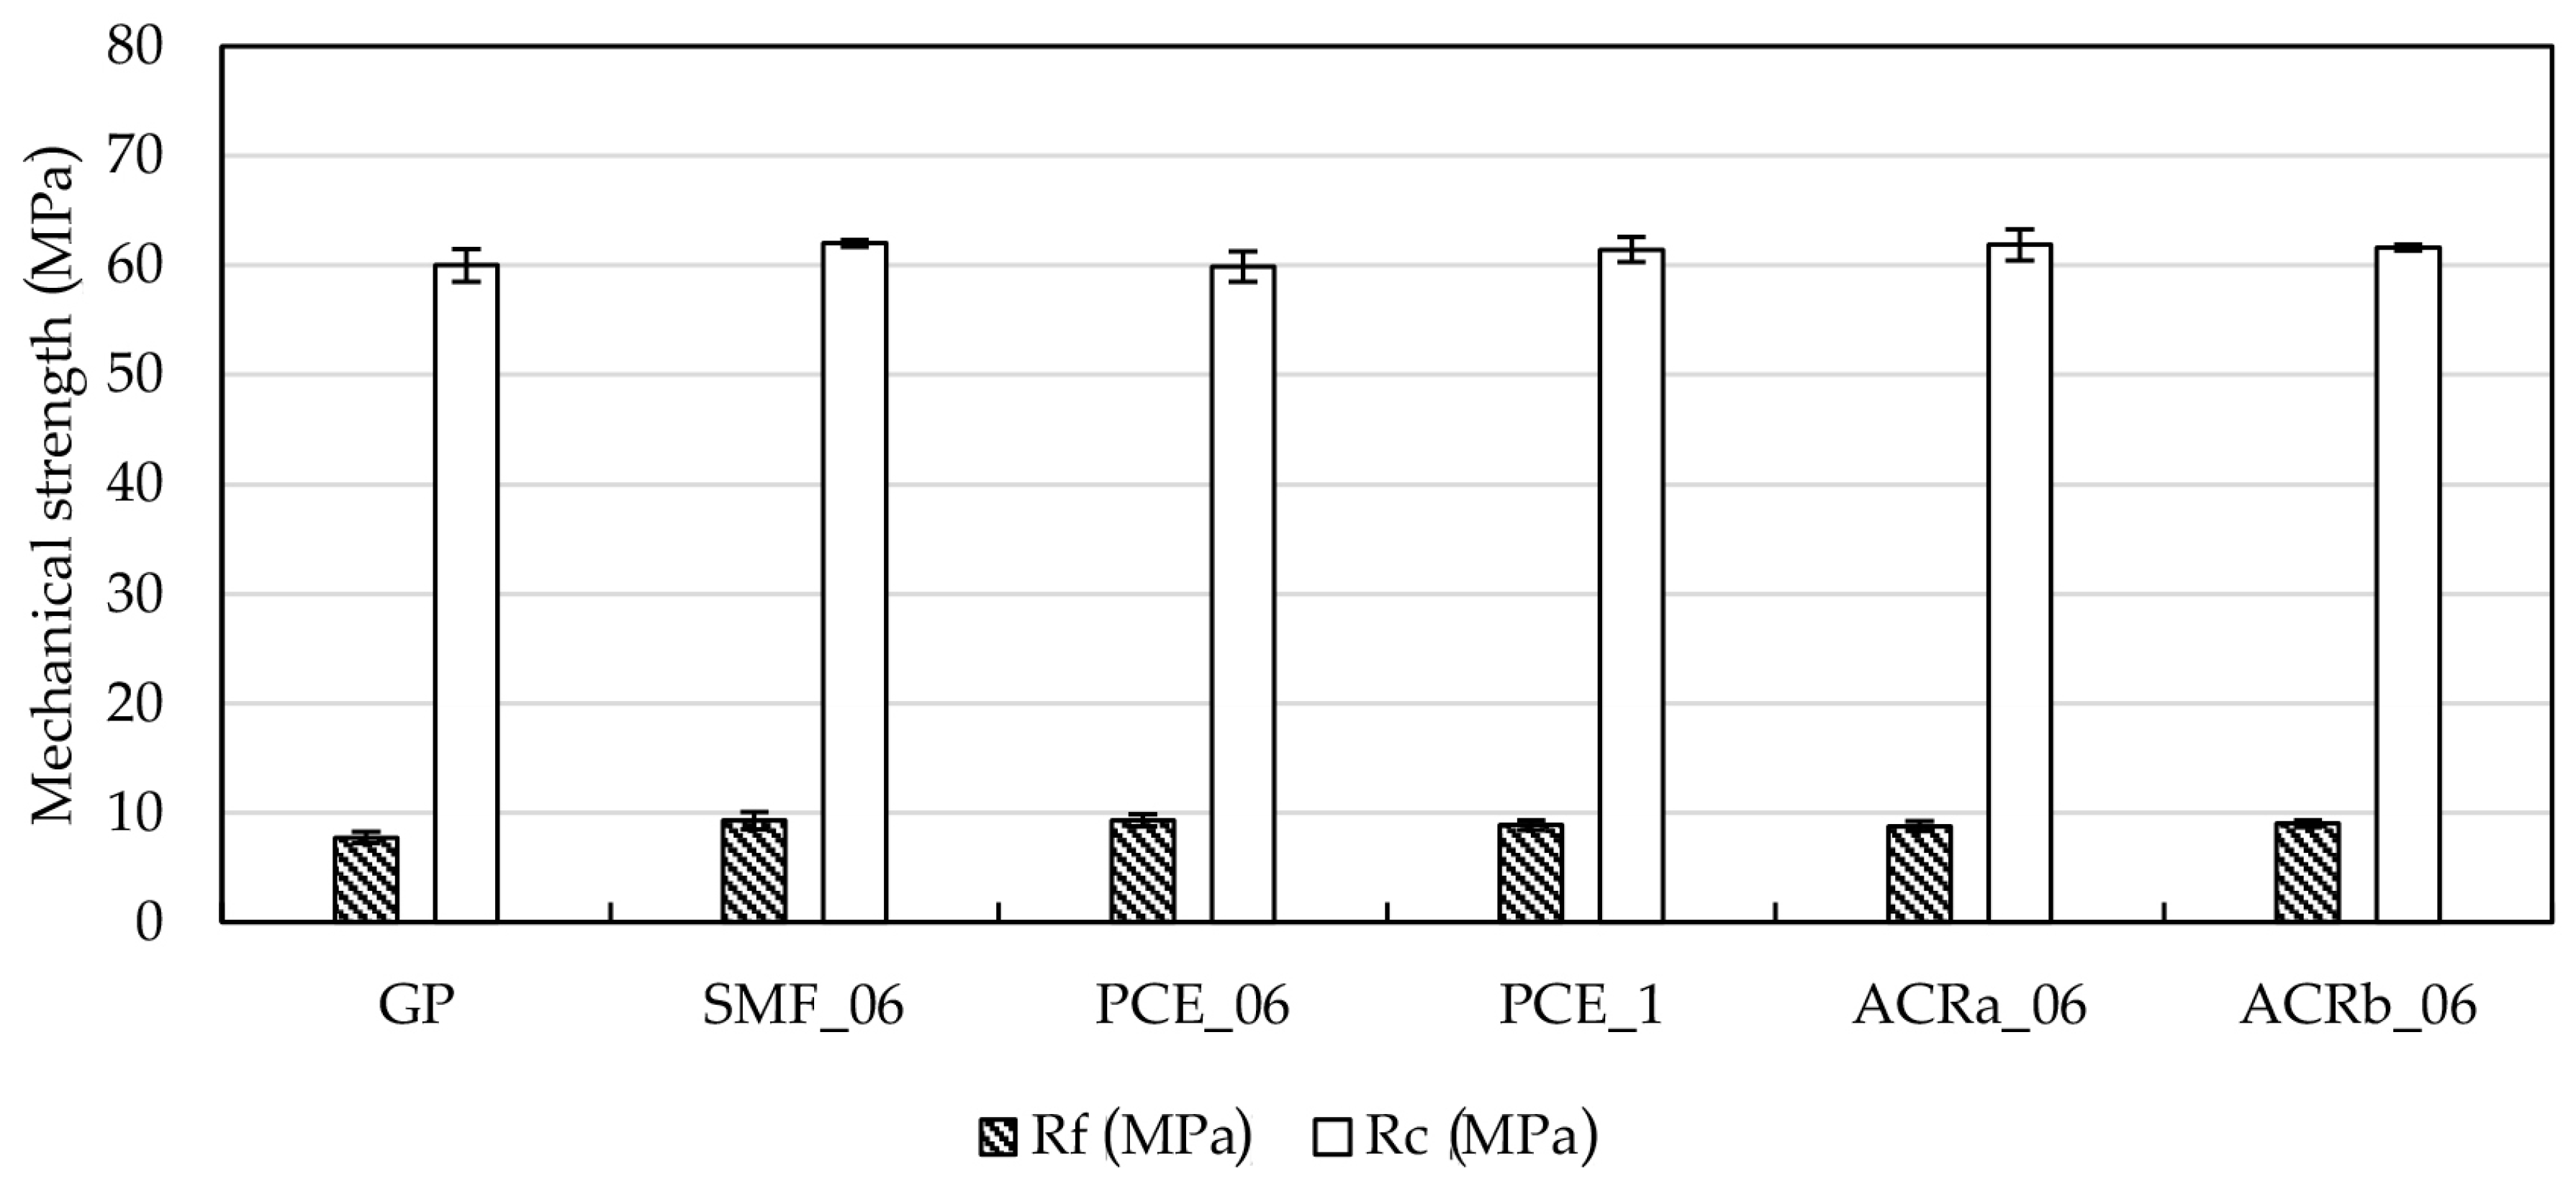
3.4. Mechanical Properties
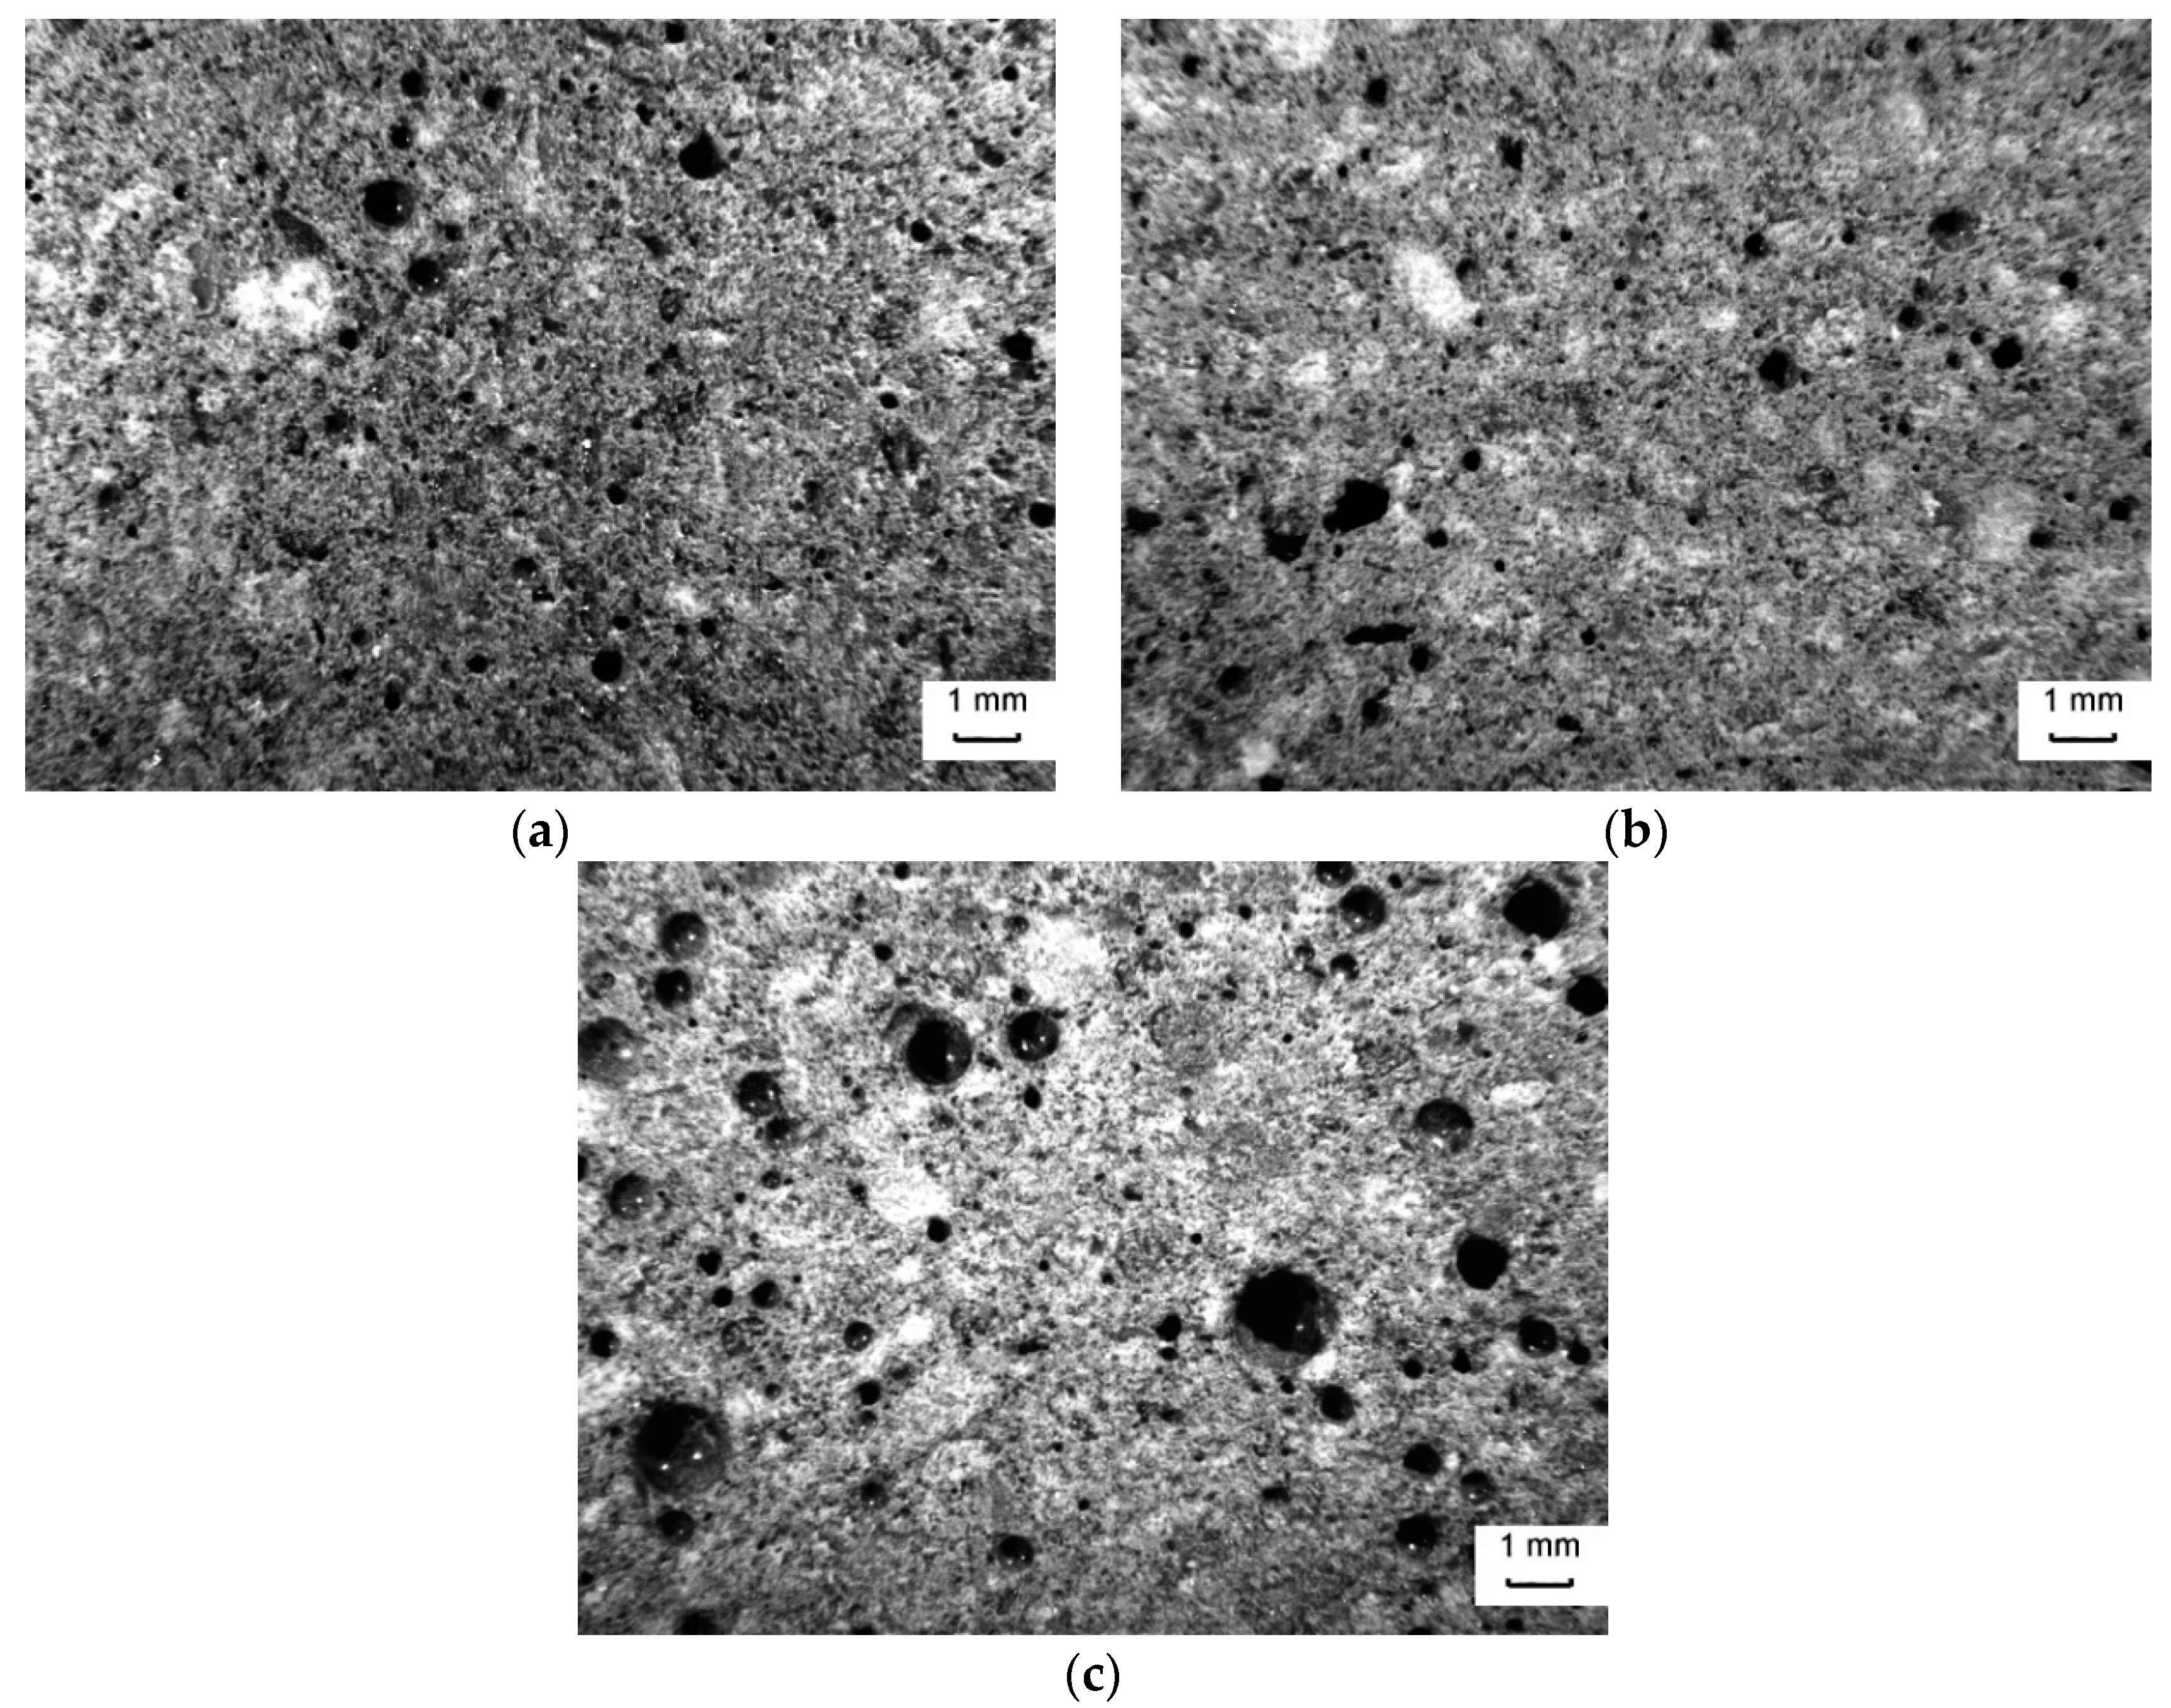
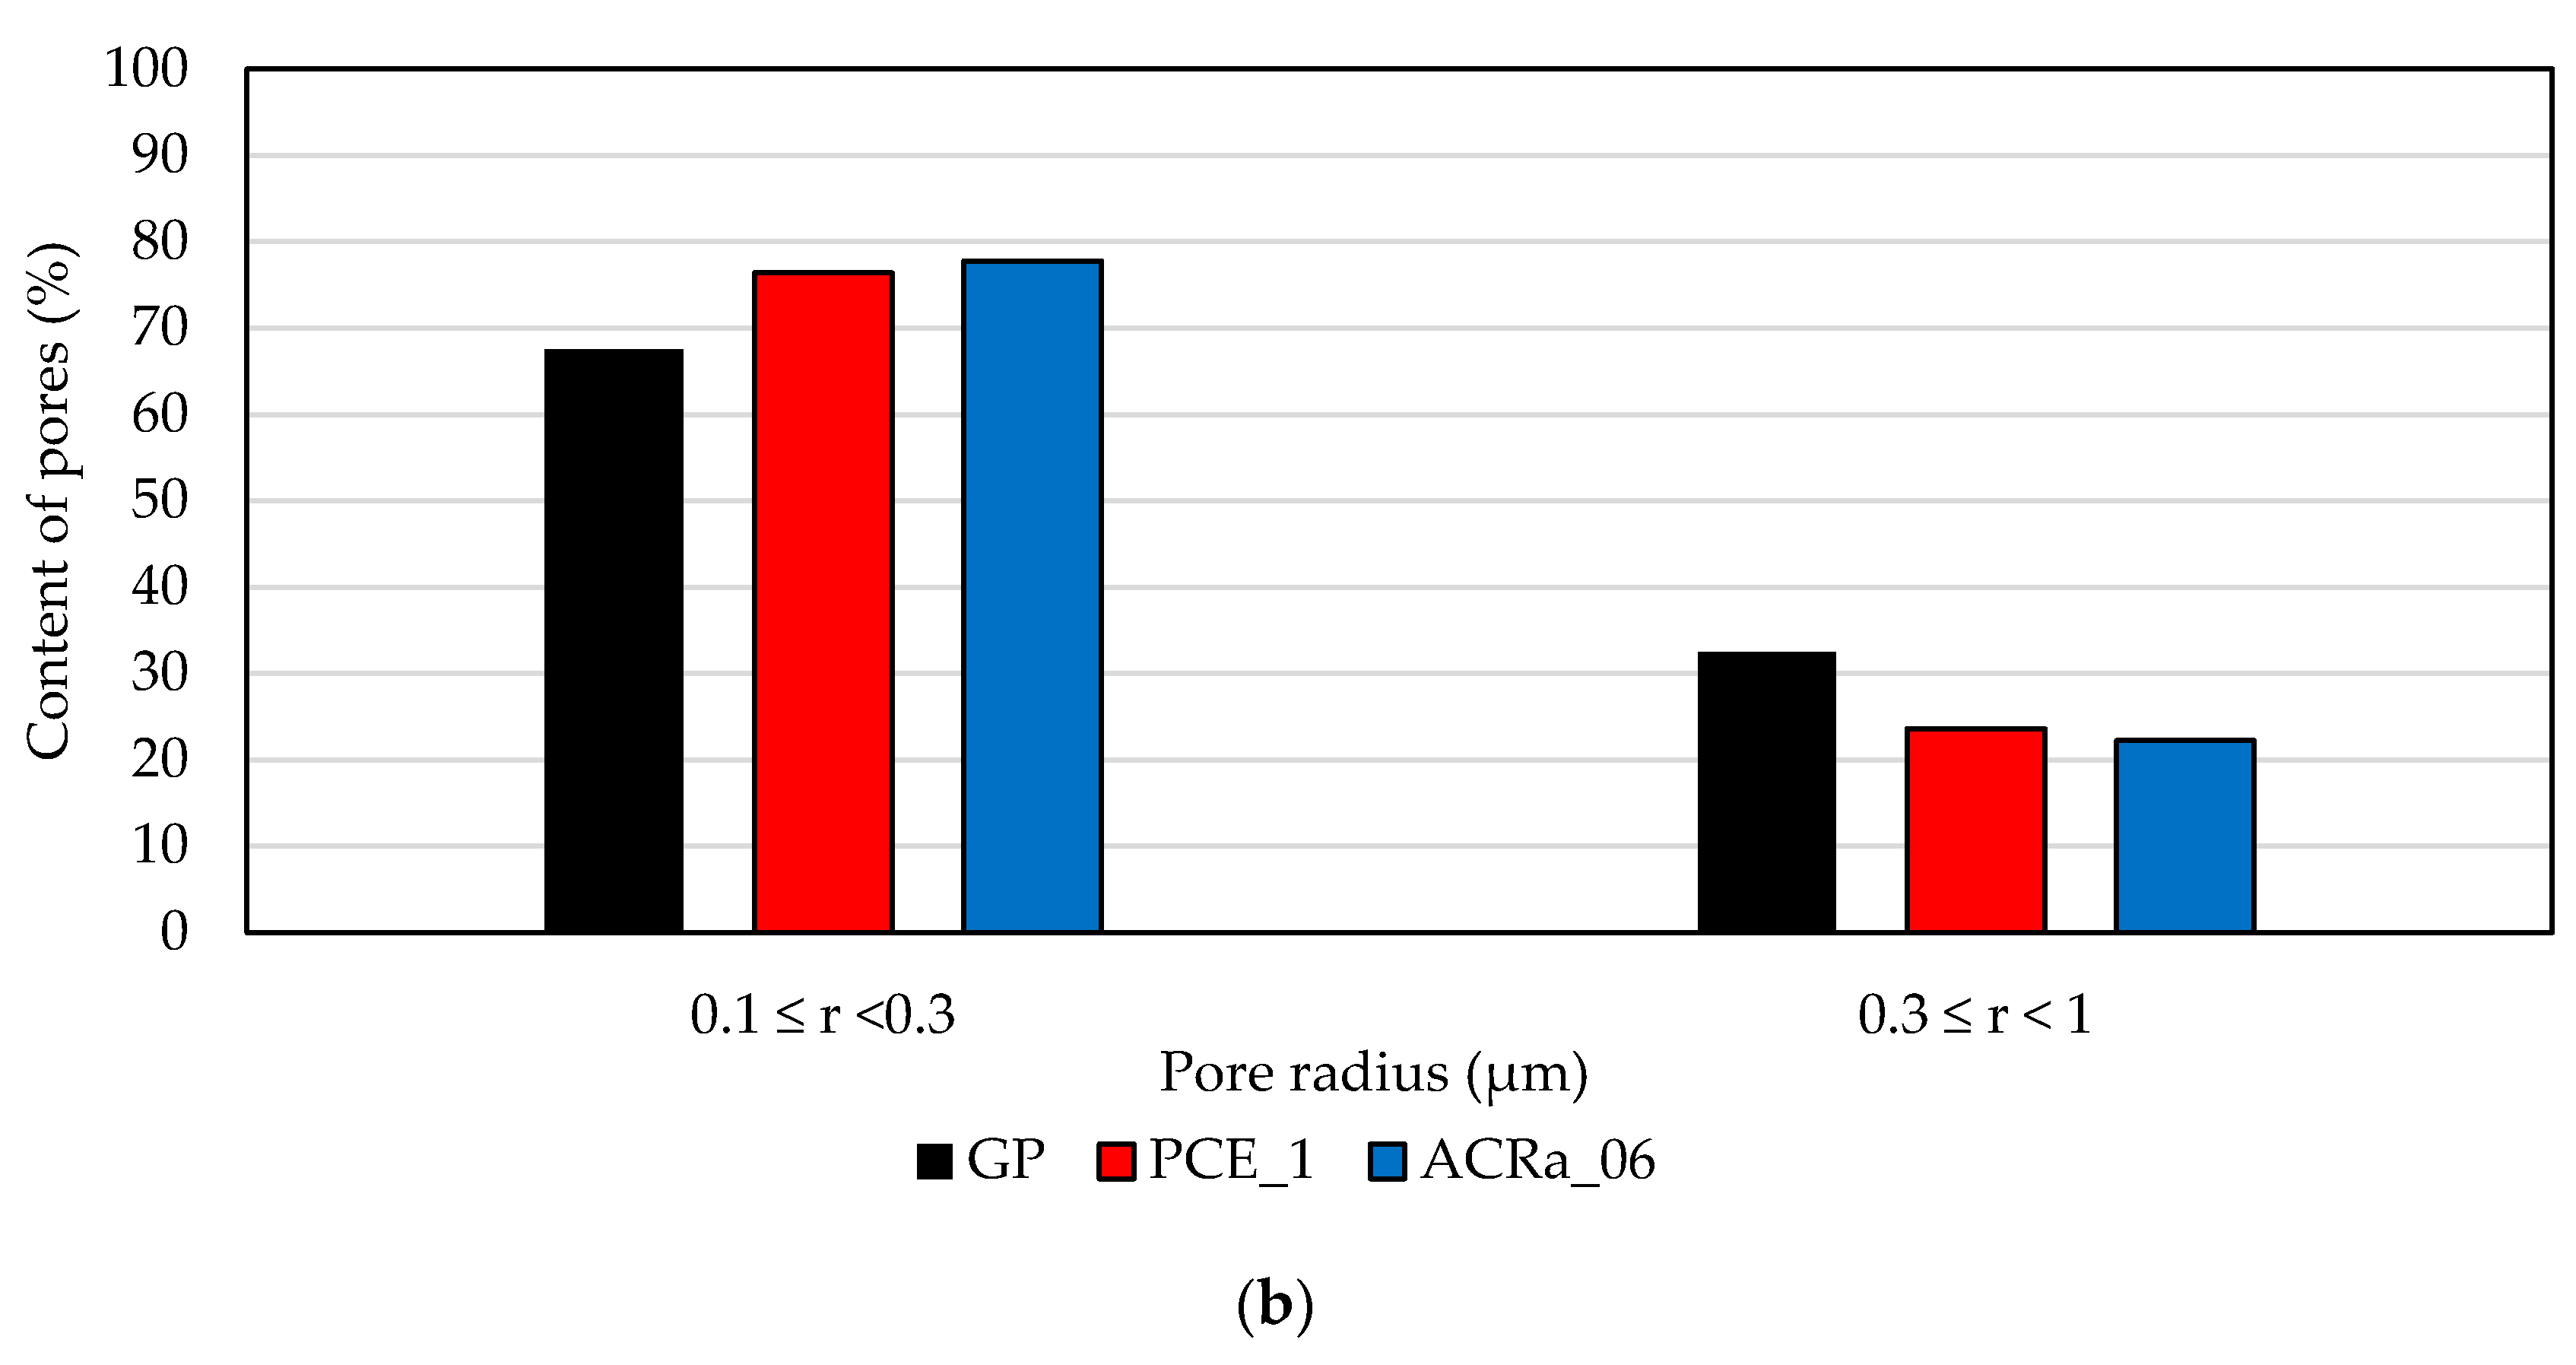
3.5. Microstructural Characterization
4. Discussion
5. Conclusions
- modified acrylic and polycarboxylic ether-based superplasticizers show the highest efficacy in improving the workability performances of carbon fly ash geopolymer mixtures. In particular, the best results are obtained by using a PCE-based superplasticizer in the amount of 1.0 wt. % by mass of the solid precursor;
- both these investigated superplasticizers, belonging to the last generation of admixtures, provide a satisfying workability improvement in the geopolymer mixtures without increasing the air content at the fresh state and affecting the mechanical properties developed during room temperature curing;
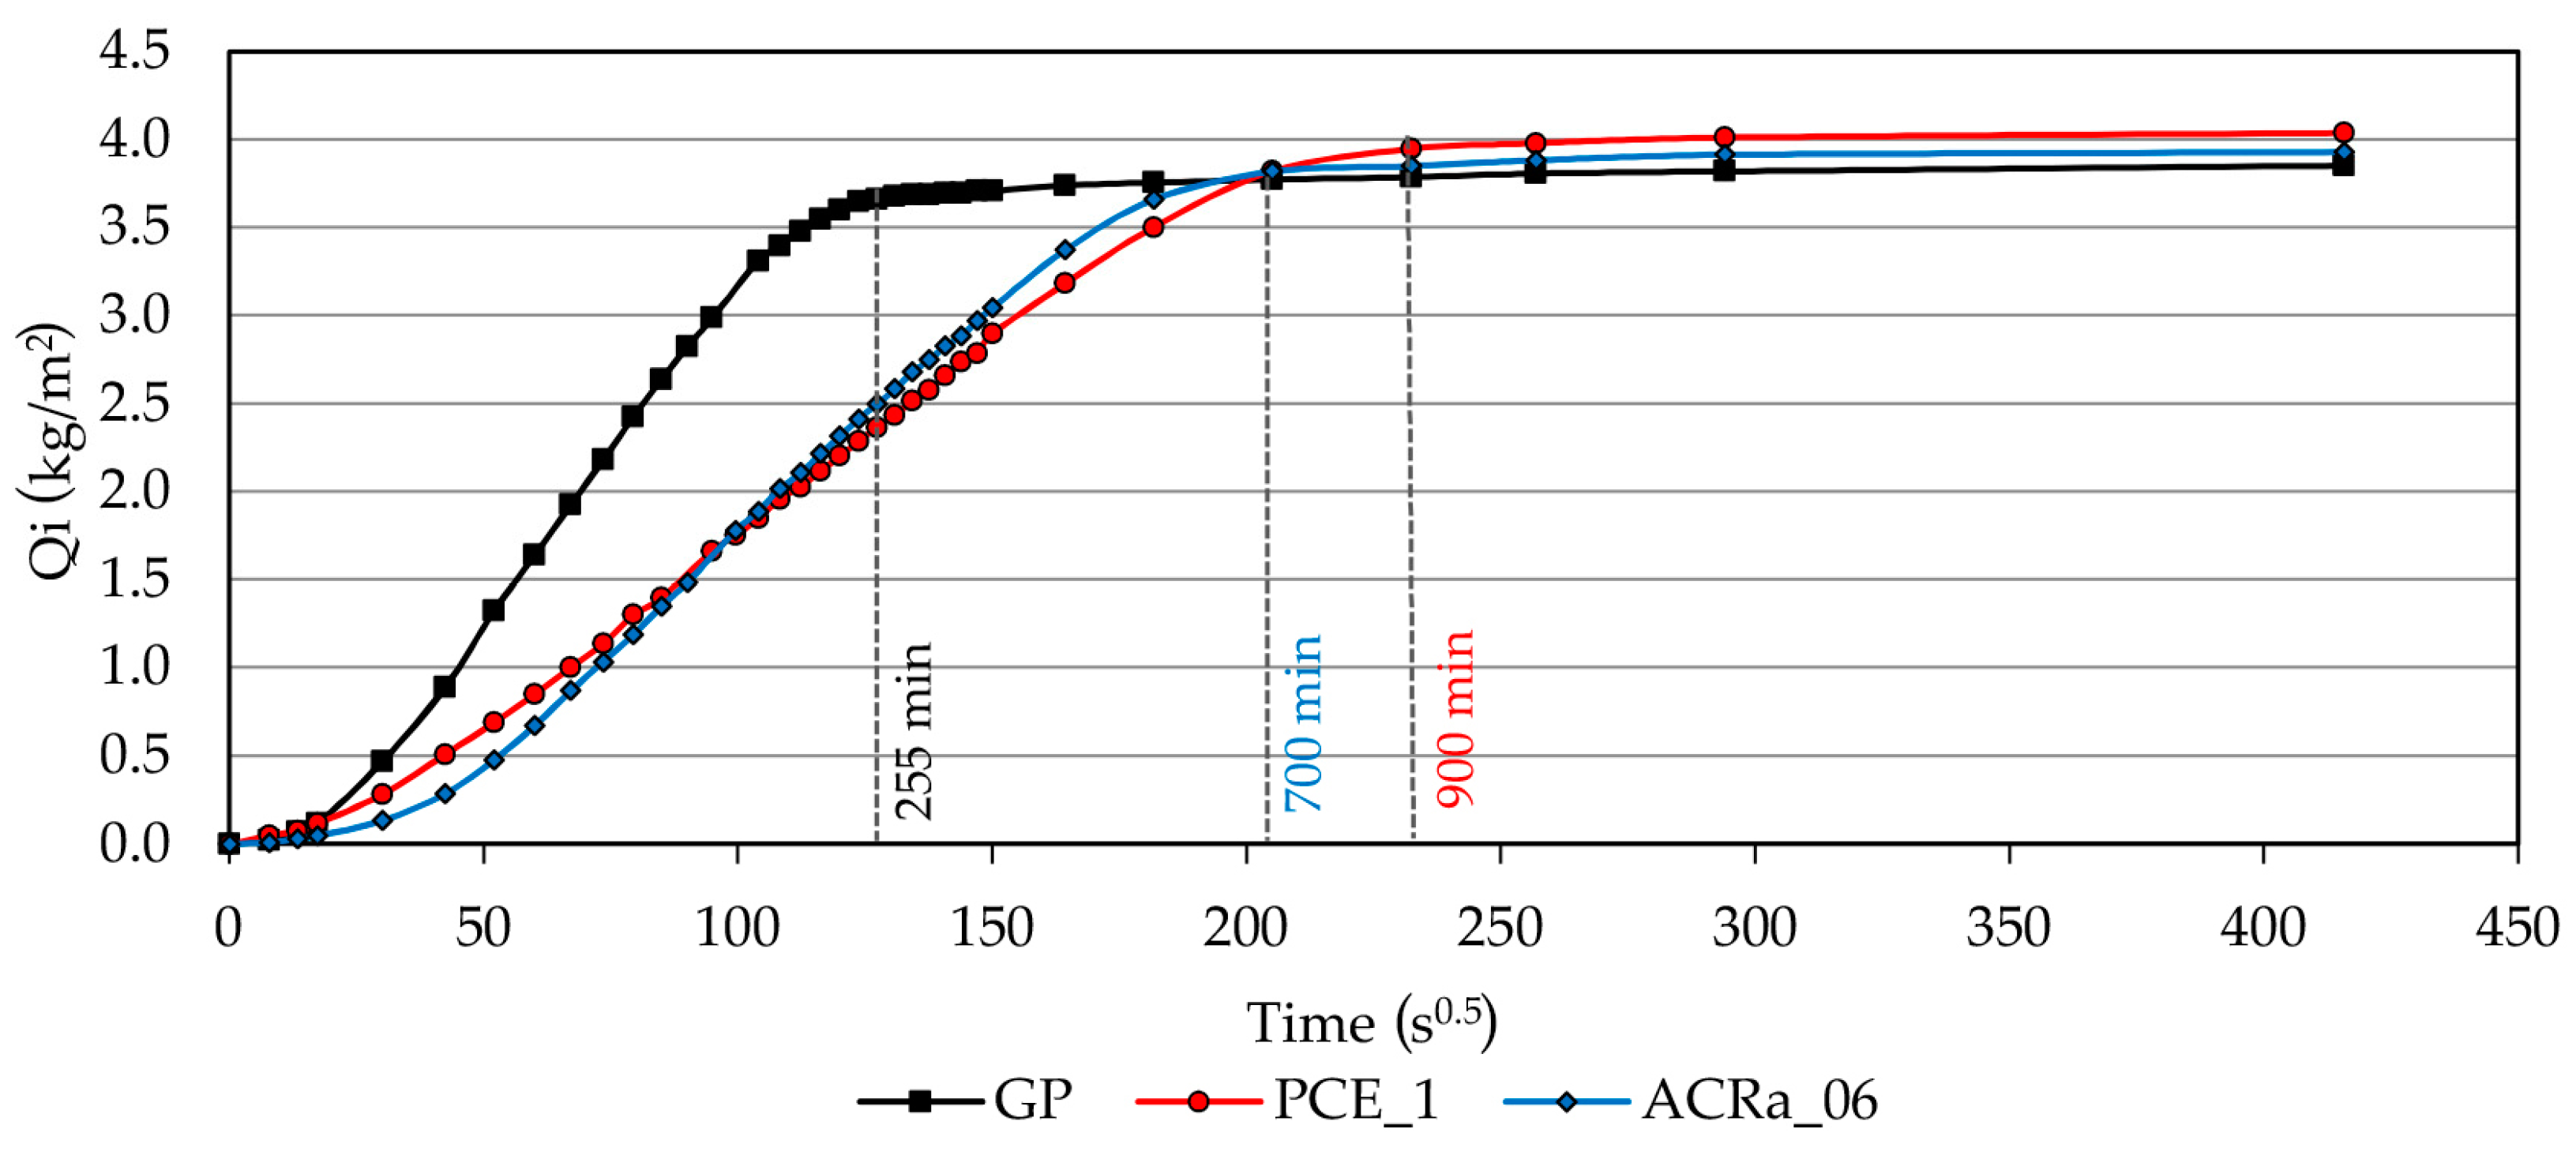
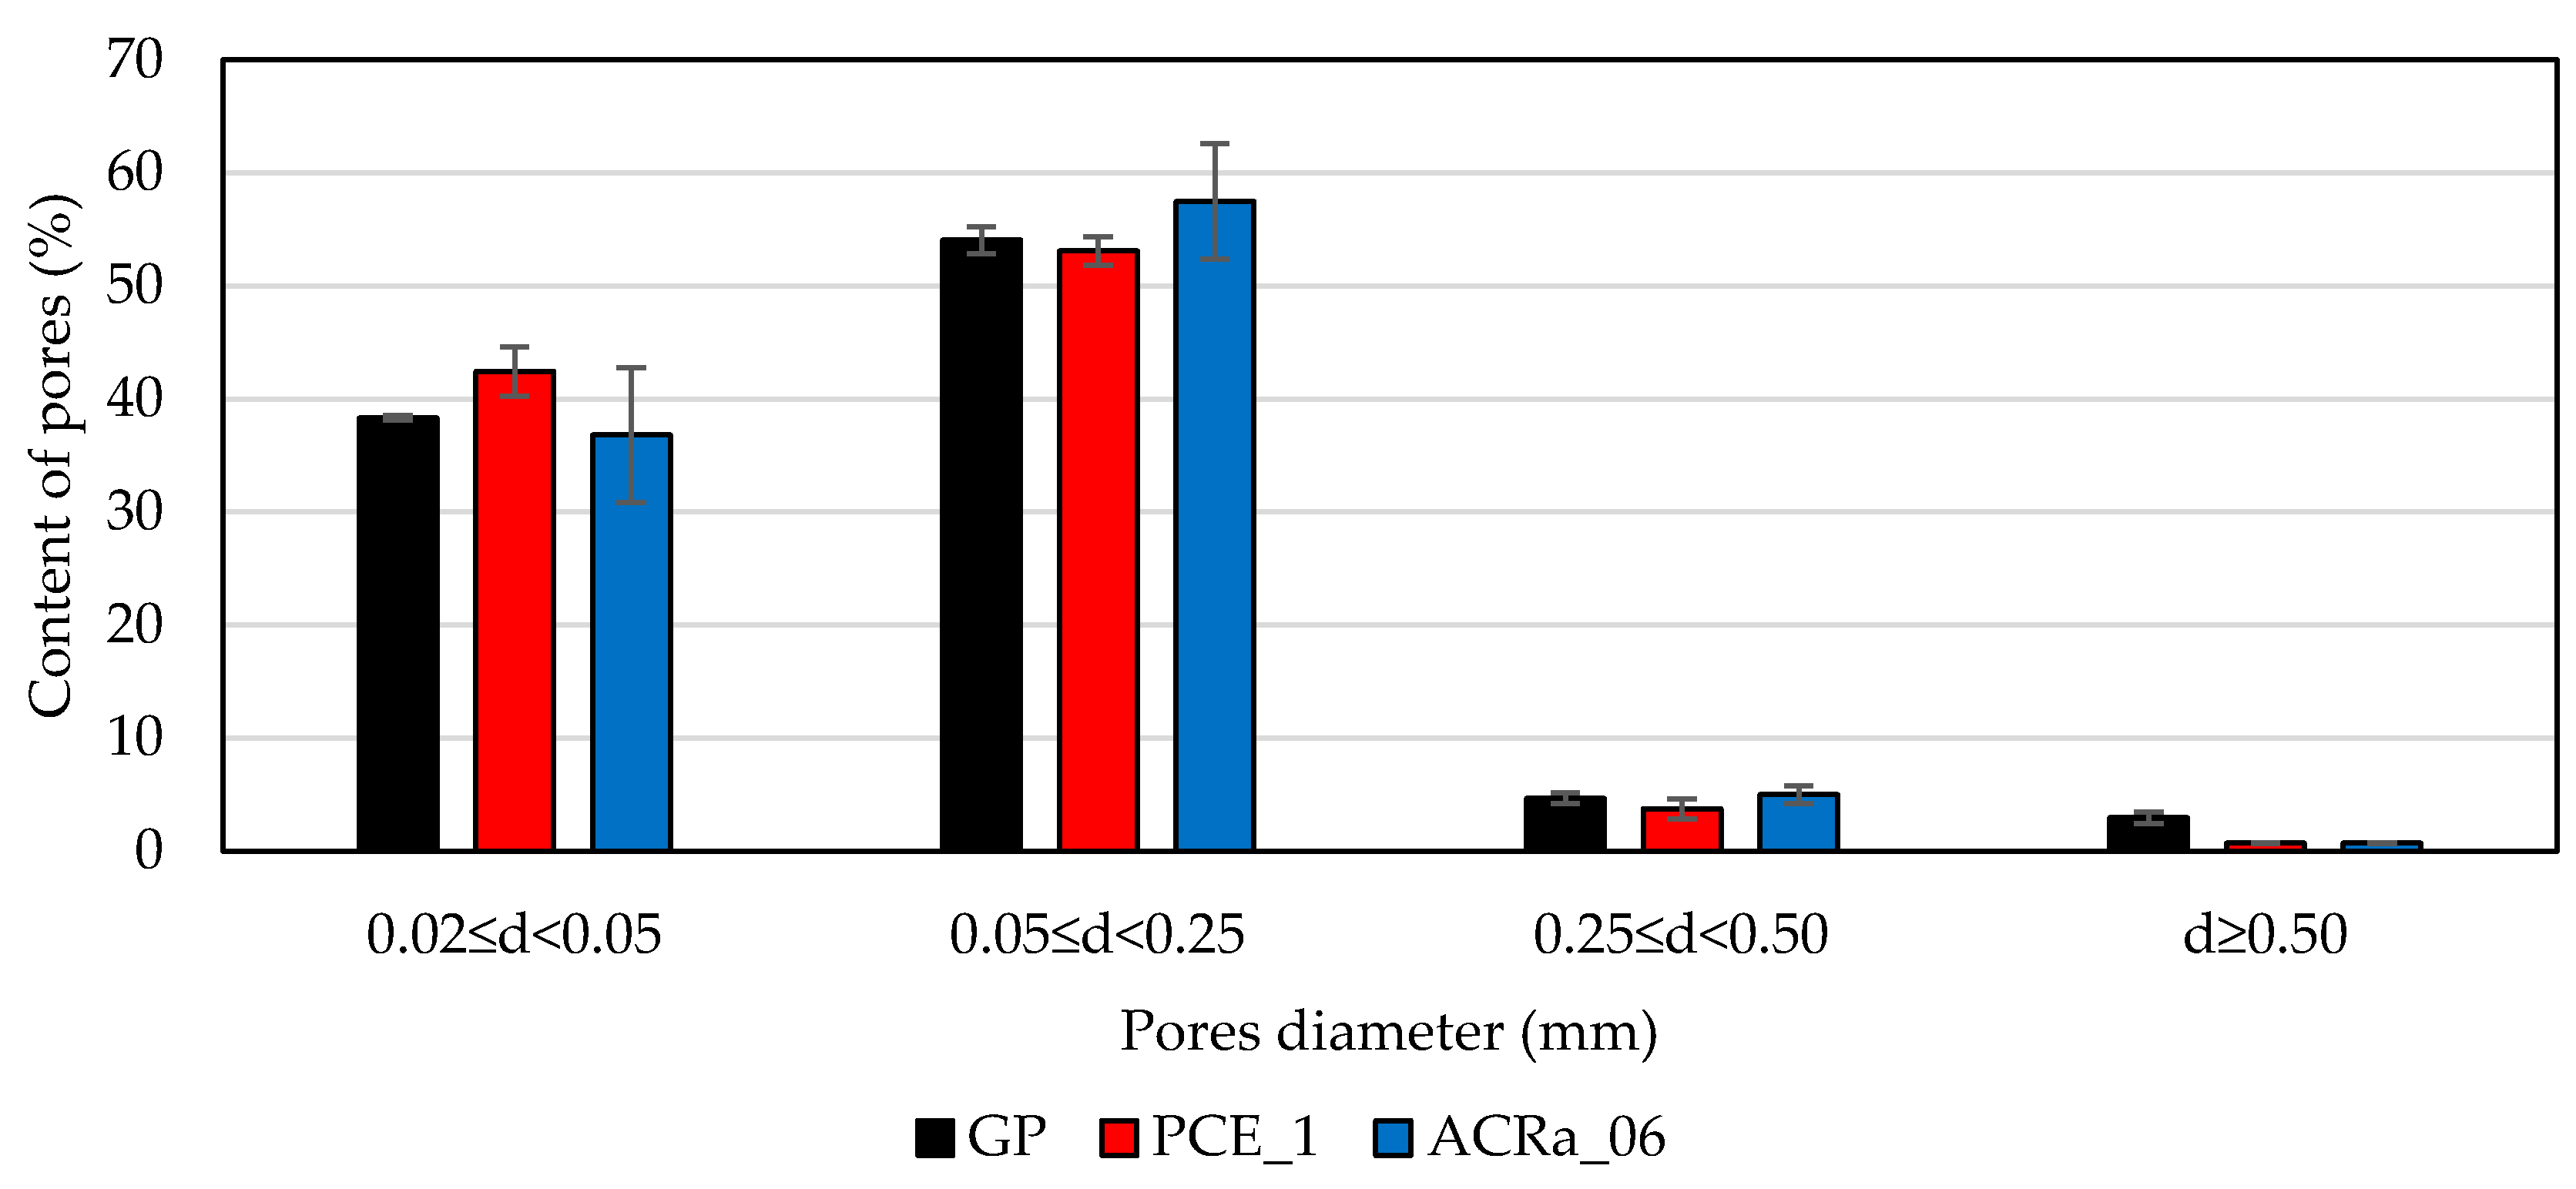
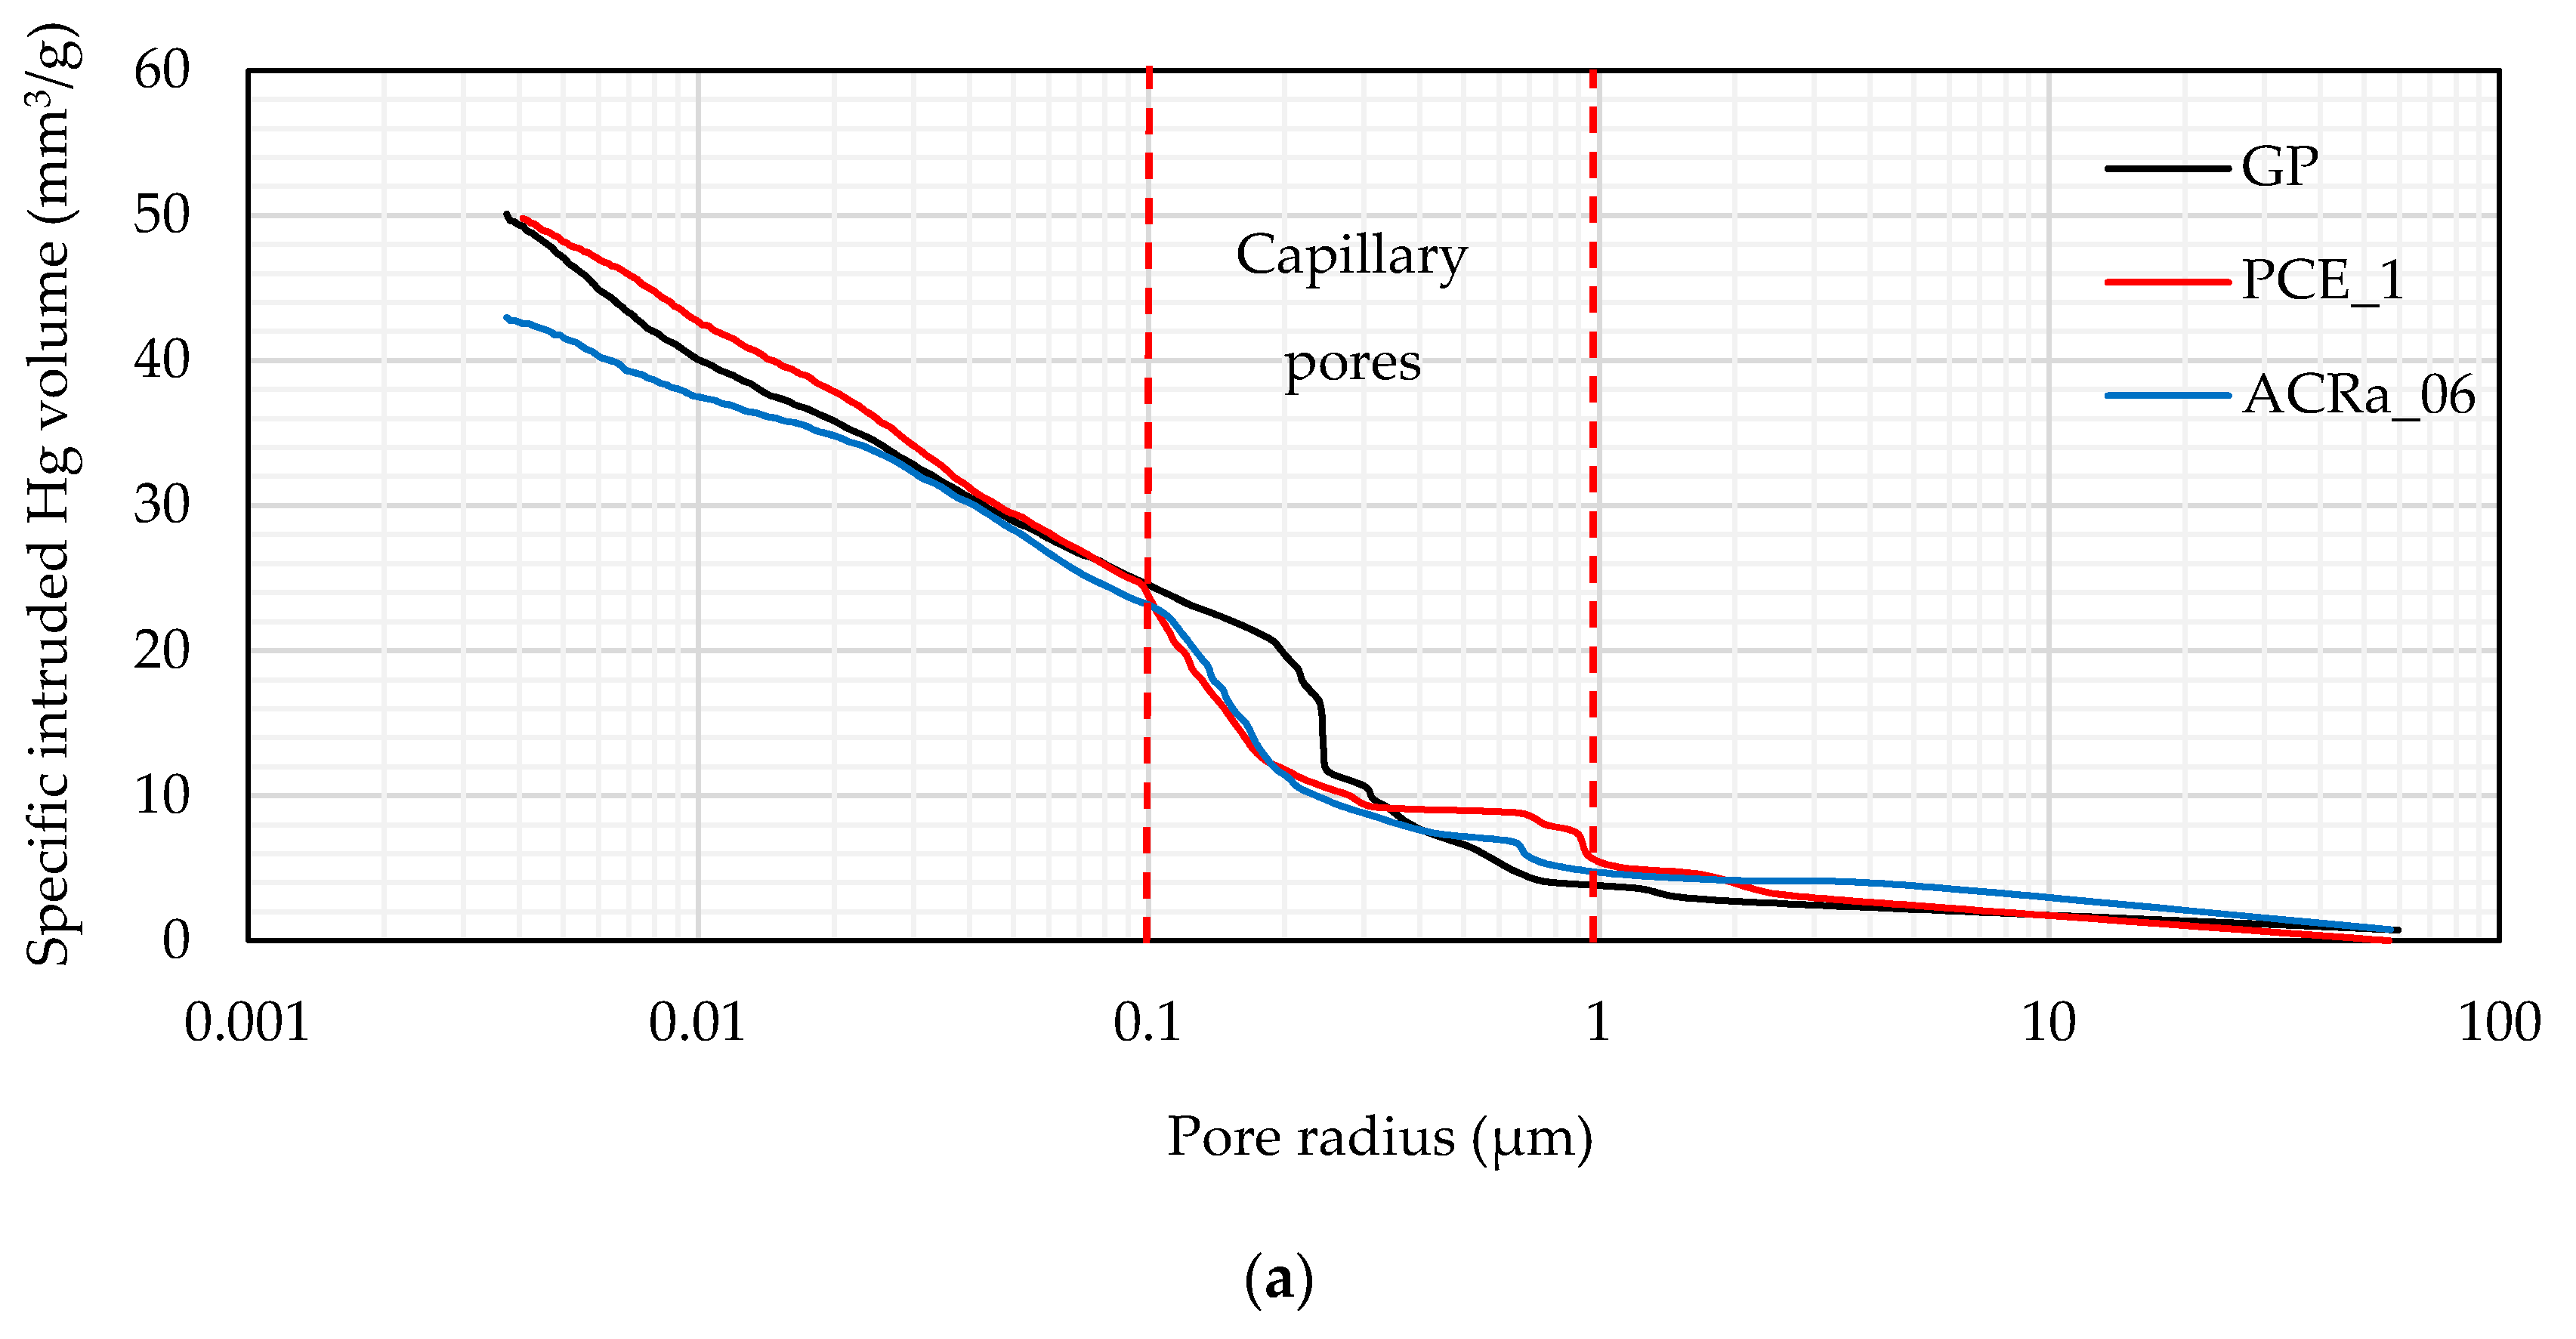
- modified acrylic and polycarboxylic ether-based superplasticizers allow obtaining geopolymer mortars with a more compact microstructure thanks to the improvement in workability which facilitates the entrapped air evacuation and to the refinement of the average pore radius. As a consequence, capillary test shows a slower water saturation time than the reference mortar one in which no superplasticizer was added.
Author Contributions
Conflicts of Interest
References
- Rixom, R.; Mailvaganam, N. Chemical Admixtures for Concrete, 3rd ed.; E & FN Spon: London, UK, 1999. [Google Scholar]
- Jolicoeur, C.; Simard, M.A. Chemical admixture-cement interactions: Phenomenology and physico-chemical concepts. Cem. Concr. Compos. 1998, 20, 87–101. [Google Scholar] [CrossRef]
- Collepardi, M. Admixtures used to enhance placing characteristics of concrete. Cem. Concr. Compos. 1998, 20, 103–112. [Google Scholar] [CrossRef]
- Winnefeld, F.; Becker, S.; Pakusch, J.; Götz, T. Effects of the molecular architecture of comb-shaped superplasticizers on their performance in cementitious systems. Cem. Concr. Compos. 2007, 29, 251–262. [Google Scholar] [CrossRef]
- Hanehara, S.; Yamada, K. Interaction between cement and chemical admixture from the point of cement hydration, absorption behaviour of admixture, and paste rheology. Cem. Concr. Res. 1999, 29, 1159–1165. [Google Scholar] [CrossRef]
- Ramachandran, V.S. Concrete Admixtures Handbook-Properties, Science, and Technology, 2nd ed.; Noyes Publications: Park Ridge, NJ, USA, 1996. [Google Scholar]
- Hasanbeigi, A.; Price, L.; Lin, E. Emerging energy-efficiency and CO2 Emission-reduction technologies for cement and concrete production: A technical review. Renew. Sustain. Energy Rev. 2012, 16, 6220–6238. [Google Scholar] [CrossRef]
- Davidovits, J. Geopolymers inorganic polymeric new material. J. Therm. Anal. 1991, 37, 1633–1656. [Google Scholar] [CrossRef]
- Van Deventer, J.S.J.; Provis, J.L.; Duxson, P.; Brice, D.G. Chemical research and climate change as drivers in the commercial adoption of alkali activated materials. Waste Biomass Valor 2010, 1, 145–155. [Google Scholar] [CrossRef]
- Imbabi, M.S.; Carrigan, C.; McKenna, S. Trends and developments in green cement and concrete technology. Int. J. Sustain. Built Environ. 2012, 1, 194–216. [Google Scholar] [CrossRef]
- Duxson, P.; Provis, J.L.; Lukey, G.C.; van Deventer, J.S.J. The role of inorganic polymer technology in the development of “green Concrete”. Cem. Concr. Res. 2007, 37, 1590–1597. [Google Scholar] [CrossRef]
- McLellan, B.C.; Williams, R.P.; Lay, J.; van Riessen, A.; Corder, G.D. Costs and carbon emissions for geopolymer pastes in comparison to ordinary portland cement. J. Clean. Prod. 2011, 19, 1080–1090. [Google Scholar] [CrossRef]
- Turner, L.K.; Collins, F.G. Carbon Dioxide Equivalent (CO2-e) Emissions: A Comparison between Geopolymer and OPC Cement Concrete. Constr. Build. Mater. 2013, 43, 125–130. [Google Scholar] [CrossRef]
- Ferone, C.; Colangelo, F.; Messina, F.; Santoro, L.; Cioffi, R. Recycling of pre-washed municipal solid waste incinerator fly ash in the manufacturing of low temperature setting geopolymer materials. Materials 2013, 6, 3420–3437. [Google Scholar] [CrossRef]
- Habert, G.; d’Espinose de Lacaillerie, J.B.; Roussel, N. An environmental evaluation of geopolymer based concrete production: Reviewing current research trends. J. Clean. Prod. 2011, 19, 1229–1238. [Google Scholar] [CrossRef]
- Provis, J.L.; Brice, D.G.; Buchwald, A.; Duxson, P.; Kavalerova, E.; Krivenko, P.V.; Shi, C.; van Deventer, J.S.J.; Wiercx, J.A.L.M. Demonstration projects and applications in building and civil infrastructure. In Alkali-Activated Materials: State-of-the-Art Report RILEM TC 224-AAM; Springer: Dordrecht, The Netherlands, 2014; Volume 13, pp. 309–338. [Google Scholar]
- Provis, J.L.; Palomo, A.; Shi, C. Advances in understanding alkali-activated materials. Cem. Concr. Res. 2015, 110–125. [Google Scholar] [CrossRef]
- Singh, B.; Ishwarya, G.; Gupta, M.; Bhattacharyya, S.K. Geopolymer concrete: A review of some recent developments. Constr. Build. Mater. 2015, 85, 78–90. [Google Scholar] [CrossRef]
- Hardjito, D.; Wallah, S.E.; Sumajouw, D.M.J.; Rangan, B.V. On the development of fly ash-based geopolymer concrete. Mater. J. 2004, 101, 467–472. [Google Scholar]
- Rickard, W.D.A.; van Riessen, A. Performance of Solid and Cellular structured fly ash geopolymers exposed to a simulated fire. Cem. Concr. Compos. 2014, 48, 75–82. [Google Scholar] [CrossRef]
- Zhao, R.; Sanjayan, J.G. Geopolymer and portland cement concretes in simulated fire. Mag. Concr. Res. 2011, 63, 163–173. [Google Scholar] [CrossRef]
- Masi, G.; Rickard, W.D.A.; Vickers, L.; Bignozzi, M.C.; van Riessen, A. A Comparison between different foaming methods for the synthesis of light weight geopolymers. Ceram. Int. 2014, 40, 13891–13902. [Google Scholar] [CrossRef]
- Zhang, Z.; Provis, J.L.; Reid, A.; Wang, H. Geopolymer foam concrete: An emerging material for sustainable construction. Constr. Build. Mater. 2014, 56, 113–127. [Google Scholar] [CrossRef]
- Bignozzi, M.C.; Manzi, S.; Natali, M.E.; Rickard, W.D.A.; van Riessen, A. Room Temperature alkali activation of fly ash: The effect of Na2O/SiO2 Ratio. Constr. Build. Mater. 2014, 69, 262–270. [Google Scholar] [CrossRef]
- Rickard, W.D.A.; Gluth, G.J.G.; Pistol, K. In-Situ thermo-mechanical testing of fly ash geopolymer concretes made with quartz and expanded clay aggregates. Cem. Concr. Res. 2016, 80, 33–43. [Google Scholar] [CrossRef]
- Rashad, A.M. A Comprehensive overview about the influence of different admixtures and additives on the properties of alkali-activated fly ash. Mater. Des. 2014, 53, 1005–1025. [Google Scholar] [CrossRef]
- Criado, M.; Palomo, A.; Fernández-Jiménez, A.; Banfill, P.F.G. Alkali activated fly ash: Effect of admixtures on paste rheology. Rheol. Acta 2009, 48, 447–455. [Google Scholar] [CrossRef]
- Laskar, A.I.; Bhattacharjee, R. Effect of Plasticizer and superplasticizer on rheology of fly-ash-based geopolymer concrete. ACI Mater. J. 2013, 110, 513–518. [Google Scholar]
- Nematollahi, B.; Sanjayan, J. Effect of different superplasticizers and activator combinations on workability and strength of fly ash based geopolymer. Mater. Des. 2014, 57, 667–672. [Google Scholar] [CrossRef]
- Palacios, M.; Puertas, F. Effect of Superplasticizer and shrinkage-reducing admixtures on alkali-activated slag pastes and mortars. Cem. Concr. Res. 2005, 35, 1358–1367. [Google Scholar] [CrossRef]
- Nematollahi, B.; Sanjayan, J. Efficacy of available superplasticizers on geopolymers. Res. J. Appl. Sci. Eng. Technol. 2014, 7, 1278–1282. [Google Scholar]
- Łaźniewska-Piekarczyk, B. The methodology for assessing the impact of new generation superplasticizers on air content in self-compacting concrete. Constr. Build. Mater. 2014, 53, 488–502. [Google Scholar] [CrossRef]
- Khatib, J.M.; Mangat, P.S. Influence of superplasticizer and curing on porosity and pore structure of cement paste. Cem. Concr. Compos. 1999, 21, 431–437. [Google Scholar] [CrossRef]
- EN 450-1, Fly Ash for Concrete. Definition, Specifications and Conformity Criteria; BSI: London, UK, 2012.
- Natali, M.E.; White, C.E.; Bignozzi, M.C. Elucidating the atomic structures of different sources of fly ash using X-ray and neutron PDF analysis. Fuel 2016, 177, 148–156. [Google Scholar] [CrossRef]
- EN 196-1, Methods of Testing Cement—Part 1: Determination of Strength; BSI: London, UK, 2005.
- Carabba, L.; Manzi, S.; Bignozzi, M.C. Fly Ash Geopolymers: Effect of Admixtures on Fresh and Hardened Properties. In Proceedings of the 1st International Workshop on Durability and Sustainability of Concrete Structures, DSCS 2015, Bologna, Italy, 1–3 October 2015; American Concrete Institute, ACI Special Publication: Farmington Hills, MI, USA, 2015; Volume 305, pp. 28.1–28.6. [Google Scholar]
- Koehler, E.P.; Fowler, D.W. Summary of concrete workability test methods. Summ. Concr. Workabil. Test Methods Res. Rep. 105-1 2016, 70. [Google Scholar]
- EN 1015-3, Methods of Test for Mortar for Masonry—Part 3: Determination of Consistence of Fresh Mortar (by Flow Table); BSI: London, UK, 2007.
- EN 1015-7, Methods of Test for Mortar for Masonry. Determination of Air Content of Fresh Morta; BSI: London, UK, 1999.
- Washburn, E.W. The Dynamics of Capillary Flow. Phys. Rev. 1921, 17, 273–283. [Google Scholar] [CrossRef]
- EN 15801, Conservation of Cultural Property. Test Methods. Determination of Water Absorption by Capillarity; BSI: London, UK, 2009.
- Puertas, F.; Palacios, M.; Provis, J.L. Admixtures. In Alkali-Activated Materials: State-of-the-Art Report RILEM TC 224-AAM; Springer: Dordrecht, The Netherlands, 2014; Volume 13, pp. 145–156. [Google Scholar]
- Janowska-Renkas, E. The effect of superplasticizers’ chemical structure on their efficiency in cement pastes. Constr. Build. Mater. 2013, 38, 1204–1210. [Google Scholar] [CrossRef]
- Puertas, F.; Palomo, A.; Fernández-Jiménez, A.; Izquierdo, J.D.; Granizo, M.L. Effect of superplasticisers on the behaviour and properties of alkaline cements. Adv. Cem. Res. 2003, 15, 23–28. [Google Scholar] [CrossRef]
- Palacios, M.; Puertas, F. Stability of superplasticizer and shrinkage-reducing admixtures in high basic media. Mater. Constr. 2004, 54, 65–86. [Google Scholar]
- Pia, G.; Sassoni, E.; Franzoni, E.; Sanna, U. Predicting capillary absorption of porous stones by a procedure based on an intermingled fractal units model. Int. J. Eng. Sci. 2014, 82, 196–204. [Google Scholar] [CrossRef]
- Palomo, A.; Krivenko, P.; Garcia-Lodeiro, I.; Kavalerova, E.; Maltseva, O.; Fernández-Jiménez, A. A Review on alkaline activation: New analytical perspectives. Mater. Constr. 2014, 64. [Google Scholar] [CrossRef]
- Provis, J.L.; Bernal, S.A. Geopolymers and related alkali-activated materials. Annu. Rev. Mater. Res. 2014, 44, 299–327. [Google Scholar] [CrossRef]
- Collepardi, M. Chemical Admixtures Today. In Proceedings of the Second International Symposium on Concrete Tecnology for Sustainable, Hyderabad, India, 27 February–3 March 2005; pp. 527–541.
- Kashani, A.; Provis, J.L.; Xu, J.; Kilcullen, A.R.; Qiao, G.G.; van Deventer, J.S.J. Effect of molecular architecture of polycarboxylate ethers on plasticizing performance in alkali-activated slag paste. J. Mater. Sci. 2014, 49, 2761–2772. [Google Scholar] [CrossRef]
- Ma, Y.; Hu, J.; Ye, G. The Pore structure and permeability of alkali activated fly ash. Fuel 2013, 104, 771–780. [Google Scholar] [CrossRef]
- Lloyd, R.R.; Provis, J.L.; Smeaton, K.J.; van Deventer, J.S.J. Spatial distribution of pores in fly ash-based inorganic polymer gels visualised by wood’s metal intrusion. Microporous Mesoporous Mater. 2009, 126, 32–39. [Google Scholar] [CrossRef]
- Monticelli, C.; Natali, M.E.; Balbo, A.; Chiavari, C.; Zanotto, F.; Manzi, S.; Bignozzi, M.C. Corrosion behavior of steel in alkali-activated fly ash mortars in the light of their microstructural, mechanical and chemical characterization. Cem. Concr. Res. 2016, 80, 60–68. [Google Scholar] [CrossRef]
- Bernal, S.A.; Provis, J.L. Durability of alkali-activated materials: Progress and perspectives. J. Am. Ceram. Soc. 2014, 97, 997–1008. [Google Scholar] [CrossRef]
- Monticelli, C.; Natali, M.E.; Balbo, A.; Chiavari, C.; Zanotto, F.; Manzi, S.; Bignozzi, M.C. A study on the corrosion of reinforcing bars in alkali-activated fly ash mortars under wet and dry exposures to chloride solutions. Cem. Concr. Res. 2016, 87, 53–63. [Google Scholar] [CrossRef]


| Chemical Compositions (wt. %) | |
|---|---|
| SiO2 | 49.37 |
| Al2O3 | 29.23 |
| Fe2O3 | 2.71 |
| CaO | 6.63 |
| MgO | 1.05 |
| SO3 | 0.33 |
| Na2O | <0.05 |
| K2O | 0.60 |
| LOI | 3.28 |
| Label | Chemical Structure | Solid Content (%) | Appearance Color | Density (g/cm3) |
|---|---|---|---|---|
| LGa | Lignosulphonate | 48 | Brown liquid | 1.20 |
| LGb | Sodium lignosulphonate | 50 | Brown liquid | 1.27 |
| SNF | Polynaphthalenmethan sulphonate | 100 | White powder | 0.55 |
| SMF | Sulphonated melamine | 100 | Brown powder | 0.80 |
| PCE | Polycarboxylic ether | 17 | Brown liquid | 1.04 |
| ACRa | Modified acrylic | 31 | Yellow liquid | 1.09 |
| ACRb | Acrylic acid copolymer | 21 | Yellow liquid | 1.08 |
| Mixture | Consistency (%) | Air Content (%) |
|---|---|---|
| GP | 73 ± 4 | 4.9 ± 0.5 |
| PCE_1 | 87 ± 3 | 4.9 ± 0.1 |
| ACRa_06 | 83 ± 5 | 5.1 ± 0.1 |
© 2016 by the authors; licensee MDPI, Basel, Switzerland. This article is an open access article distributed under the terms and conditions of the Creative Commons Attribution (CC-BY) license (http://creativecommons.org/licenses/by/4.0/).
Share and Cite
Carabba, L.; Manzi, S.; Bignozzi, M.C. Superplasticizer Addition to Carbon Fly Ash Geopolymers Activated at Room Temperature. Materials 2016, 9, 586. https://doi.org/10.3390/ma9070586
Carabba L, Manzi S, Bignozzi MC. Superplasticizer Addition to Carbon Fly Ash Geopolymers Activated at Room Temperature. Materials. 2016; 9(7):586. https://doi.org/10.3390/ma9070586
Chicago/Turabian StyleCarabba, Lorenza, Stefania Manzi, and Maria Chiara Bignozzi. 2016. "Superplasticizer Addition to Carbon Fly Ash Geopolymers Activated at Room Temperature" Materials 9, no. 7: 586. https://doi.org/10.3390/ma9070586
APA StyleCarabba, L., Manzi, S., & Bignozzi, M. C. (2016). Superplasticizer Addition to Carbon Fly Ash Geopolymers Activated at Room Temperature. Materials, 9(7), 586. https://doi.org/10.3390/ma9070586