
Experimental Study on Reaction Characteristics of PTFE/Ti/W Energetic Materials under Explosive Loading


Abstract
:
1. Introduction
2. Materials
2.1. Material Types
2.2. Preparation of PTFE (Polytetrafluoroethylene)/Ti/W Samples
- (1)
- First, the powders were mixed by a planetary mill machine (Chenli Powder Equipment Limited Company, Wuxi, China) for 24 h, with a small amount of absolute alcohol as a medium. Then, the powders were dried at 58 °C in a vacuum drying oven for approximately 24 h.
- (2)
- The dried powder mixtures were pressed at 200 MPa for approximately 3 min through cold uniaxial pressing. Cylindrical samples with a size of φ20 × 30 mm were prepared.
- (3)
- The samples were relaxed at ambient pressure and temperature for 24 h in order to remove trapped air and residual stress. The pressed samples were then sintered in an argon atmosphere with the temperature set at 380 °C. Figure 1 shows the temperature history of the sintering cycle, which can be described as follows: The oven temperature was raised up to 380 °C at a rate of about 50 °C/h. The samples were held at 380 °C for 6 h, after which the temperature was reduced at a rate of about 50 °C/h to 315 °C, where it was maintained for 4 h. The samples were then cooled to ambient temperature at an average cooling rate of 50 °C/h. The samples have little deformation during sintering due to the high melt viscosity of PTFE. The sintered PTFE/Ti/W samples are shown in Figure 2.
2.3. Microstructure of Composites
3. Experimental Methods
3.1. Experimental Technique
3.2. Test Methodology
4. Results
5. Discussion
5.1. Reaction Propagation under Explosive Loading
5.2. Theoretical Calculation of Shock Parameters
5.3. Analysis of Differences in Energy Release
6. Conclusions
- (1)
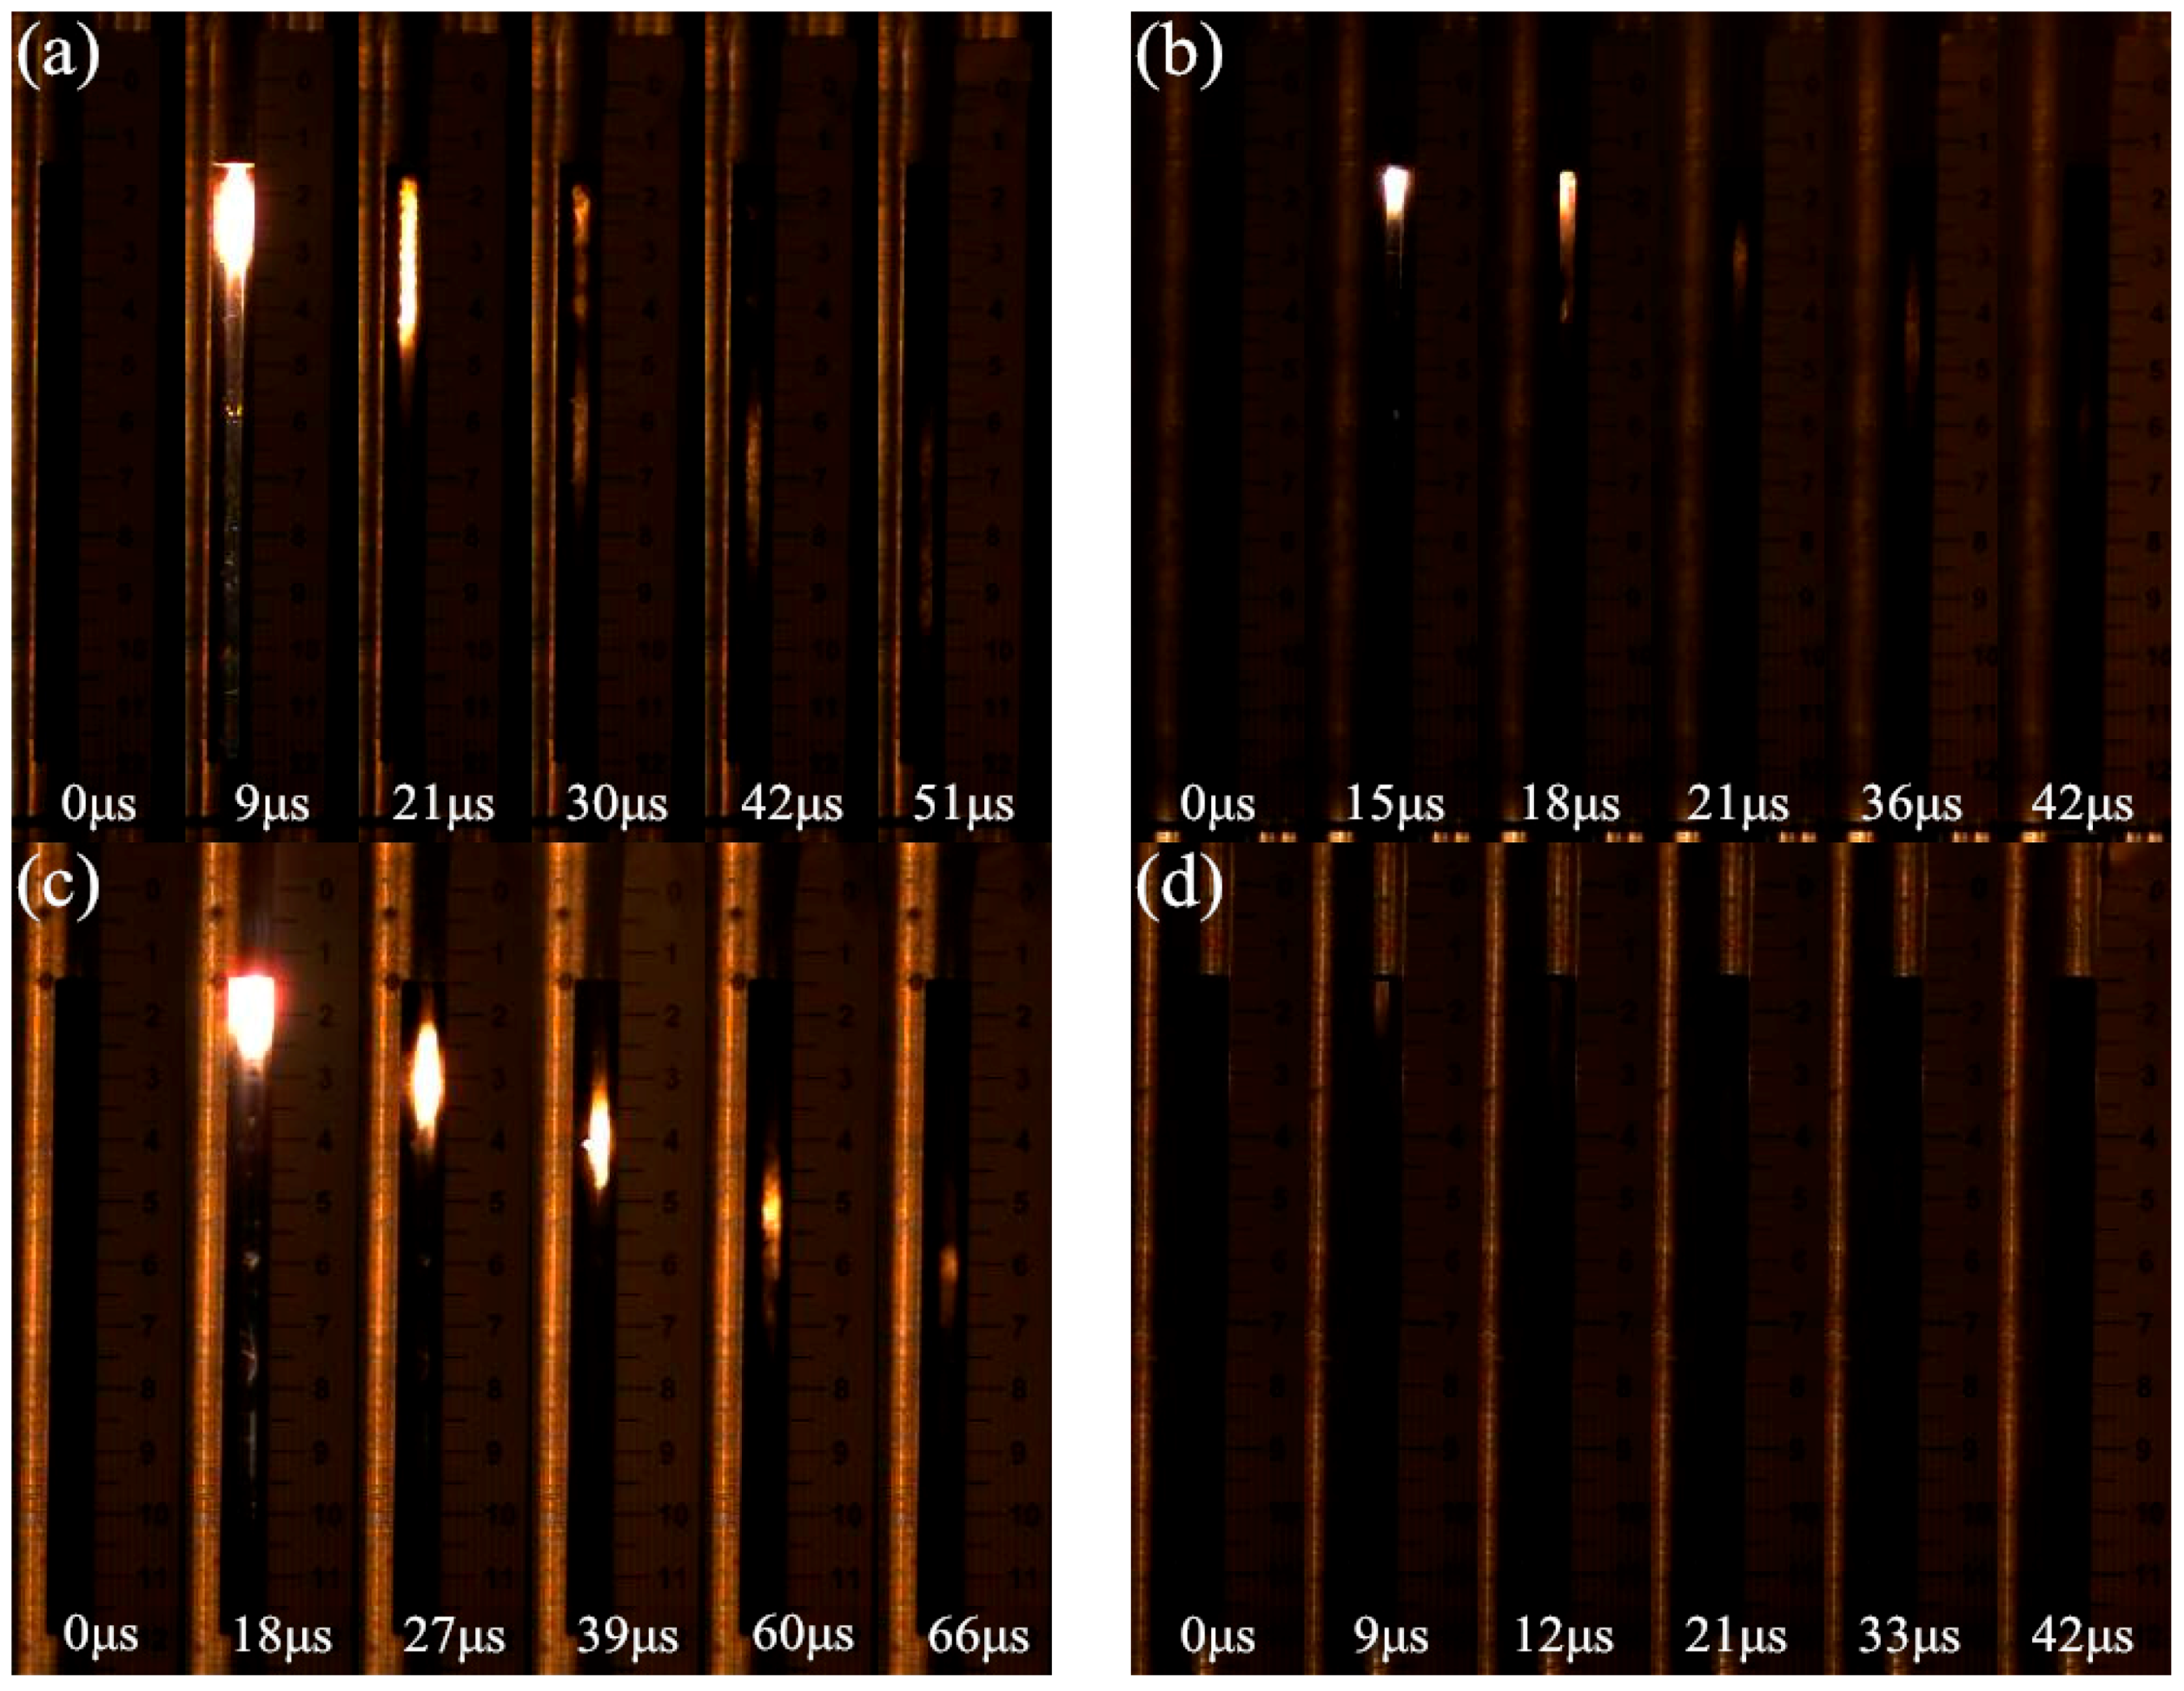
- The reaction propagation of PTFE/Ti/W energetic materials with low porosity under explosive loading is not self-sustained. Chemical reaction occurs shortly behind the shock front. The energy released during reaction is not sufficient to overcome the attenuation of the shock. The extent of the reaction depends on the shock energy, which is reflected by shock pressure and shock temperature. Owing to the attenuation of shock energy during propagation, the reaction extent decreases rapidly.
- (2)
- Propagation distance, W content, and porosity all influence the energy release of PTFE/Ti/W composites under explosive loading. As the propagation distance increases, the energy release shows a decreasing tendency due to temperature reductions. Moreover, the addition of inert W powder reduces the quantity of reactant as well as provides a heat sink, causing a decrease in overall energy release. Porosity plays a significant role in energy release: shock temperature increases as porosity improves, leading to remarkable increases in energy release.
- (3)
- The 70.7% TMD 16PTFE/8Ti/76W is more reactive under explosive loading, followed by 98.8% TMD 68PTFE/32Ti and 90.3% TMD 34PTFE/16Ti/50W.
Acknowledgments
Author Contributions
Conflicts of Interest
References
- Koch, E.C. Metal-Fluorocarbon Based Energetic Materials; Wiley-VCH Verlag Gmbh & Co. KGa A: Weinheim, Germany, 2012; pp. 6–17. [Google Scholar]
- Ge, C.; Dong, Y.; Maimaitituersun, W. Microscale Simulation on Mechanical Properties of Al/PTFE Composite Based on Real Microstructures. Materials 2016, 9, 590. [Google Scholar] [CrossRef]
- Committee on Advanced Energetic Materials and Manufacturing Technologies, National Research Council. Advanced Energetic Materials; National Academies Press: Washington, DC, USA, 2004; pp. 1–23. [Google Scholar]
- Zhang, X.F.; Zhao, X.N. Review on Multifunctional Energetic Structural Materials. Chin. J. Energ. Mater. 2009, 17, 731–739. [Google Scholar]
- Lee, R.J.; Mock, W., Jr.; Carney, J.R.; Holt, W.H.; Pangilinan, G.I.; Gamache, R.M.; Boteler, J.M.; Bohl, D.G.; Drotar, J.; Lawrence, G.W. Reactive Materials Studies. Shock Compression Condens. Matter 2005, 845, 169–174. [Google Scholar]
- McGregor, N.M.; Sutherland, G.T. Plate Impact Experiments on a Porous Teflon-Aluminum Mixture. Shock Compression Condens. Matter 2003, 706, 1001–1004. [Google Scholar]
- Ames, R.G. Energy Release Characteristics of Impact-Initiated Energetic Materials; Materials Research Society: Triangle Park, NC, USA, 2006. [Google Scholar]
- Mock, W., Jr.; Holt, W.H. Impact Initiation of Rods of Pressed Poltetrafluoroethylene (PTFE) and Aluminum Powders. Shock Compression Condense Matter 2005, 845, 1097–1100. [Google Scholar]
- Mock, W., Jr.; Drotar, J.T. Effect of Aluminum Particle Size on the Impact Initiation of Pressed PTFE/Al Composite Rods. Shock Compression Condens. Matter 2007, 955, 971–974. [Google Scholar]
- Shen, Y. The Chemical and Mechanical Behaviors of Polymer/Reactive Metal Systems under High Strain Rates. Ph.D. Thesis, Georgia Institute of Technology, Atlanta, GA, USA, 2012; pp. 59–109. [Google Scholar]
- Wang, L.; Liu, J.; Li, S.; Zhang, X. Investigation on reaction energy, mechanical behavior and impact insensitivity of W-PTFE-Al composites with different W percentage. Mater. Des. 2016, 92, 397–404. [Google Scholar] [CrossRef]
- Ames, R.G. Vented Chamber Calorimetry for Impact-Initiated Energetic Materials. In Proceedings of the 43rd AIAA Aerospace Sciences Meeting and Exhibit, Reno, NV, USA, 10–13 January 2005.
- Wang, H.; Zheng, Y.; Yu, Q.; Liu, Z.; Yu, W. Impact-induced initiation and energy release behavior of reactive materials. J. Appl. Phys. 2011, 110, 074904. [Google Scholar] [CrossRef]
- Zhang, X.F.; Shi, A.S.; Qiao, L.; Zhang, J.; Zhang, Y.G.; Guan, Z.W. Experimental study on impact-initiated characters of multifunctional energetic structural materials. J. Appl. Phys. 2013, 113, 083508. [Google Scholar] [CrossRef]
- Luo, P.; Wang, Z.; Jiang, C.; Mao, L.; Li, Q. Experimental study on impact-initiated characters of W/Zr energetic fragments. Mater. Des. 2015, 84, 72–78. [Google Scholar] [CrossRef]
- Dolgoborodov, A.Y.; Makhov, M.N.; Kolbanev, I.V.; StreletskiÏ, A.N.; Fortov, V.E. Detonation in an Aluminum-Teflon Mixture. JETP Lett. 2005, 81, 311–314. [Google Scholar] [CrossRef]
- Ames, R.G.; Waggener, S.S. Reaction Efficiencies for Impact-Initiated Energetic Materials. In Proceedings of the 32nd International Pyrotechnics Seminar, Karlsruhe, Germany, 28 June–1 July 2005.
- Eakins, D.E. Role of Heterogeneity in the Chemical and Mechanical Shock-Response of Nickel and Aluminum Powder Mixtures. Ph.D. Thesis, Georgia Institute of Technology, Atlanta, GA, USA, 2007; pp. 12–13. [Google Scholar]
- McQueen, R.; Marsh, S.; Taylor, J.; Fritz, J.; Carter, W. The Equation of State of Solids from Shock Wave Studies, High Velocity Impact Phenomena; Academic Press: New York, NY, USA, 1970. [Google Scholar]
- Zhang, Q.; Liu, Y.; Huang, F.; Lv, Z. Dynamic Behavior of Materials; National Defense Industry Press: Beijing, China, 2006; pp. 90–93. [Google Scholar]
- Zhang, X.F.; Shi, A.S.; Zhang, J.; Qiao, L.; He, Y.; Guan, Z.W. Thermochemical modeling of temperature controlled shock-induced chemical reactions in multifunctional energetic structural materials under shock compression. J. Appl. Phys. 2012, 111, 123501. [Google Scholar] [CrossRef]
- Qiao, L. Study on the Effects of Mesoscale Characteristic on Shock Reaction Behavior of Multifunctional Energetic Structural Materials (MESMs). Ph.D. Thesis, Nanjing University of Science & Technology, Nanjing, China, 2013; pp. 28–30. [Google Scholar]


| Materials | TMD (g/cm3) | Density (g/cm3) | Relative Density |
|---|---|---|---|
| PTFE/Ti/W (68/32/0) | 2.59 | 2.56 | 98.8% |
| PTFE/Ti/W (34/16/50) | 4.57 | 4.13 | 90.3% |
| PTFE/Ti/W (16/8/76) | 7.57 | 5.35 | 70.7% |
| PTFE/Ti/W (45/0/55) | 4.20 | 4.06 | 96.7% |
| Number | Materials | t1 () a | t2 () a | t3 () a |
|---|---|---|---|---|
| 1 | PTFE/Ti/W (68/32/0) | 8.1 | 20.3 | 40.5 |
| 2 | PTFE/Ti/W (68/32/0) | 8.7 | 19.8 | 38.8 |
| 3 | PTFE/Ti/W (68/32/0) | 8.3 | 21.4 | 41.6 |
| 4 | PTFE/Ti/W (34/16/50) | 12.3 | 31.7 | 69.8 |
| 5 | PTFE/Ti/W (34/16/50) | 11.8 | 33.2 | 73.6 |
| 6 | PTFE/Ti/W (34/16/50) | 13.0 | 34.3 | 70.2 |
| 7 | PTFE/Ti/W (16/8/76) | 16.5 | 49.3 | 88.2 |
| 8 | PTFE/Ti/W (16/8/76) | 17.2 | 52.0 | 93.1 |
| 9 | PTFE/Ti/W (16/8/76) | 15.4 | 50.8 | 91.5 |
| 10 | PTFE/Ti/W (45/0/55) | 11.6 | 31.5 | 68.6 |
| Materials | a | b |
|---|---|---|
| PTFE/Ti/W (68/32/0) | 1.95 × 10⁻³ | 2.08421 × 10⁻⁴ |
| PTFE/Ti/W (34/16/50) | 4.96 × 10⁻³ | 2.37858 × 10⁻⁴ |
| PTFE/Ti/W (16/8/76) | 8.17 × 10⁻³ | 3.03756 × 10⁻⁴ |
| PTFE/Ti/W (45/0/55) | 6.86 × 10⁻³ | 2.25798 × 10⁻⁴ |
| Material | (g/cm3) | C (m/s) | S | Cv (J/g·K) | |
|---|---|---|---|---|---|
| PTFE | 2.150 | 1682 | 1.819 | 0.59 | 1.048 |
| Ti | 4.528 | 5220 | 0.767 | 1.09 | 0.519 |
| W | 19.224 | 4029 | 1.237 | 1.54 | 0.131 |
| Materials | N (mol/L) |
|---|---|
| 98.8% TMD 68PTFE/32Ti | 17.31 |
| 90.3% TMD 34PTFE/16Ti/50W | 13.96 |
| 70.7% TMD 16PTFE/8Ti/76W | 8.68 |
| Material | ΔH (kJ/mol) | Ea (kJ/mol) | n |
|---|---|---|---|
| PTFE/Ti (67.6/32.4) | 893 | 64.8 a | 0.25 b |
© 2016 by the authors; licensee MDPI, Basel, Switzerland. This article is an open access article distributed under the terms and conditions of the Creative Commons Attribution (CC-BY) license (http://creativecommons.org/licenses/by/4.0/).
Share and Cite
Li, Y.; Jiang, C.; Wang, Z.; Luo, P. Experimental Study on Reaction Characteristics of PTFE/Ti/W Energetic Materials under Explosive Loading. Materials 2016, 9, 936. https://doi.org/10.3390/ma9110936
Li Y, Jiang C, Wang Z, Luo P. Experimental Study on Reaction Characteristics of PTFE/Ti/W Energetic Materials under Explosive Loading. Materials. 2016; 9(11):936. https://doi.org/10.3390/ma9110936
Chicago/Turabian StyleLi, Yan, Chunlan Jiang, Zaicheng Wang, and Puguang Luo. 2016. "Experimental Study on Reaction Characteristics of PTFE/Ti/W Energetic Materials under Explosive Loading" Materials 9, no. 11: 936. https://doi.org/10.3390/ma9110936
APA StyleLi, Y., Jiang, C., Wang, Z., & Luo, P. (2016). Experimental Study on Reaction Characteristics of PTFE/Ti/W Energetic Materials under Explosive Loading. Materials, 9(11), 936. https://doi.org/10.3390/ma9110936