
TiC Reinforcement Composite Coating Produced Using Graphite of the Cast Iron by Laser Cladding


Abstract
:
1. Introduction
2. Experiments
3. Results and Discussion
4. Conclusions
Acknowledgments
Author Contributions
Conflicts of Interest
References
- Hütter, G.; Zybell, L.; Kuna, M. Micromechanisms of fracture in nodular cast iron: From experimental findings towards modeling strategies—A review. Eng. Fract. Mech. 2015, 144, 118–141. [Google Scholar] [CrossRef]
- Chen, J.; Xue, L.; Wang, S.-H. Experimental studies on process-induced morphological characteristics of macro- and microstructures in laser consolidated alloys. J. Mater. Sci. 2011, 46, 5859–5875. [Google Scholar] [CrossRef]
- Mellouli, D.; Haddar, N.; Köster, A.; Toure, A.M.-L. Thermal fatigue of cast irons for automotive application. Mater. Des. 2011, 32, 1508–1514. [Google Scholar] [CrossRef]
- Sun, J.Q.; Yan, Z.F.; Cui, H.Z.; Li, J.; Wang, J.S.; Chen, Y.B. Surface catalysis gaseous nitriding of alloy cast iron at lower temperature. Catal. Today 2010, 158, 205–208. [Google Scholar] [CrossRef]
- Beyhaghi, M.; Kiani-Rashid, A.R.; Kashefi, M.; Khaki, J.V.; Jonsson, S. Effect of powder reactivity on fabrication and properties of NiAl/Al2O3 composite coated on cast iron using spark plasma sintering. Appl. Surf. Sci. 2015, 344, 1–8. [Google Scholar] [CrossRef]
- Fernandes, F.; Cavaleiro, A.; Loureiro, A. Oxidation behavior of Ni-based coatings deposited by PTA on gray cast iron. Surf. Coat. Technol. 2012, 207, 196–203. [Google Scholar] [CrossRef]
- Yang, X.; Zhang, Z.; Wang, J.; Ren, L. Investigation of nanomechanical properties and thermal fatigue resistance of gray cast iron processed by laser alloying. J. Alloys Compd. 2015, 626, 260–263. [Google Scholar] [CrossRef]
- Pang, Z.; Zhou, H.; Zhang, P.; Cong, D.; Meng, C.; Wang, C.; Ren, L. Study on quantitative relation between characteristics of striature bionic coupling unit and wear resistance of gray cast iron. Appl. Surf. Sci. 2015, 331, 179–184. [Google Scholar] [CrossRef]
- Jing, Z.; Zhou, H.; Zhang, P.; Wang, C.; Meng, C.; Cong, D. Effect of thermal fatigue on the wear resistance of graphite cast iron with bionic units processed by laser cladding WC. Appl. Surf. Sci. 2013, 271, 329–336. [Google Scholar] [CrossRef]
- Majumdar, J.D.; Manna, I. Laser material processing. Int. Mater. Rev. 2011, 56, 341–388. [Google Scholar] [CrossRef]
- Chen, J.; Wang, S.-H.; Xue, L. On the development of microstructures and residual stresses during laser cladding and post-heat treatments. J. Mater. Sci. 2012, 47, 779–792. [Google Scholar] [CrossRef]
- Chen, Z.-K.; Zhou, T.; Zhang, H.-F.; Yang, W.-S.; Zhou, H. Influence of Orientations of Bionic Unit Fabricated by Laser Remelting on Fatigue Wear Resistance of Gray Cast Iron. J. Mater. Eng. Perform. 2015, 24, 2511–2520. [Google Scholar] [CrossRef]
- Liu, Y.; Zhou, H.; Yang, C.Y.; Cheng, J.Y. Thermal fatigue resistance of bionic compacted graphite cast iron treated with the twice laser process in water. Strength Mater. 2015, 47, 170–176. [Google Scholar] [CrossRef]
- Bathe, R.; Krishna, V.S.; Nikumb, S.K.; Padmanabham, G. Laser surface texturing of gray cast iron for improving tribological behavior. Appl. Phys. A 2014, 117, 117–123. [Google Scholar] [CrossRef]
- Duarte, M.; Lasagni, A.; Giovanelli, R.; Narciso, J.; Louis, E.; Mücklich, F. Increasing lubricant lifetime by grooving periodical patterns using laser interference metallurgy. Adv. Eng. Mater. 2008, 10, 554–558. [Google Scholar] [CrossRef]
- Walsh, F.C.; de Leon, C.P. A review of the electrodeposition of metal matrix composite coatings by inclusion of particles in a metal layer: An established and diversifying technology. Trans. Inst. Met. Finish. 2014, 92, 83–98. [Google Scholar] [CrossRef]
- Gallo, S.C.; Alam, N.; O’Donnell, R. In-situ precipitation of TiC upon PTA hardfacing with grey cast iron and titanium for enhanced wear resistance. Surf. Coat. Technol. 2013, 214, 63–68. [Google Scholar] [CrossRef]
- Gopagoni, S.; Hwang, J.Y.; Singh, A.R.P.; Mensah, B.A.; Bunce, N.; Tiley, J.; Scharf, T.W.; Banerjee, R. Microstructural evolution in laser deposited nickel-titanium-carbon in situ metal matrix composites. J. Alloys Compd. 2011, 509, 1255–1260. [Google Scholar] [CrossRef]
- Lekatou, A.; Karantzalis, A.E.; Evangelou, A.; Gousia, V.; Kaptay, G.; Gacsi, Z.; Baumli, P.; Simon, A. Aluminium reinforced by WC and TiC nanoparticles (ex-situ) and aluminide particles (in-situ): Microstructure, wear and corrosion behavior. Mater. Des. 2015, 65, 1121–1135. [Google Scholar] [CrossRef]
- Grum, J.; Šturm, R. A new experimental technique for measuring strain and residual stresses during a laser remelting process. J. Mater. Process. Technol. 2004, 147, 351–358. [Google Scholar] [CrossRef]
- Karamış, M.B.; Yıldızlı, K. Surface modification of nodular cast iron: A comparative study on graphite elimination. Mater. Sci. Eng. A 2010, 527, 5225–5229. [Google Scholar] [CrossRef]
- Sun, G.; Zhou, R.; Li, P.; Feng, A.; Zhang, Y. Laser surface alloying of C-B-W-Cr powders on nodular cast iron rolls. Surf. Coat. Technol. 2011, 205, 2747–2754. [Google Scholar] [CrossRef]
- Zhu, L.-N.; Xu, B.-S.; Wang, H.-D.; Wang, C.-B. Microstructure and nanoindentation measurement of residual stress in Fe-based coating by laser cladding. J. Mater. Sci. 2012, 47, 2122–2126. [Google Scholar] [CrossRef]
- Molian, P.A. Effect of fusion zone shape on the composition uniformity of laser surface alloyed iron. Scr. Metall. 1982, 16, 65–68. [Google Scholar] [CrossRef]
- Kou, S.; Wang, Y.H. Three-dimension convection in laser melted pools. Metall. Trans. A 1986, 17, 2265–2270. [Google Scholar] [CrossRef]
- Limmaneevichitr, C.; Kou, S. Experiments to simulate effect of Marangoni convection on weld pool shape. Weld. Res. Suppl. 2000, 79, 231–237. [Google Scholar]
- Drezet, J.-M.; Pellerin, S.; Bezencon, C.; Mokadem, S. Modelling the Marangoni convection in laser heat treatment. J. Phys. IV France 2004, 120, 299–306. [Google Scholar]
- Abboud, J.H. Microstructure and erosion characteristic of nodular cast iron surface modified by tungsten inert gas. Mater. Des. 2012, 35, 677–684. [Google Scholar] [CrossRef]
- Alabeedi, K.F.; Abboud, J.H.; Benyounis, K.Y. Microstructure and erosion resistance enhancement of nodular cast iron by laser melting. Wear 2009, 266, 925–933. [Google Scholar] [CrossRef]
- Yan, H.; Wang, A.; Xiong, Z.; Xu, K.; Huang, Z. Microstructure and wear resistance of composite layers on a ductile iron with multicarbide by laser surface alloying. Appl. Surf. Sci. 2010, 256, 7001–7009. [Google Scholar] [CrossRef]
- Garcia-Cordovill, C.; Narciso, J.; Louis, E. Abrasive wear resistence of aluminium alloy/ceramic particulate composites. Wear 1996, 192, 170–177. [Google Scholar] [CrossRef]


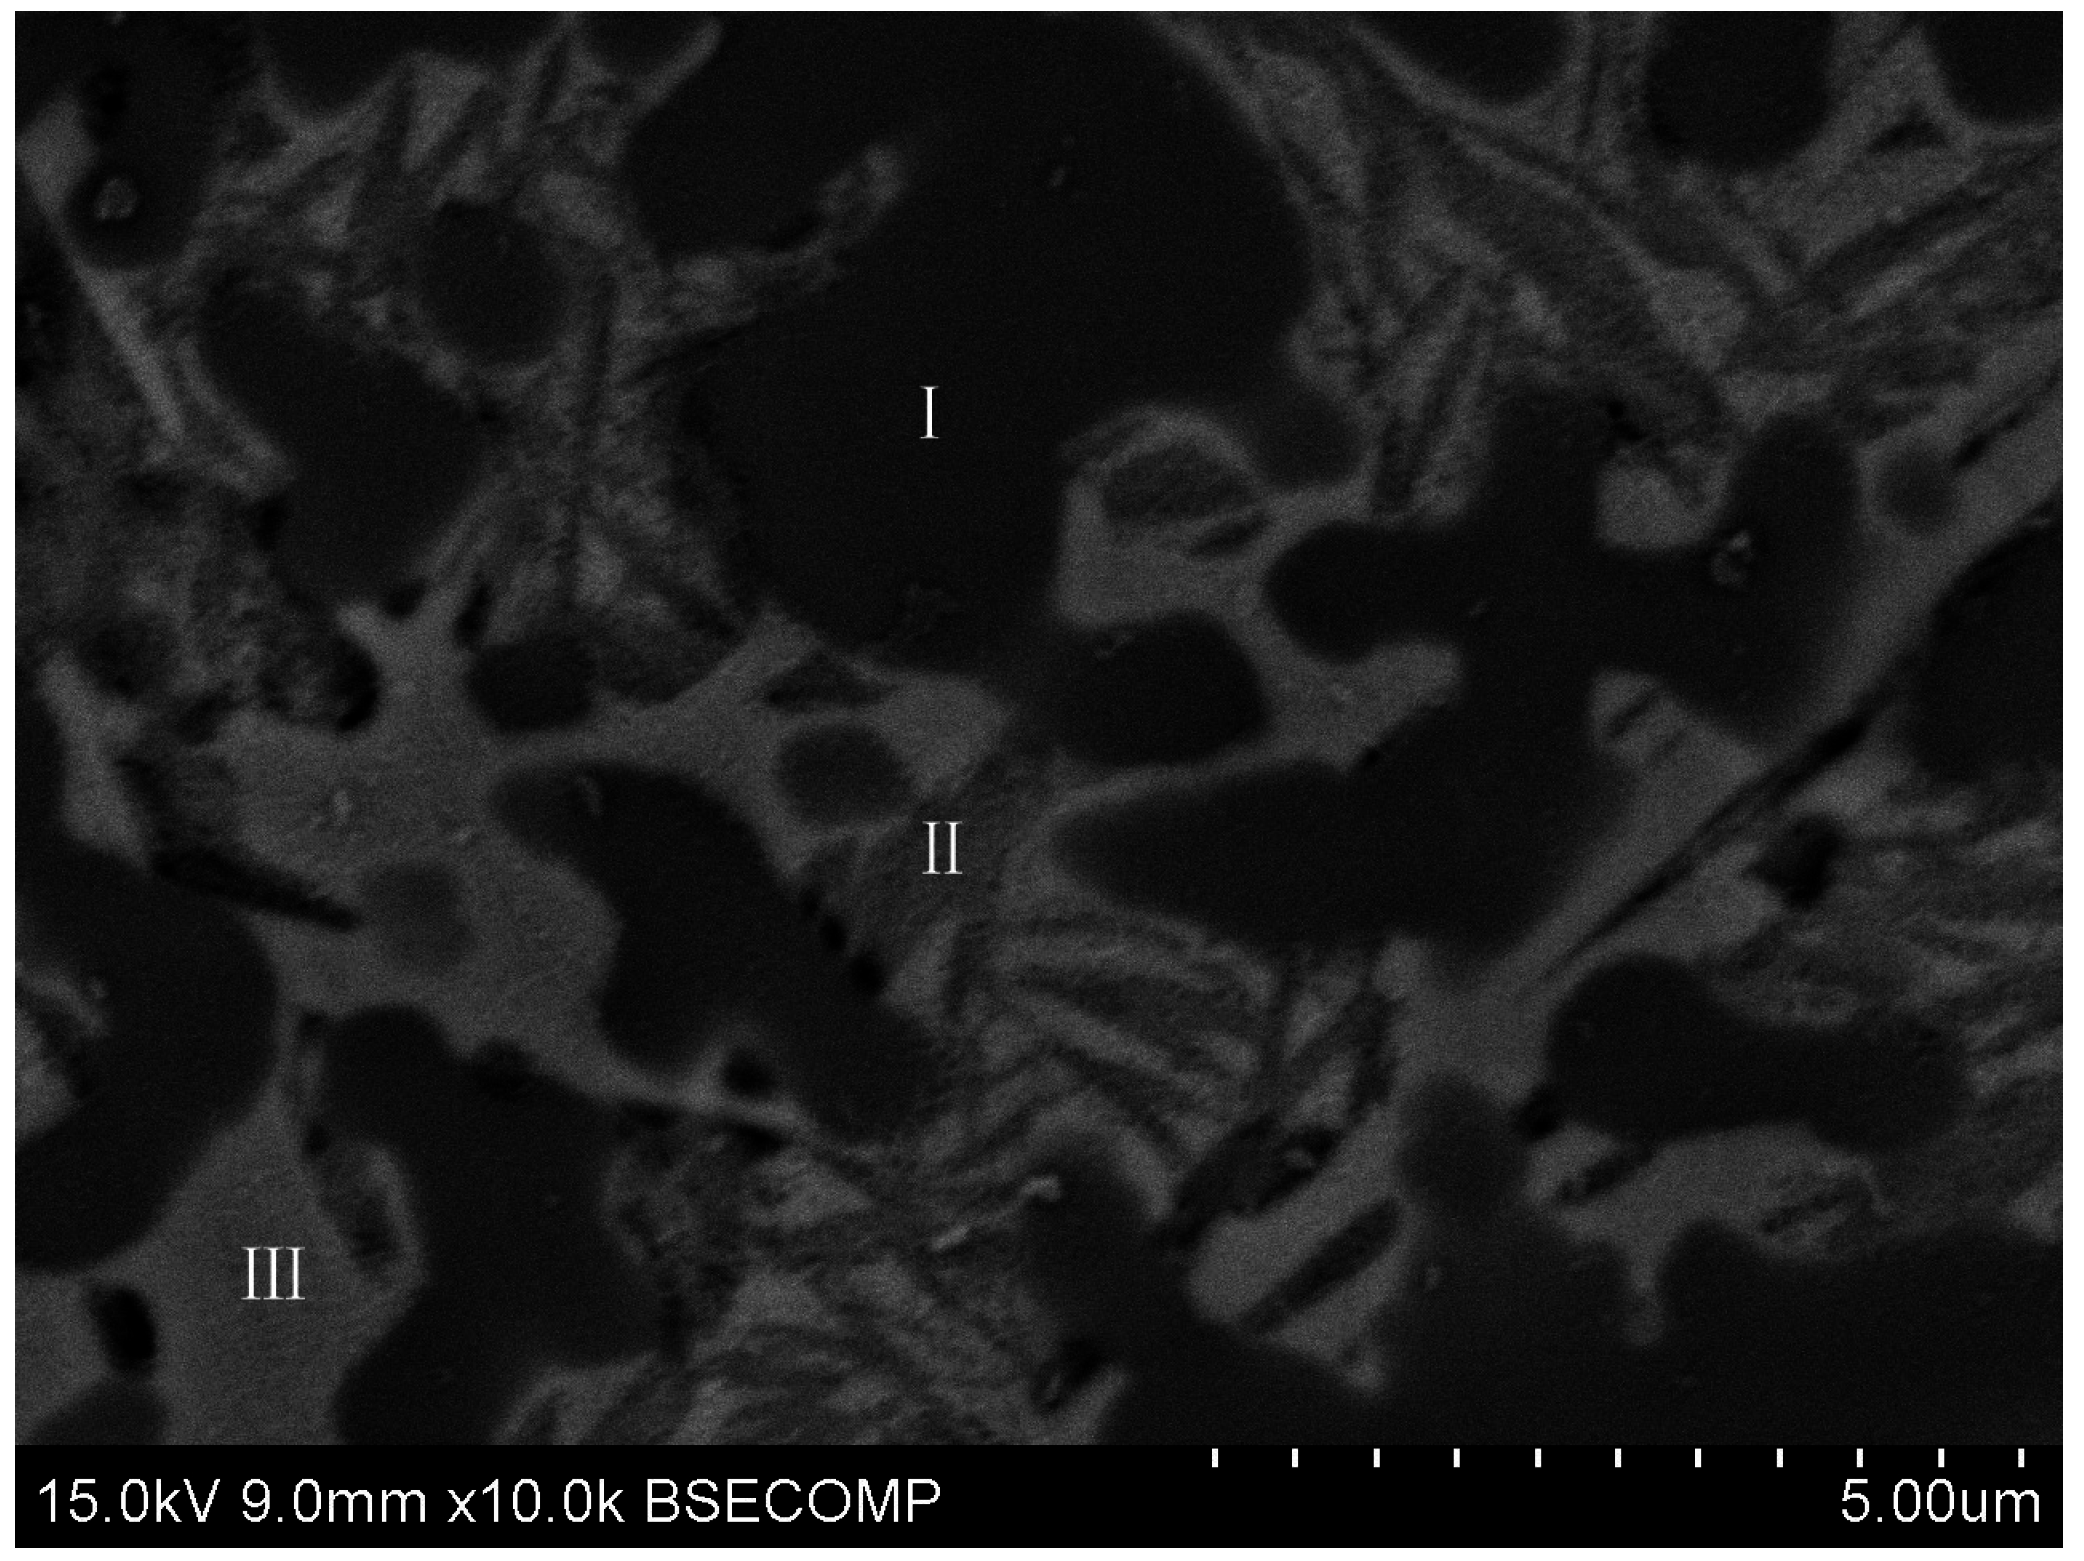
| Test Point | Fe (at %) | Ti (at %) | Si (at %) | C (at %) | Matrix |
|---|---|---|---|---|---|
| I (Light black particles phase) | 5.09 | 91.16 | – | 3.75 | ZAF |
| II (Grey matrix phase) | 85.99 | 7.44 | 3.77 | 2.80 | ZAF |
| III (Grey-white matrix phase) | 93.71 | 2.93 | – | 3.36 | ZAF |
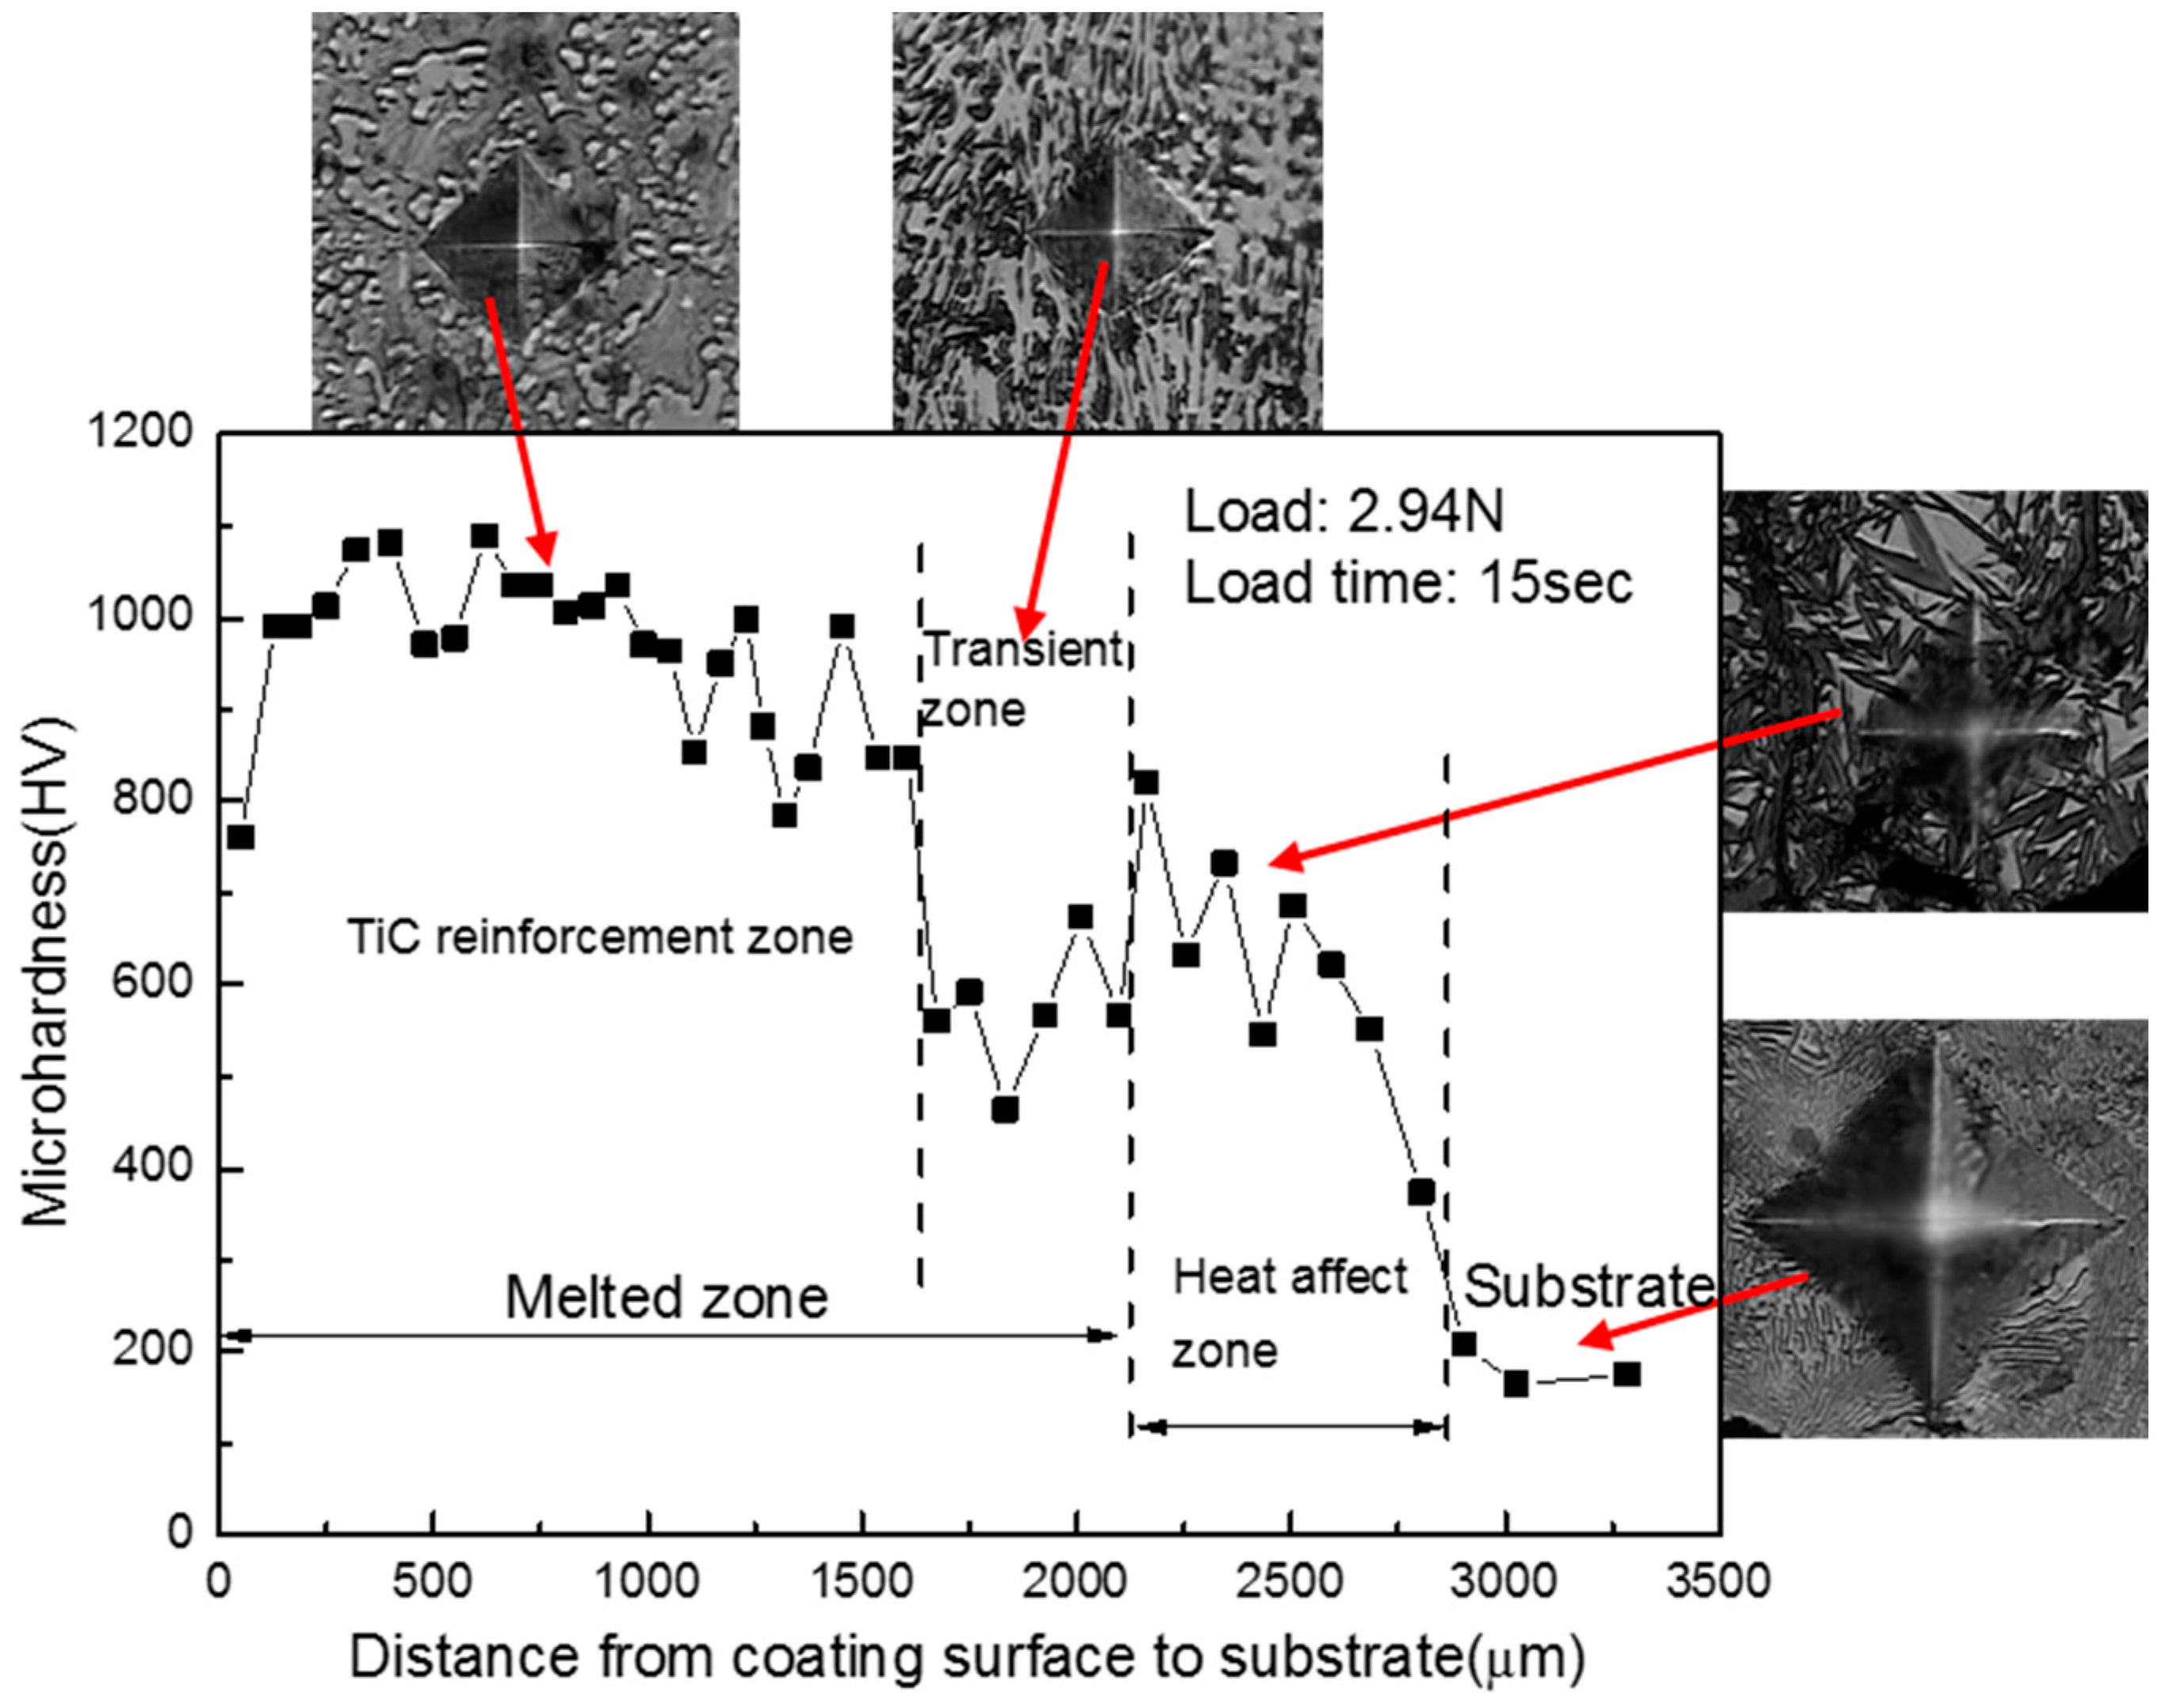
| Test Point | Fe (at %) | Ti (at %) | Si (at %) | C (at %) | Matrix |
|---|---|---|---|---|---|
| Top of the laser cladding zone | 73.67 | 20.55 | 3.23 | 2.55 | ZAF |
| Middle of the laser cladding zone | 76.17 | 18.52 | 3.09 | 2.22 | ZAF |
| Bottom of the laser cladding zone | 84.73 | 9.79 | 3.45 | 2.02 | ZAF |
© 2016 by the authors; licensee MDPI, Basel, Switzerland. This article is an open access article distributed under the terms and conditions of the Creative Commons Attribution (CC-BY) license (http://creativecommons.org/licenses/by/4.0/).
Share and Cite
Liu, Y.; Qu, W.; Su, Y. TiC Reinforcement Composite Coating Produced Using Graphite of the Cast Iron by Laser Cladding. Materials 2016, 9, 815. https://doi.org/10.3390/ma9100815
Liu Y, Qu W, Su Y. TiC Reinforcement Composite Coating Produced Using Graphite of the Cast Iron by Laser Cladding. Materials. 2016; 9(10):815. https://doi.org/10.3390/ma9100815
Chicago/Turabian StyleLiu, Yanhui, Weicheng Qu, and Yu Su. 2016. "TiC Reinforcement Composite Coating Produced Using Graphite of the Cast Iron by Laser Cladding" Materials 9, no. 10: 815. https://doi.org/10.3390/ma9100815
APA StyleLiu, Y., Qu, W., & Su, Y. (2016). TiC Reinforcement Composite Coating Produced Using Graphite of the Cast Iron by Laser Cladding. Materials, 9(10), 815. https://doi.org/10.3390/ma9100815