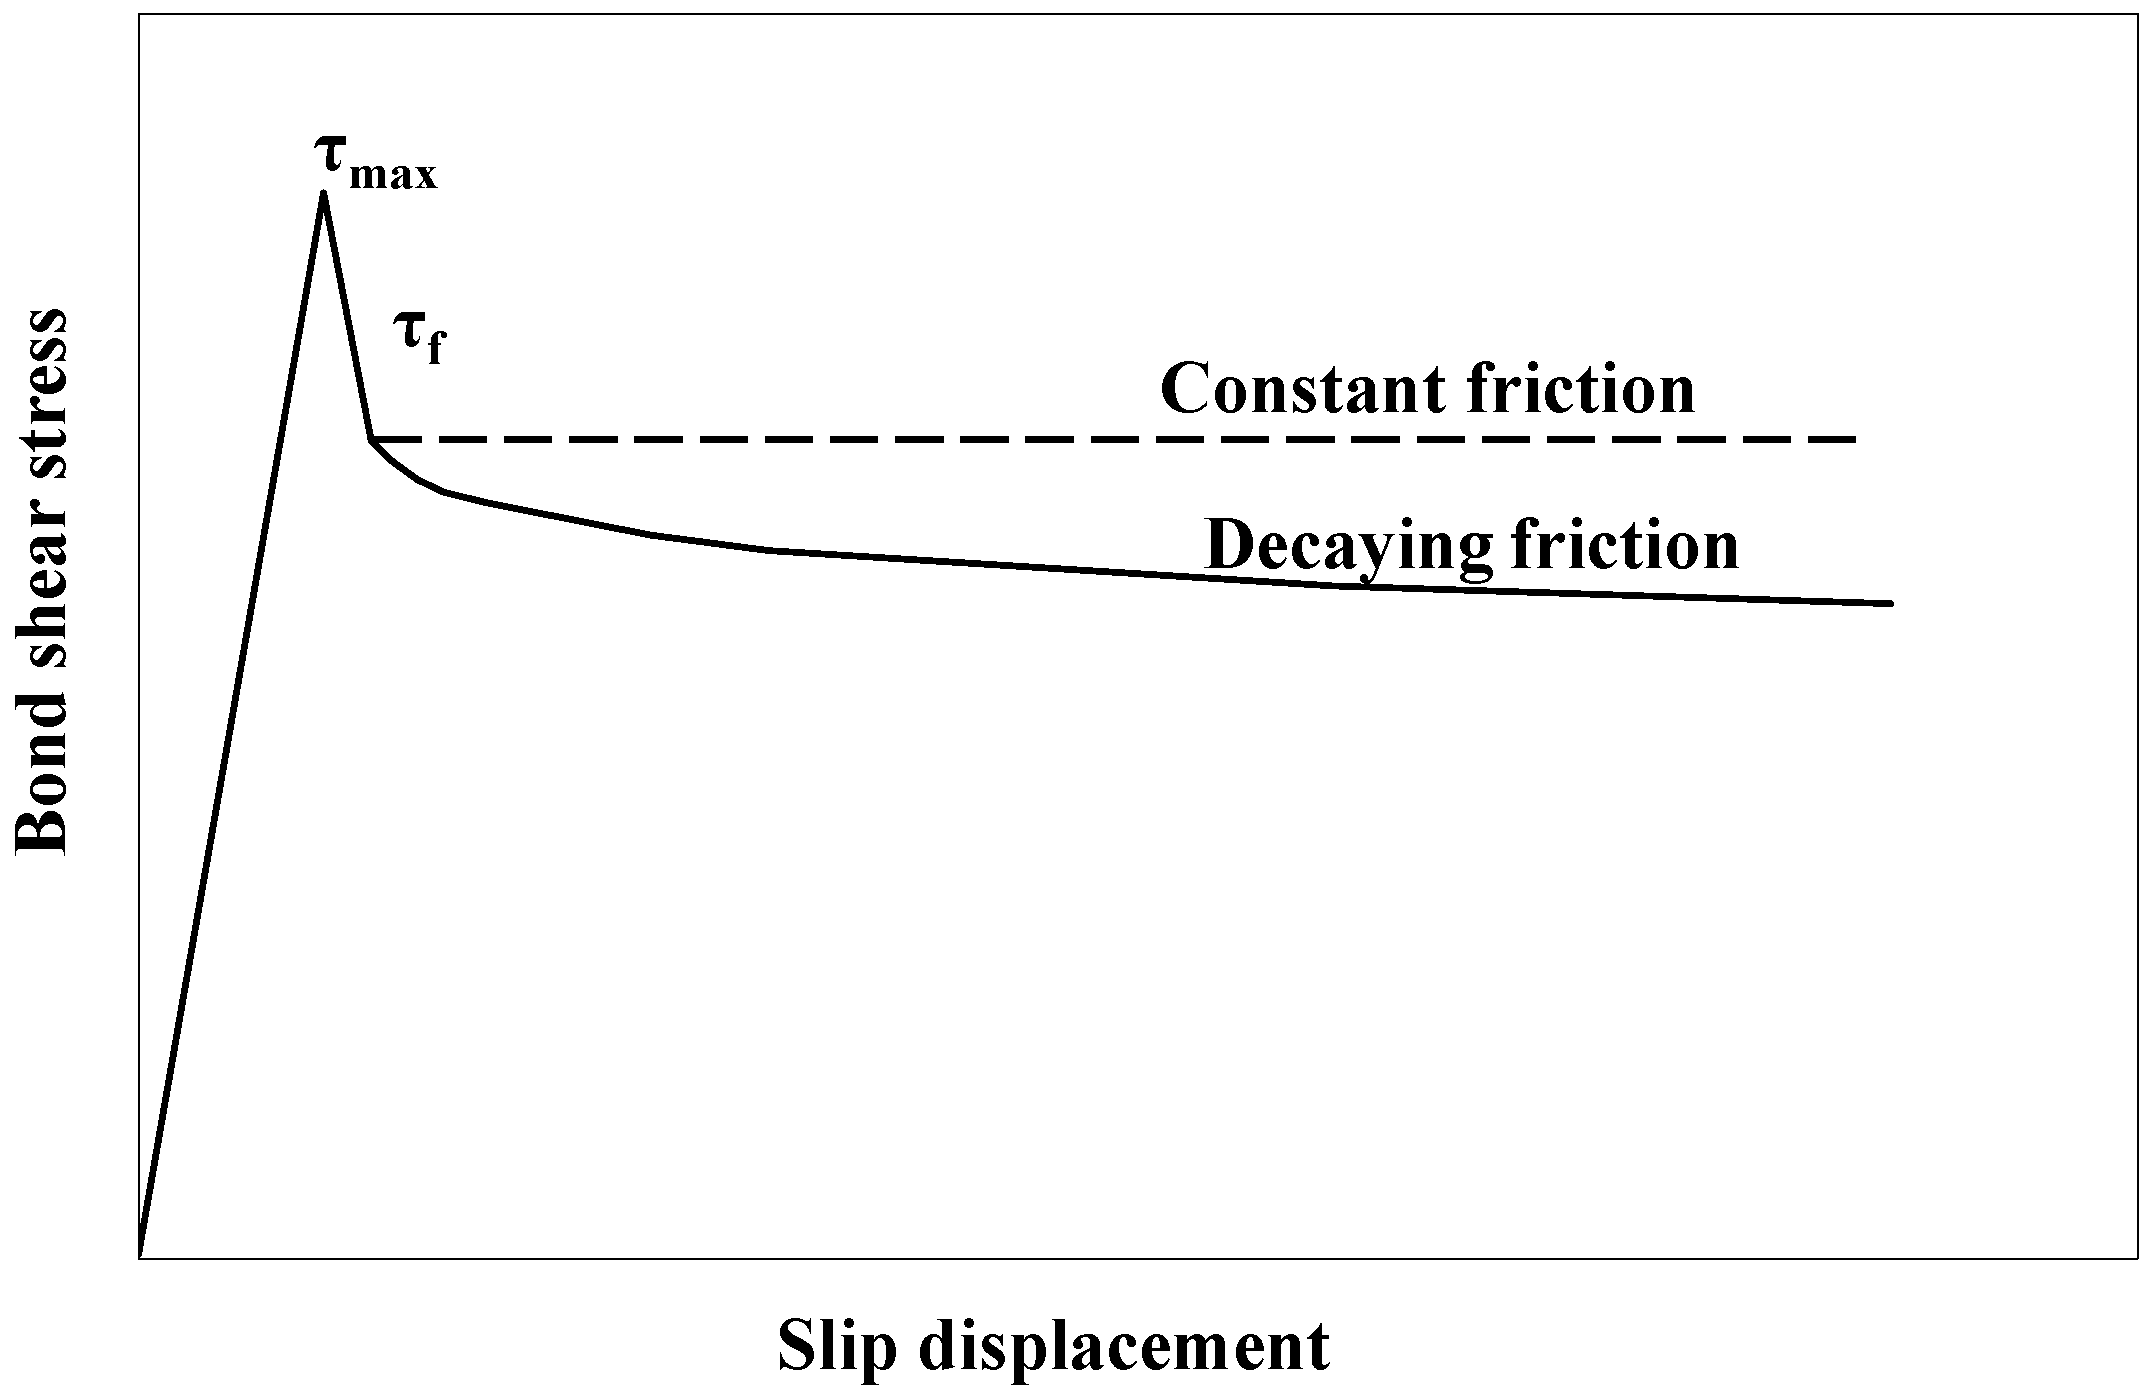
Figure 1.
Bond stress vs. relative slip at the interface: the contribution of friction.
Figure 1.
Bond stress vs. relative slip at the interface: the contribution of friction.
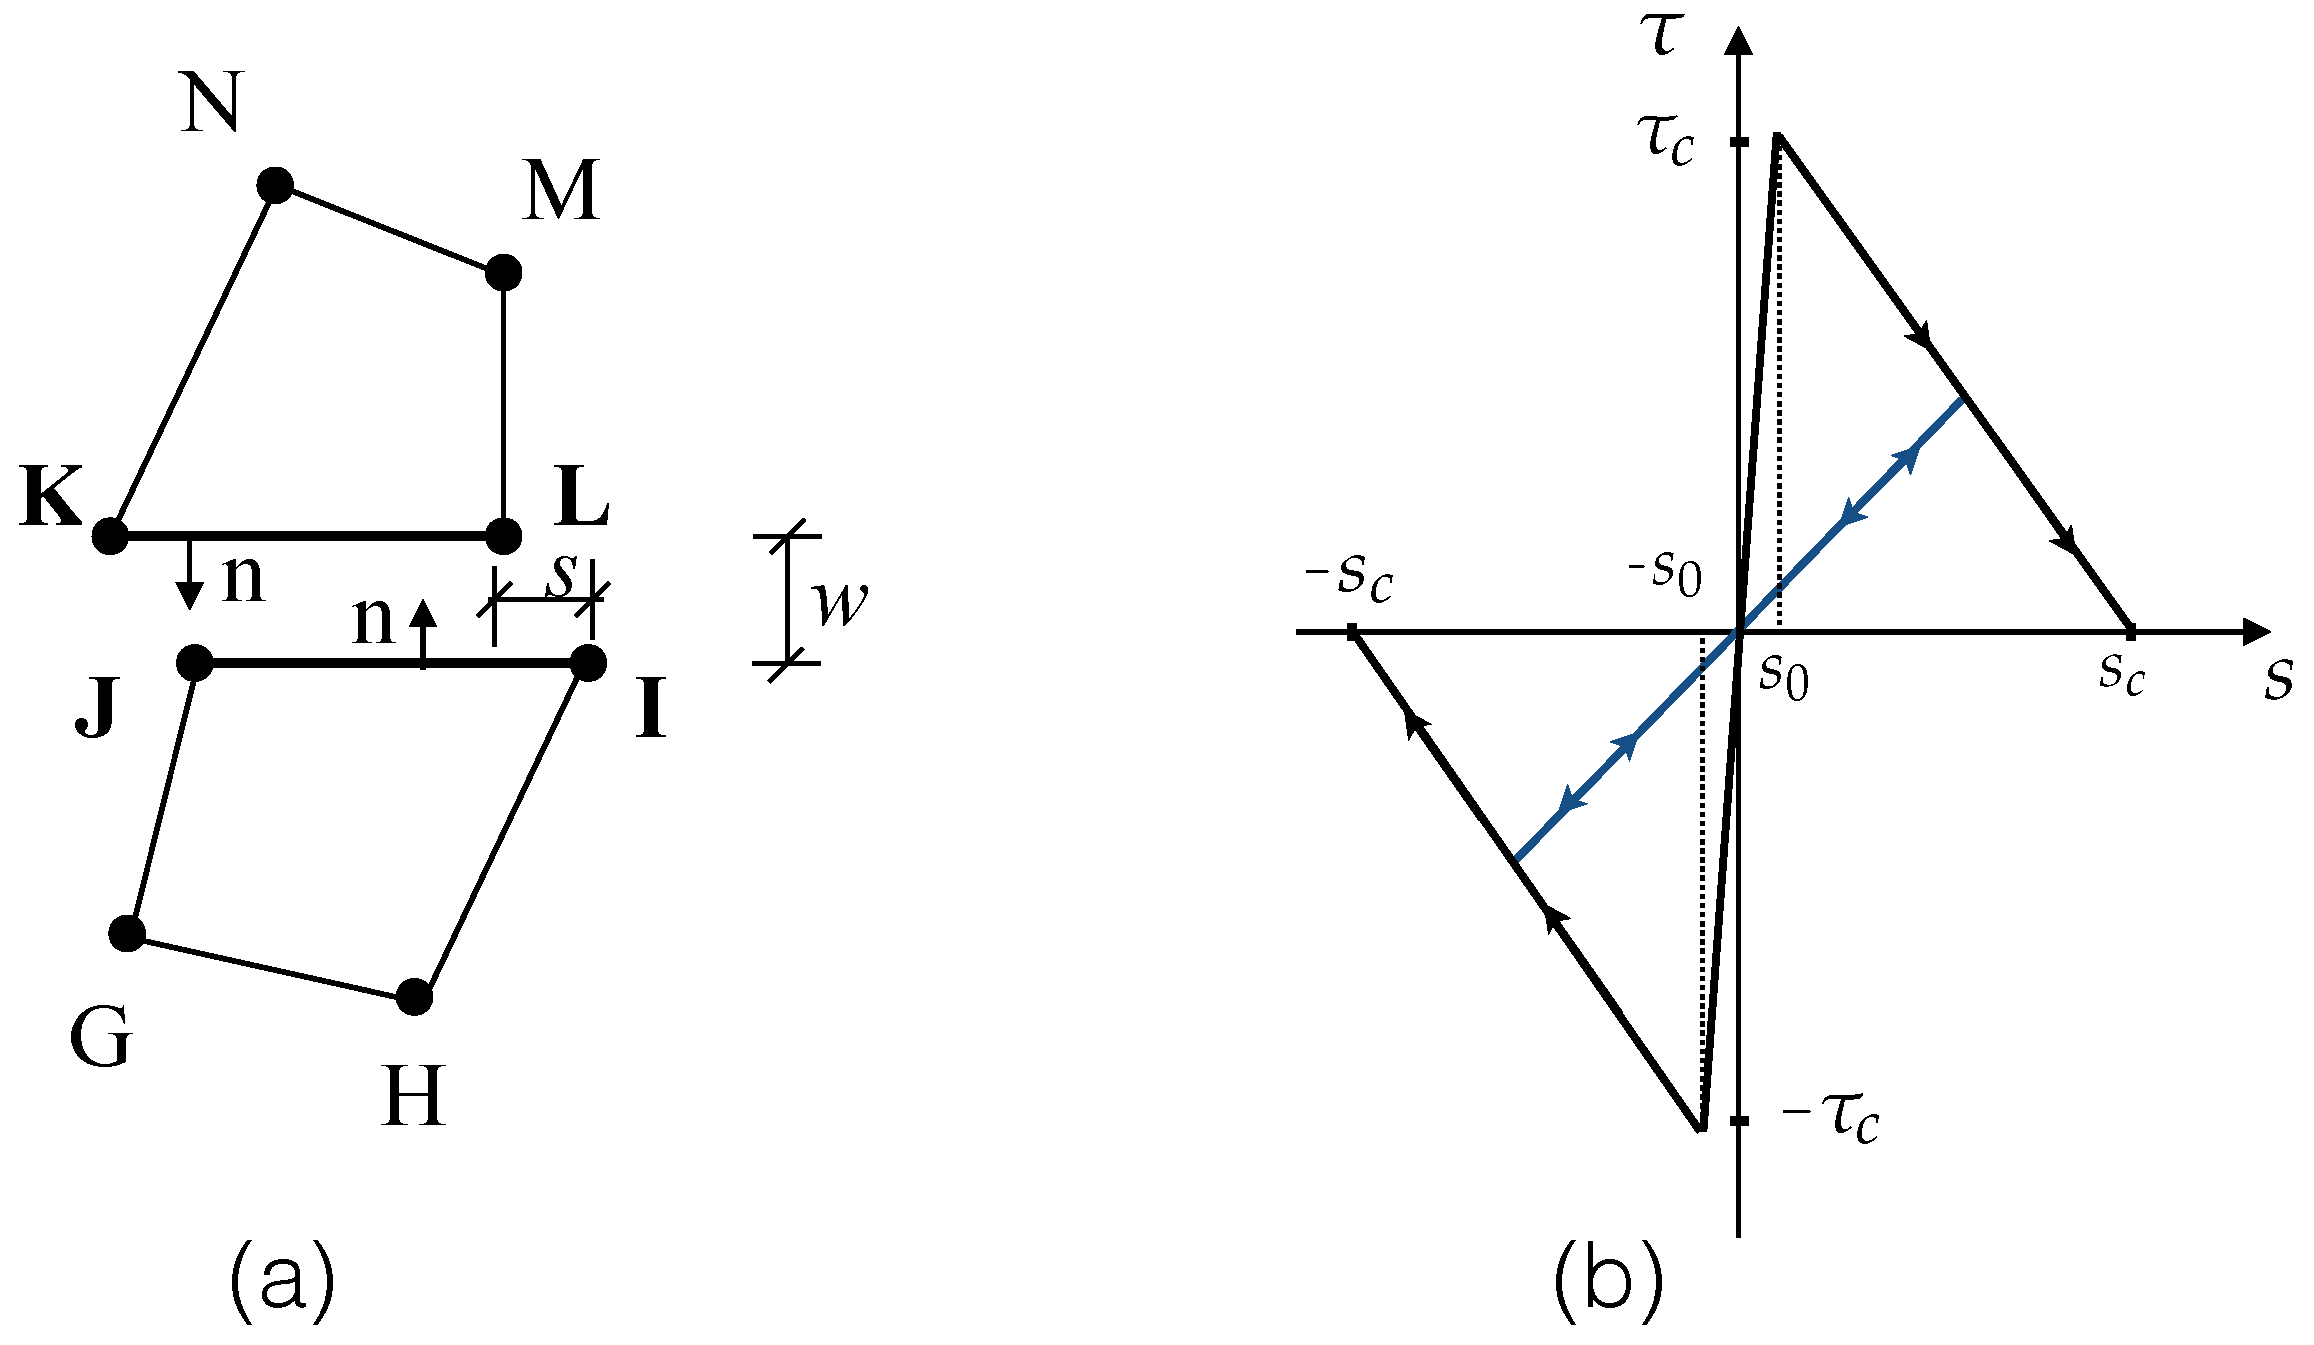
Figure 2.
(a) A 2D interface element I-J-K-L formed between two four-node solid elements G-H-I-J and K-L-M-N, where s and w are the tangential and normal displacement jumps, and n is the normal direction of the two line segments; (b) the bond-slip law (shown for a linear-decreasing case).
Figure 2.
(a) A 2D interface element I-J-K-L formed between two four-node solid elements G-H-I-J and K-L-M-N, where s and w are the tangential and normal displacement jumps, and n is the normal direction of the two line segments; (b) the bond-slip law (shown for a linear-decreasing case).
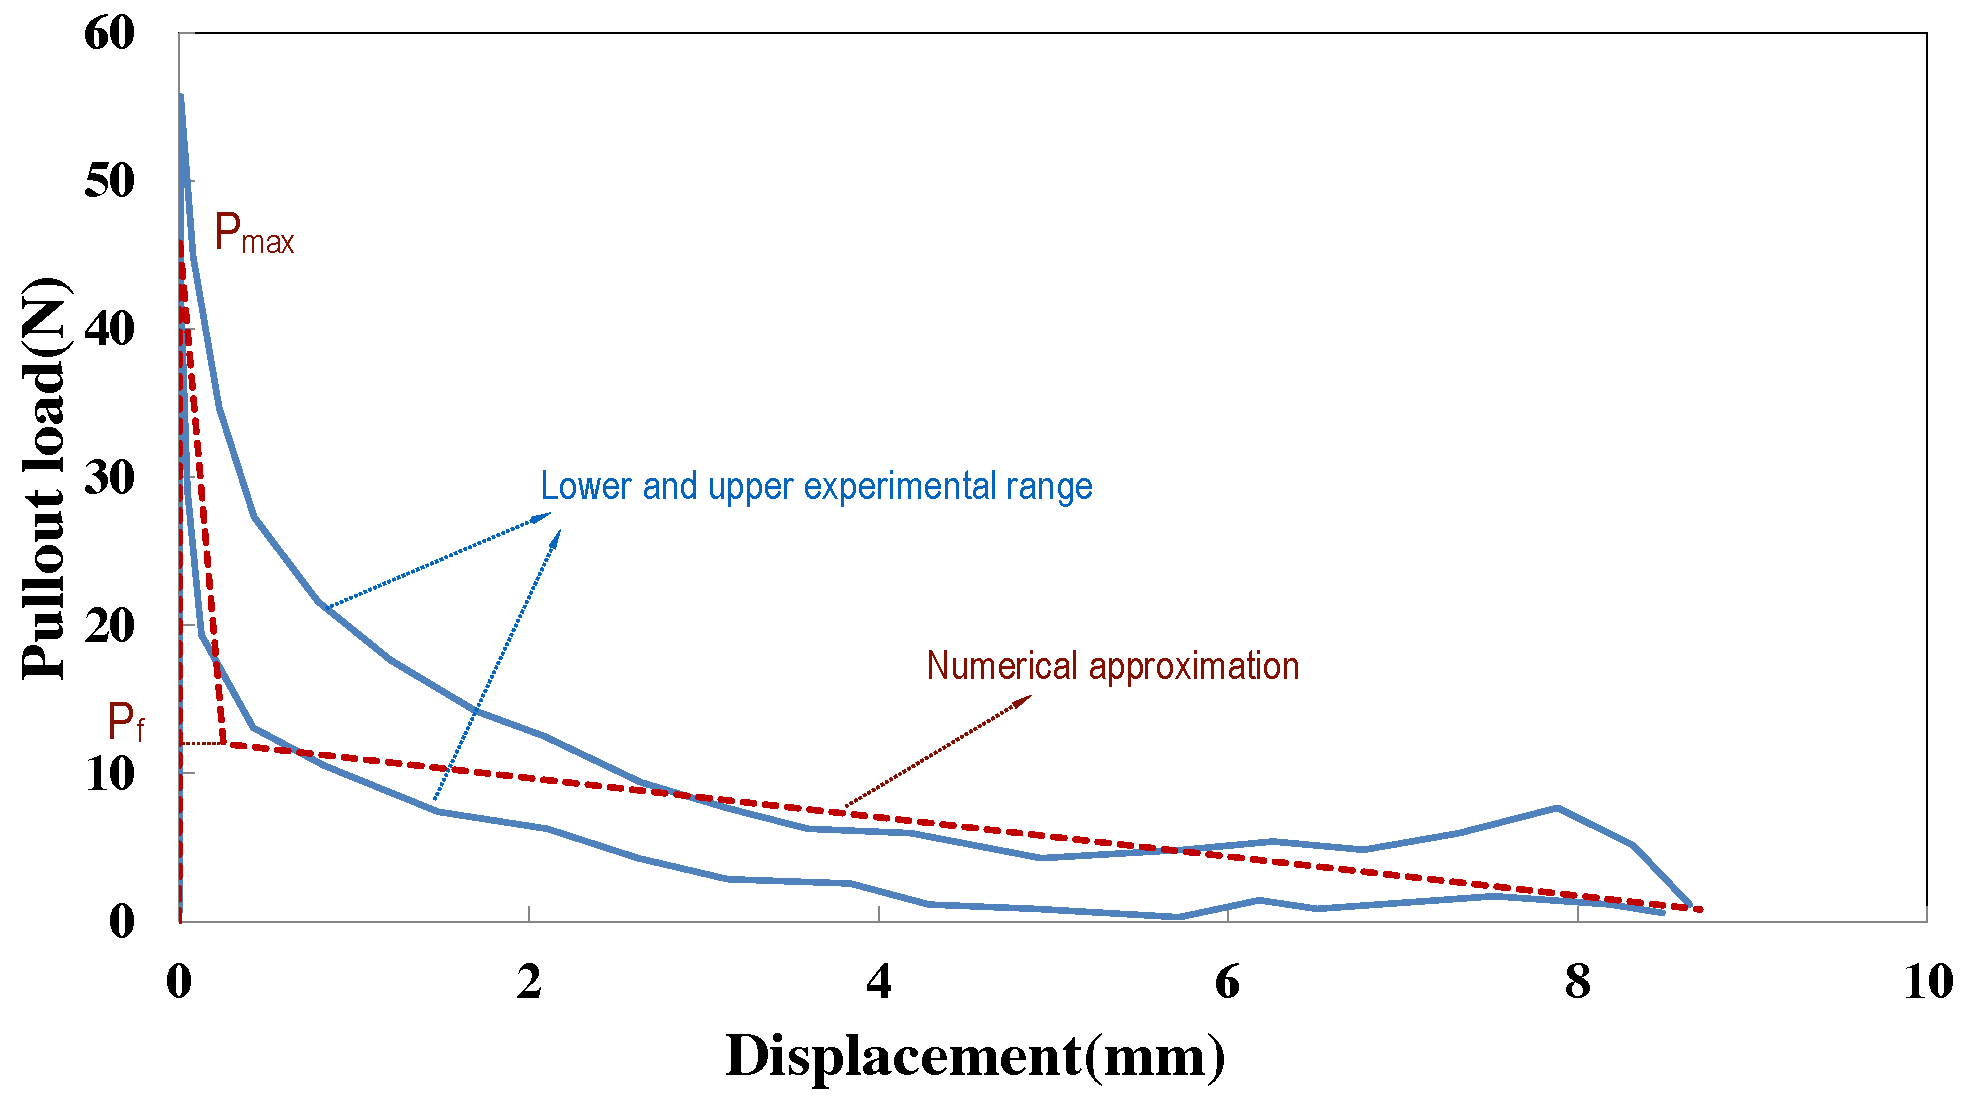
Figure 3.
Experimental range (light blue lines) for pullout curves for aligned fiber Type 2 (yield strength 469 MPa) [
26] and its bi-linear numerical approximation (red dotted line).
and
are the peak and the transitional pullout forces.
Figure 3.
Experimental range (light blue lines) for pullout curves for aligned fiber Type 2 (yield strength 469 MPa) [
26] and its bi-linear numerical approximation (red dotted line).
and
are the peak and the transitional pullout forces.
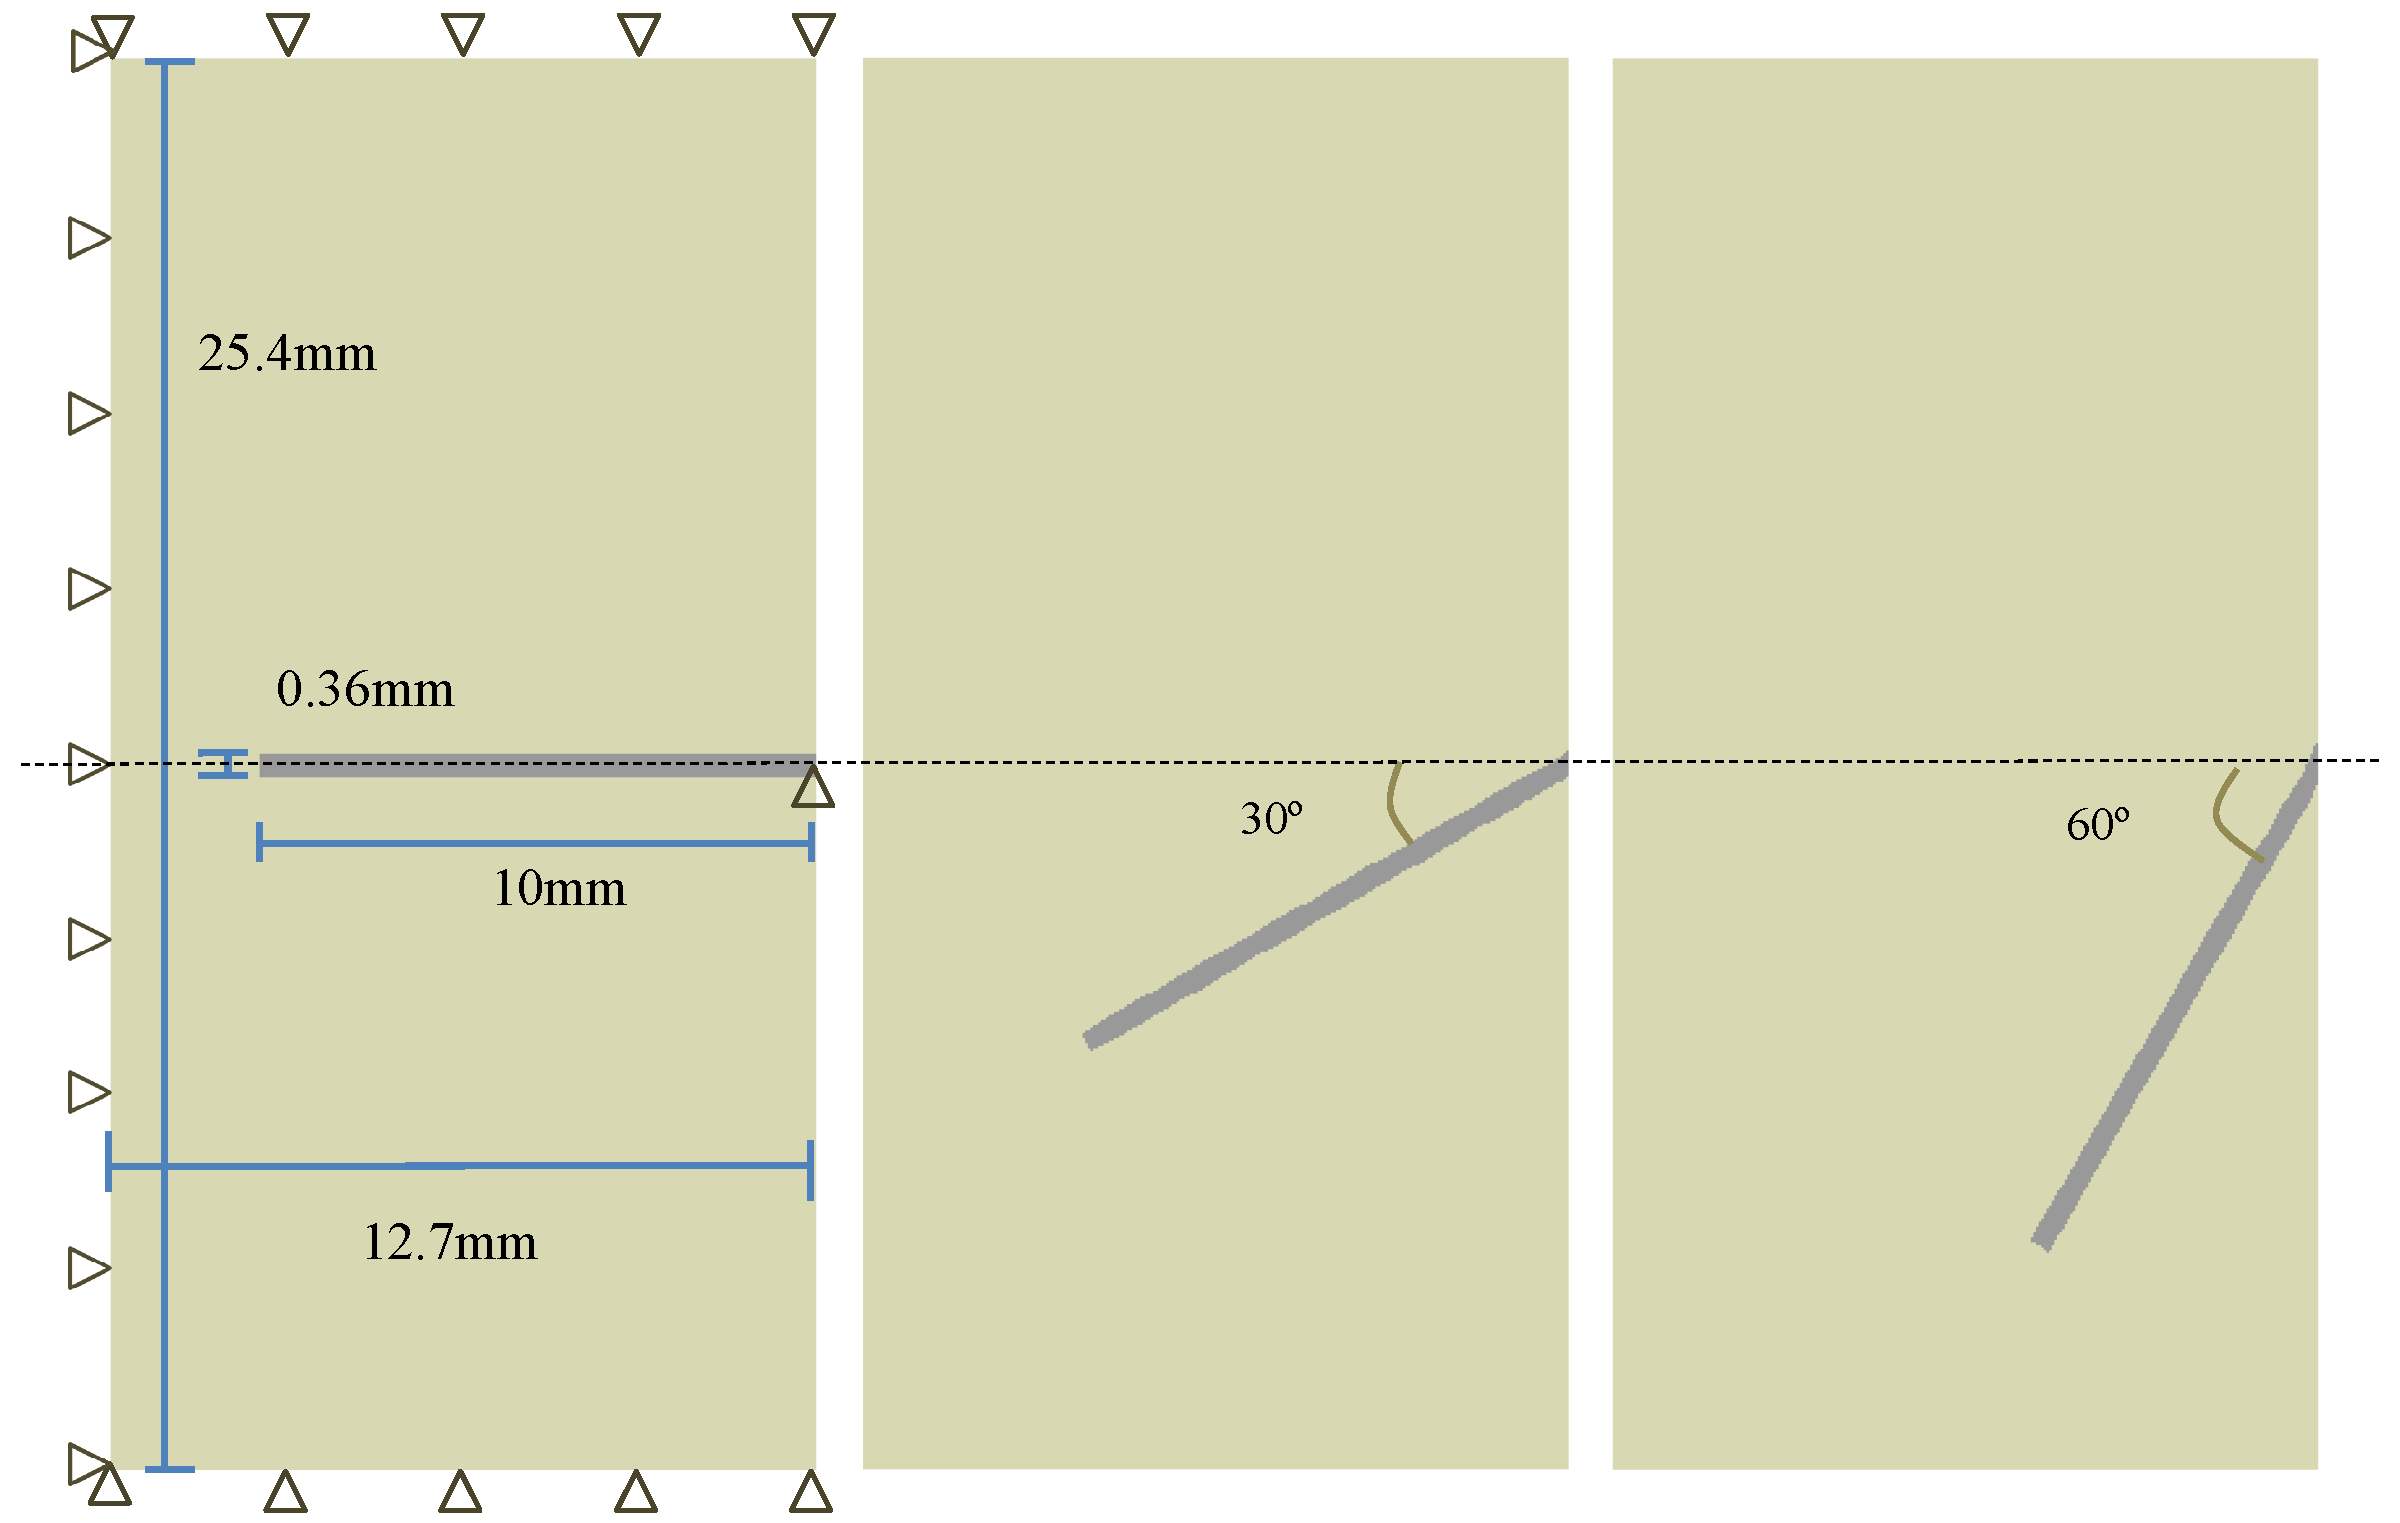
Figure 4.
In-plane dimensions and boundary conditions (the same for all cases, shown only for aligned fibers) for the pullout tests performed by Leung and Shapiro [
26], with fiber inclination angles of 0
, 30
and 60
.
Figure 4.
In-plane dimensions and boundary conditions (the same for all cases, shown only for aligned fibers) for the pullout tests performed by Leung and Shapiro [
26], with fiber inclination angles of 0
, 30
and 60
.
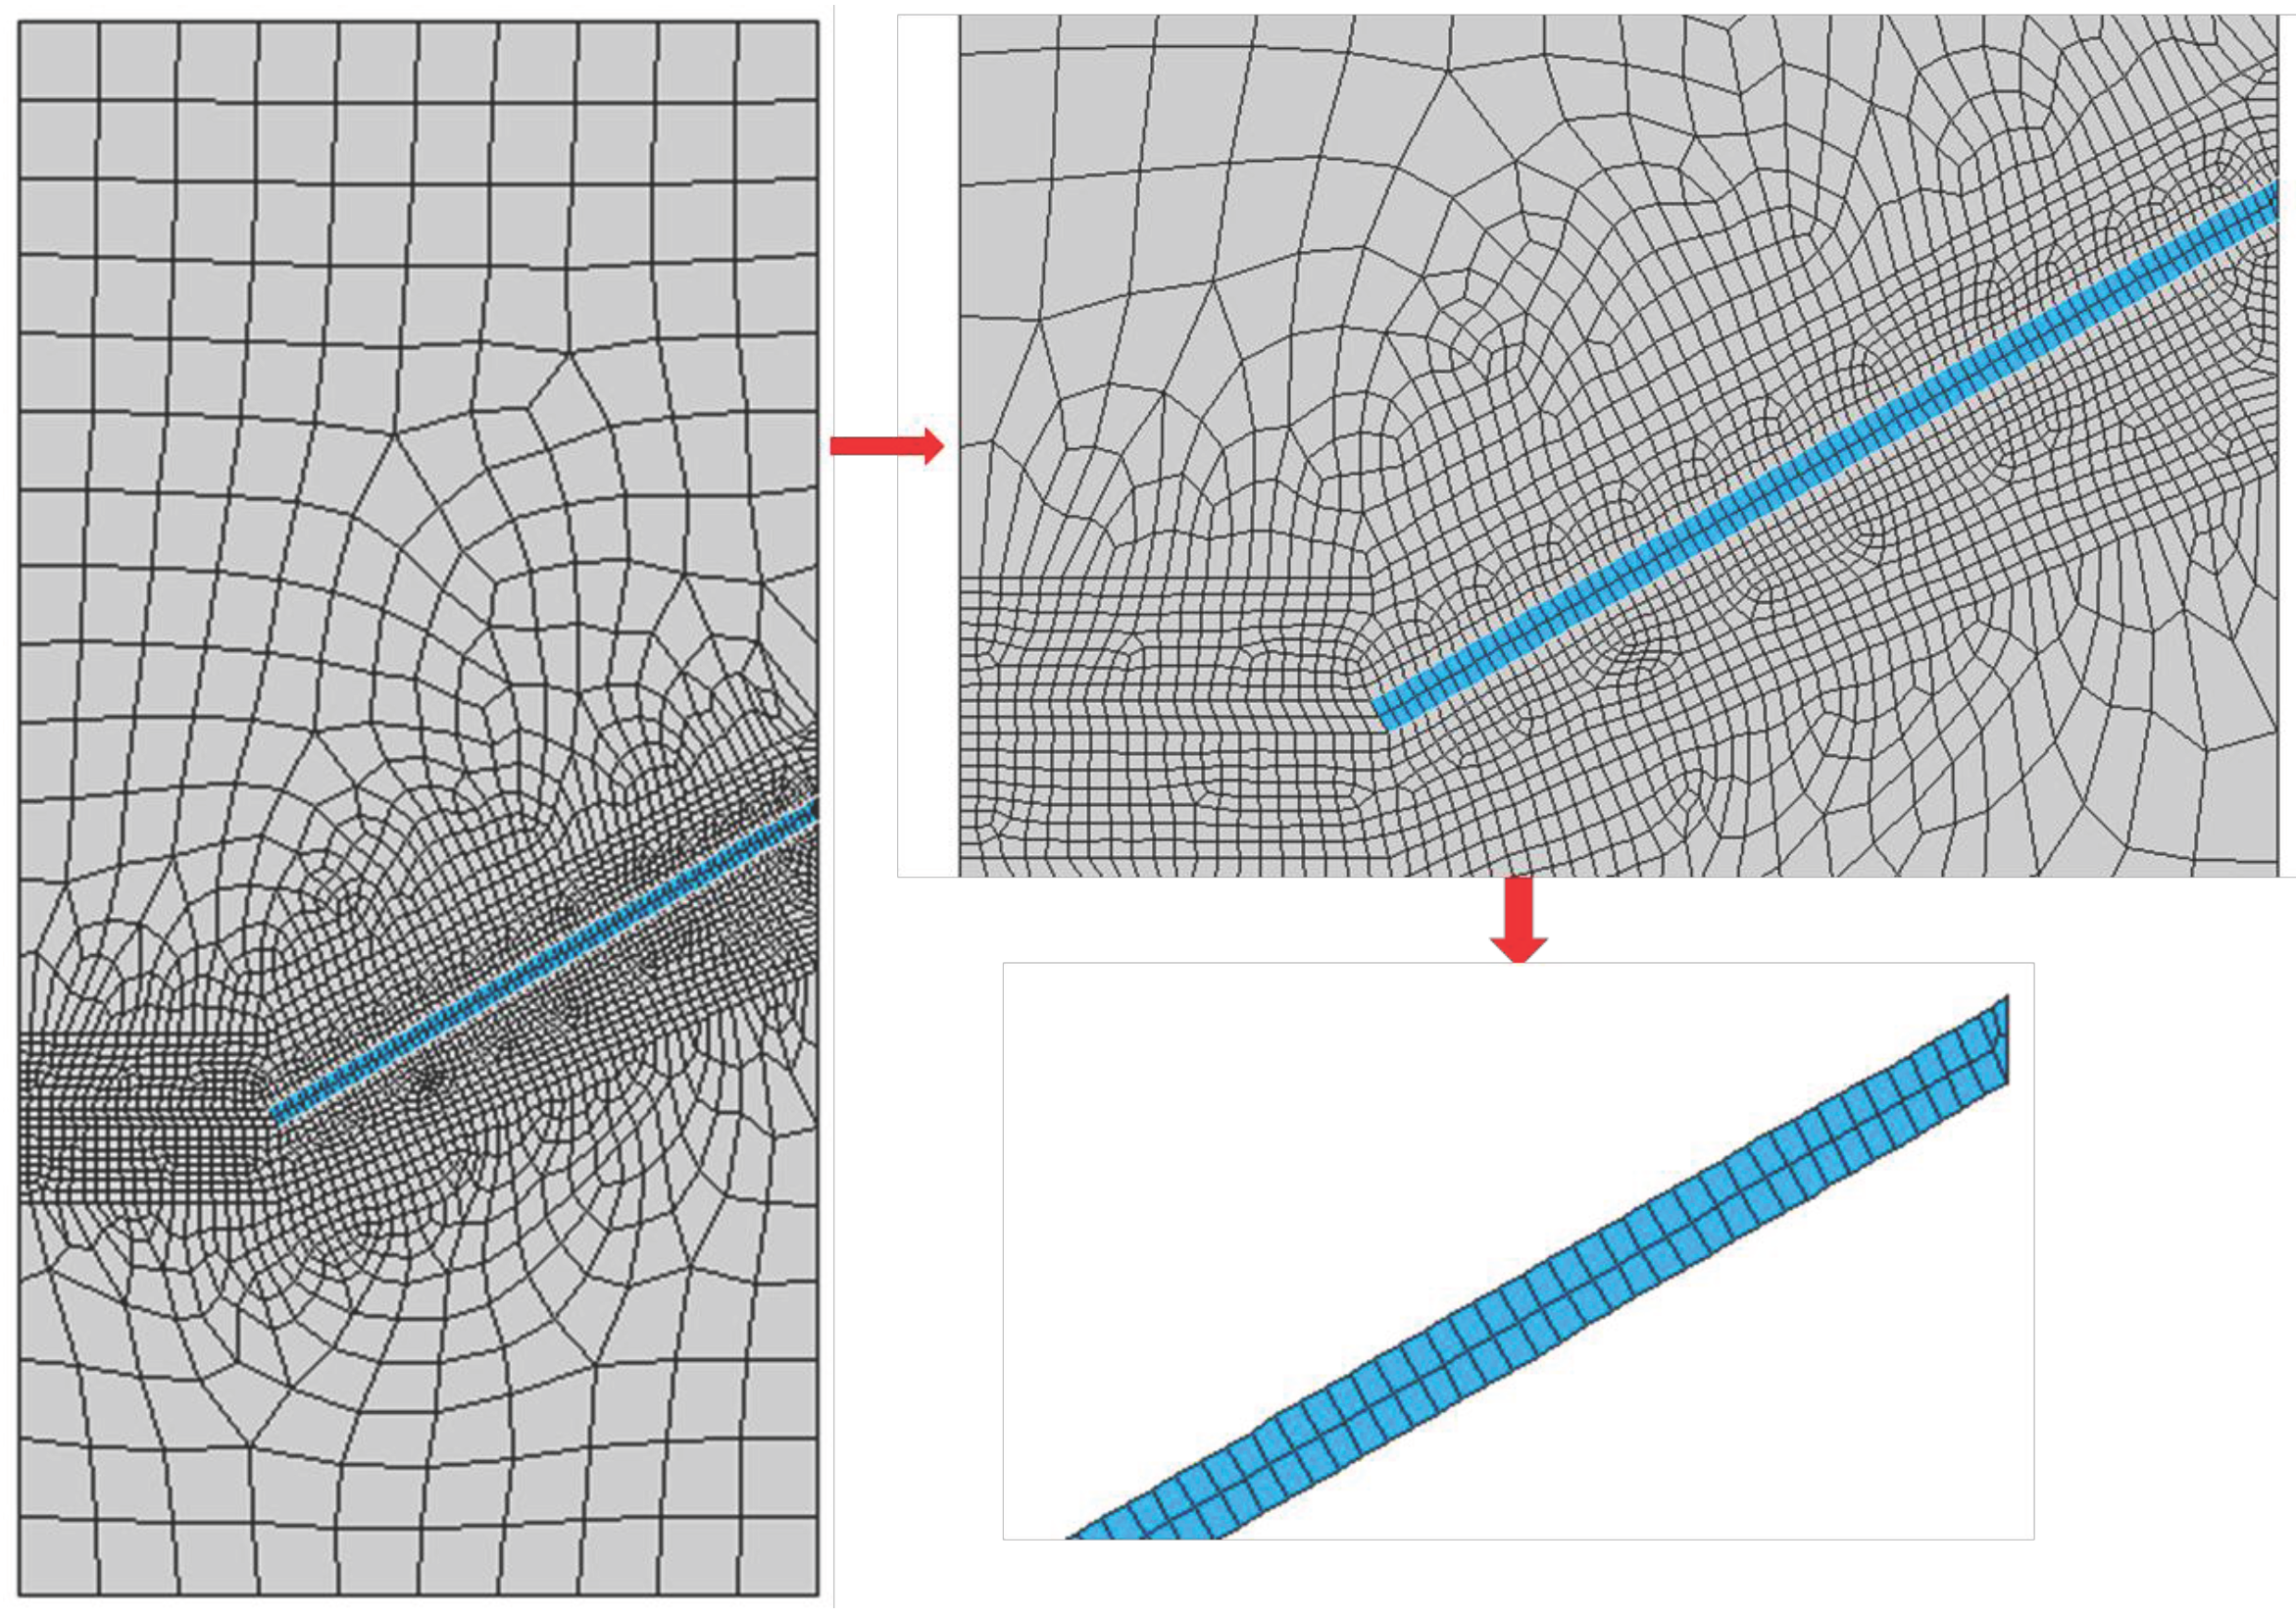
Figure 5.
Typical mesh (left), zoomed in around the fiber (top right) and discretisation of the fiber (bottom right).
Figure 5.
Typical mesh (left), zoomed in around the fiber (top right) and discretisation of the fiber (bottom right).
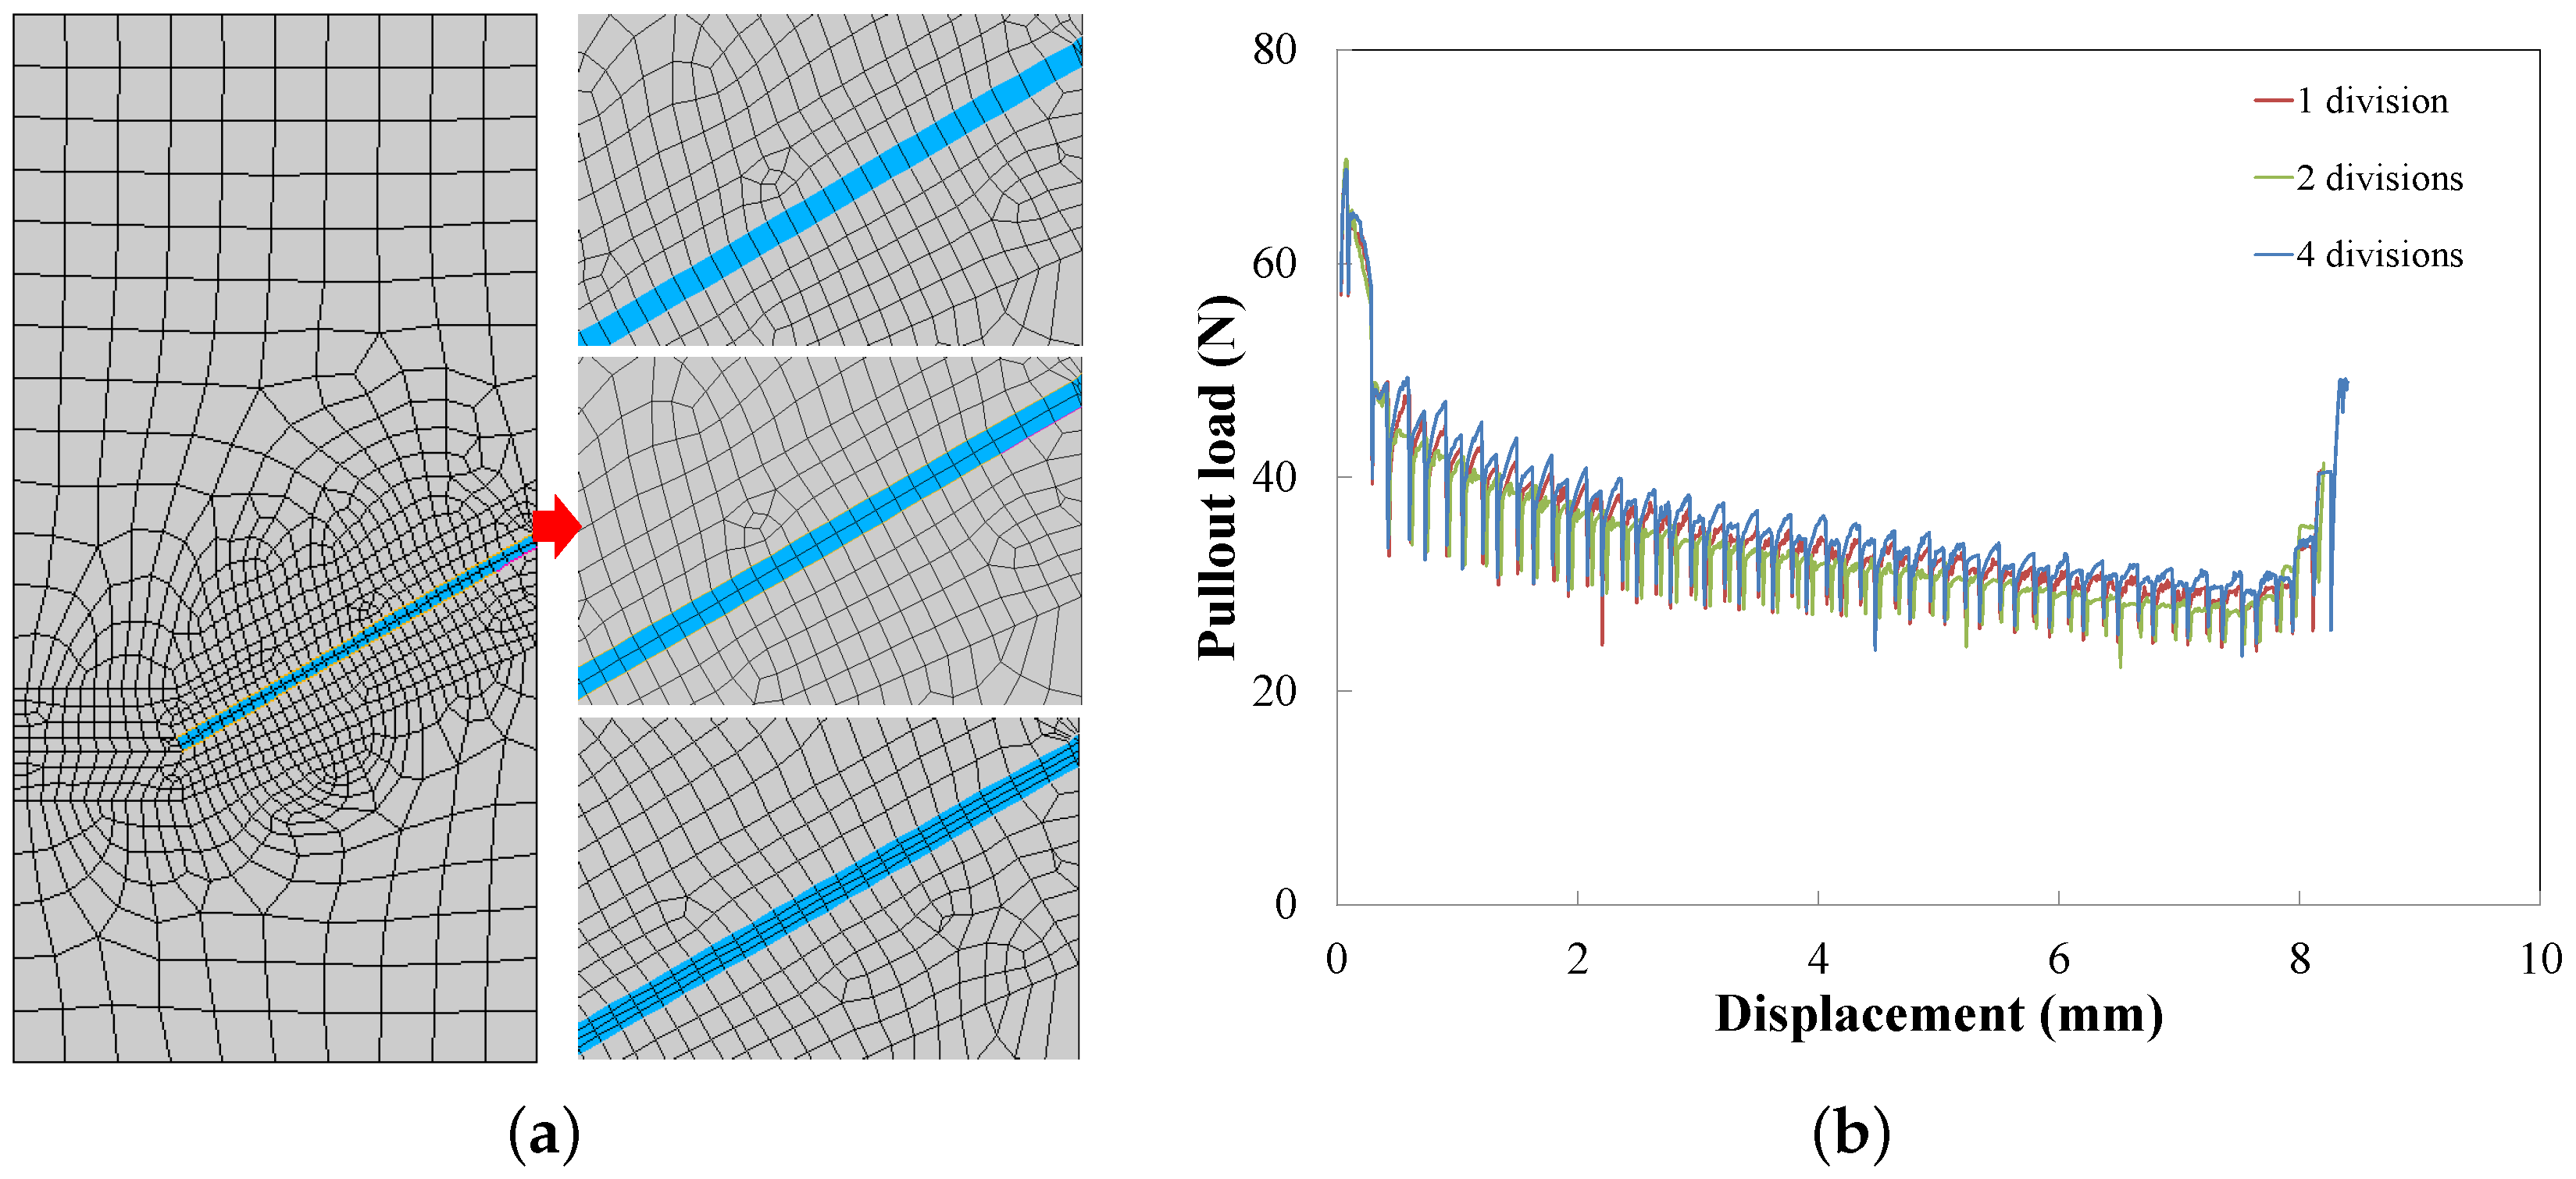
Figure 6.
(a) Different numbers of divisions in the fiber transverse direction (one, two and four); and (b) the corresponding pullout load vs. displacement responses.
Figure 6.
(a) Different numbers of divisions in the fiber transverse direction (one, two and four); and (b) the corresponding pullout load vs. displacement responses.
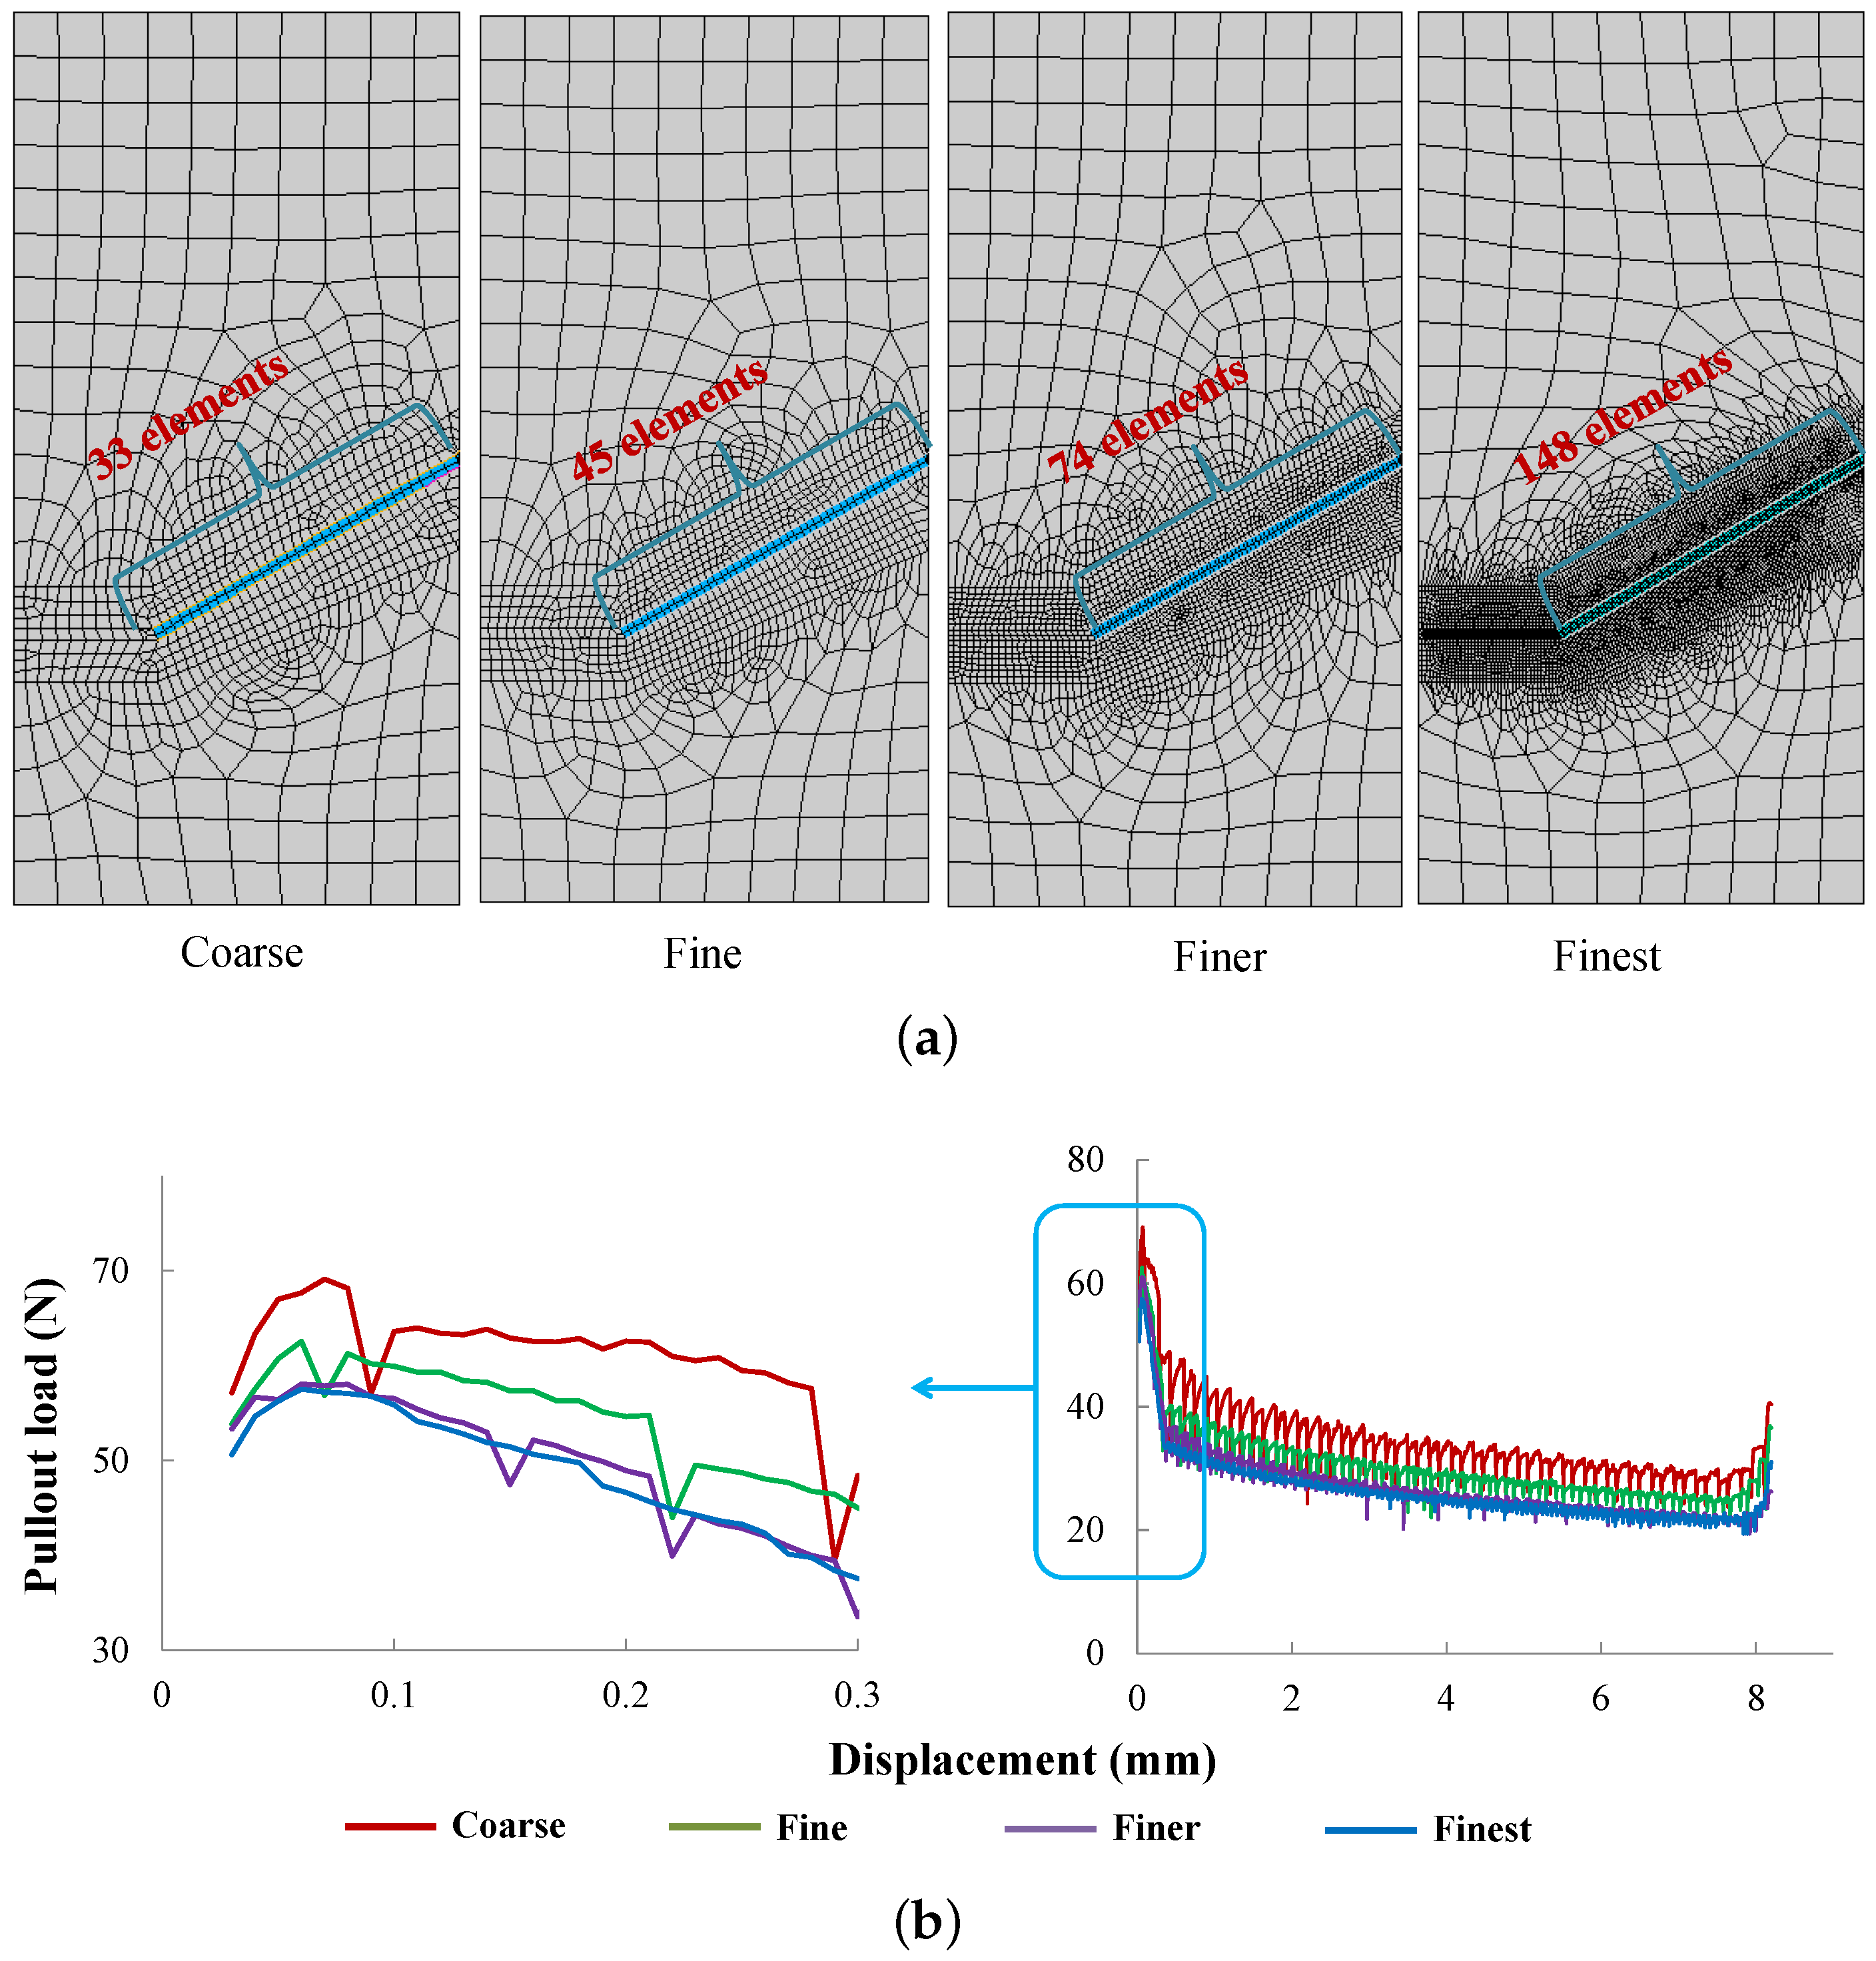
Figure 7.
(a) Different element sizes (number of divisions) along the fiber; and (b) the corresponding pullout load-displacement responses.
Figure 7.
(a) Different element sizes (number of divisions) along the fiber; and (b) the corresponding pullout load-displacement responses.
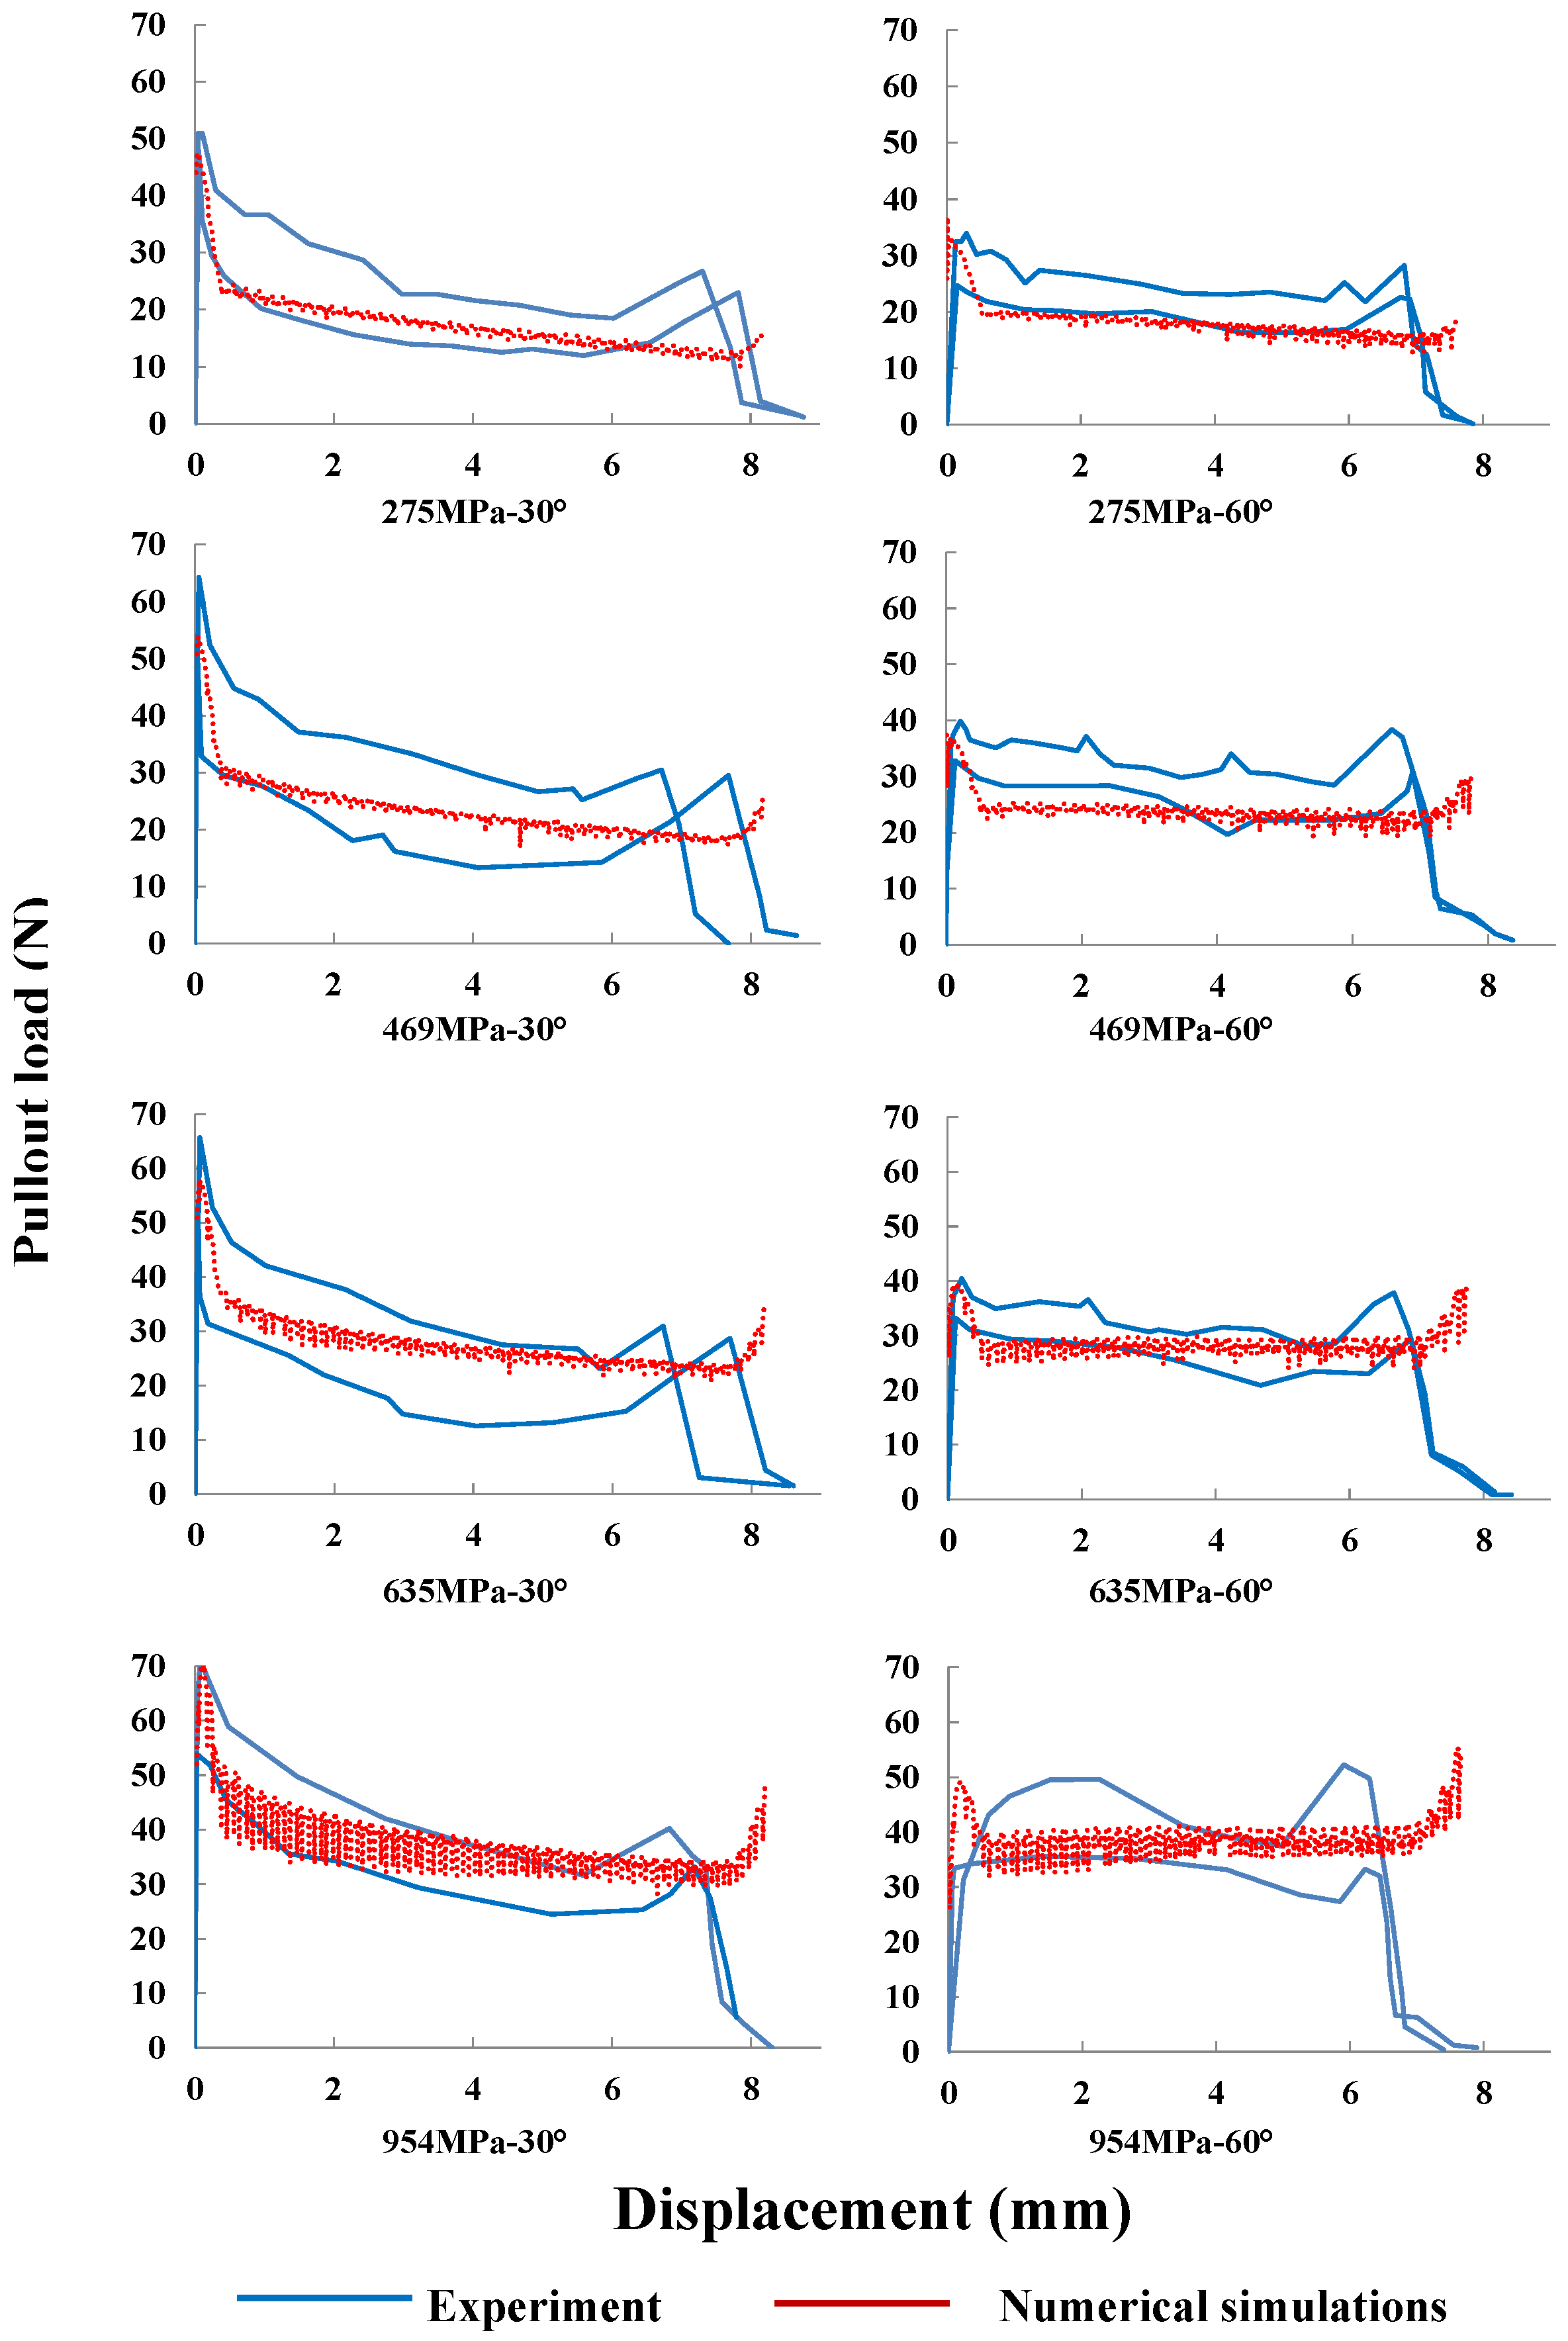
Figure 8.
Numerical-experimental [
26] comparison: complete pullout curves for the four yield strengths given in
Table 2; the fiber is inclined either at 30
(
left column) or 60
(
right column).
Figure 8.
Numerical-experimental [
26] comparison: complete pullout curves for the four yield strengths given in
Table 2; the fiber is inclined either at 30
(
left column) or 60
(
right column).
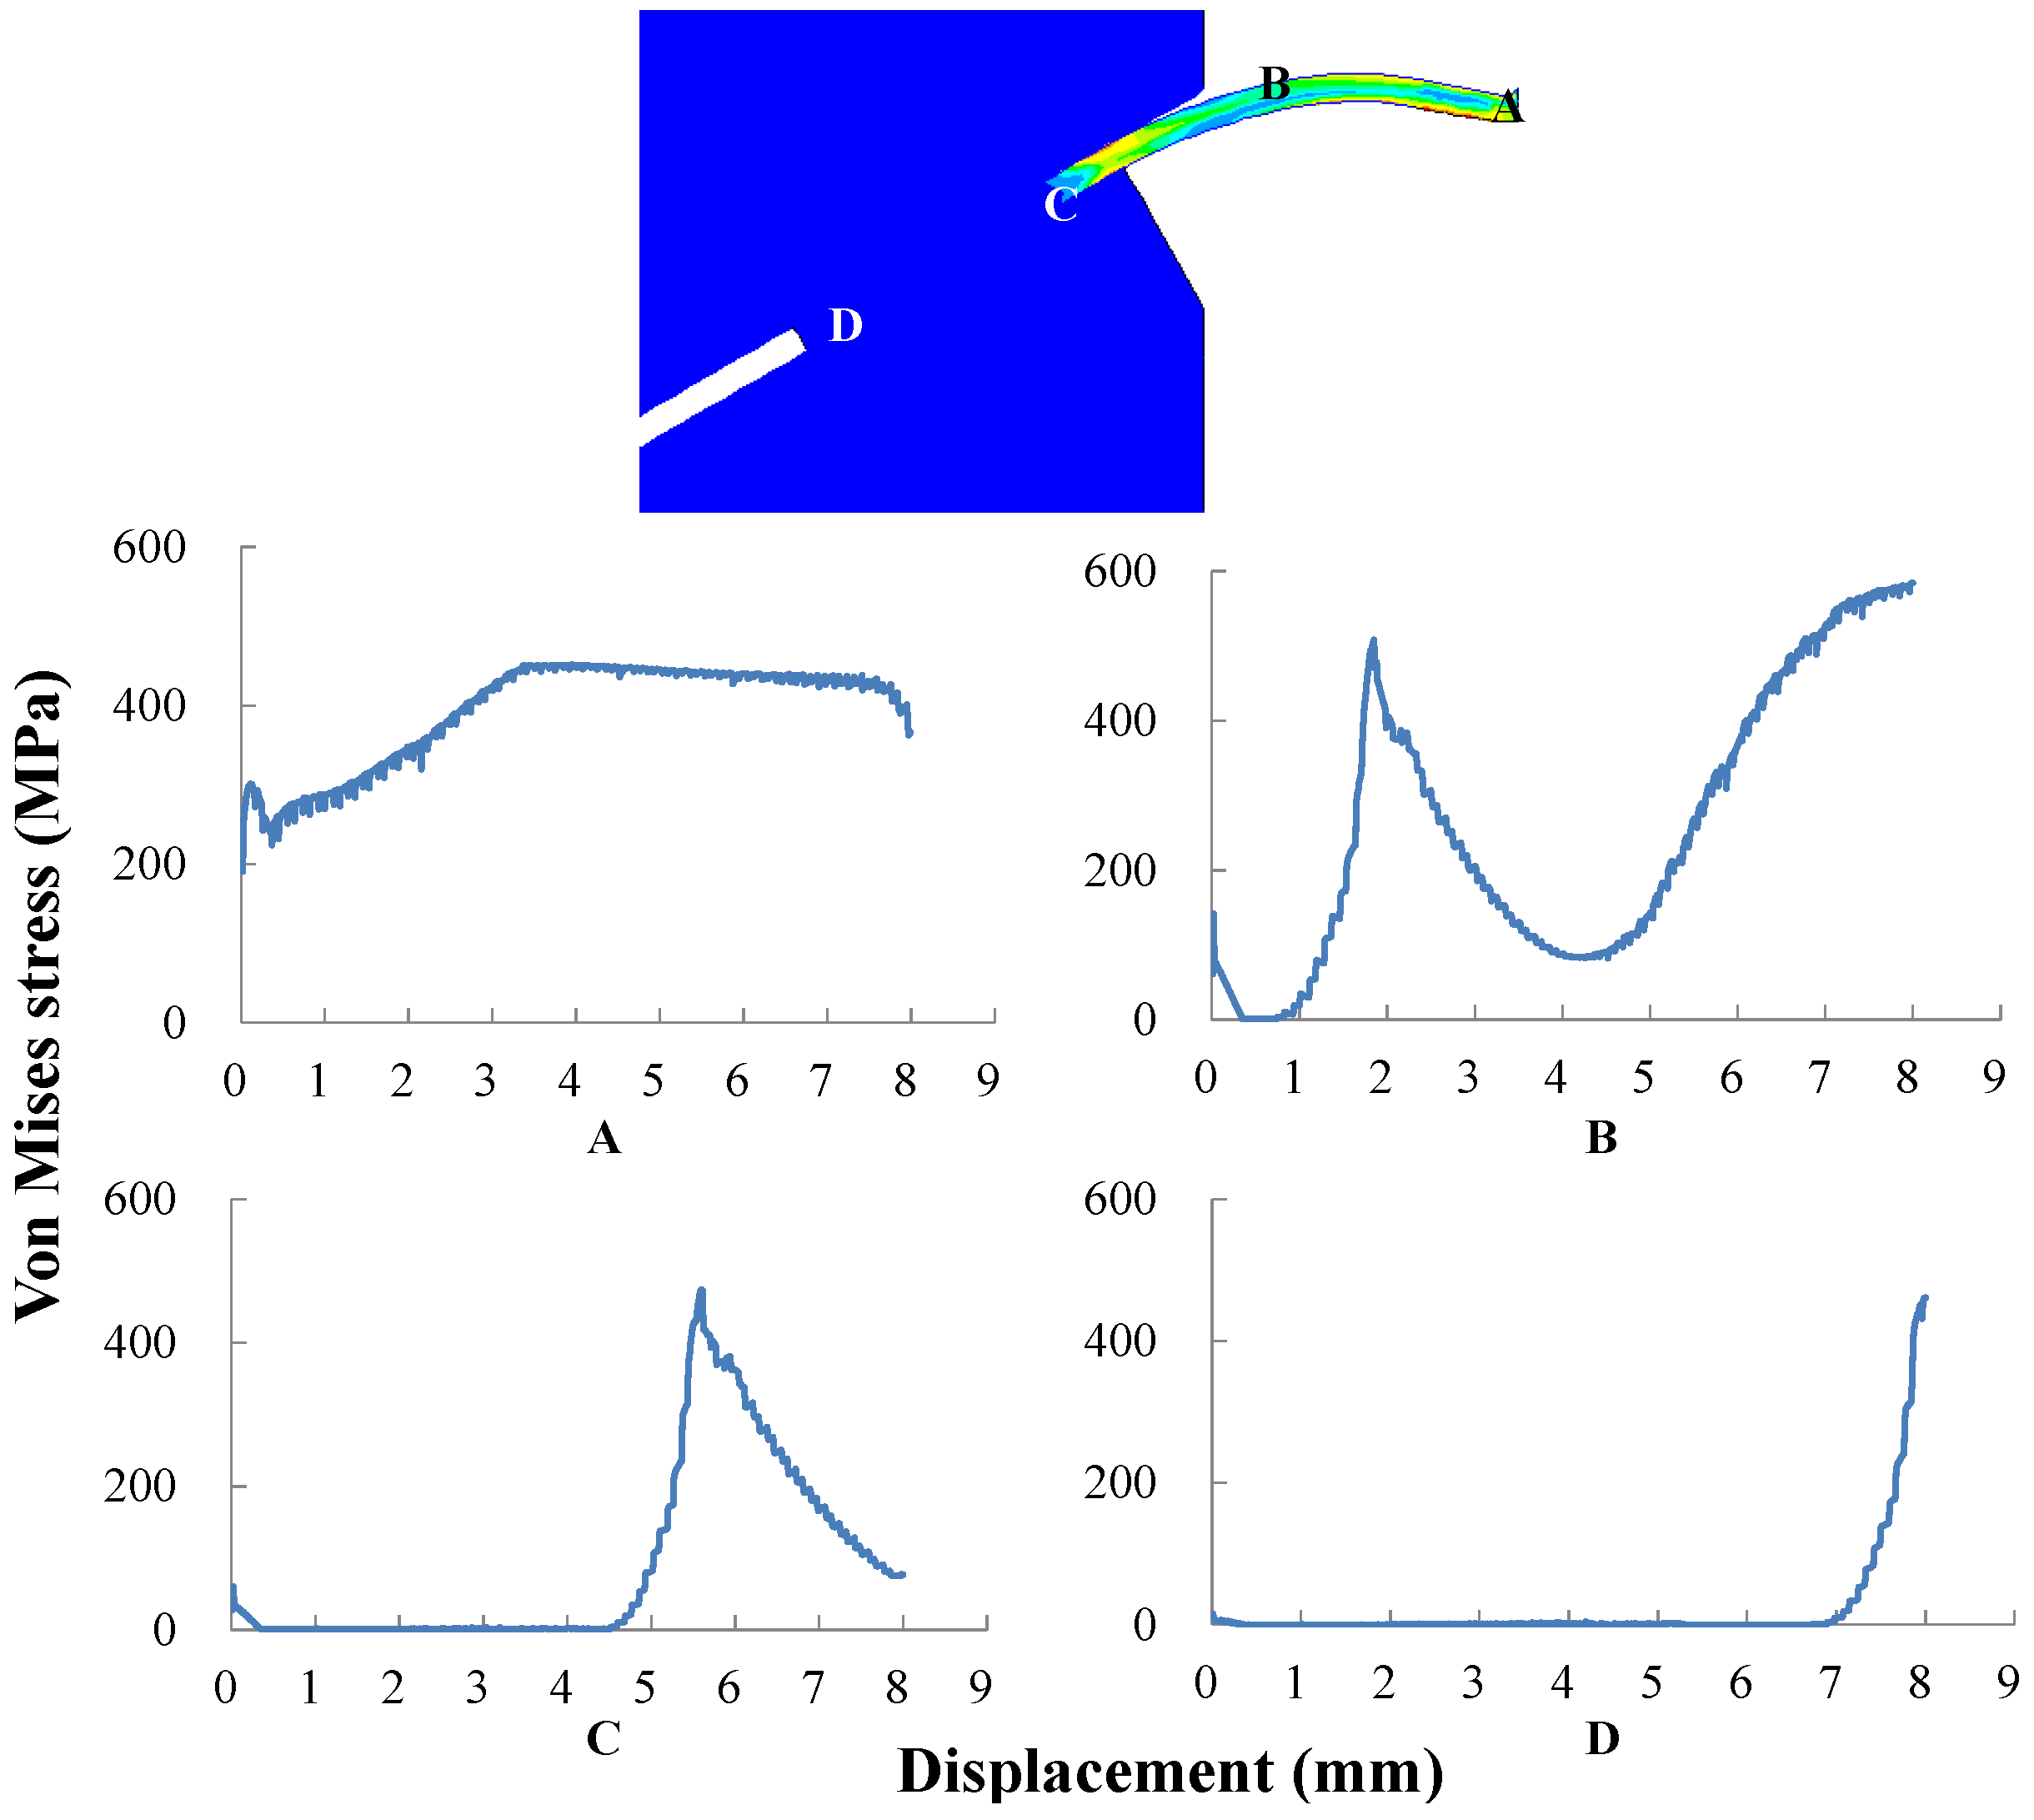
Figure 9.
Four positions (A, B, C and D) within the fiber during pullout and the corresponding von Mises stress evolutions for Type 2 fibers (fiber yield strength 469 MPa).
Figure 9.
Four positions (A, B, C and D) within the fiber during pullout and the corresponding von Mises stress evolutions for Type 2 fibers (fiber yield strength 469 MPa).
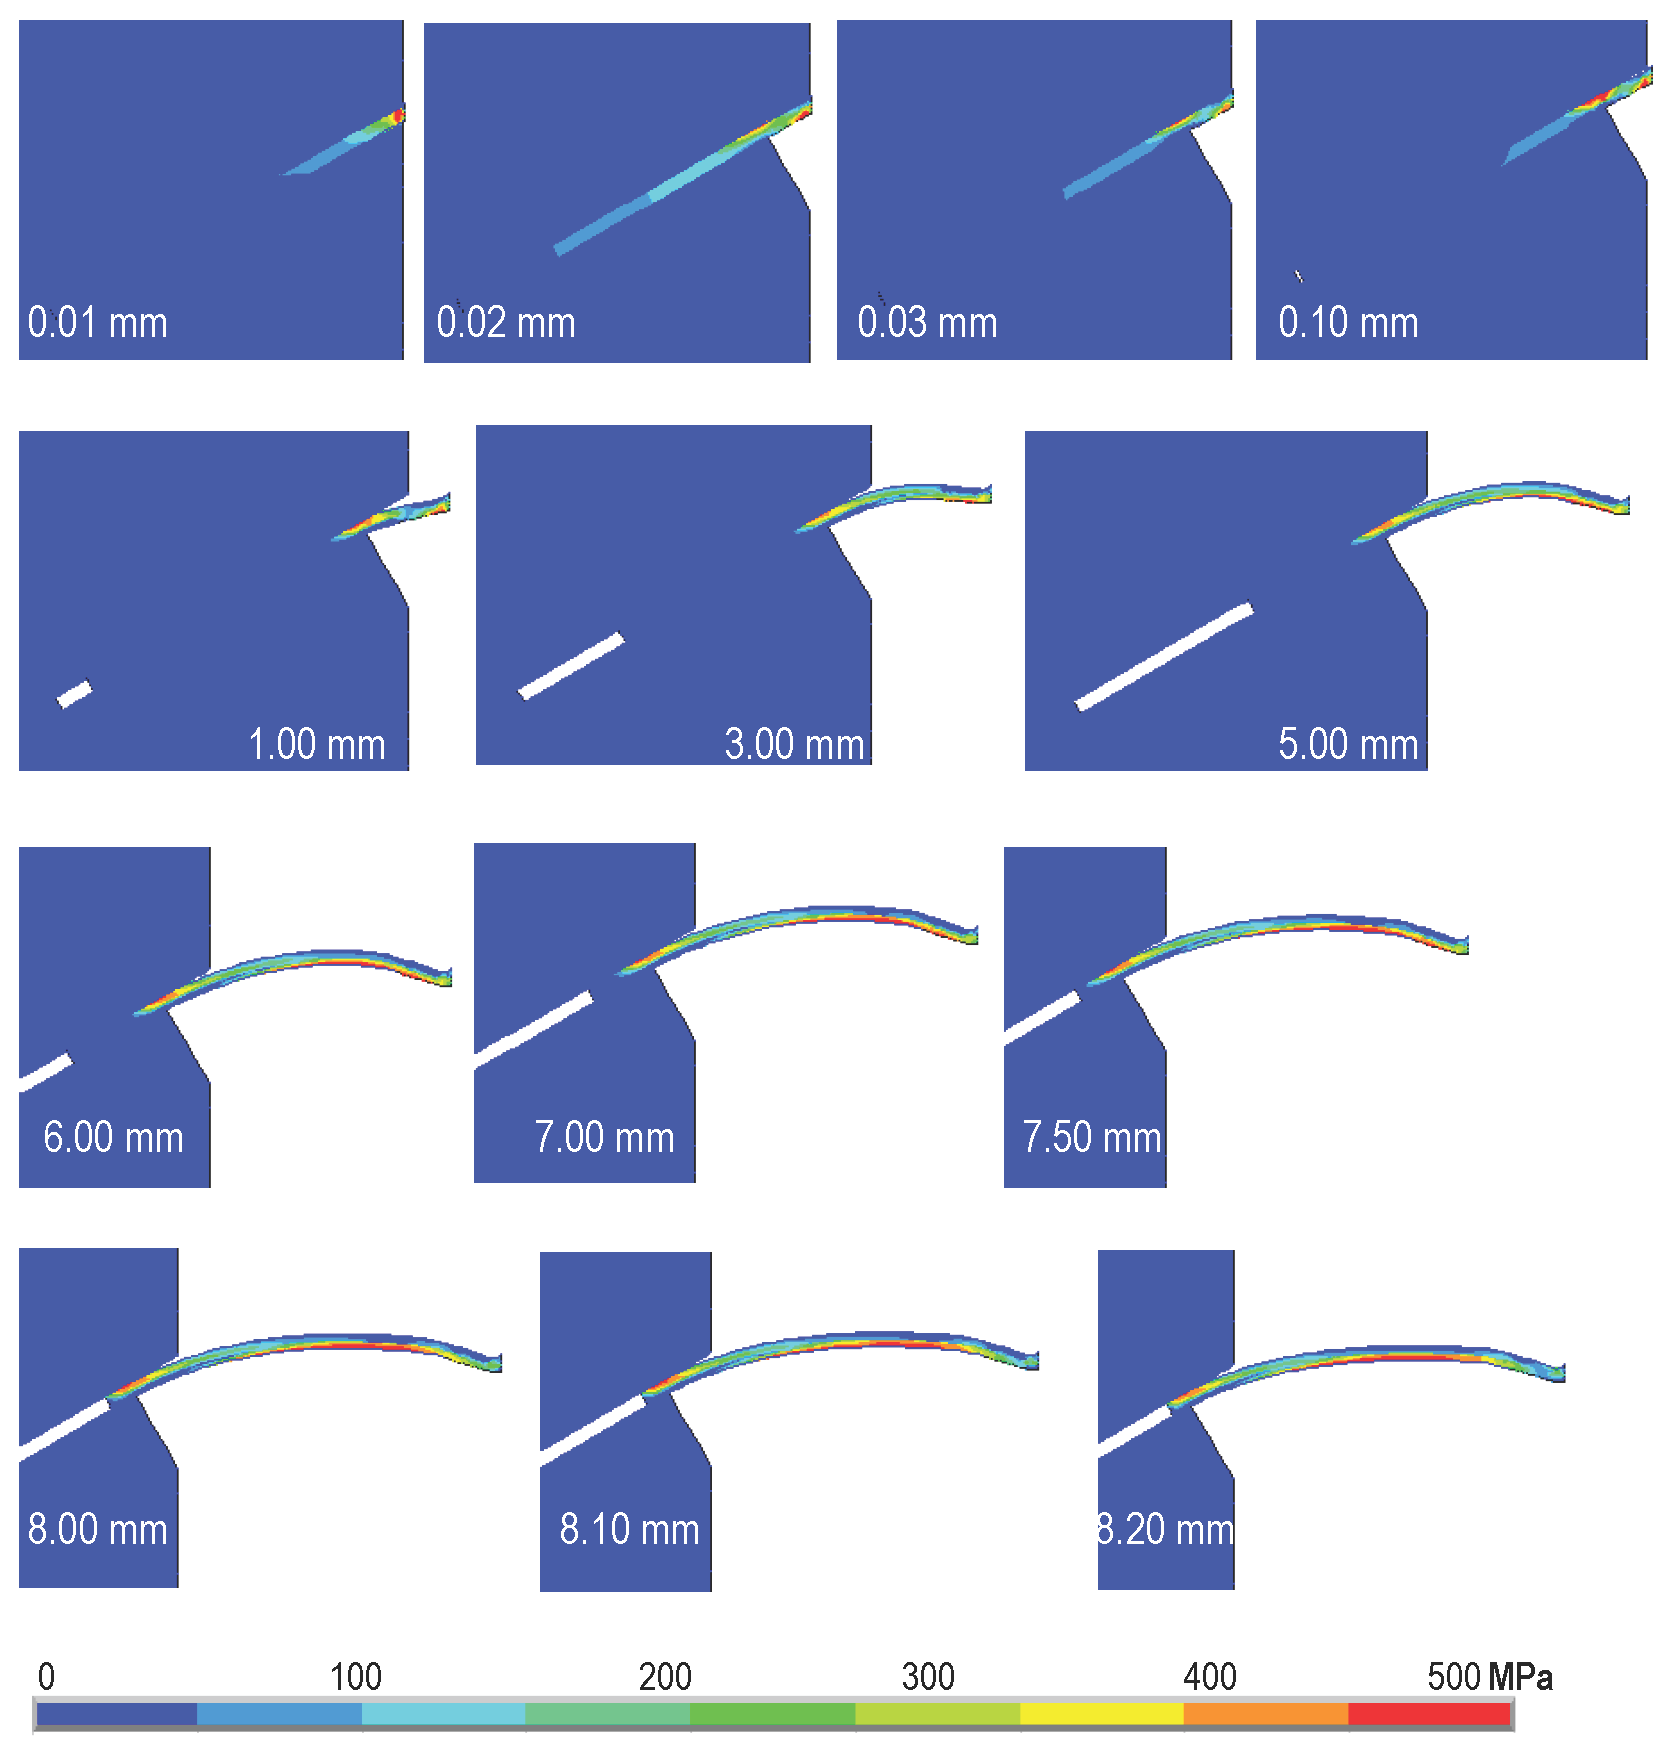
Figure 10.
The first principal stress evolution for pullout displacement from 0.01 mm to 8.20 mm for a fiber inclination of 30
and a yield strength of 469 MPa (Type 2 in
Table 2).
Figure 10.
The first principal stress evolution for pullout displacement from 0.01 mm to 8.20 mm for a fiber inclination of 30
and a yield strength of 469 MPa (Type 2 in
Table 2).
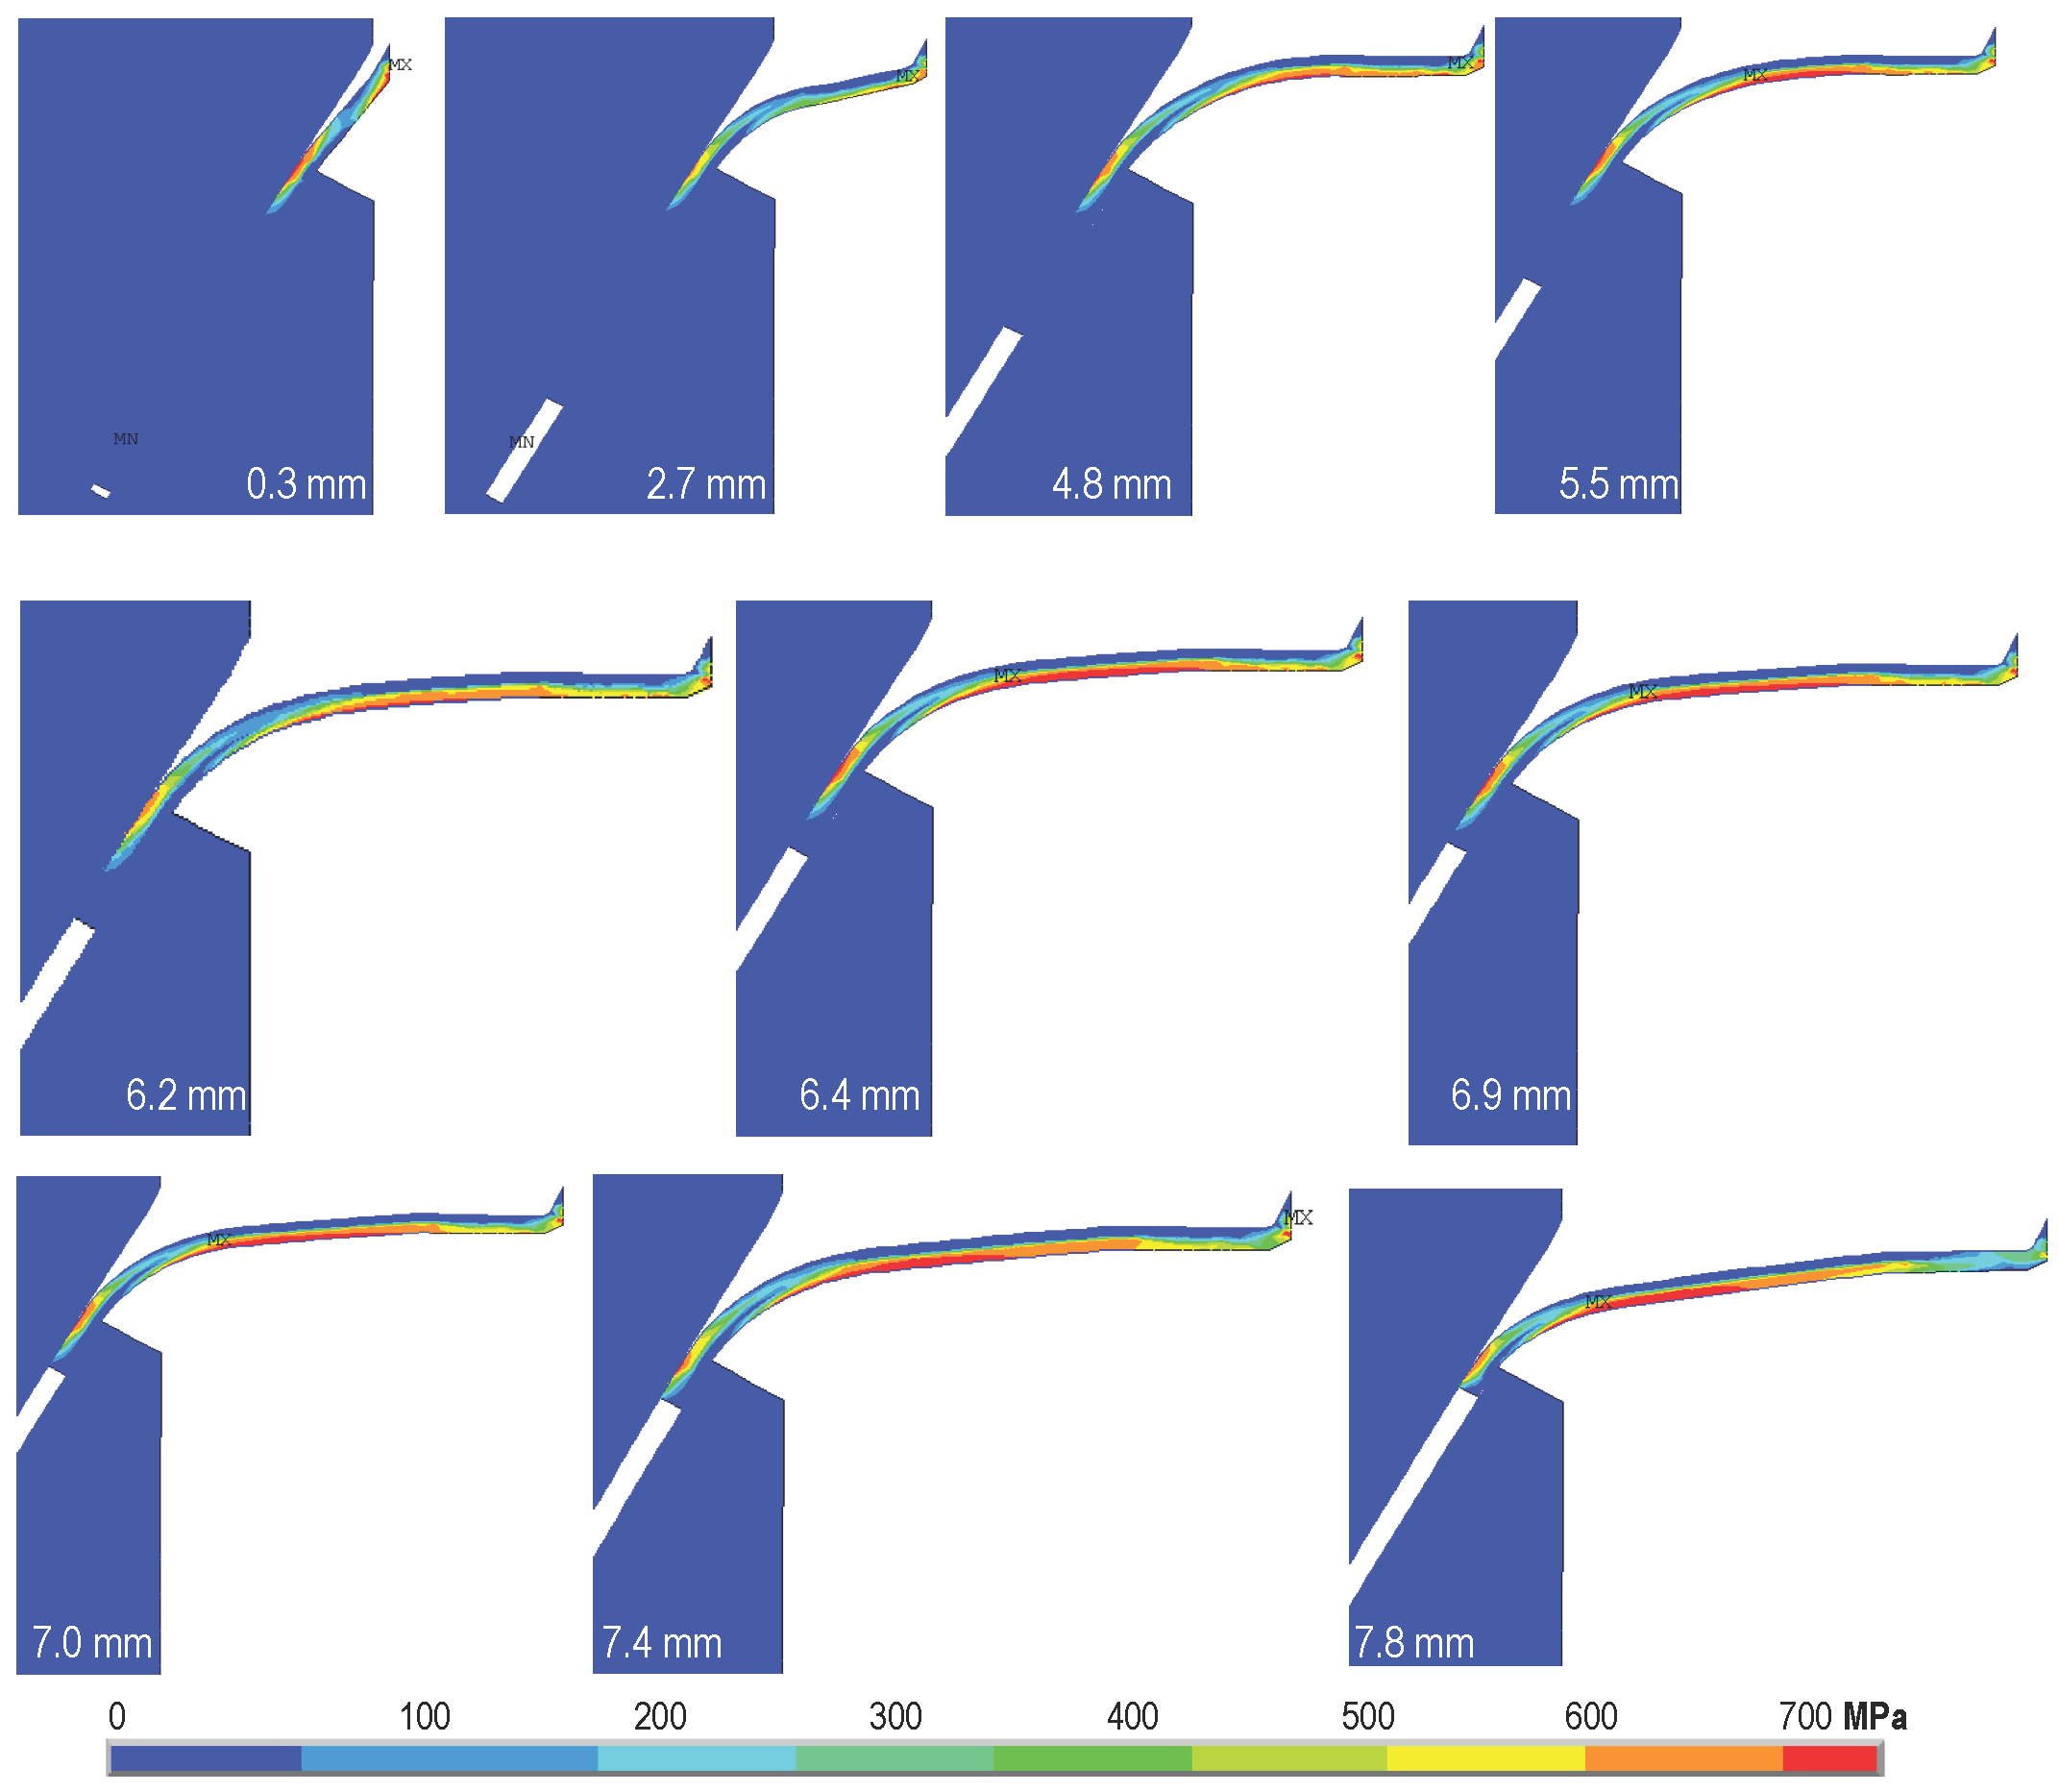
Figure 11.
The first principal stress evolution for pullout displacement from 0.3 mm to 7.8 mm for a fiber inclination of 60
and a yield strength of 635 MPa (Type 3 in
Table 2).
Figure 11.
The first principal stress evolution for pullout displacement from 0.3 mm to 7.8 mm for a fiber inclination of 60
and a yield strength of 635 MPa (Type 3 in
Table 2).
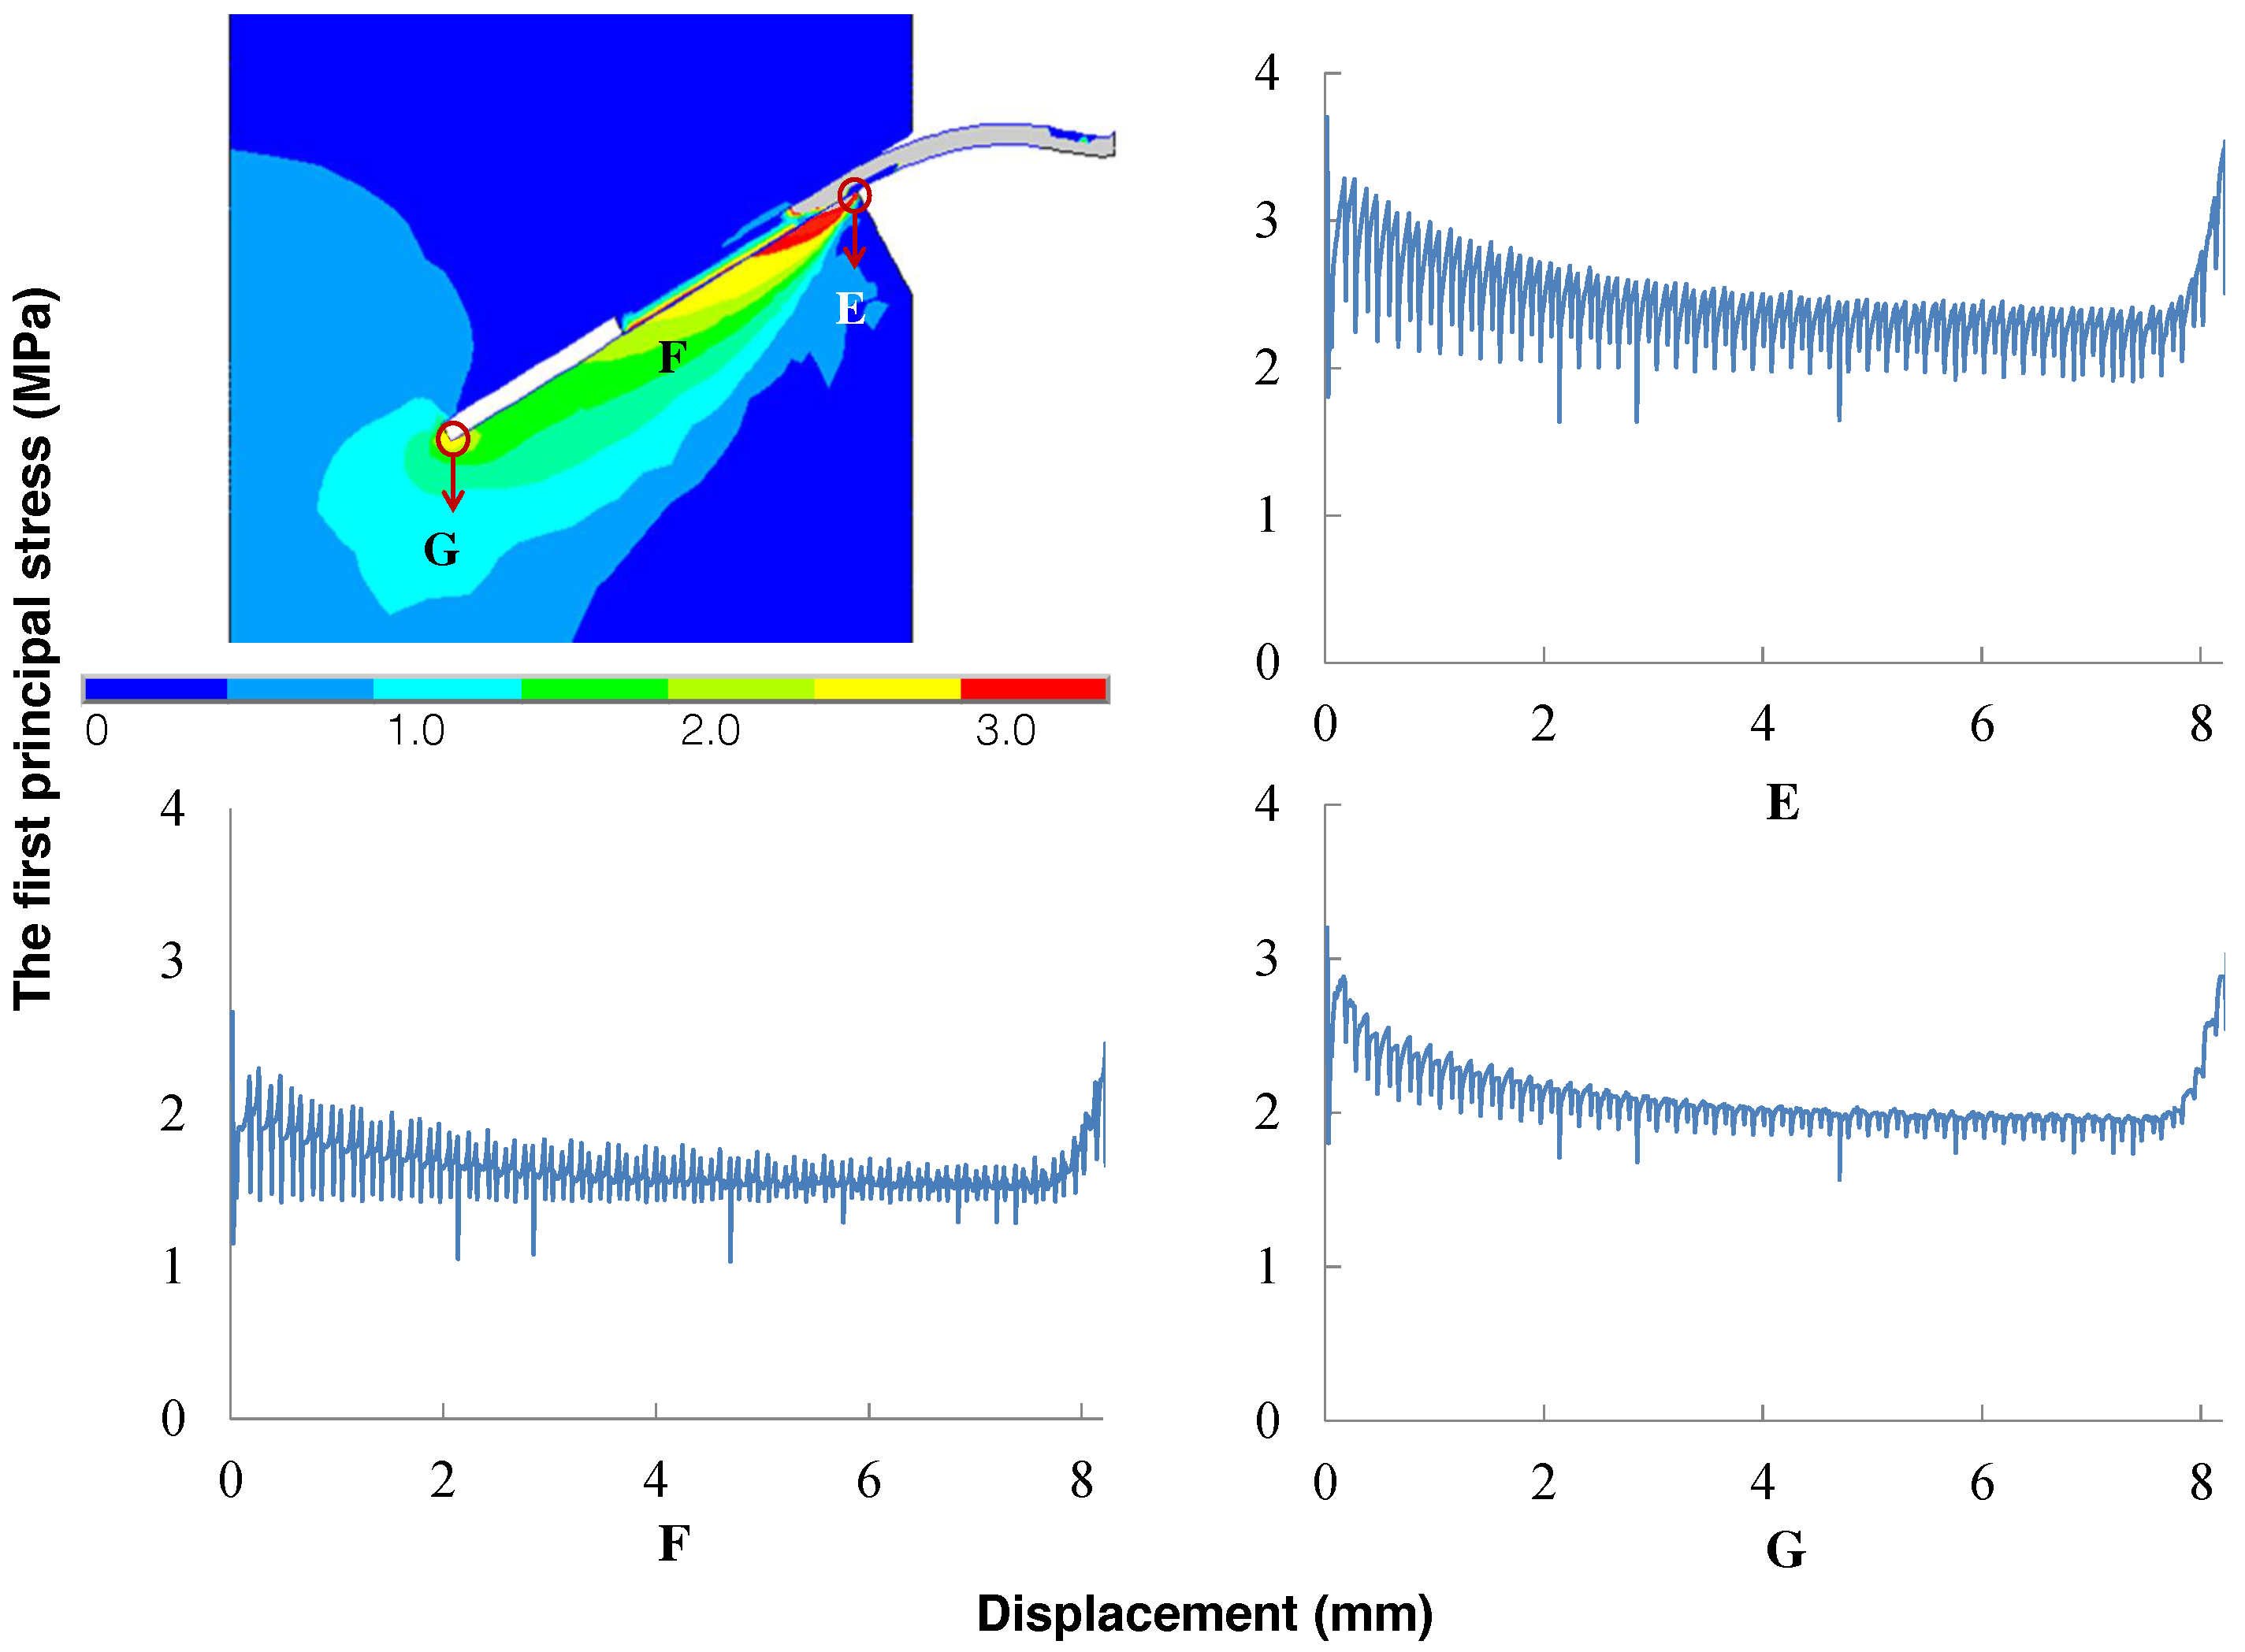
Figure 12.
Three positions (E, F and G) in the matrix and the corresponding first principal stress evolutions during the pullout process.
Figure 12.
Three positions (E, F and G) in the matrix and the corresponding first principal stress evolutions during the pullout process.
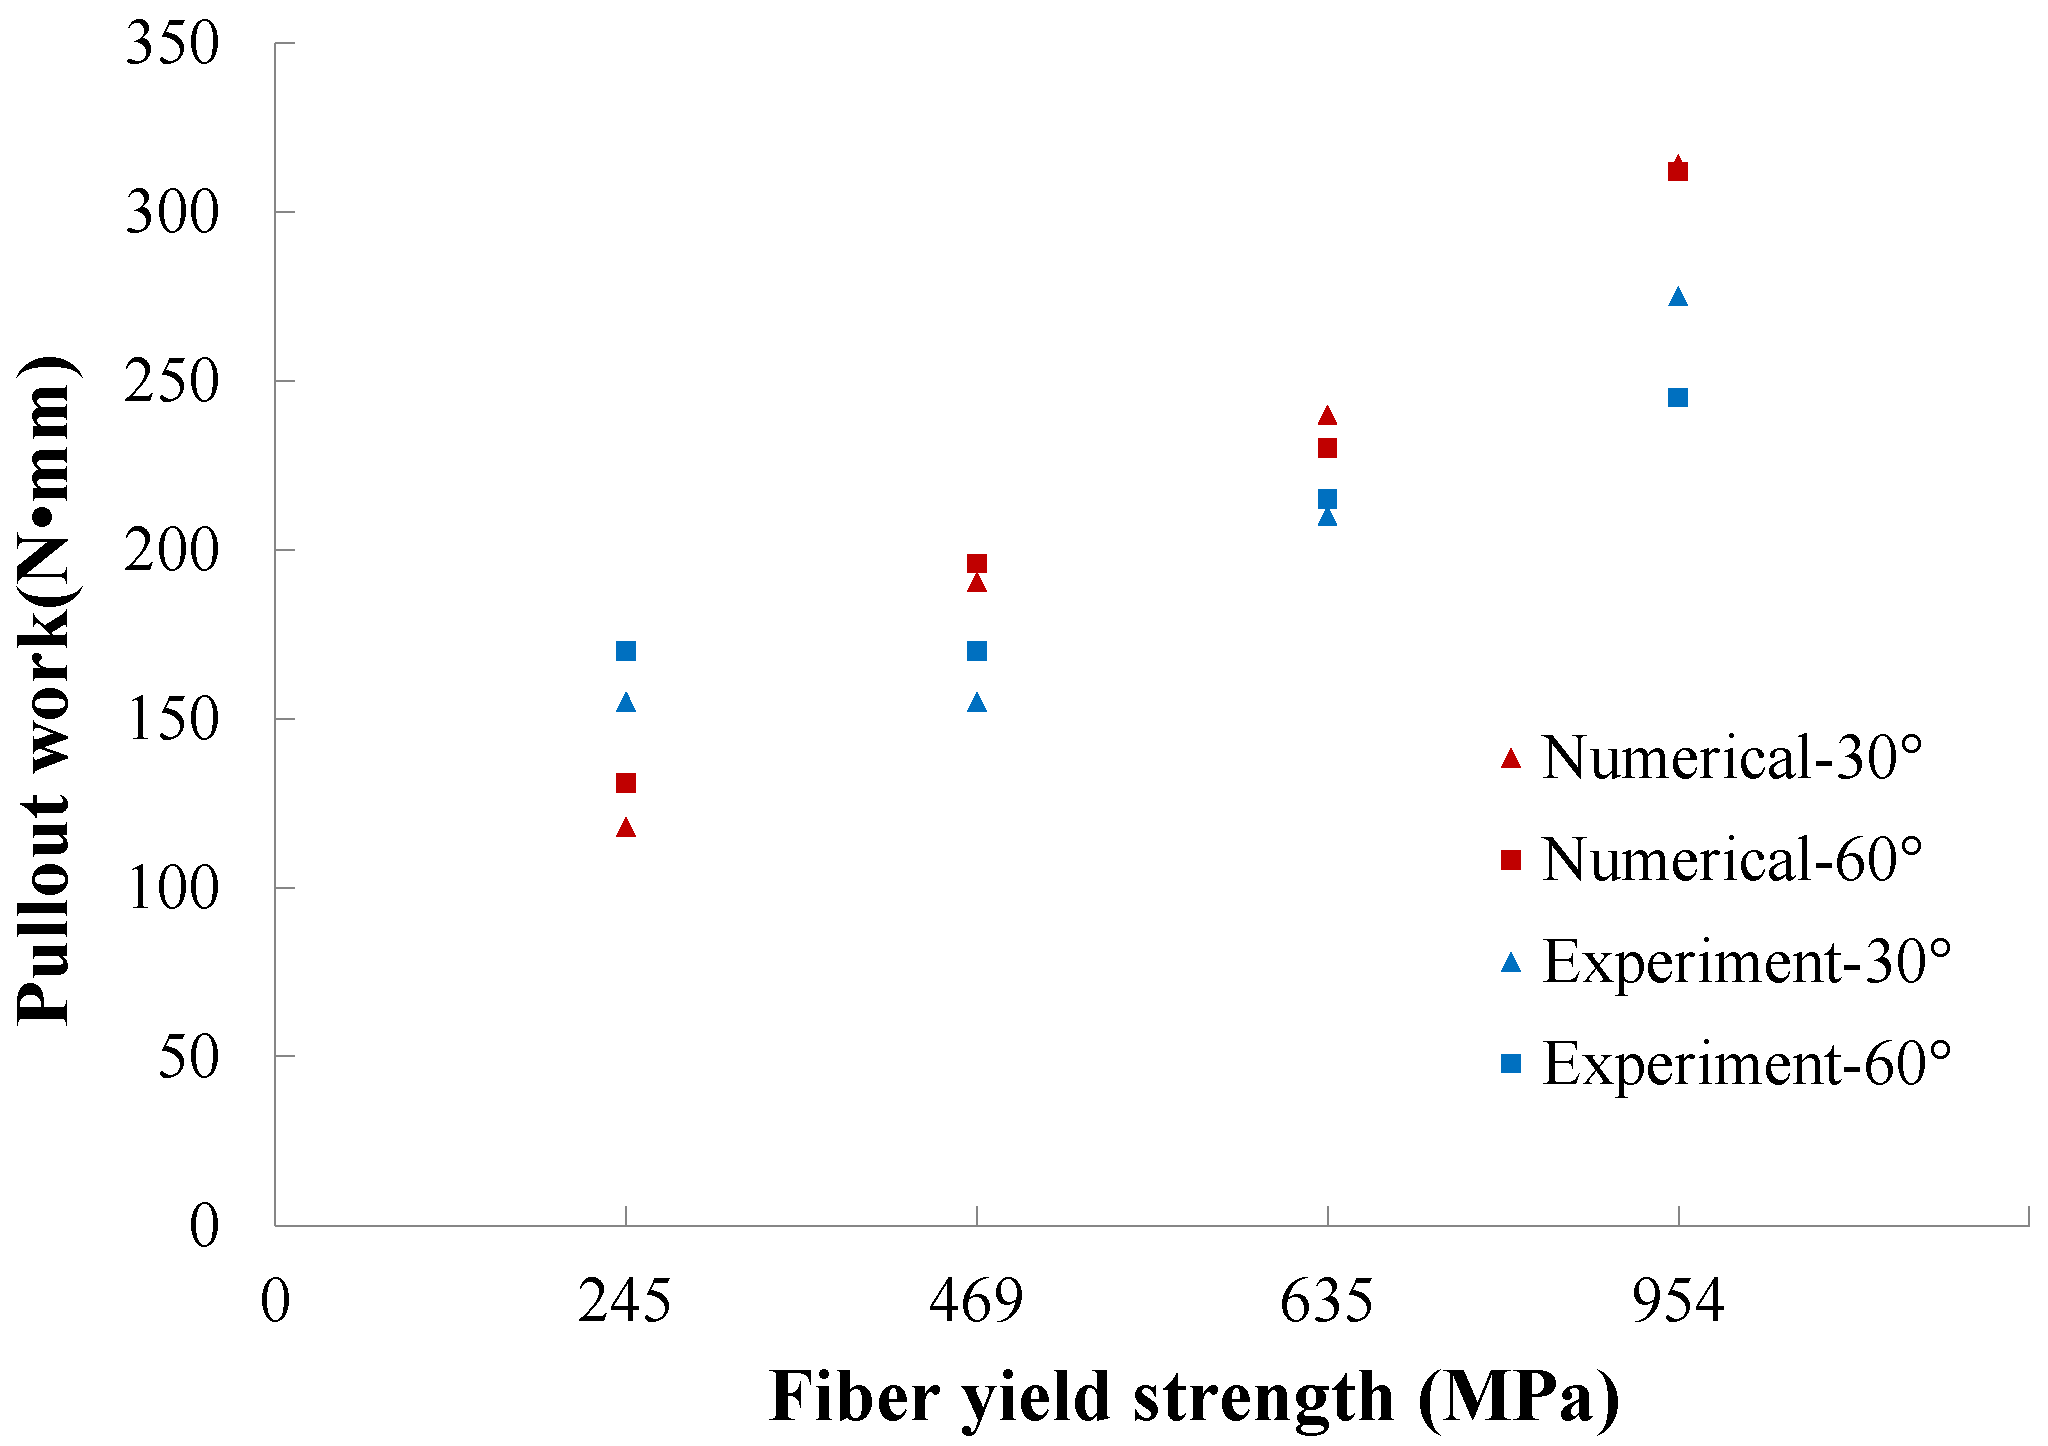
Figure 13.
Pullout work vs. fiber yield strength.
Figure 13.
Pullout work vs. fiber yield strength.
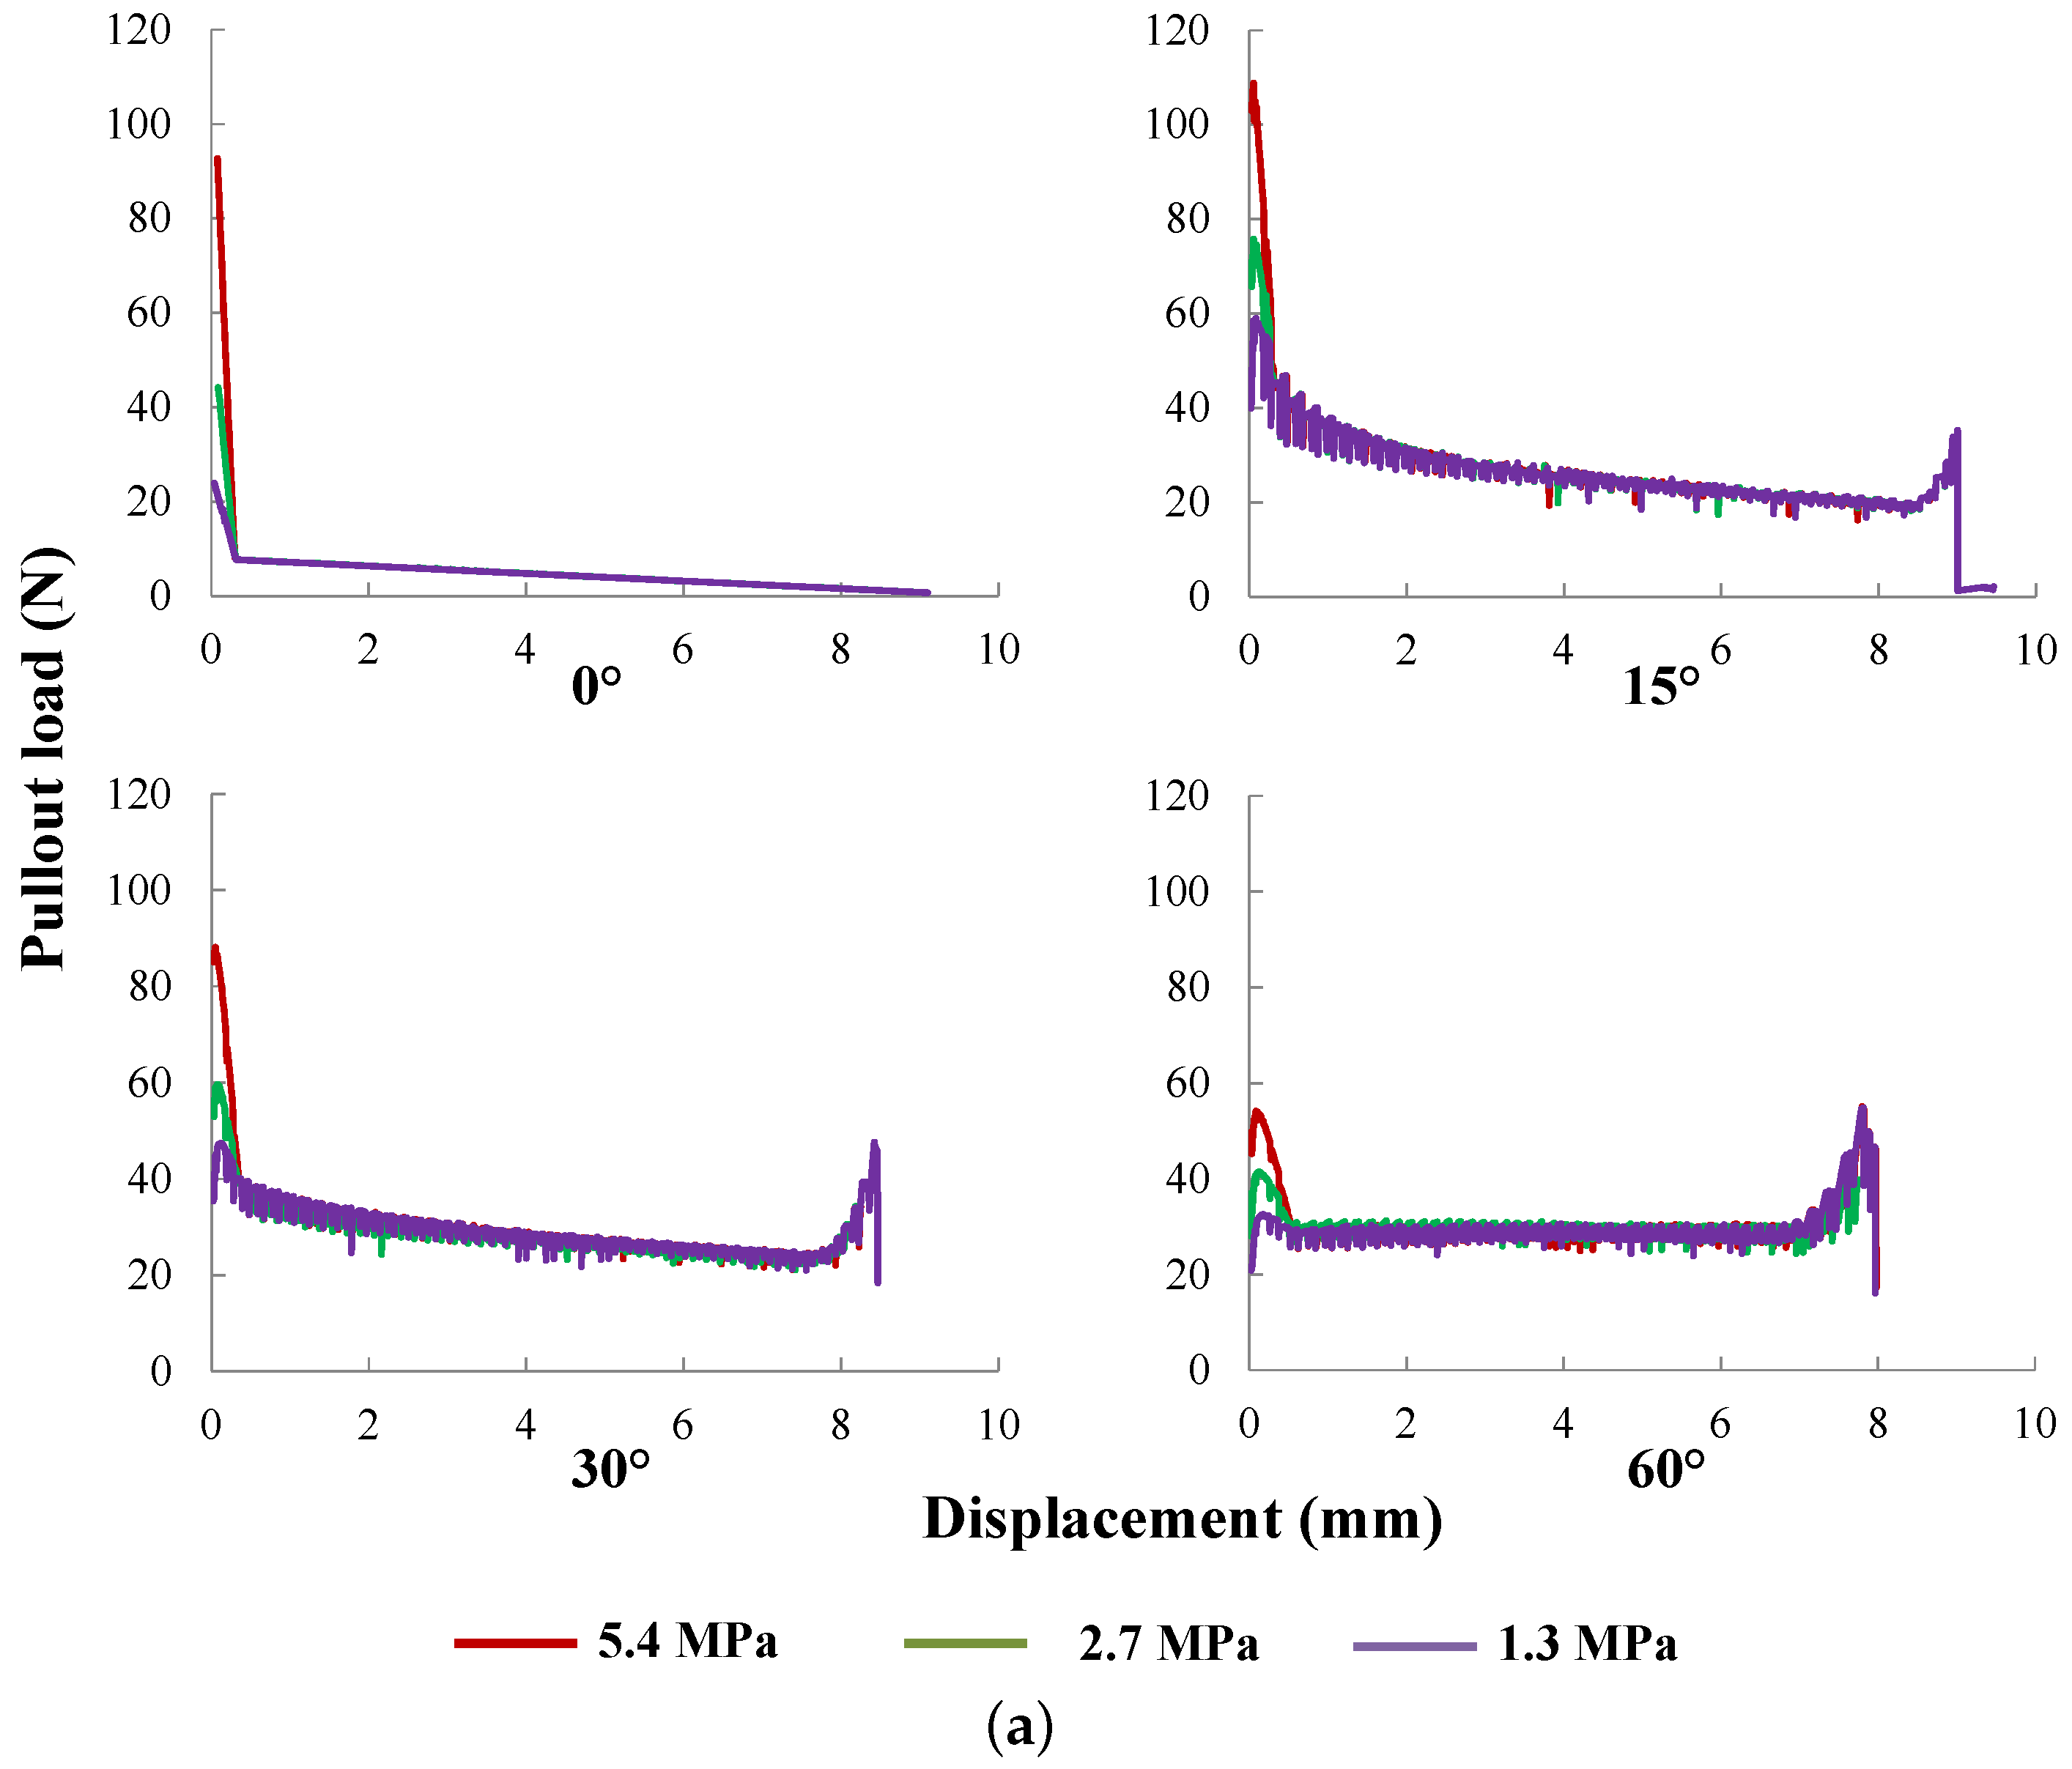
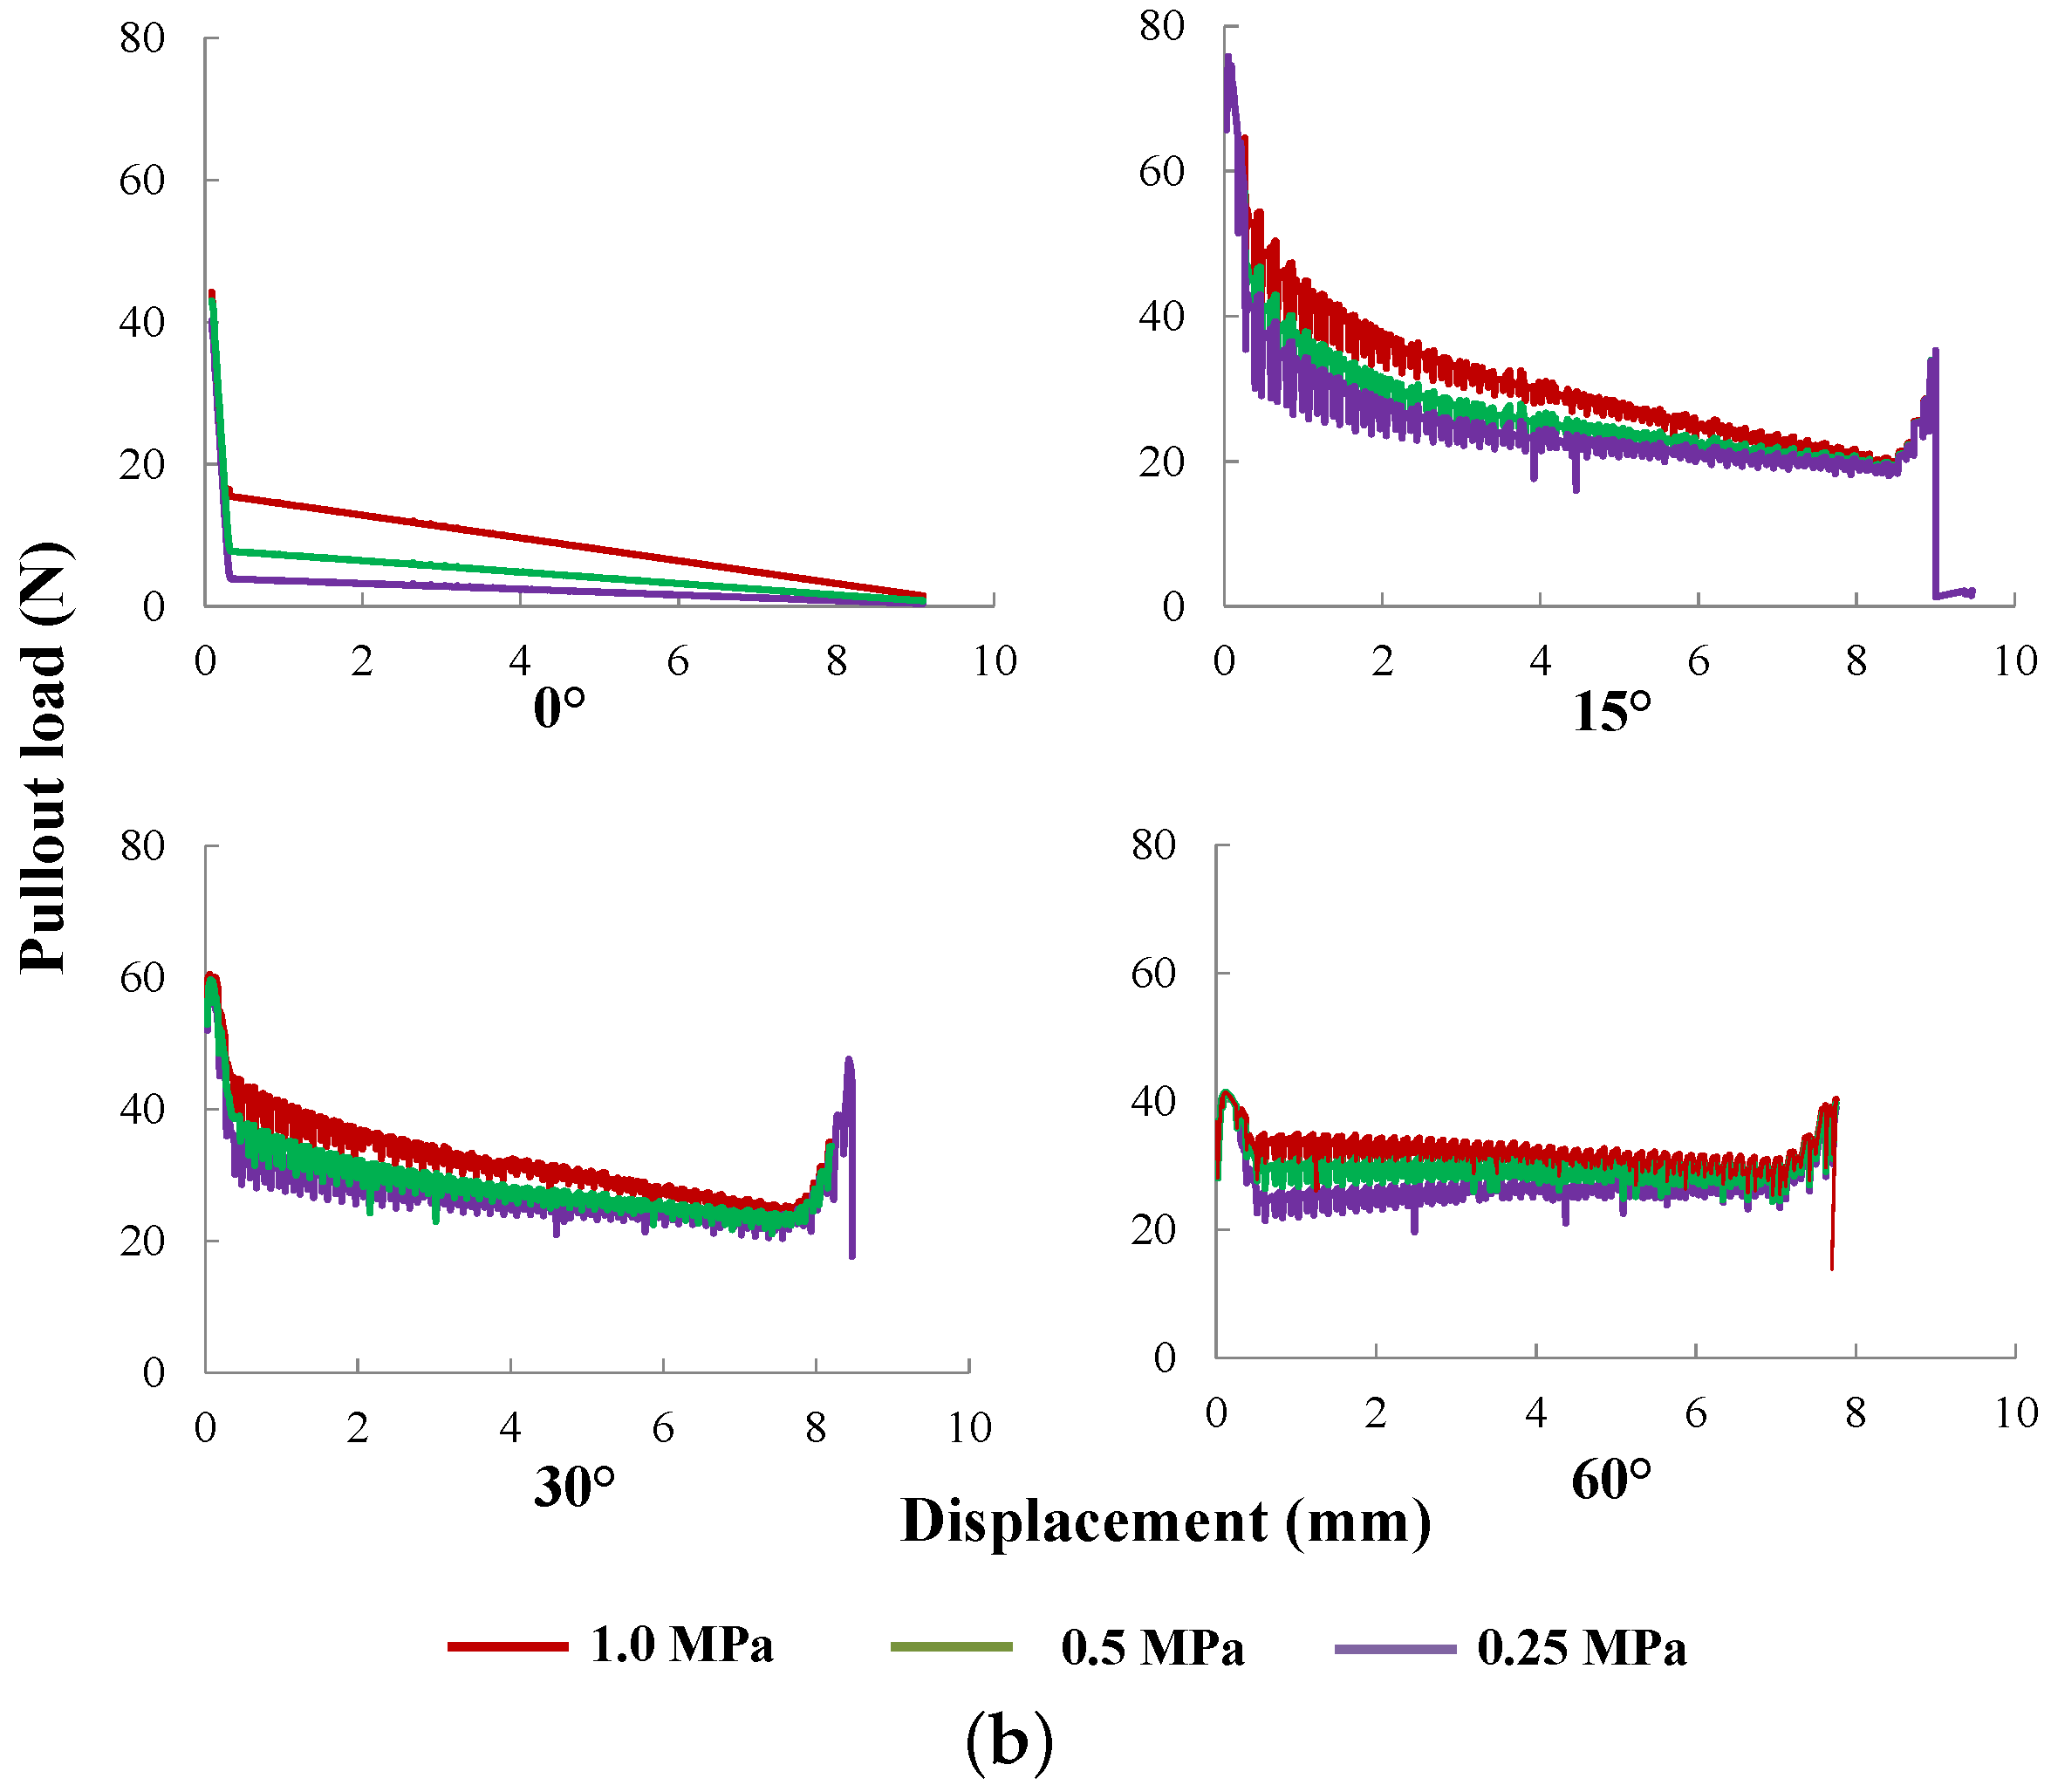
Figure 14.
Pullout curves for: (a) at 1.3, 2.7 and 5.4 MPa; is kept at 0.5 MPa; and (b) at 0.25, 0.50 and 1.0 MPa, whereas is fixed at 2.7 MPa. Fibers are inclined at 0, 15, 30 and 60, respectively.
Figure 14.
Pullout curves for: (a) at 1.3, 2.7 and 5.4 MPa; is kept at 0.5 MPa; and (b) at 0.25, 0.50 and 1.0 MPa, whereas is fixed at 2.7 MPa. Fibers are inclined at 0, 15, 30 and 60, respectively.
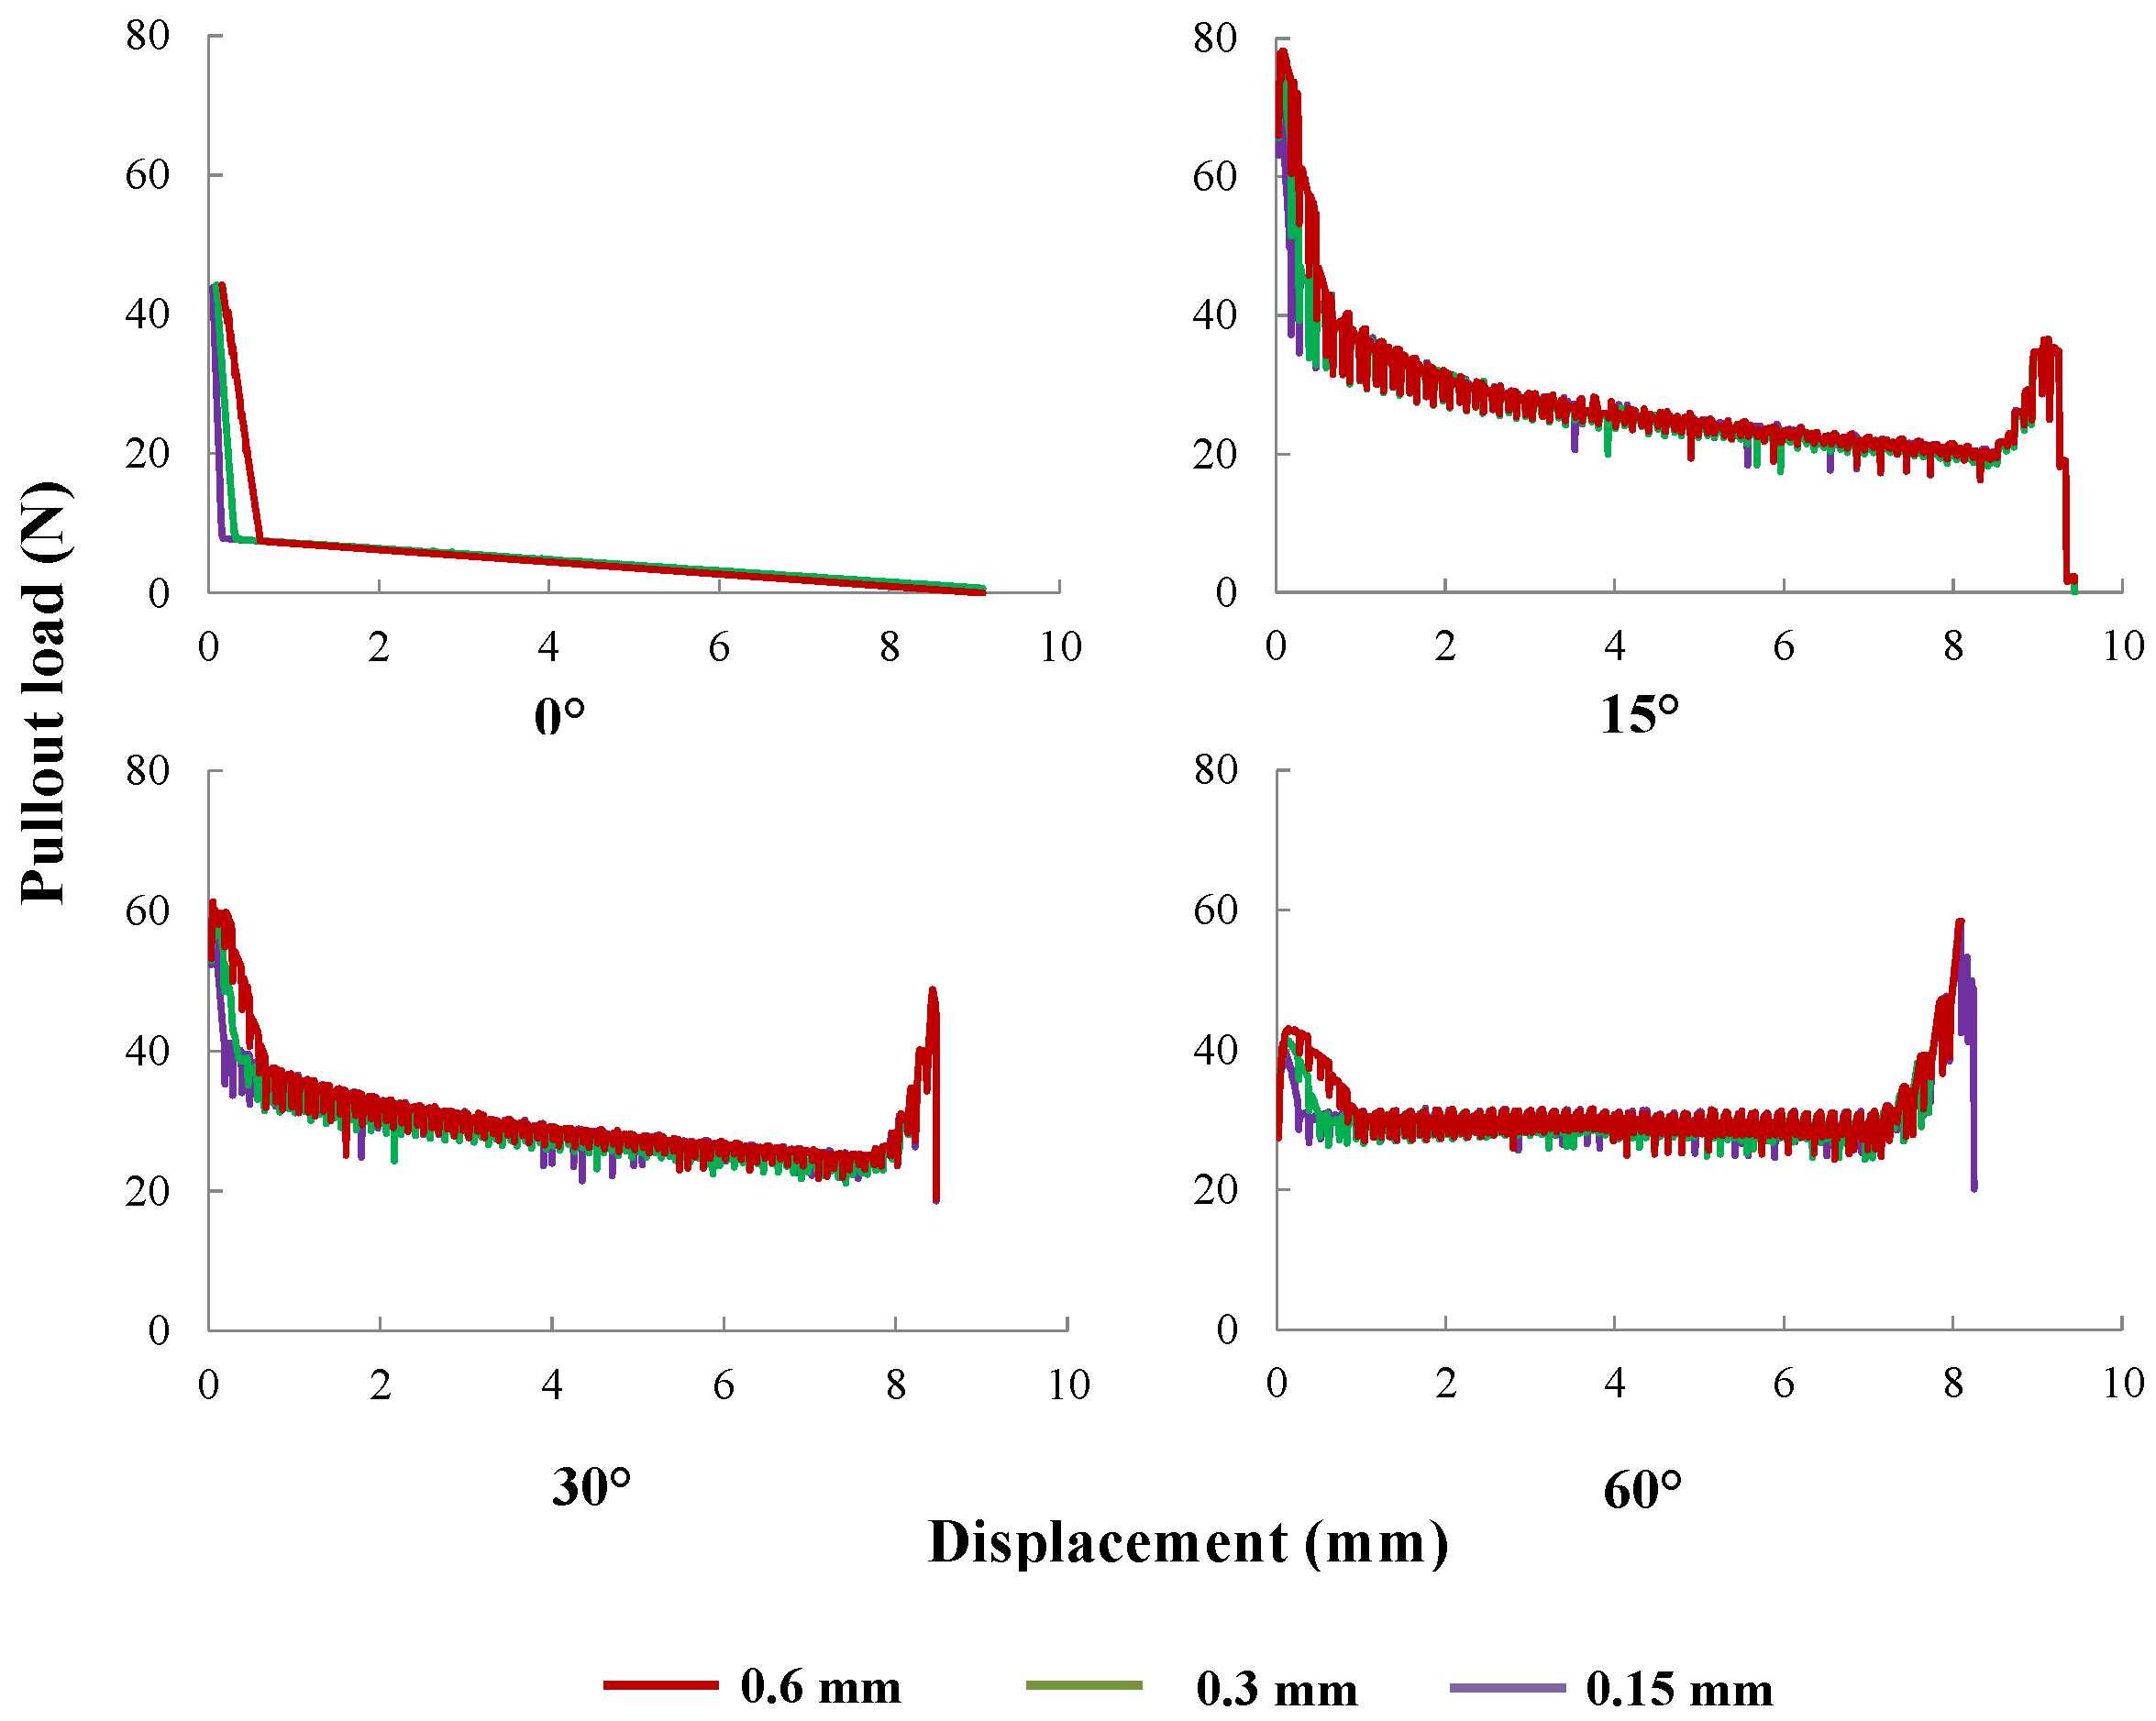
Figure 15.
Pullout curves for equal to 0.15, 0.3 or 0.6 mm, with a fiber inclinations of 0, 15, 30 and 60, respectively.
Figure 15.
Pullout curves for equal to 0.15, 0.3 or 0.6 mm, with a fiber inclinations of 0, 15, 30 and 60, respectively.
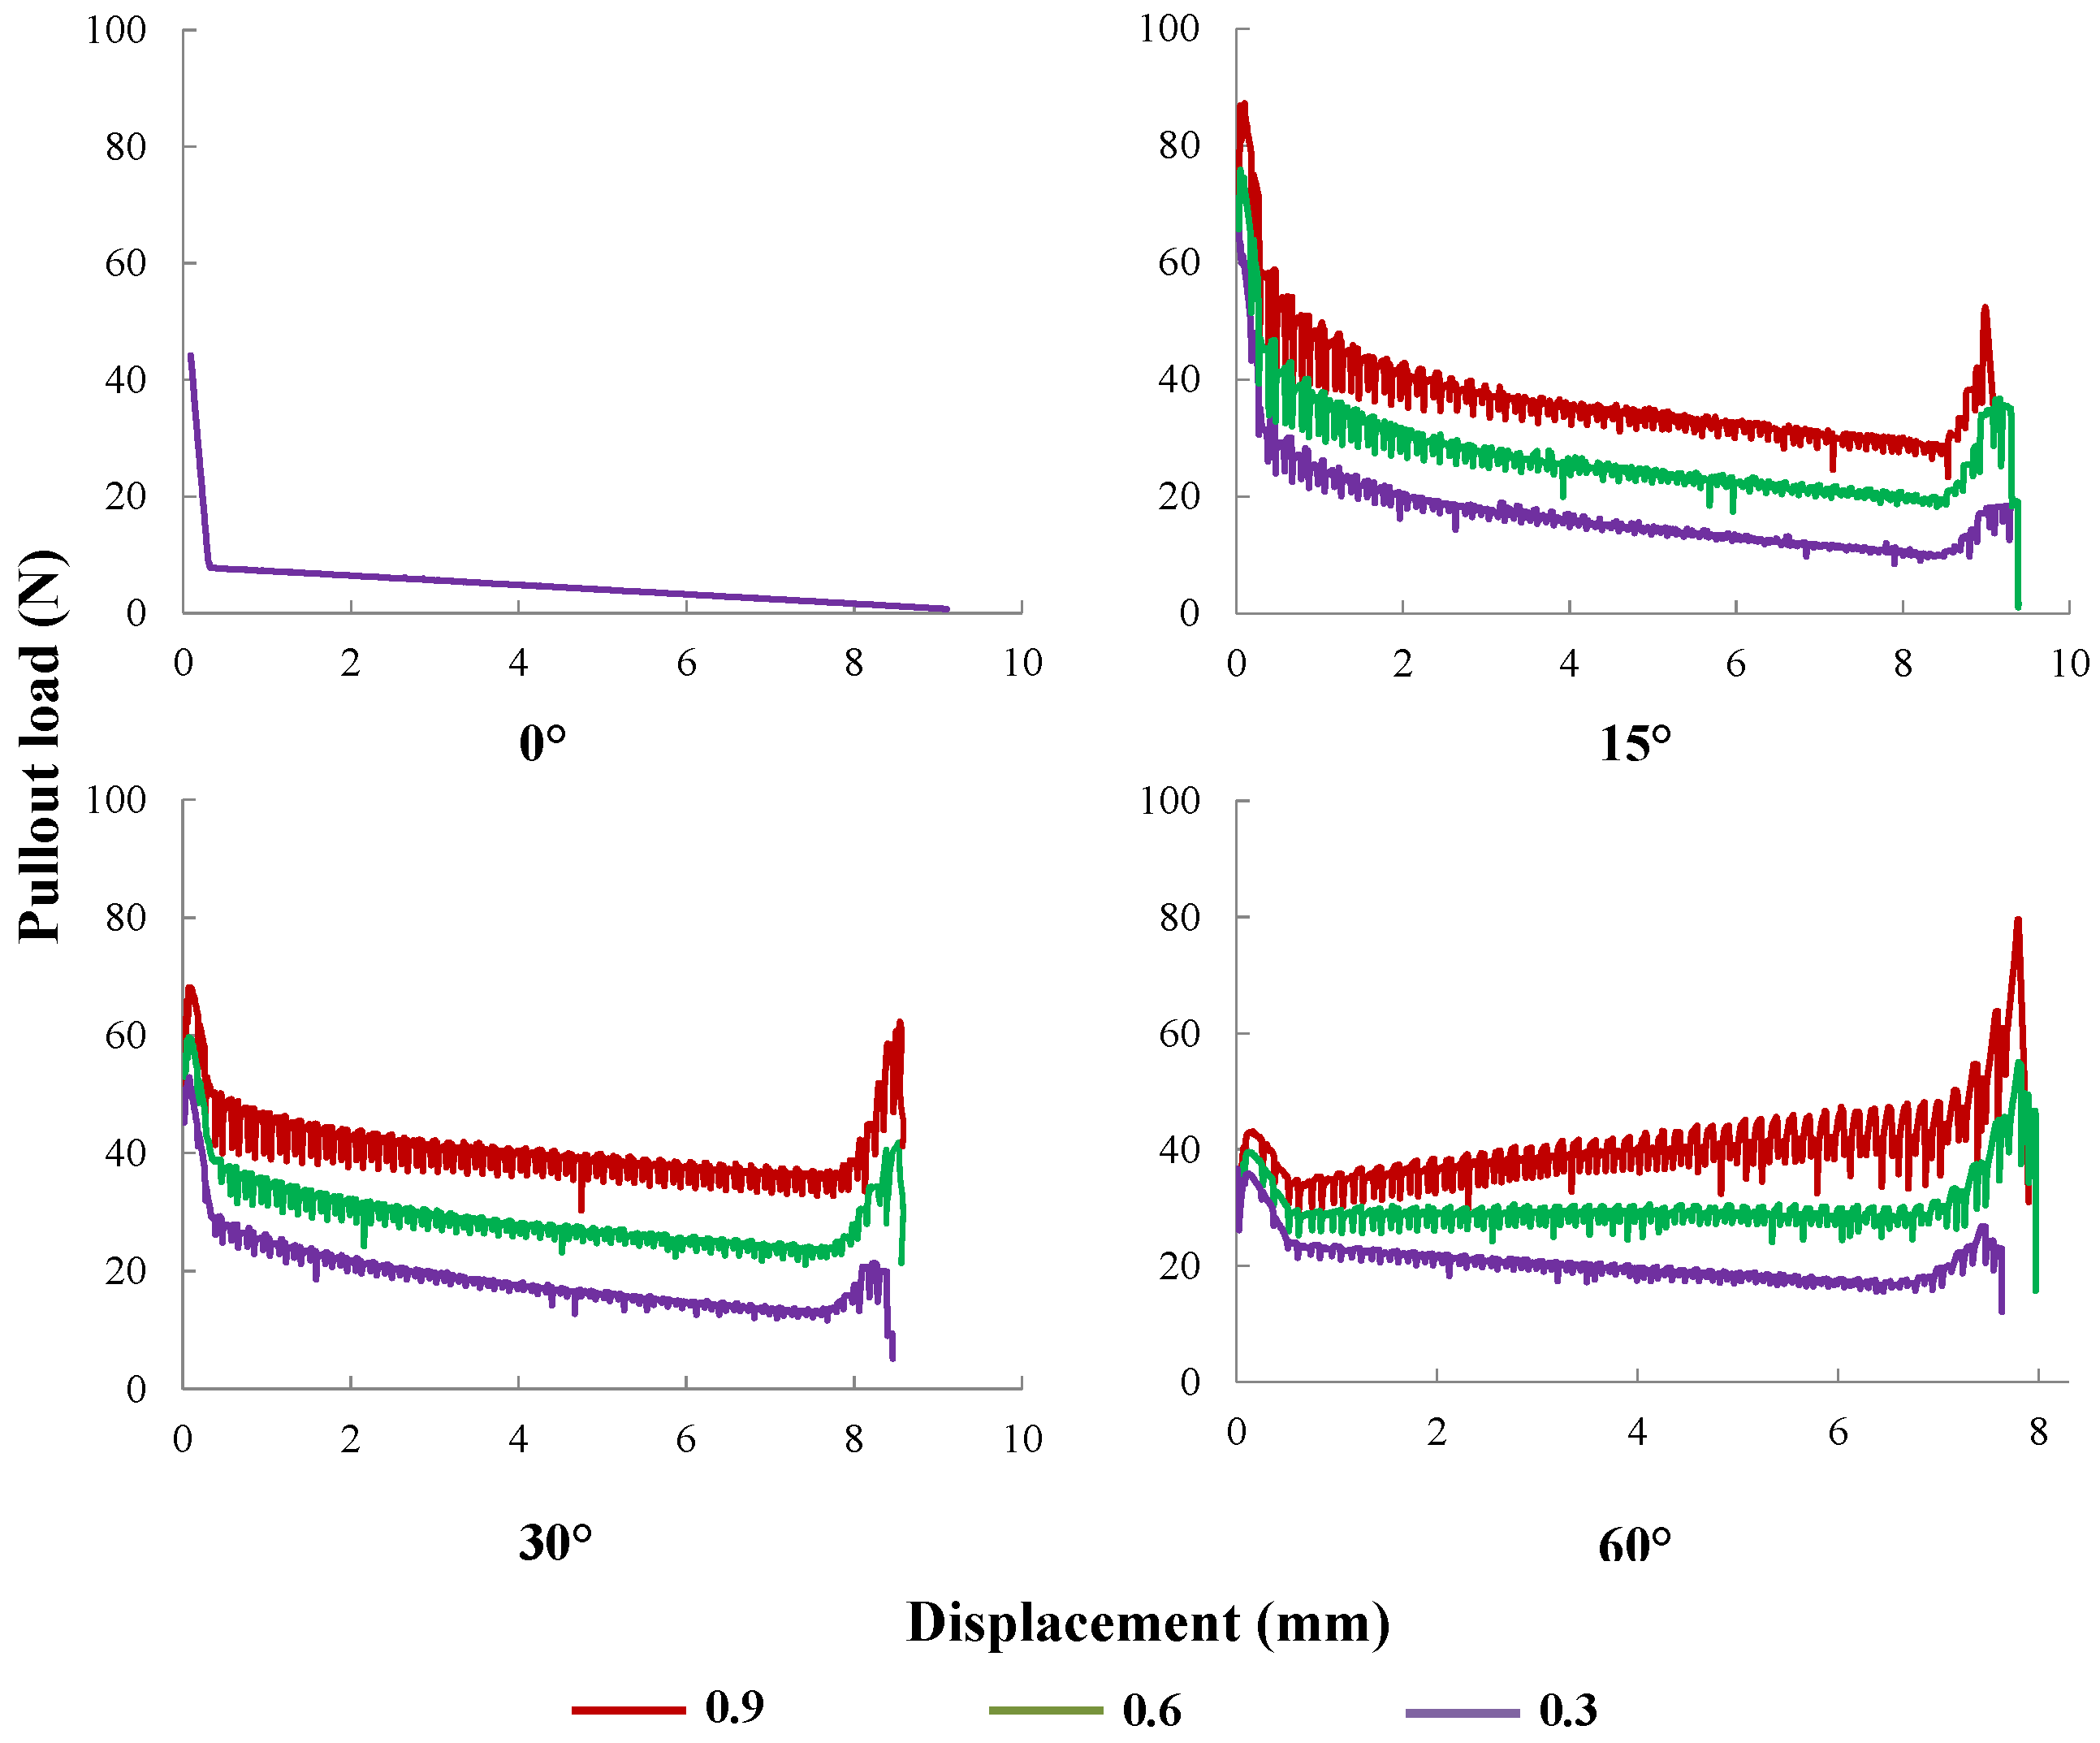
Figure 16.
Pullout curves for μ equal to 0.3, 0.6 or 0.9, with fiber inclinations of 0, 15, 30 and 60, respectively.
Figure 16.
Pullout curves for μ equal to 0.3, 0.6 or 0.9, with fiber inclinations of 0, 15, 30 and 60, respectively.
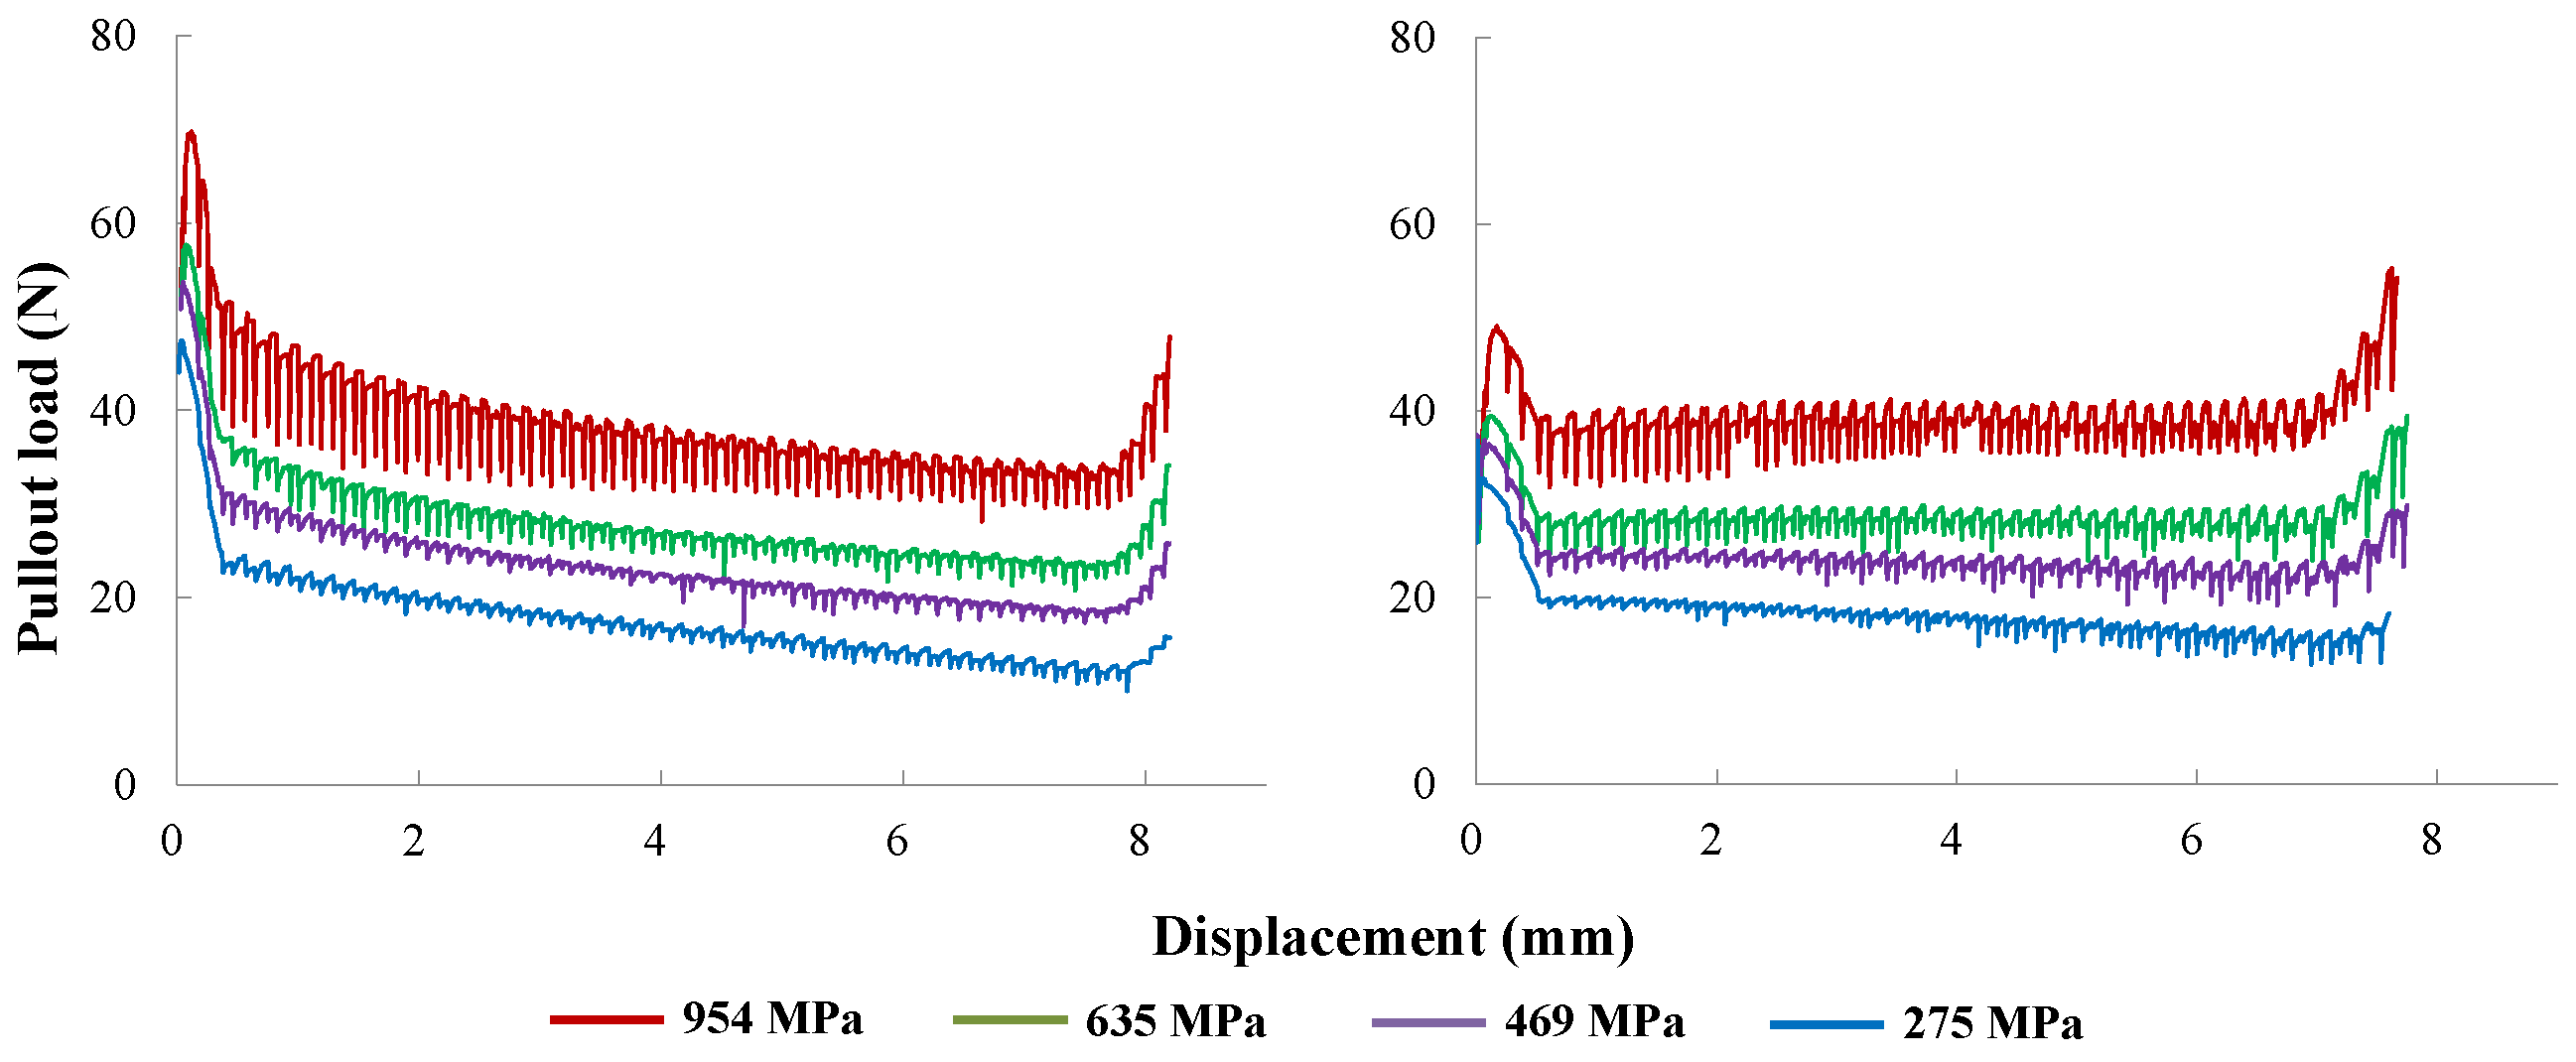
Figure 17.
Pullout load vs. displacement result for fibers of different yield strengths at inclination angles of 30 (left) and 60 (right).
Figure 17.
Pullout load vs. displacement result for fibers of different yield strengths at inclination angles of 30 (left) and 60 (right).
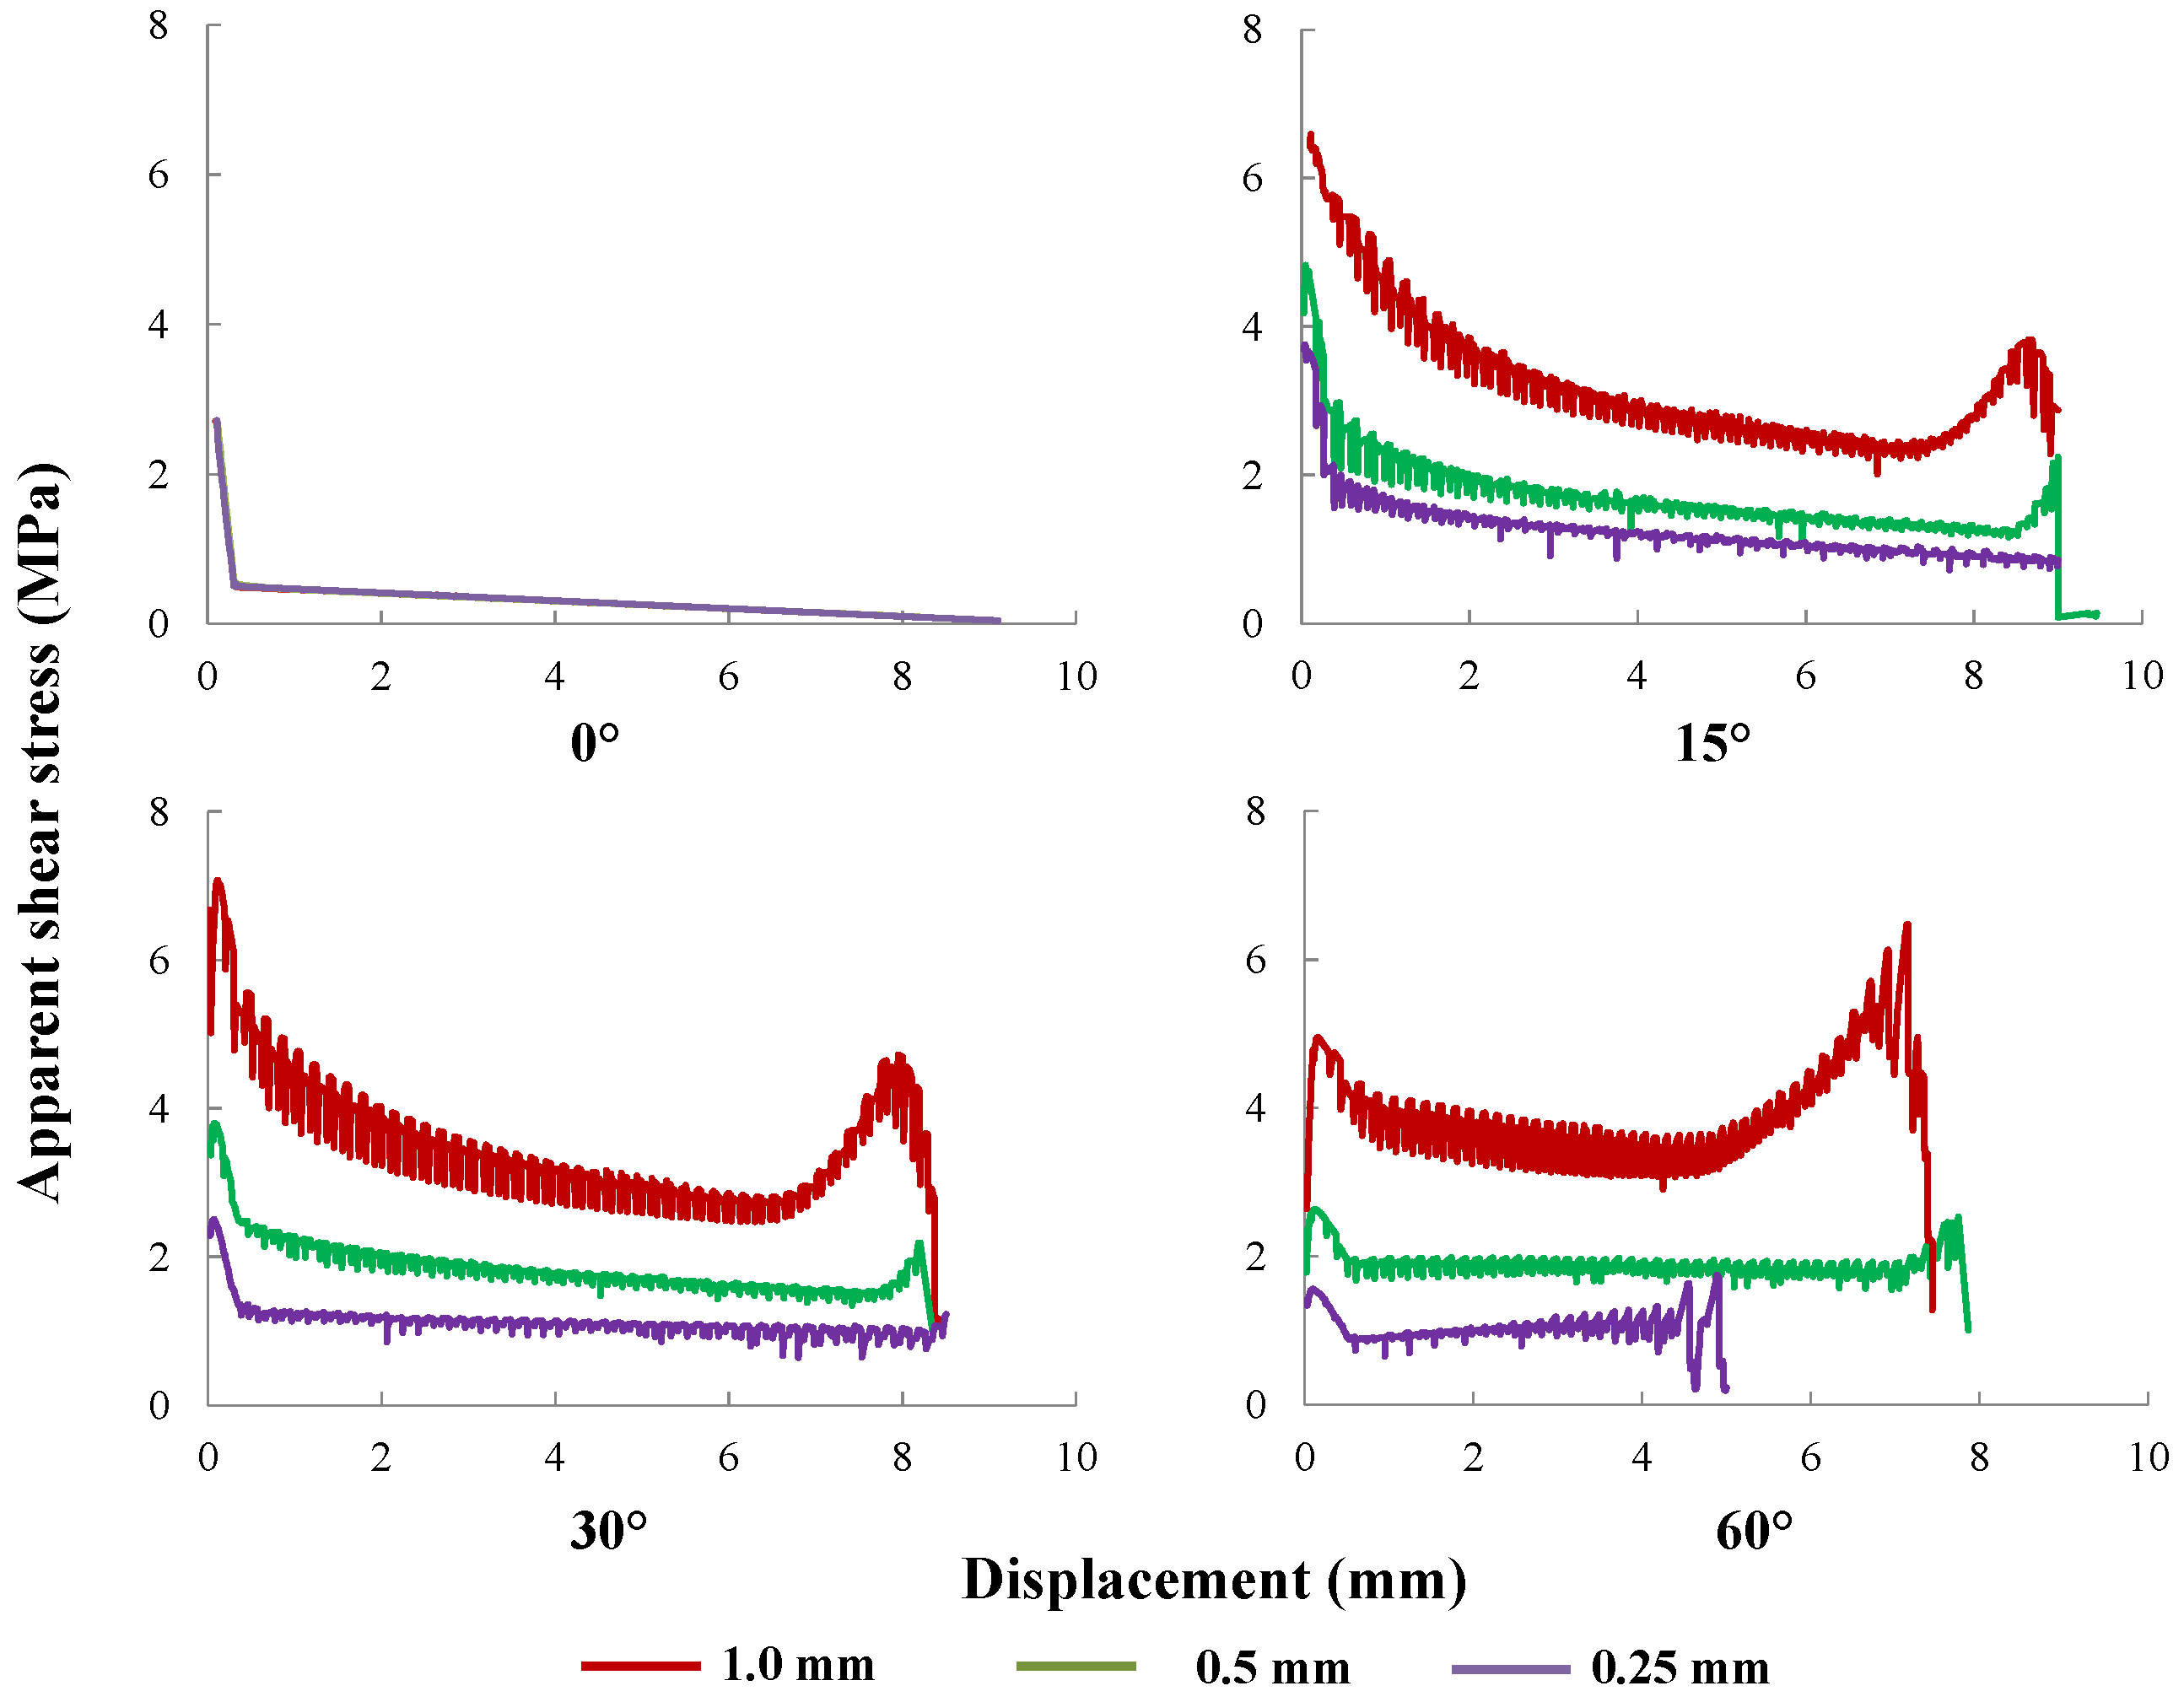
Figure 18.
The influence of fiber diameter: apparent shear stress, , vs. slip end displacement, s, for fibers of 1.0, 0.50 and 0.25 mm in diameter, inclined at 0, 15, 30 and 60, respectively.
Figure 18.
The influence of fiber diameter: apparent shear stress, , vs. slip end displacement, s, for fibers of 1.0, 0.50 and 0.25 mm in diameter, inclined at 0, 15, 30 and 60, respectively.
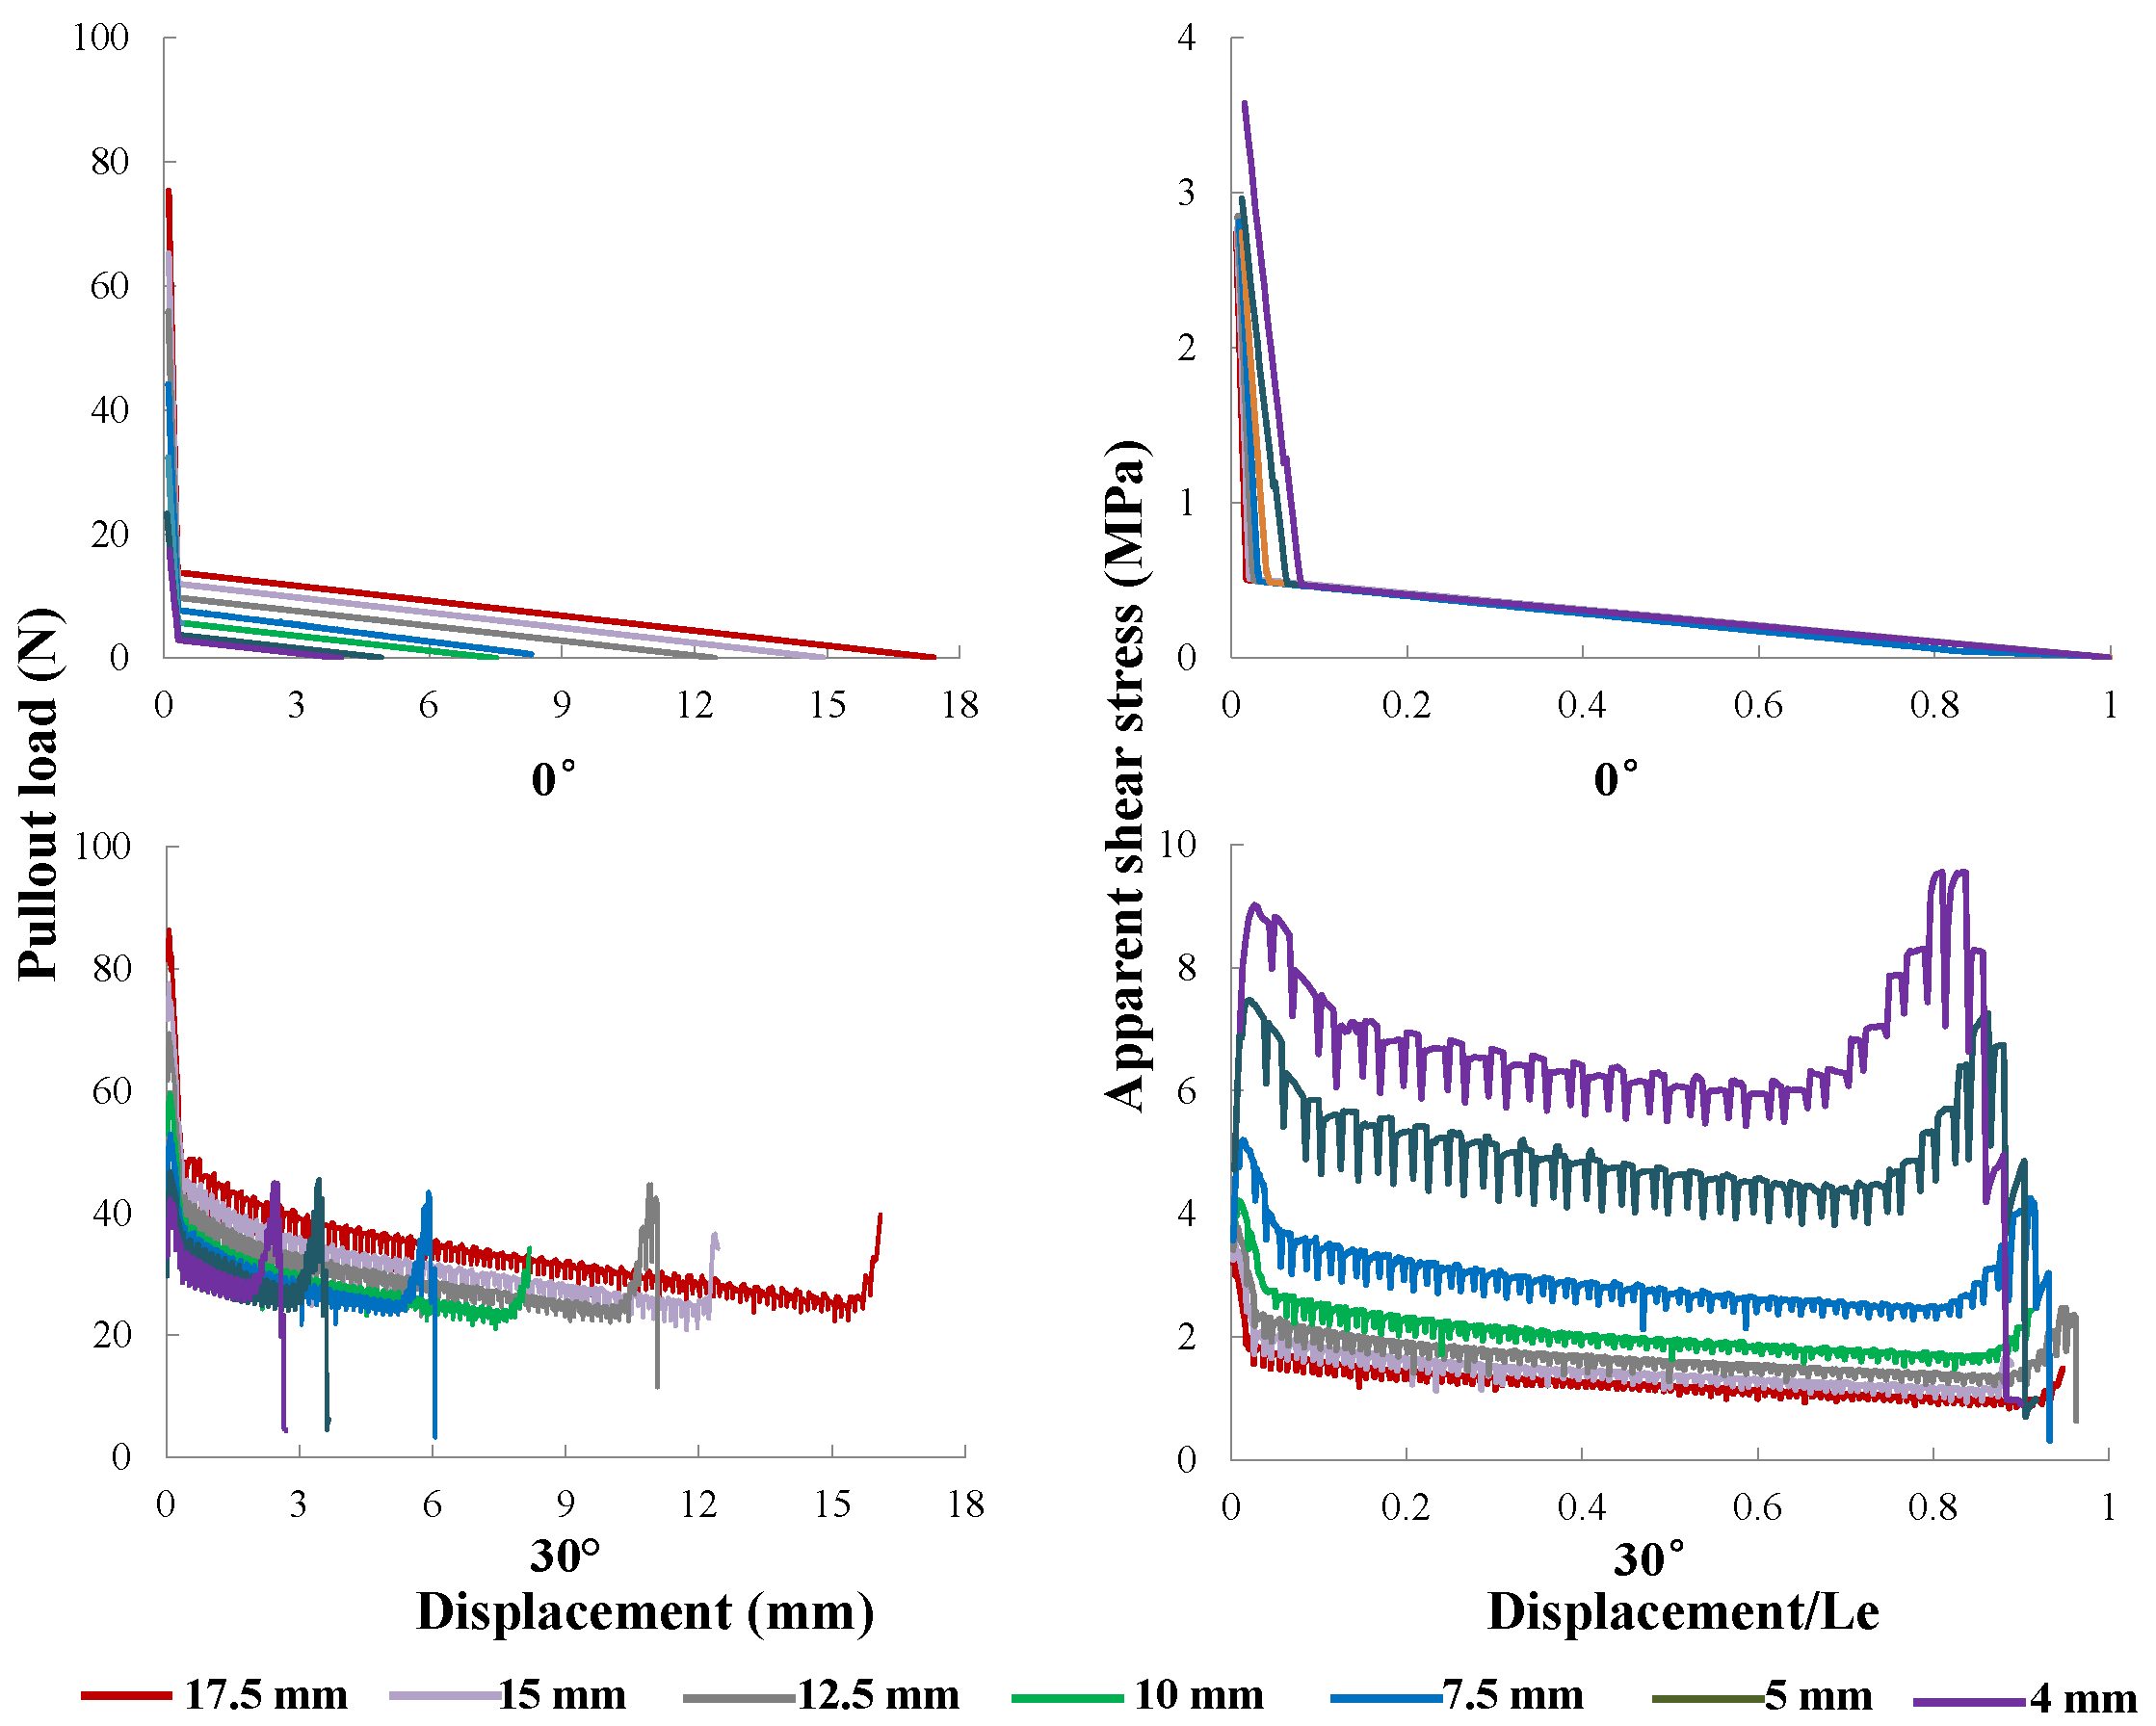
Figure 19.
The influence of fiber length: pullout curves (left) and apparent bond stress vs. normalized slip displacement (right) for fibers inclined at (top) 0 and (bottom) 30, with varying from 4 to 17.5 mm, whereas the diameter is kept at 0.50 mm.
Figure 19.
The influence of fiber length: pullout curves (left) and apparent bond stress vs. normalized slip displacement (right) for fibers inclined at (top) 0 and (bottom) 30, with varying from 4 to 17.5 mm, whereas the diameter is kept at 0.50 mm.
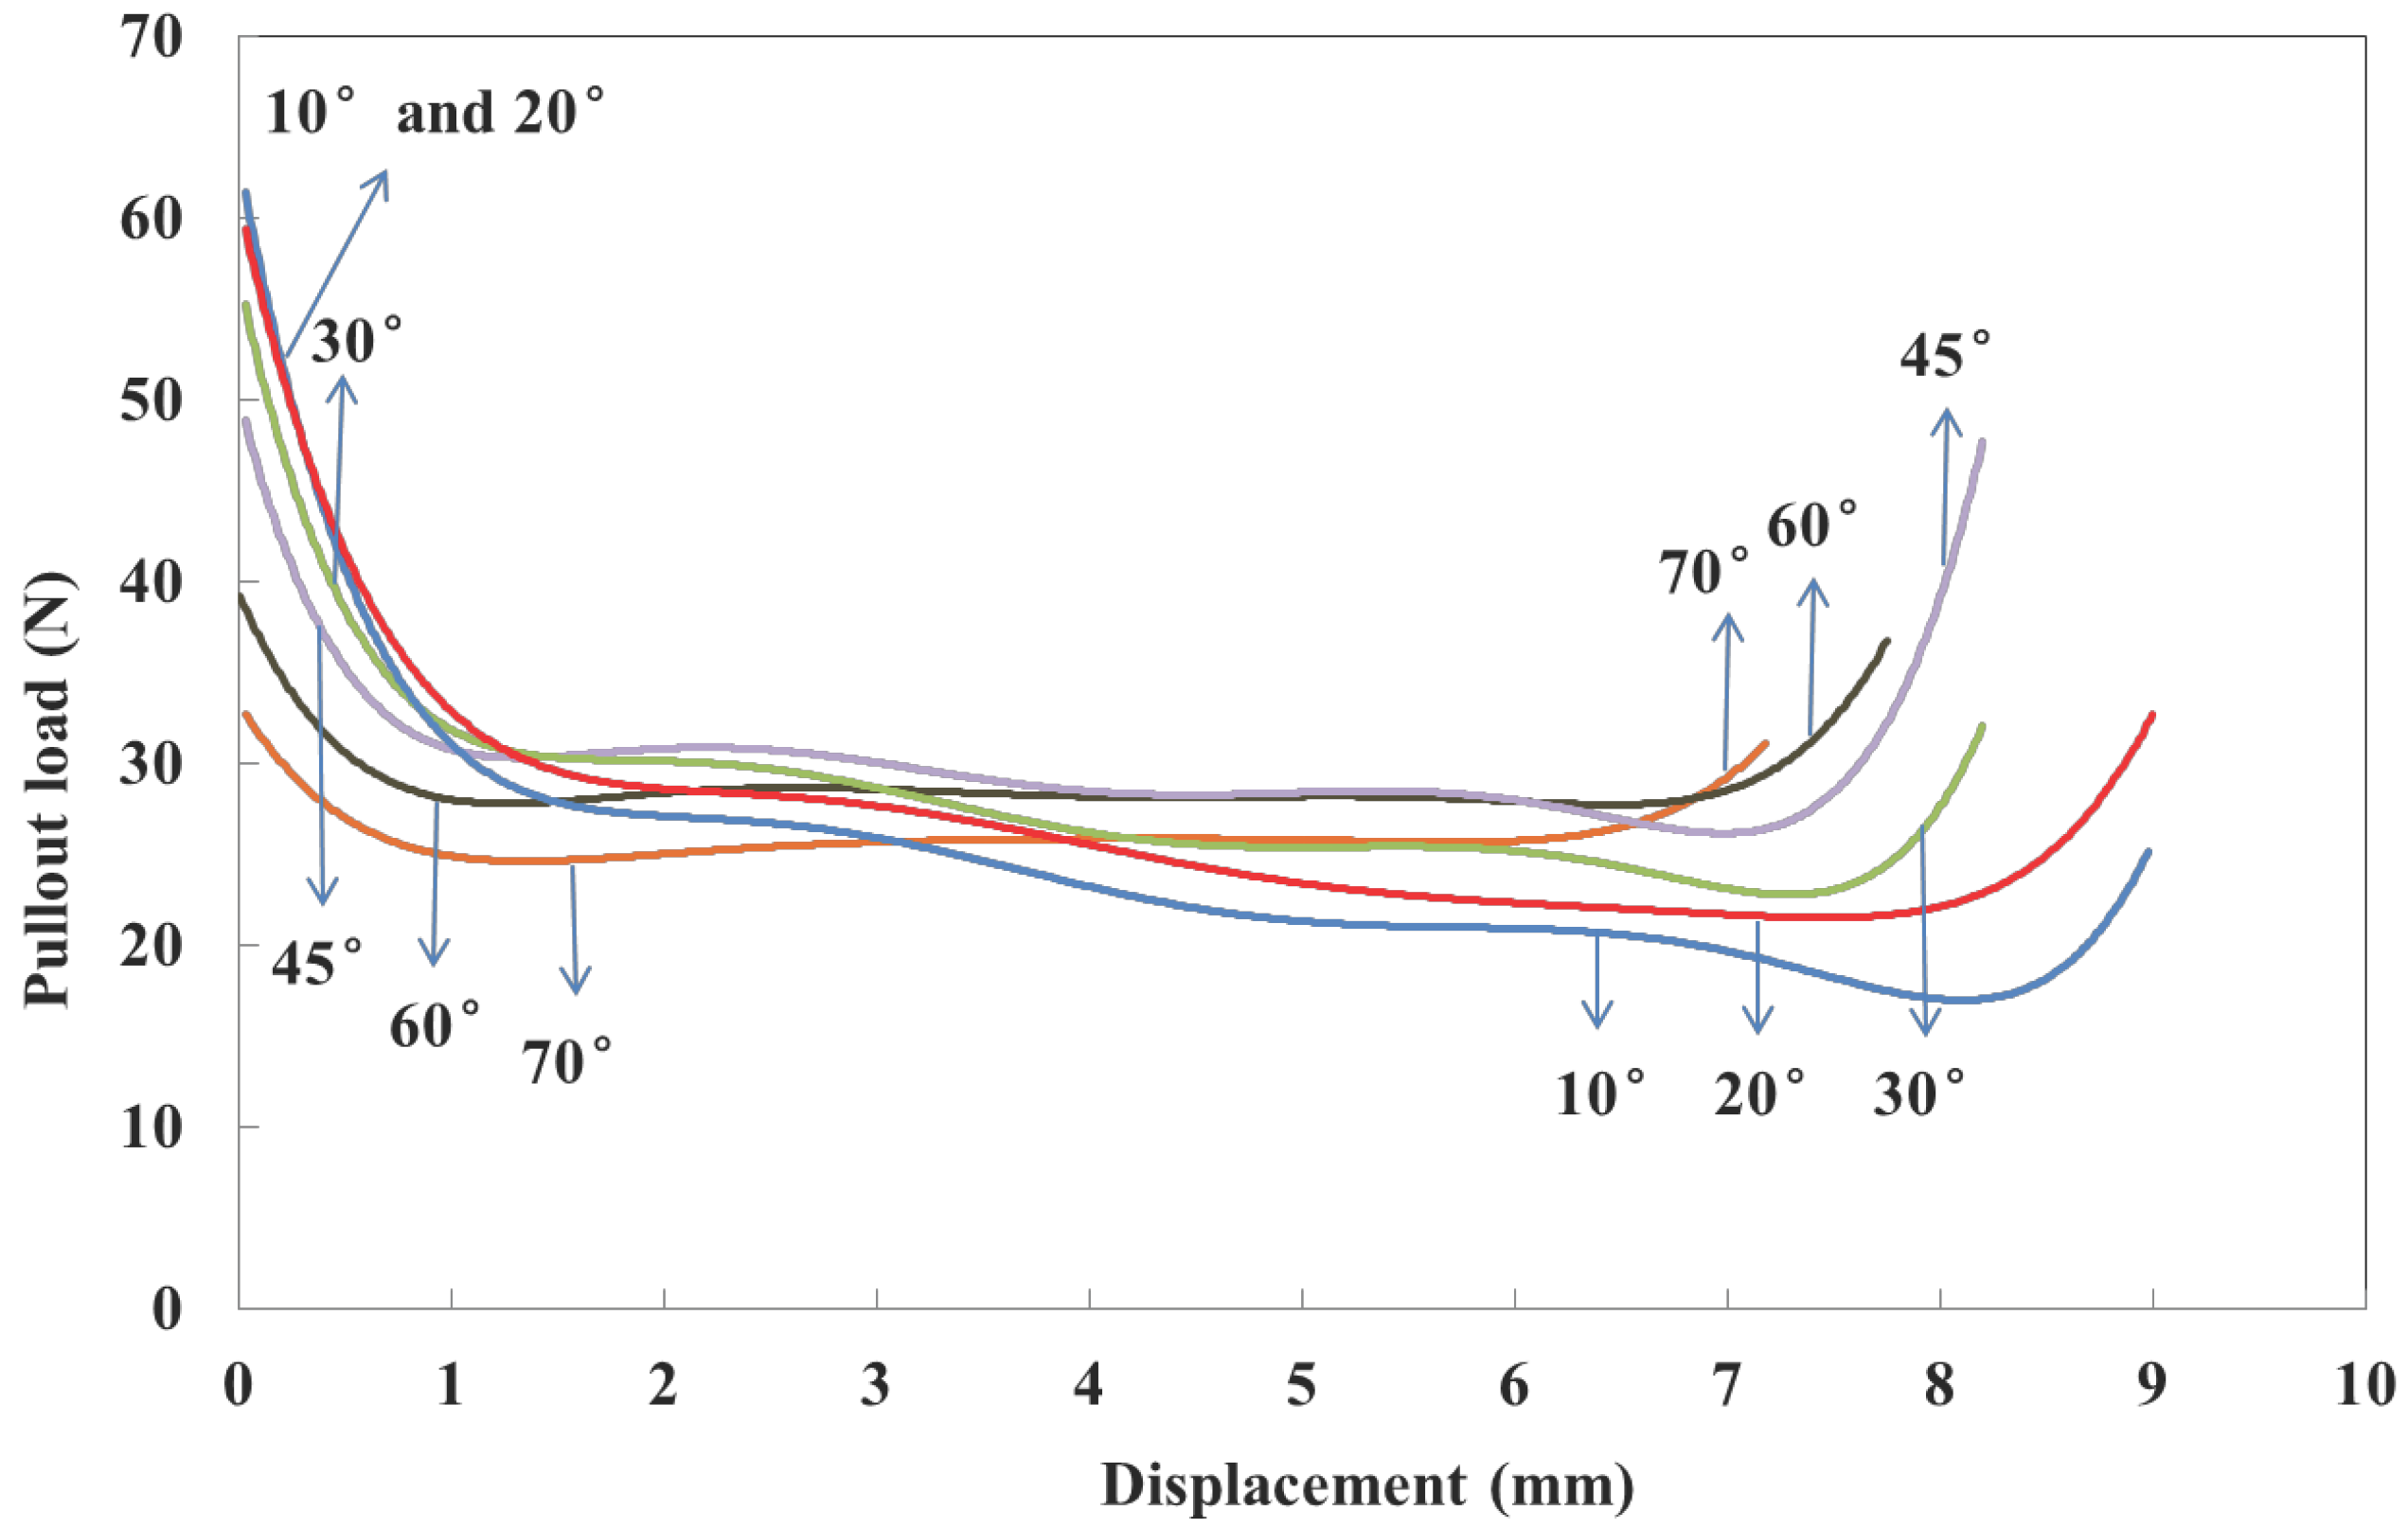
Figure 20.
Numerical pullout load vs. slip displacement curves for inclination angles from 10 to 70.
Figure 20.
Numerical pullout load vs. slip displacement curves for inclination angles from 10 to 70.
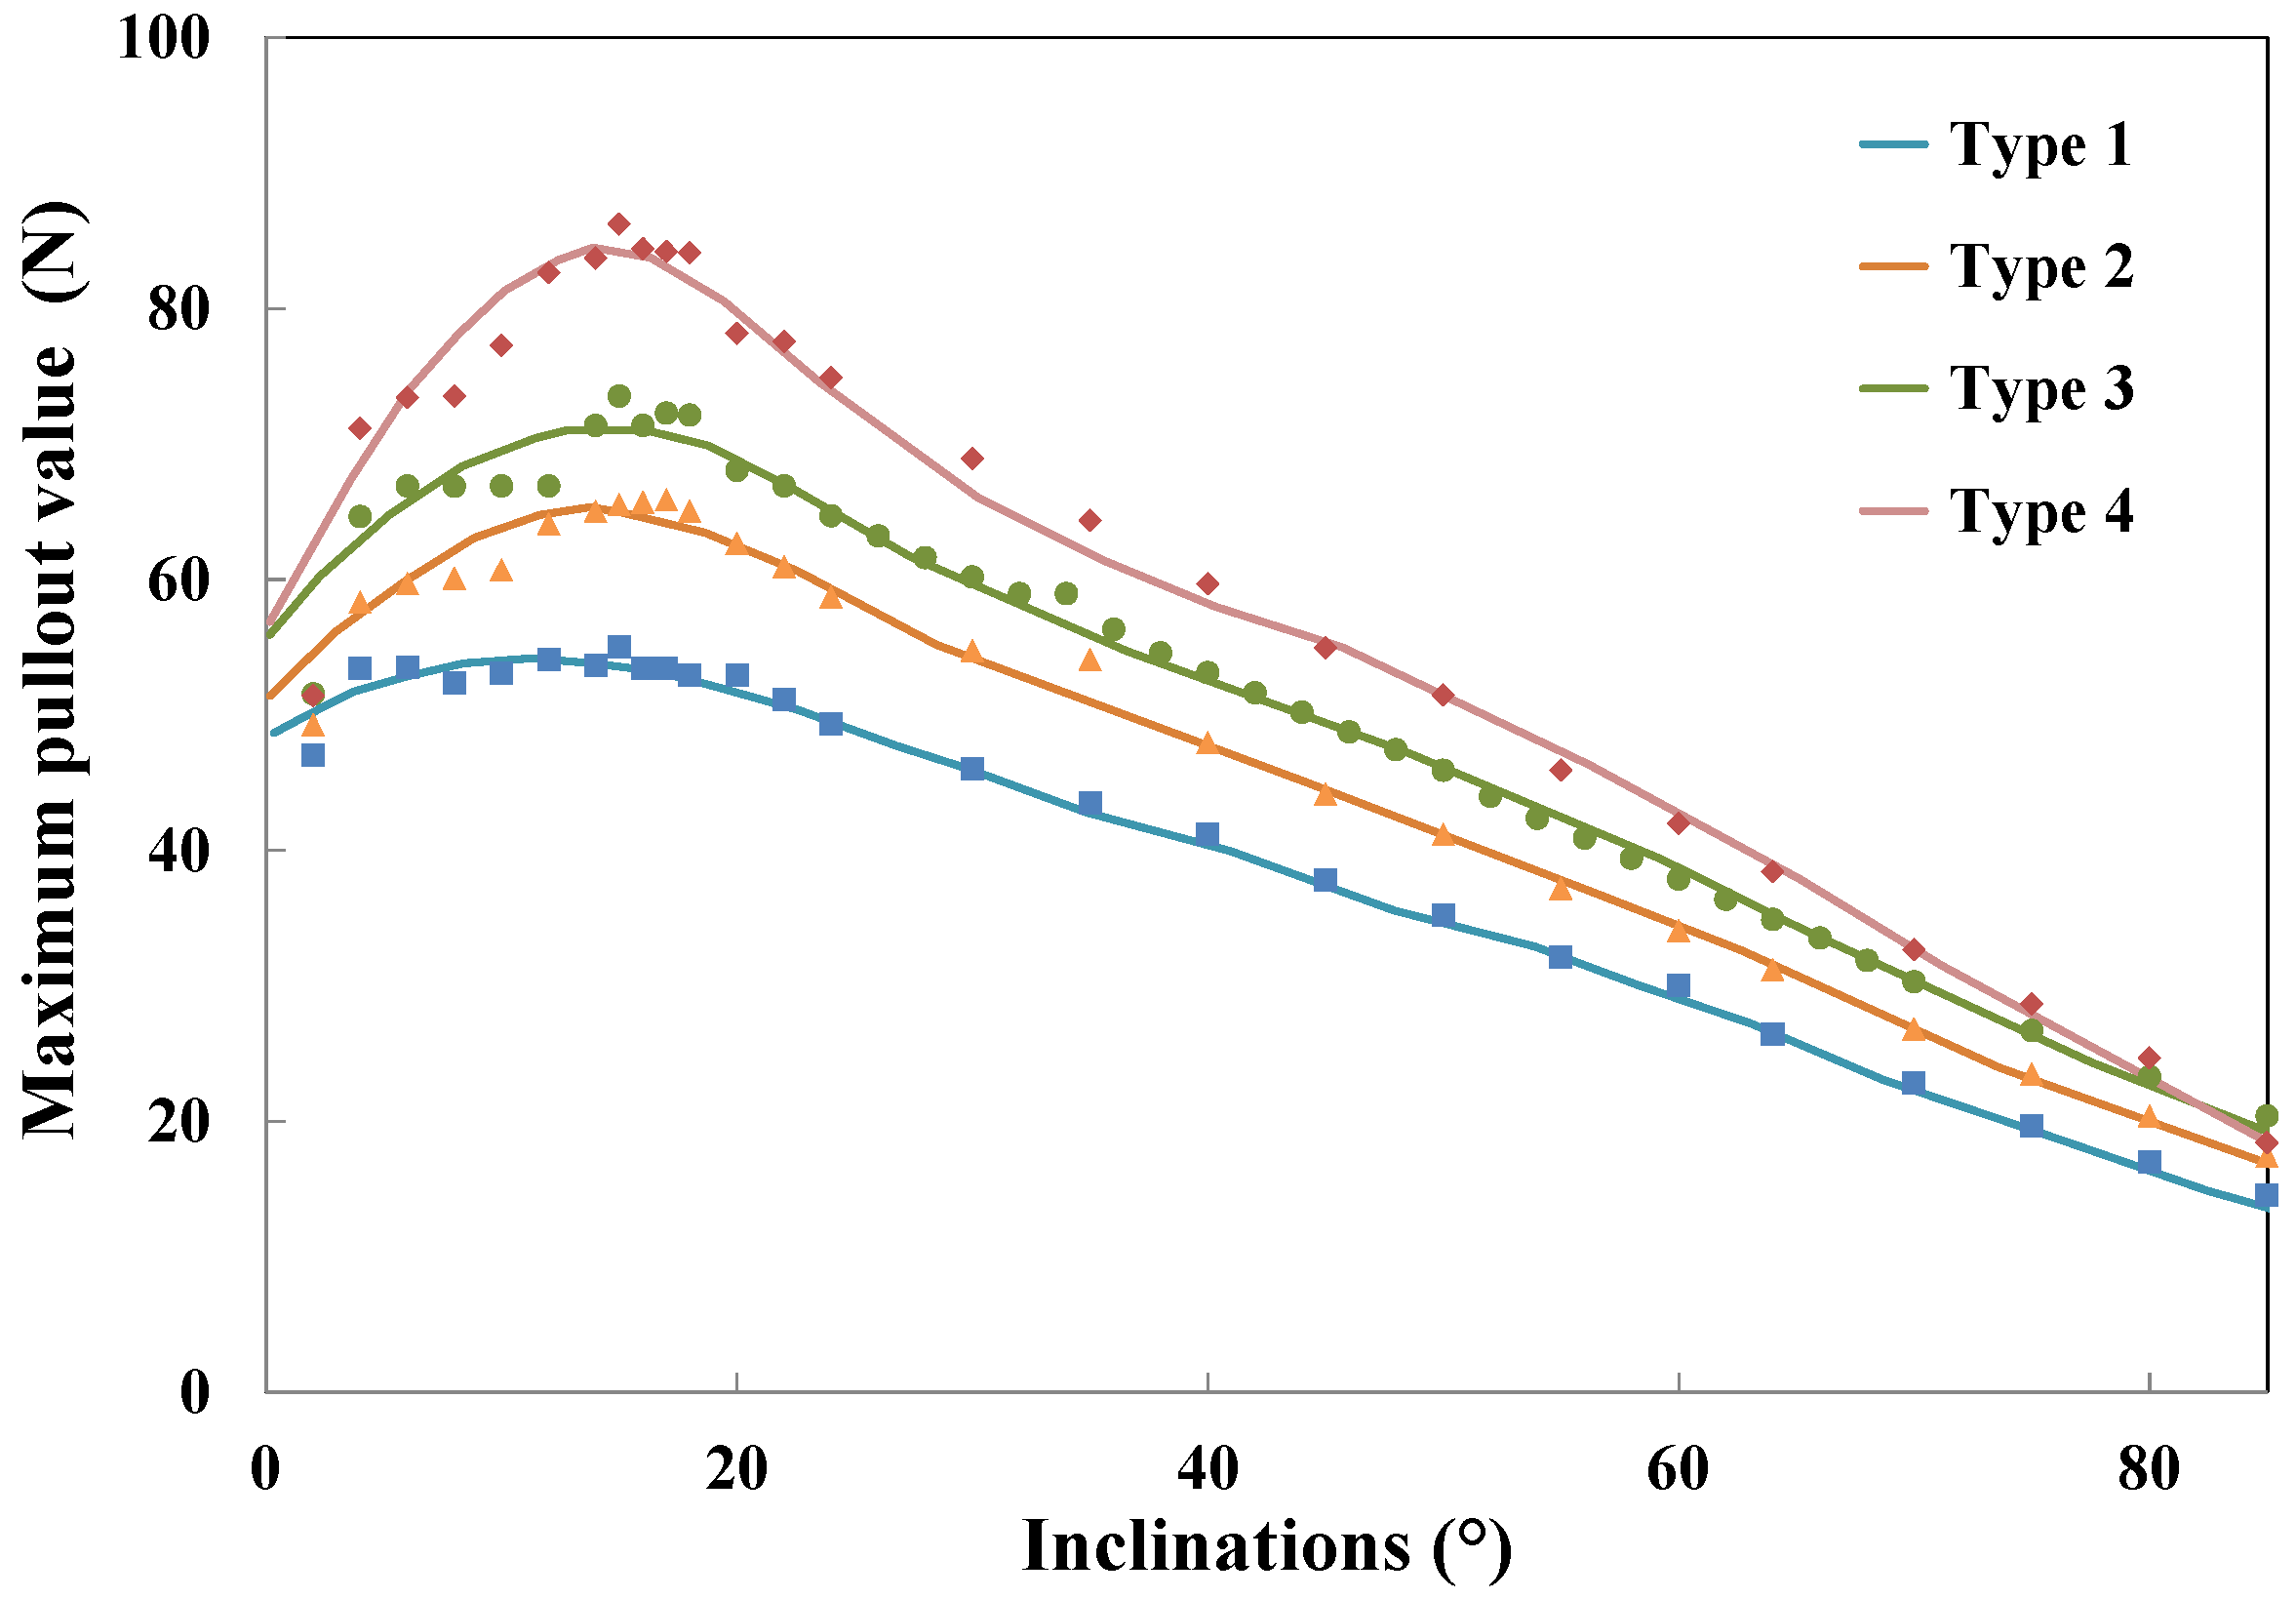
Figure 21.
Maximum pullout load vs. inclination angle for the four yield strengths given in
Table 2 and fitted curves using Equation (
11) with parameters given in
Table 5.
Figure 21.
Maximum pullout load vs. inclination angle for the four yield strengths given in
Table 2 and fitted curves using Equation (
11) with parameters given in
Table 5.
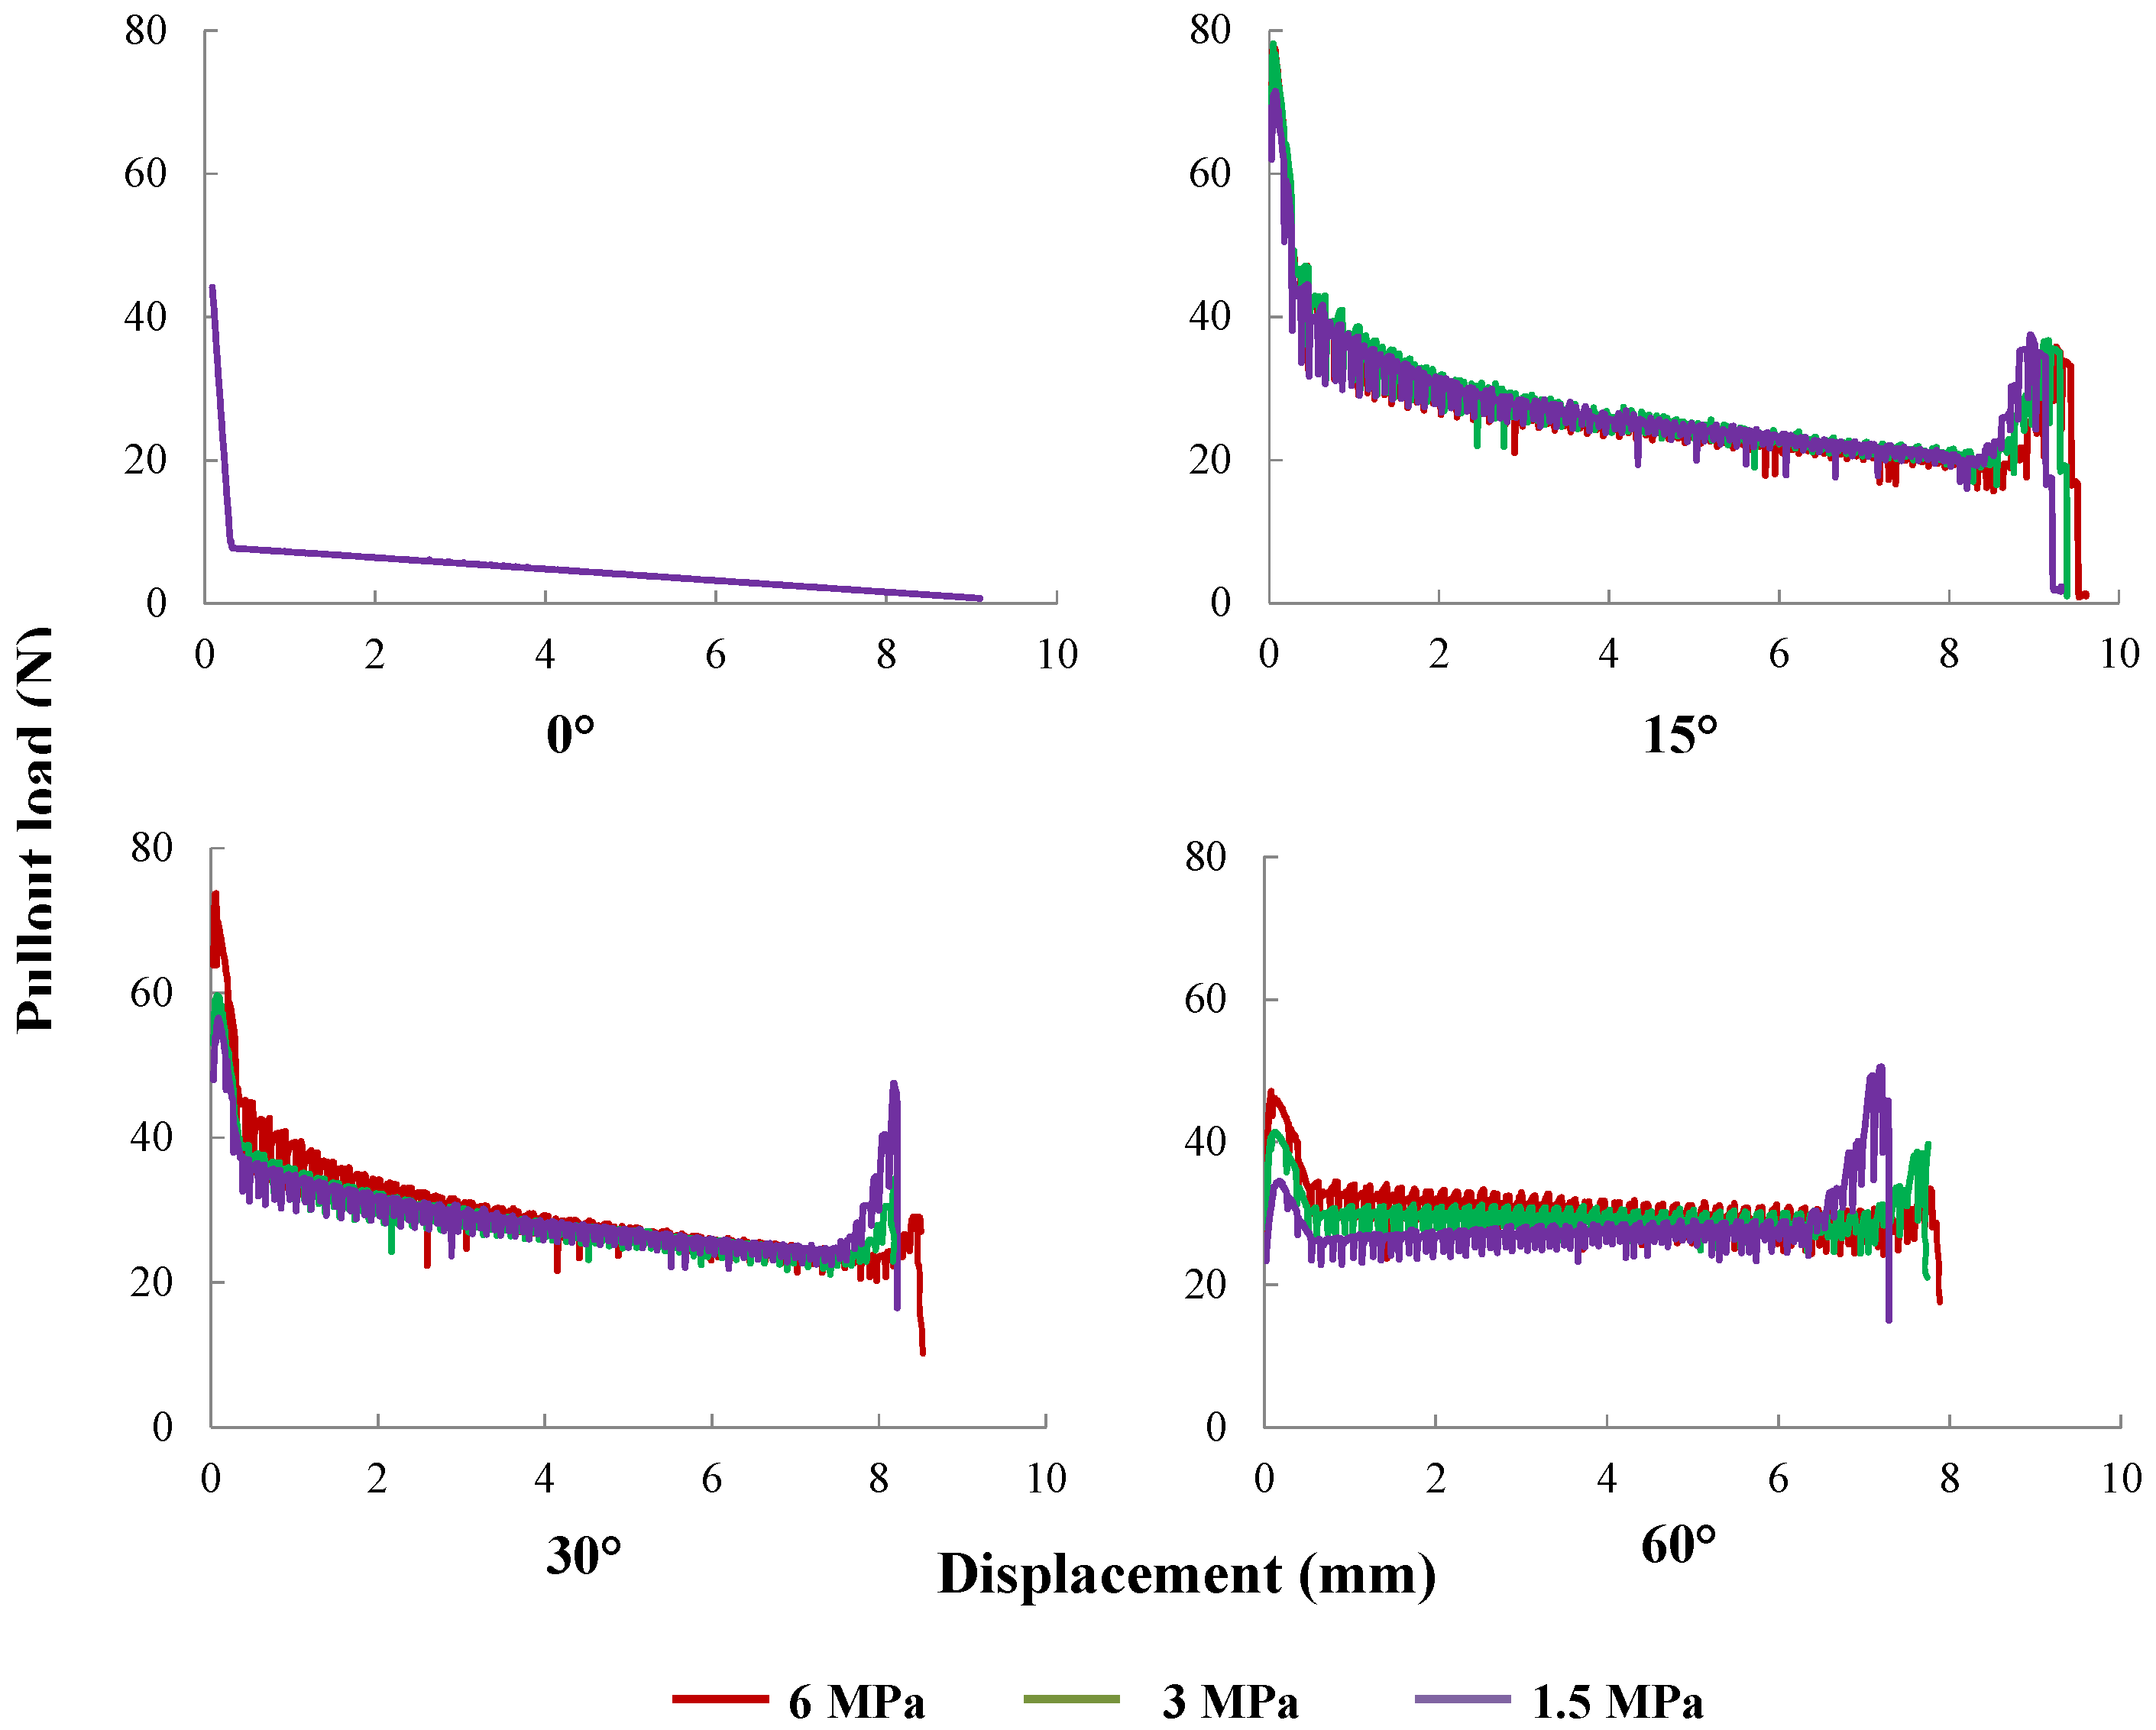
Figure 22.
The influence of matrix tensile strength: pullout curves for matrix tensile strengths of 1.5 MPa, 3.0 MPa and 6.0 MPa; fibers inclined at 0, 15, 30 and 60, respectively.
Figure 22.
The influence of matrix tensile strength: pullout curves for matrix tensile strengths of 1.5 MPa, 3.0 MPa and 6.0 MPa; fibers inclined at 0, 15, 30 and 60, respectively.
Table 1.
Material parameters for the matrix and the fiber given in [
26].
Table 1.
Material parameters for the matrix and the fiber given in [26].
| ρ | E | ν | | |
|---|
| (kg/m3) | (GPa) | - | (MPa) | (MPa) |
|---|
| Matrix | 2100 | 30 | 0.20 | 36.5 ± 2.5 | (estimated) |
| Steel fiber | 7800 | 200 | 0.33 | - | - |
Table 2.
Yield and tensile strength of the four types of fibers tested in [
26]; the corresponding
is listed for a diameter of 0.5 mm, where
and
are calculated using the tensile strength,
, and the yield strength,
, respectively.
Table 2.
Yield and tensile strength of the four types of fibers tested in [26]; the corresponding is listed for a diameter of 0.5 mm, where and are calculated using the tensile strength, , and the yield strength, , respectively.
| Fiber Type | 1 | 2 | 3 | 4 |
|---|
| (MPa) | 275 | 469 | 635 | 954 |
| (MPa) | - | 783 | 847 | 1023 |
| (mm) | 12.7 | 21.7 | 29.4 | 44.2 |
| (mm) | - | 36.3 | 39.2 | 47.4 |
Table 3.
Extracted parameters of the fiber-matrix interface from the experimental data of Leung and Shapiro [
26].
Table 3.
Extracted parameters of the fiber-matrix interface from the experimental data of Leung and Shapiro [26].
| | | μ |
|---|
| (MPa) | (MPa) | (mm) | - |
|---|
| 2.7 ± 0.1 | 0.5 ± 0.1 | 0.3 | 0.60 |
Table 4.
Parameters for the case studies on fiber diameter and fiber length.
Table 4.
Parameters for the case studies on fiber diameter and fiber length.
| | | | | | | |
|---|
| (mm) | (mm) | - | (mm) | (mm) | (MPa) | (MPa) | (mm) |
|---|
| 10 | 0.50 | 20 | 0.79 | 0.36 | 2.7 | 635 | 29.4 |
| 10 | 0.25 | 40 | 0.39 | 0.18 | 2.7 | 635 | 14.7 |
| 10 | 1.00 | 10 | 1.57 | 0.72 | 2.7 | 635 | 58.8 |
| 4.0 | 0.50 | 8 | 0.79 | 0.36 | 2.7 | 635 | 29.4 |
| 5.0 | 0.50 | 10 | 0.79 | 0.36 | 2.7 | 635 | 29.4 |
| 7.5 | 0.50 | 15 | 0.79 | 0.36 | 2.7 | 635 | 29.4 |
| 10.0 | 0.50 | 20 | 0.79 | 0.36 | 2.7 | 635 | 29.4 |
| 12.5 | 0.50 | 25 | 0.79 | 0.36 | 2.7 | 635 | 29.4 |
| 15.0 | 0.50 | 30 | 0.79 | 0.36 | 2.7 | 635 | 29.4 |
| 17.5 | 0.50 | 35 | 0.79 | 0.36 | 2.7 | 635 | 29.4 |
Table 5.
Fitted parameters for the maximum pullout load vs. fiber inclination angle, where is the angle where the maximum peak load is attained.
Table 5.
Fitted parameters for the maximum pullout load vs. fiber inclination angle, where is the angle where the maximum peak load is attained.
| Fiber Type | | | | | | | |
|---|
| (N) | (N) | () | () | () | () | () |
|---|
| 1 | 15.5 | 42.0 | 7.9 | 26.2 | 19.7 | 56.4 | 12.4 |
| 2 | 18.1 | 49.4 | 12.7 | 26.7 | 16.2 | 55.7 | 15.3 |
| 3 | 20.1 | 54.2 | 12.6 | 27.4 | 16.0 | 55.9 | 15.2 |
| 4 | 33.7 | 59.0 | 12.7 | 33.0 | 14.6 | 48.2 | 15.3 |
Table 6.
Spalling length for three levels of matrix tensile strength and fiber at four different inclination angles.
Table 6.
Spalling length for three levels of matrix tensile strength and fiber at four different inclination angles.
| (MPa) | 1.5 | 3.0 | 6.0 |
|---|
| | Spalling | Length | in mm |
| 0 | 0.00 | 0.00 | 0.00 |
| 15 | 0.59 | 0.41 | 0.27 |
| 30 | 1.50 | 1.03 | 0.71 |
| 60 | 3.31 | 2.31 | 1.60 |


