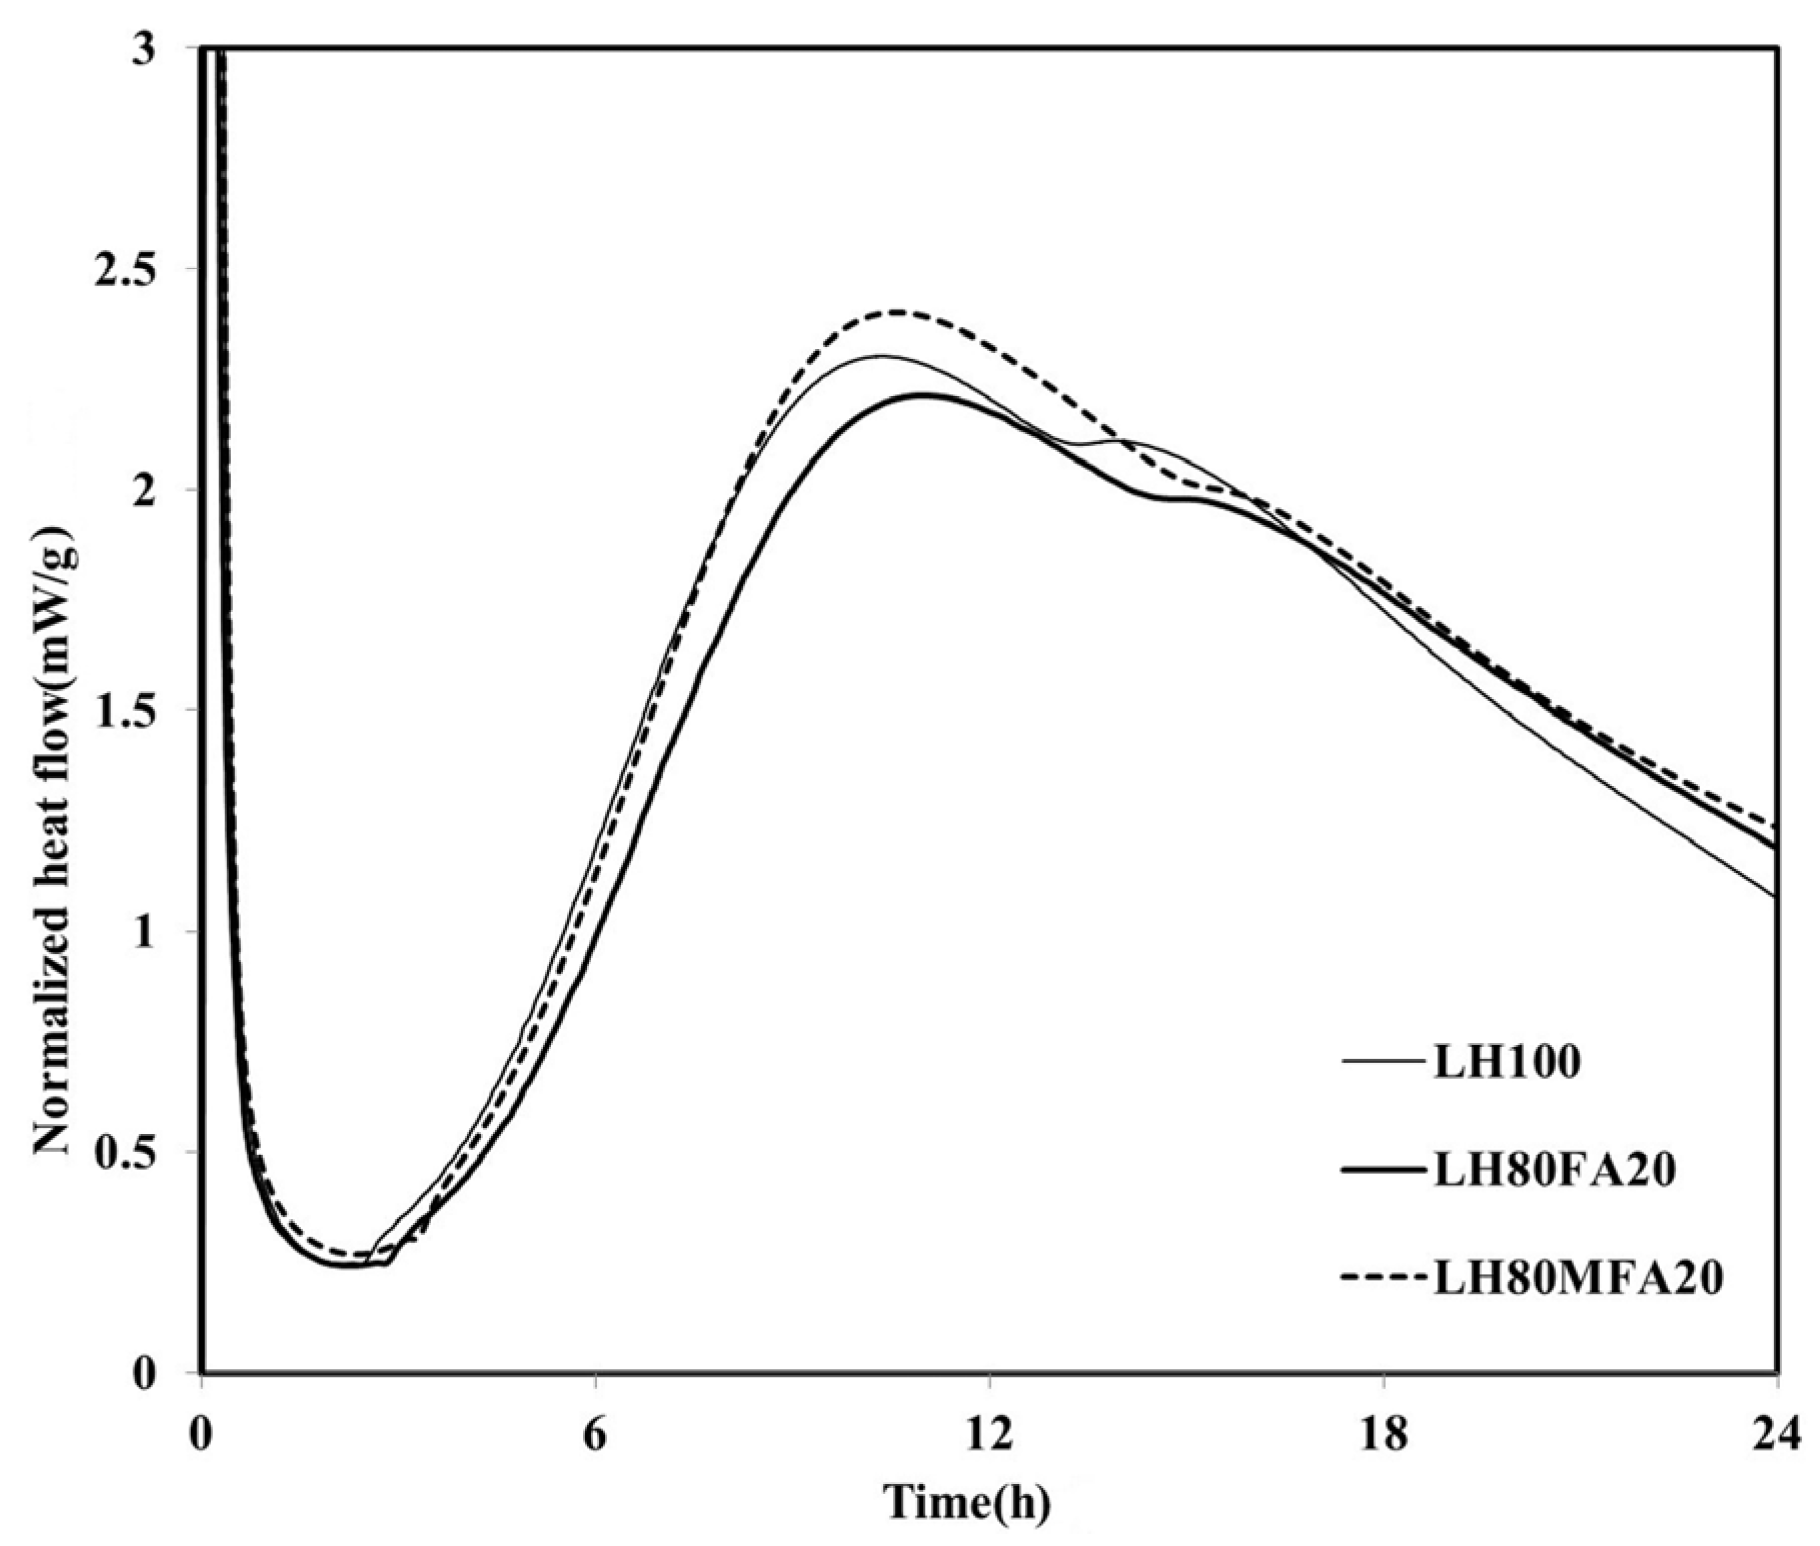
3.1. Isothermal Calorimetry
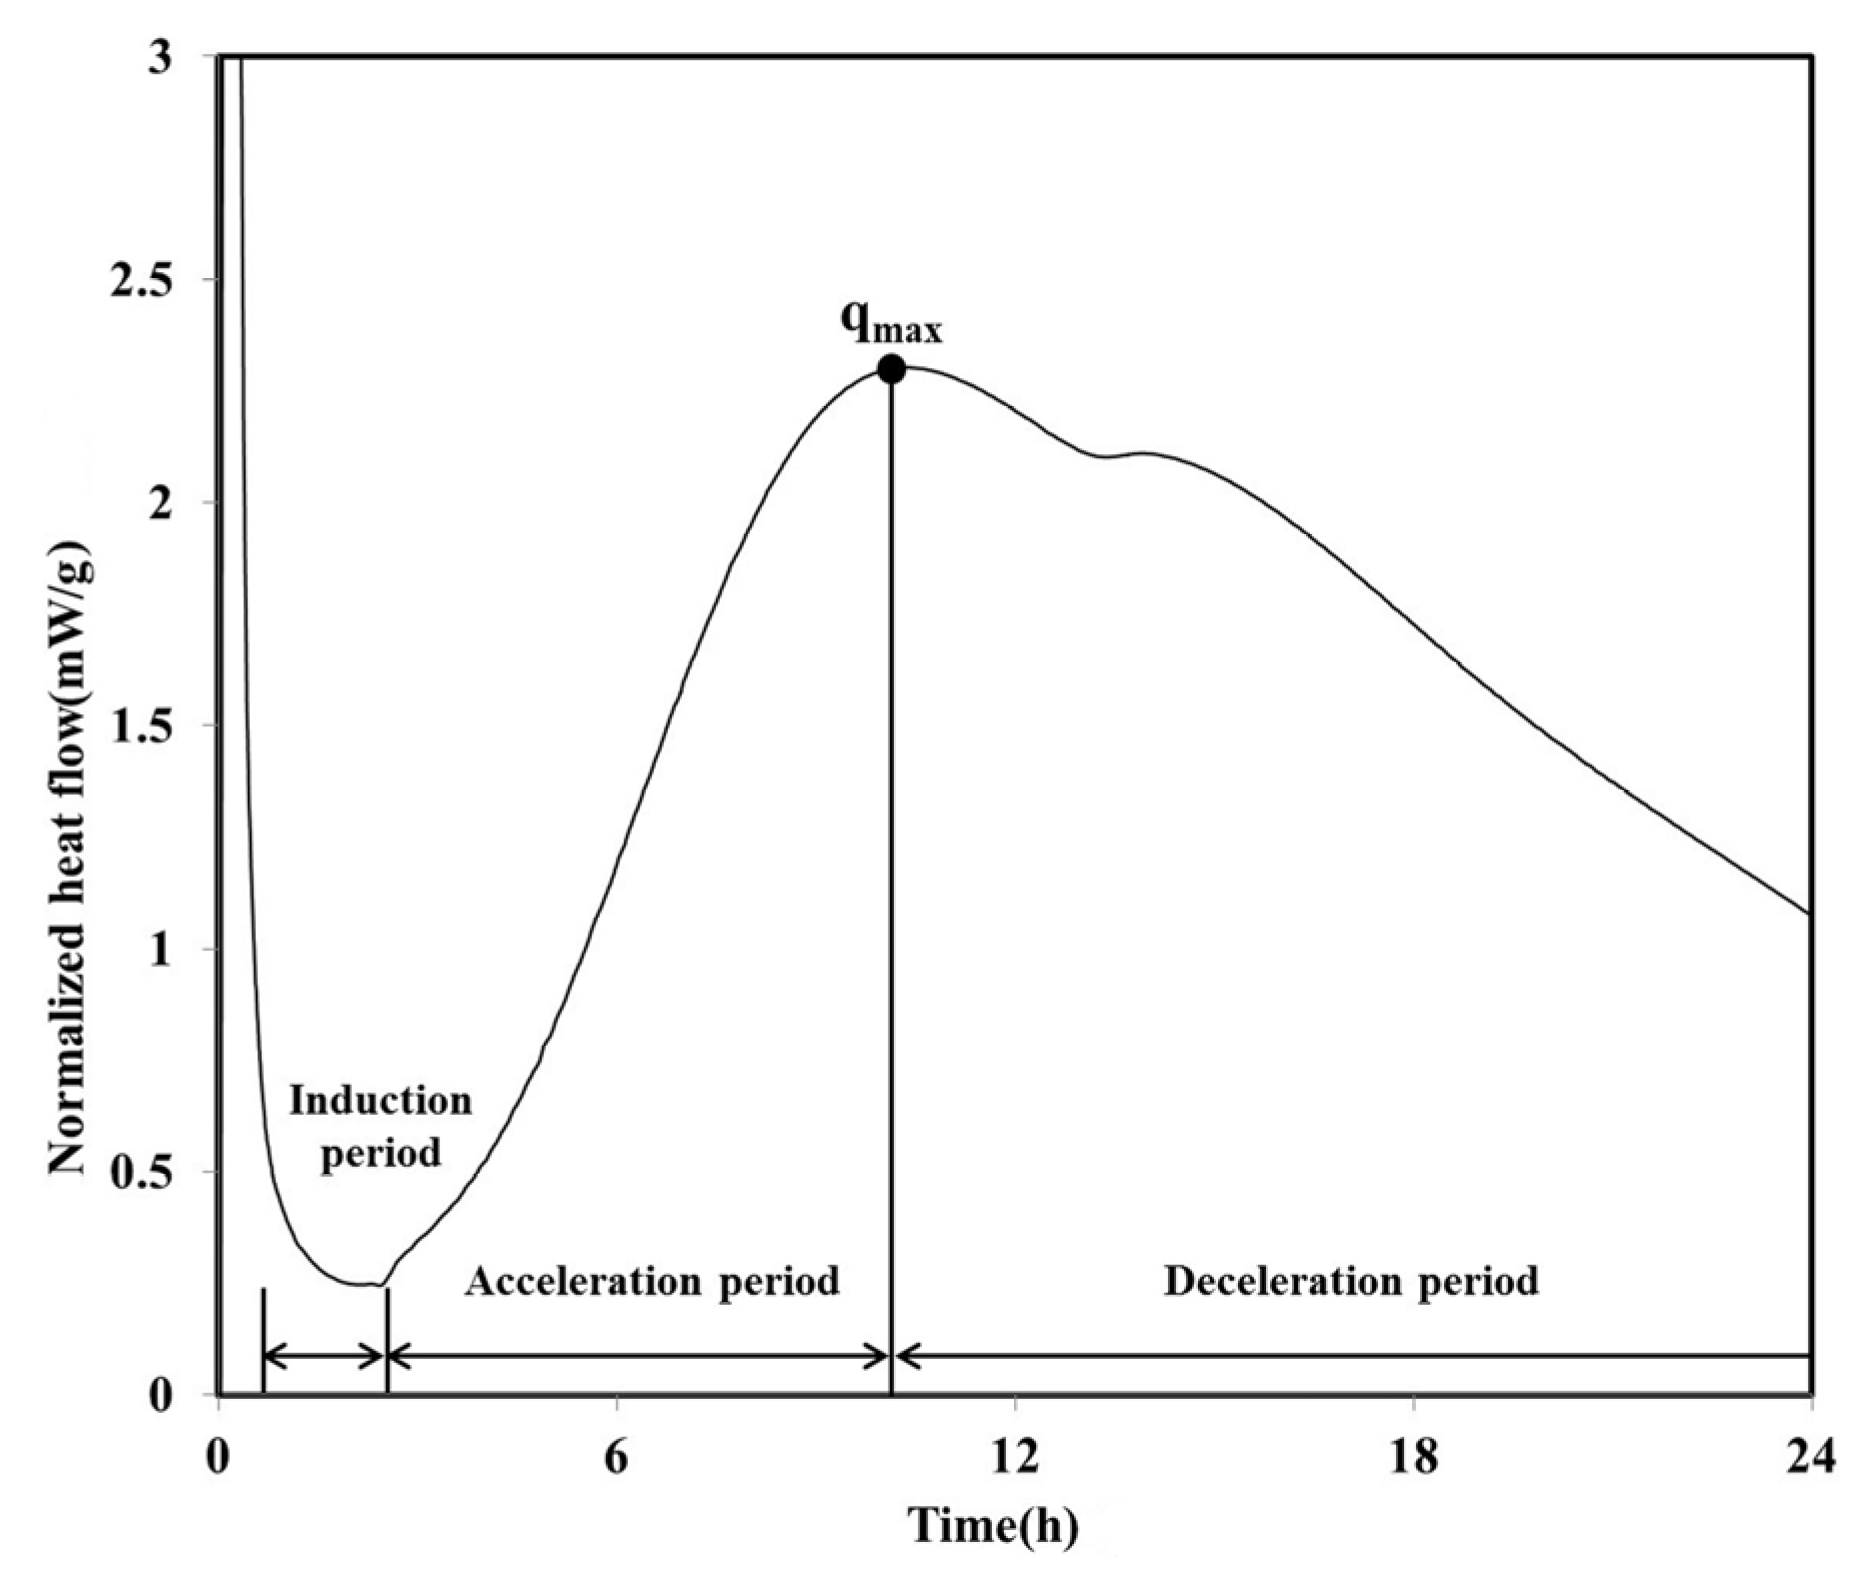
The heat flow curve of the LH100 specimen, consisting of 100% LHC, exhibits a shape similar to that of OPC (
Figure 2). Between approximately 1 and 2.5 h after the initiation of the hydration, an induction period was observed for the LH100 specimen. Following this induction period, the acceleration period commenced, in which hydration occurred; the maximum heat flow value (
qmax) of the LH100 specimen was 2.30 mW/g.
On reaching
qmax, the heat flow of the LH100 binder entered the deceleration period and subsequently decreased continuously. During the deceleration period, the amount of the calcium sulfate phase decreased, and a “shoulder” relating to the secondary aluminate reaction was observed [
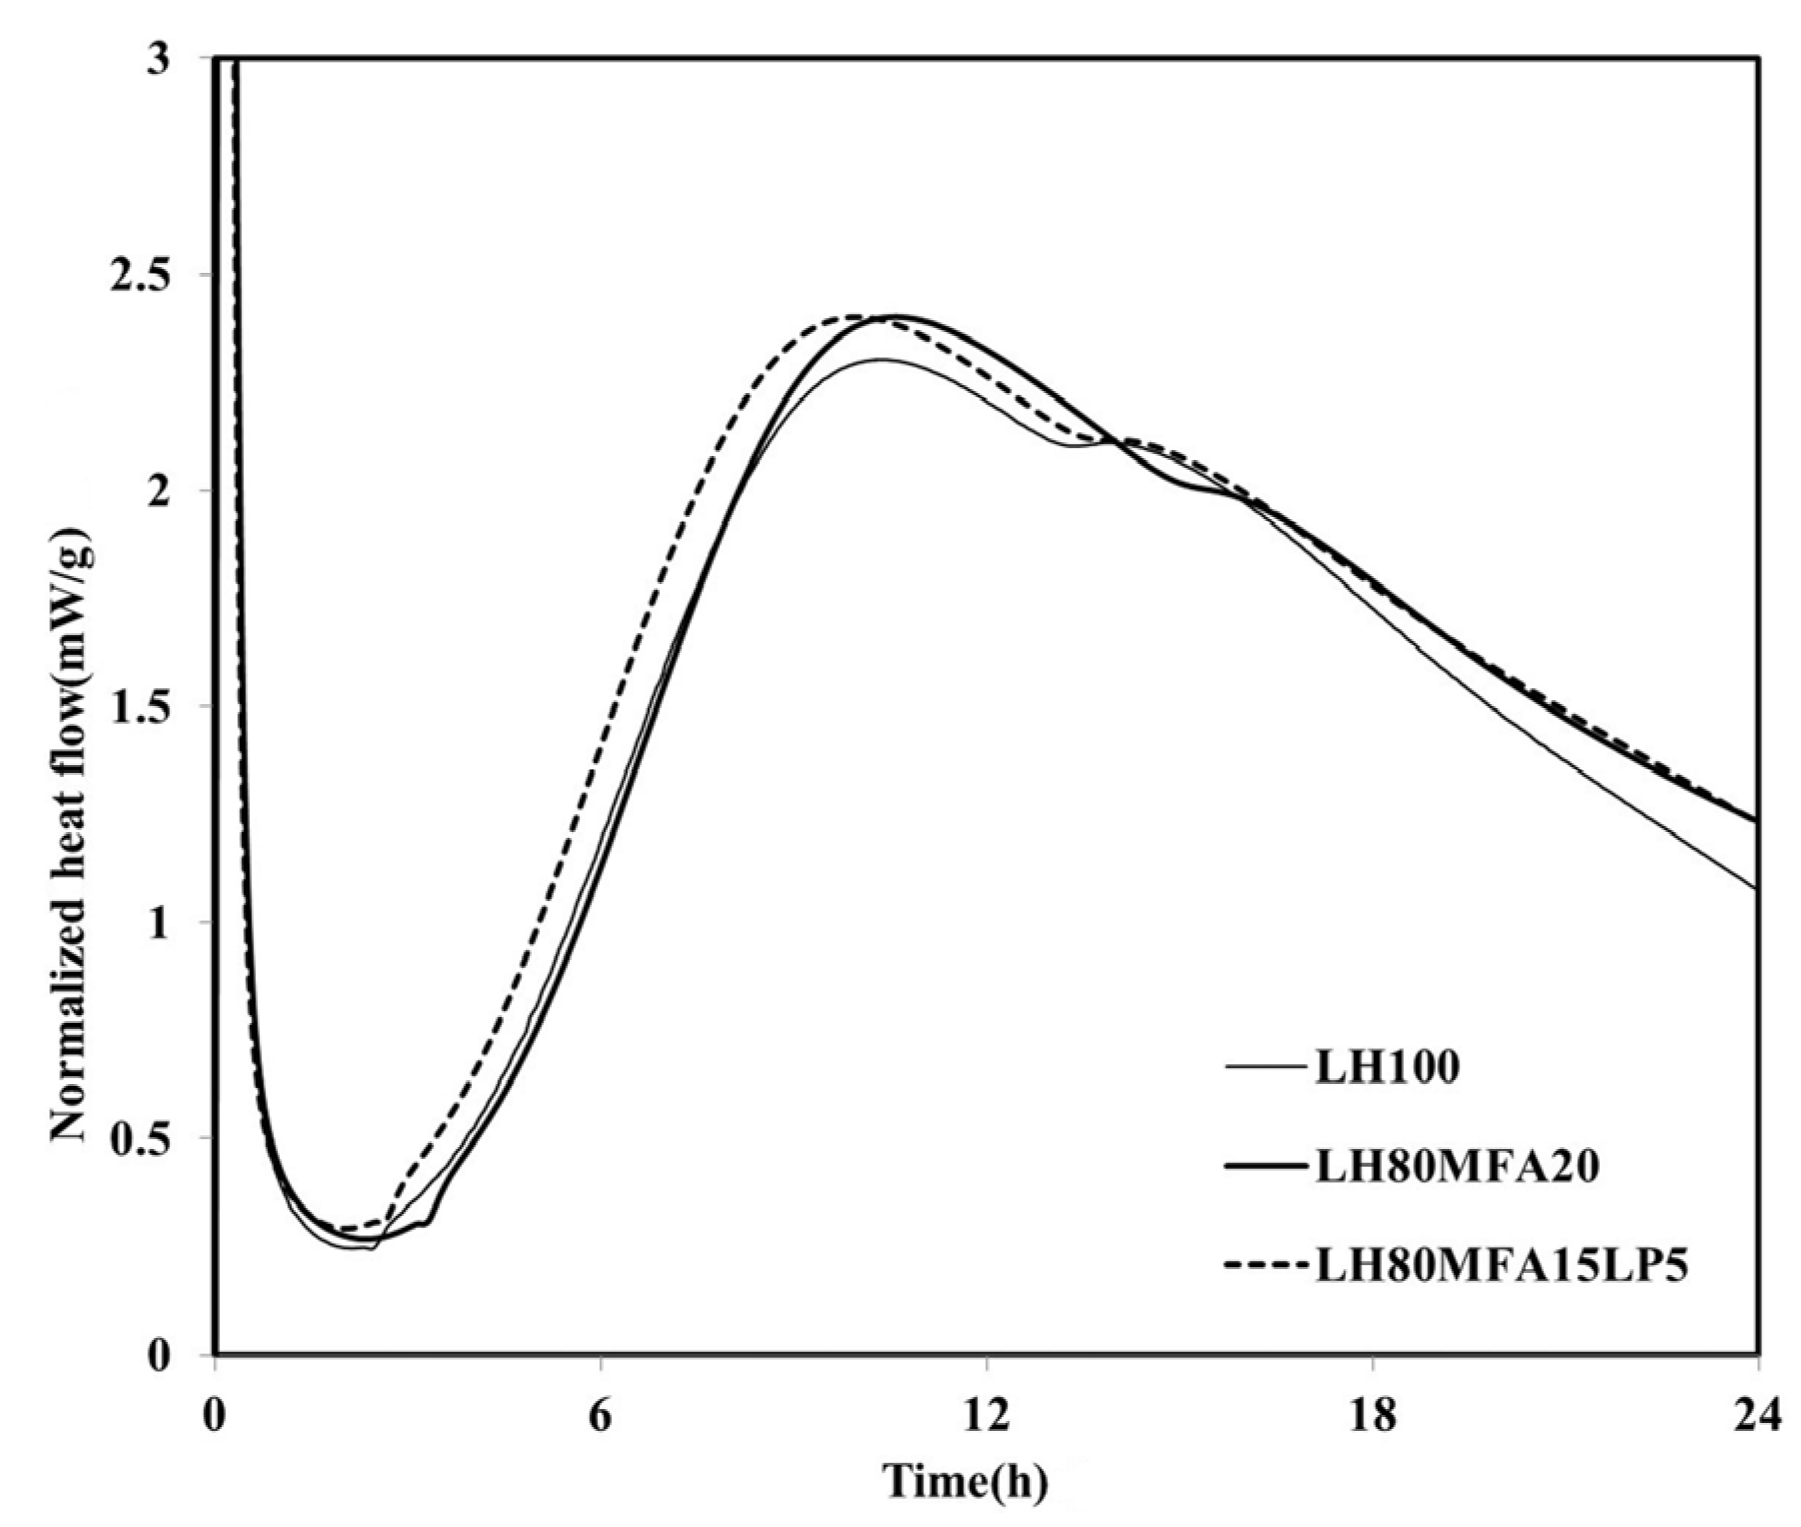
19]. The heat flows of the LH80FA20 and LH80MFA20 binders, in which 20 wt % of the LHC was substituted by FA and MFA of various levels of fineness, respectively, are shown in
Figure 3. The LH80FA20 and LH80MFA20 binders had longer induction times than the LH100 binder; they also took a longer time to reach
qmax and for the “shoulder” to appear. When FA was used as SCM, the delay phenomenon of early hydration (prior to 24 h) was exhibited because there was a decrease in the calcium concentration of the pore solution owing to the reaction of the aluminate with the calcium and FA in the pore solution; thus, the nucleation of the C–S–H was delayed [
18]. However, the
qmax values of the LH80FA20 and LH80MFA20 binders were higher than that of the LH100 binder, and following the appearance of the “shoulder”, the heat flow values were continuously higher than that of the LH100 specimen. The hydration of the cement was accelerated when FA was used as SCM because of the filler effect. When FA is used to replace cement, it fills the gaps between the cement particles. This yields additional nucleation sites, and because the effective ratio of water to cement increases, the hydration of the cement accelerates [
20]. As shown in
Figure 3, the
qmax of the LH80MFA20 specimen (in which 20% MFA was used as SCM, which had a higher fineness than the FA, while having the same substitution ratio) was greater than that of the LH80FA20 specimen (in which FA with a low-fineness was used as SCM). The
qmax value increased as the fineness of the FA increased because the increased fineness provided more nucleation sites, yielding a larger filler effect and the hydration reaction also accelerated due to the nucleation and filler effect [
17,
20,
21,
22].
Figure 2.
Normalized heat flow during initial 24 h of hydration (LH100).
Figure 2.
Normalized heat flow during initial 24 h of hydration (LH100).
Figure 3.
Normalized heat flows of LH80FA20 and LH80MFA20.
Figure 3.
Normalized heat flows of LH80FA20 and LH80MFA20.
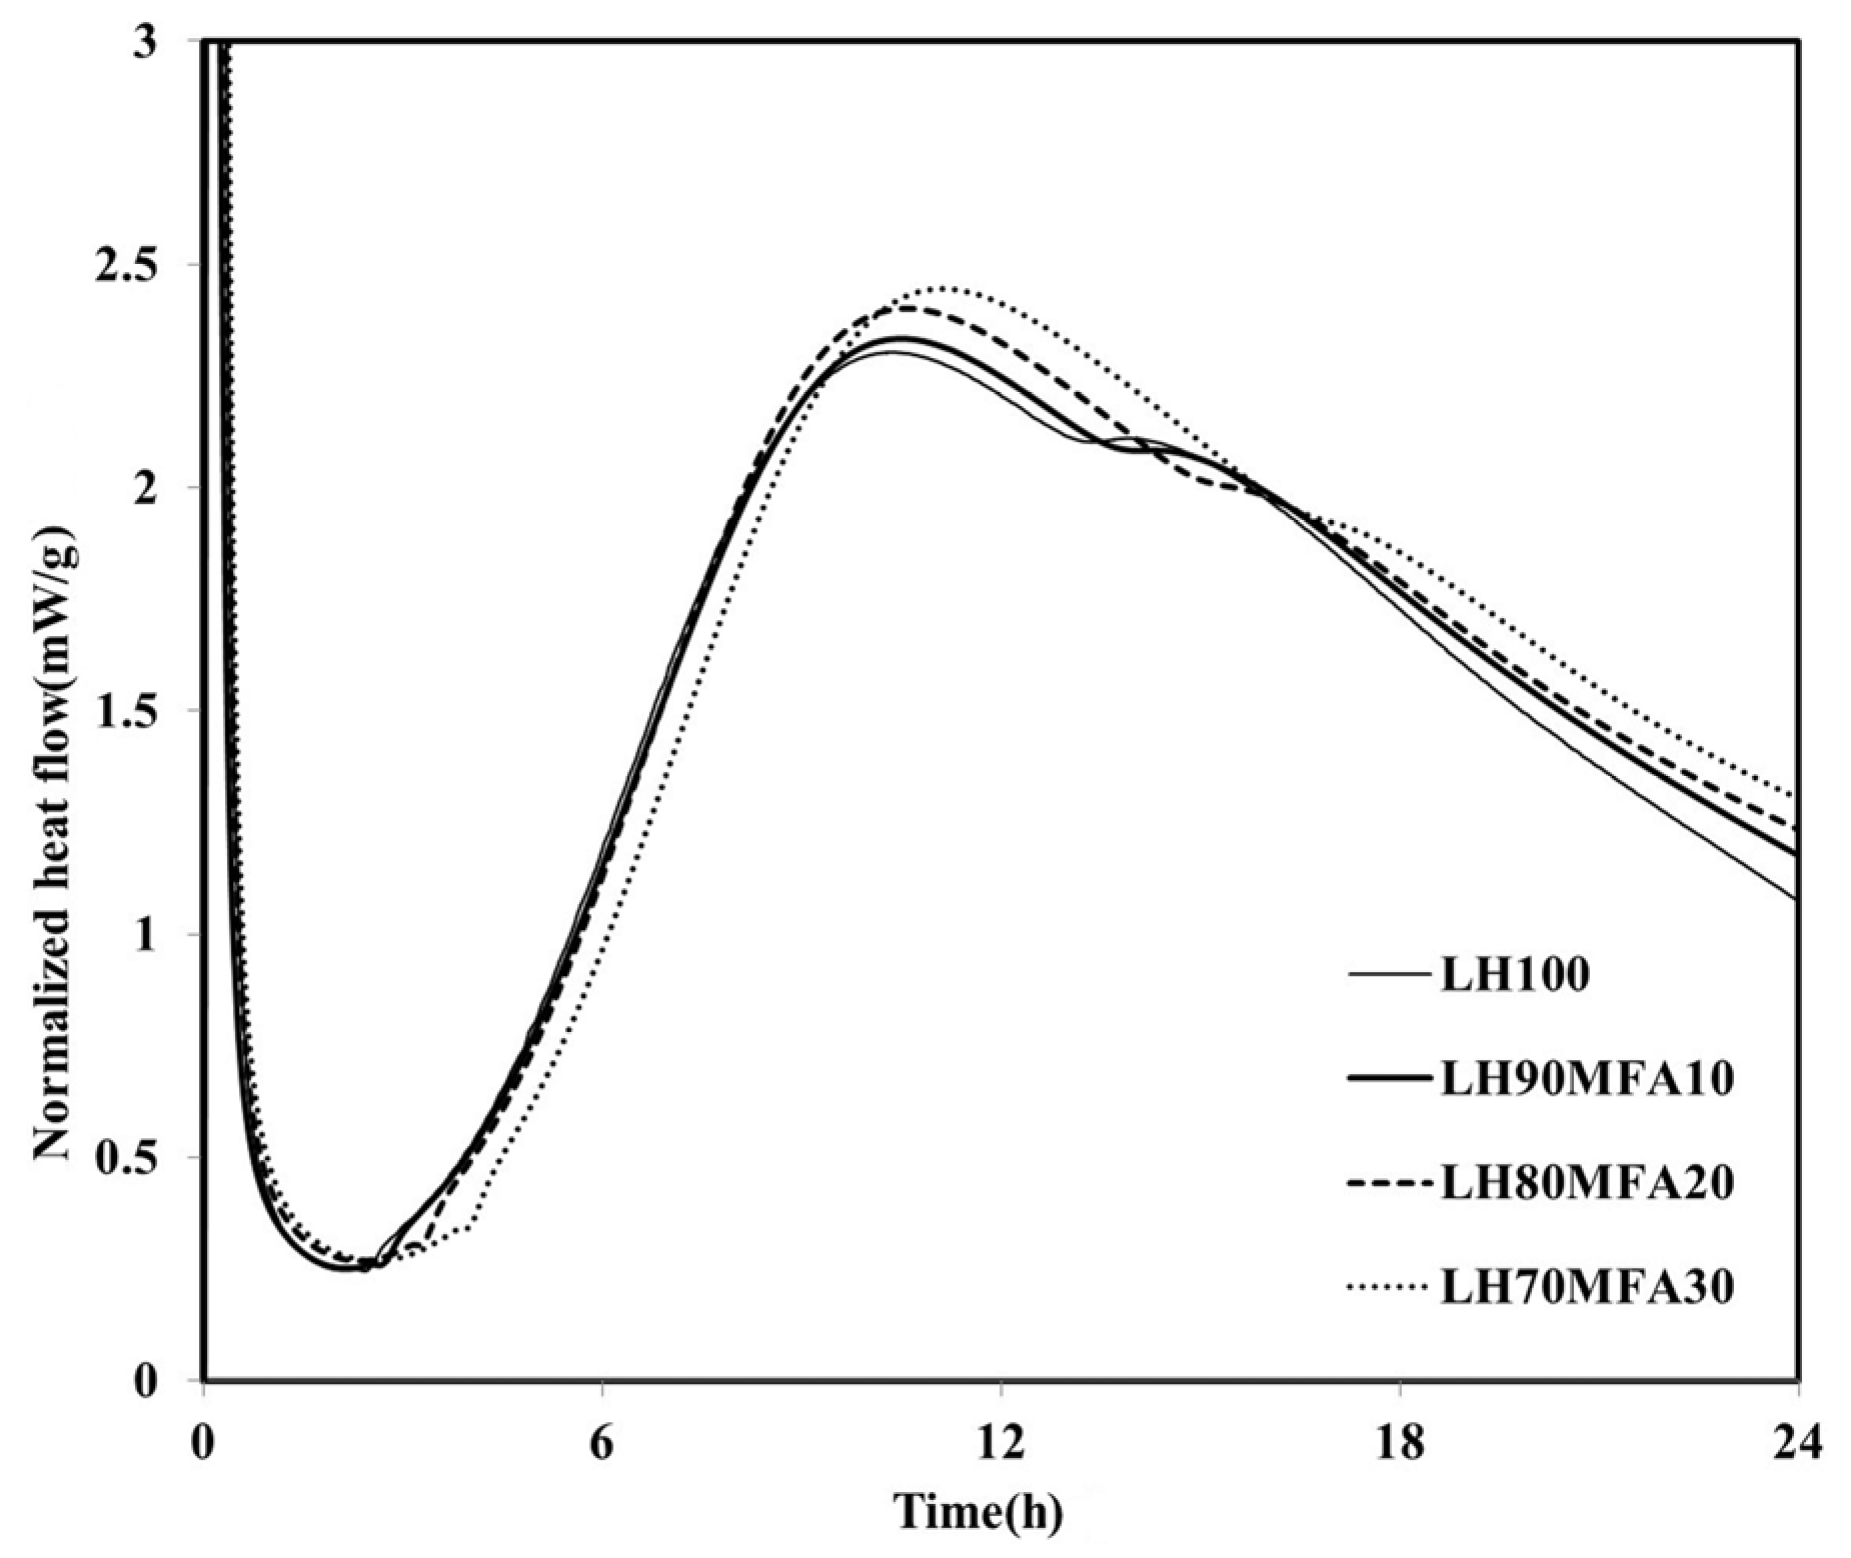
The heat flows of the specimens in which the LHC was substituted by 10%, 20% and 30% MFA (LH90MFA10, LH80MFA20 and LH70MFA30) are shown in
Figure 4. As the proportion of MFA increased, the induction period increased, and there was a delay in the time taken for the “shoulder” to appear. With the increase in the amount of FA, the concentration of Ca in the pore solution of cement decreases, which delays the formation of C–S–H nuclei [
23]. However, as the proportion of MFA increased, the hydration of the LHC accelerated; thus, between 17 and 48 h after the appearance of the “shoulder”, the
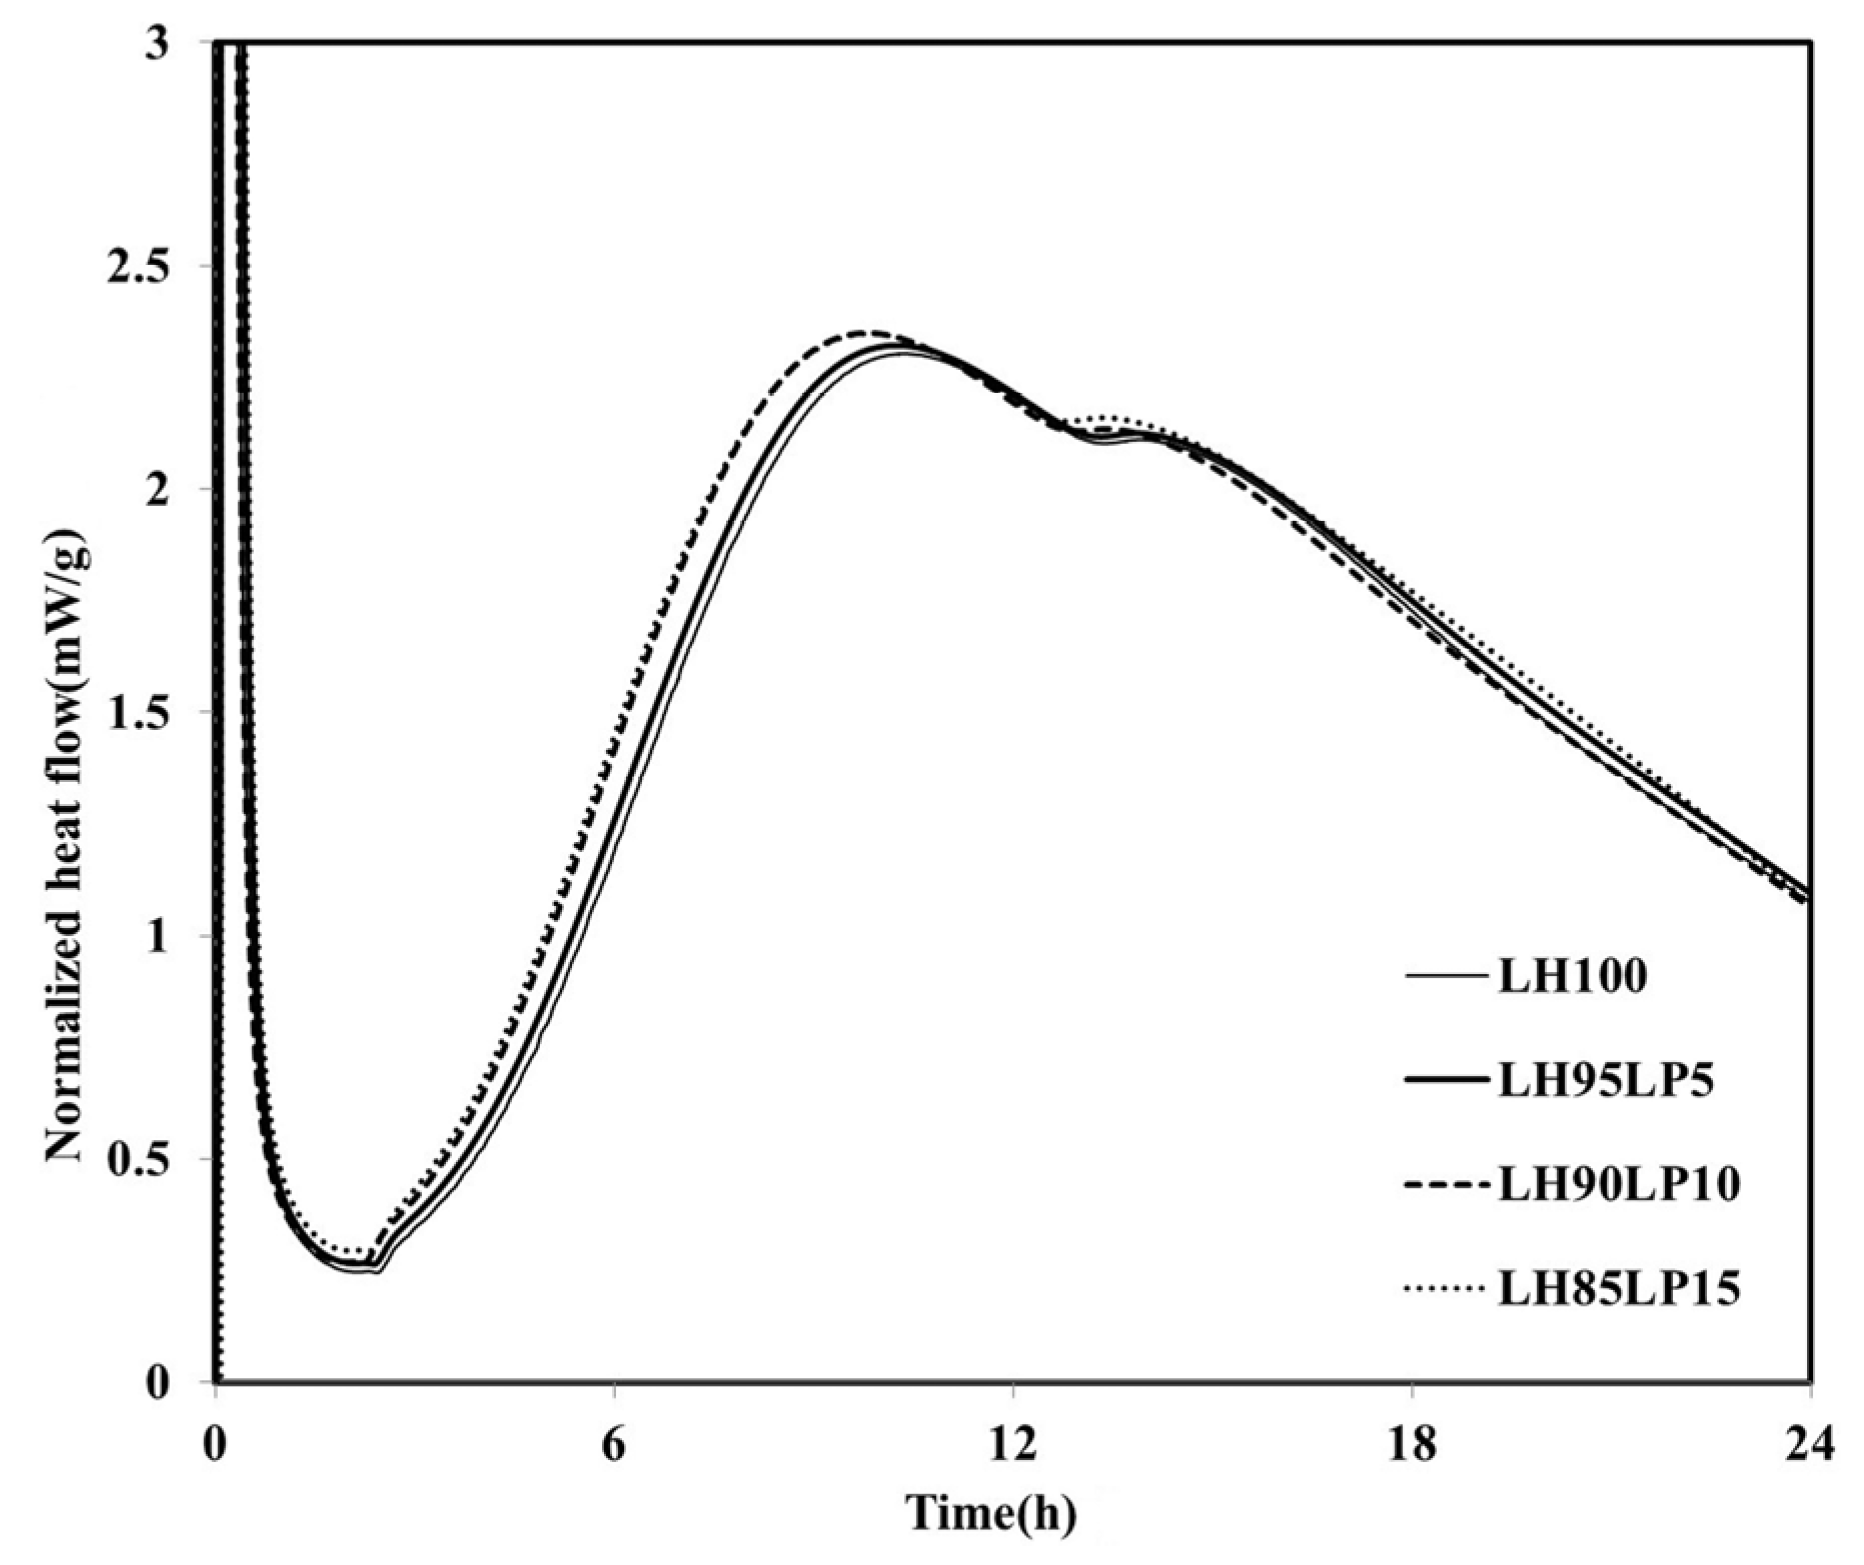
qmax and heat flow values were high. As the proportion of the FA increased, the filler effect increased, and consequently, there was an acceleration in the hydration of the cement. When LP was used to replace the LHC (LH95LP5, LH90LP10 and LH85LP15), the sample demonstrated different heat-flow characteristics to those observed when FA was used as SCM (
Figure 5). Compared with the LH100 binder, when LP was used as SCM, the heat flow values were neither increased nor delayed after reaching
qmax; the plotted results demonstrated curves almost identical to that of LH100.
Figure 4.
Normalized heat flows of LH90MFA10, LH80MFA20, and LH70MFA30.
Figure 4.
Normalized heat flows of LH90MFA10, LH80MFA20, and LH70MFA30.
Figure 5.
Normalized heat flows of LH95LP5, LH90LP10, and LH85LP15.
Figure 5.
Normalized heat flows of LH95LP5, LH90LP10, and LH85LP15.
However, regardless of the LP to LHC ratio, compared to the results of the LH100 binder, there was an increase in the
qmax and a reduction in the induction period, which is dissimilar to the case in which FA was used as SCM. The previous experimental investigations [
17,
18,
23,
24,
25,
26] showed that the induction period of cement tends to be shortened with the increase in the amount of limestone powder. This may be attributed to the fact that the formation of C–S–H nuclei can be accelerated by the physical absorption of CaCO
3. By examining the hydration heat characteristics according to the amount of LP used as a substitute, the induction period decreased according to the increment of LP to LHC ratio (5%, 10% and 15%) and the
qmax increased compared with those of LH100.
Figure 6 shows the heat flow measurement results for the LH80MFA15LP5 specimen, a binder in which a mixture of FA and LP was used as SCM. The
qmax of the LH80MFA15LP5 specimen was similar to that of the LH80MFA20 specimen, which used 20 wt % MFA as SCM for the LHC. However, the induction period, time taken to reach
qmax, and time at which the “shoulder” appeared for the LH80MFA15LP5 binder were lower than those for the LH80MFA20 binder. When the LHC was substituted by a mixture of FA and LP, the hydration-acceleration effect appeared to be more rapid than that when the LHC was replaced by FA alone.
Figure 6.
Normalized heat flow of LH80MFA15LP5.
Figure 6.
Normalized heat flow of LH80MFA15LP5.
Table 4 shows the 1-day and 3-day cumulative heat of hydration with respect to the binders used. For all the specimens, the cumulative heat of hydration increased as the aging time increased. The cumulative heat of hydration per g of LHC in the LH100 specimen was 129.50 and 192.01 J/g for 1 and 3 days of aging, respectively. Compared with the LH100 specimen, the cumulative heat of hydration per g of LHC was higher for the specimens in which the LHC was substituted by FA, LP and a mixture of FA and LP, regardless of the substitution ratio. Particularly, among the binders in which 20 wt % of the LHC was replaced, the LH80MFA15LP5 specimen (with a substitution mixture of FA and LP) exhibited a higher cumulative heat of hydration than the LH80FA20 and LH80MFA20 specimens, in which 20% of the LHC was replaced by FA alone.
However, the LH100 specimen had the highest cumulative heat of hydration per g of the binder because of the dilution effect. The substitution by the FA and LP reduces the content of LHC, which is a major reactant that produces heat and is directly involved in the hydration reaction [
17].
Table 4.
Cumulative heat of hydration emitted per g of low-heat cement (LHC) and per g of binder.
Table 4.
Cumulative heat of hydration emitted per g of low-heat cement (LHC) and per g of binder.
| Binder | 1 Day | 3 Days |
|---|
| LHC (J/g) | Binder (J/g) | LHC (J/g) | Binder (J/g) |
|---|
| LH100 | 129.50 | 129.50 | 192.01 | 192.01 |
| LH80FA20 | 129.71 | 103.77 | 193.76 | 155.01 |
| LH90MFA10 | 130.88 | 117.79 | 196.56 | 176.90 |
| LH80MFA20 | 133.01 | 106.41 | 207.23 | 165.78 |
| LH70MFA30 | 133.76 | 93.63 | 215.30 | 150.71 |
| LH95LP5 | 132.01 | 125.41 | 194.50 | 184.78 |
| LH90LP10 | 133.21 | 119.89 | 193.96 | 174.56 |
| LH85LP15 | 136.23 | 115.80 | 199.55 | 169.62 |
| LH80MFA15LP5 | 137.70 | 110.16 | 209.30 | 167.44 |
3.2. TGA
In general, when a hydration reaction proceeds within a cement paste, hydration products such as C–S–H and ettringite are produced, the free water decreases, the bound water increases, and the amount of Ca(OH)
2 increases. This is because the major mineral components of cement,
i.e., tricalcium silicate (C
3S) and dicalcium silicate (C
2S), produce C–S–H and Ca(OH)
2 through a hydration reaction.
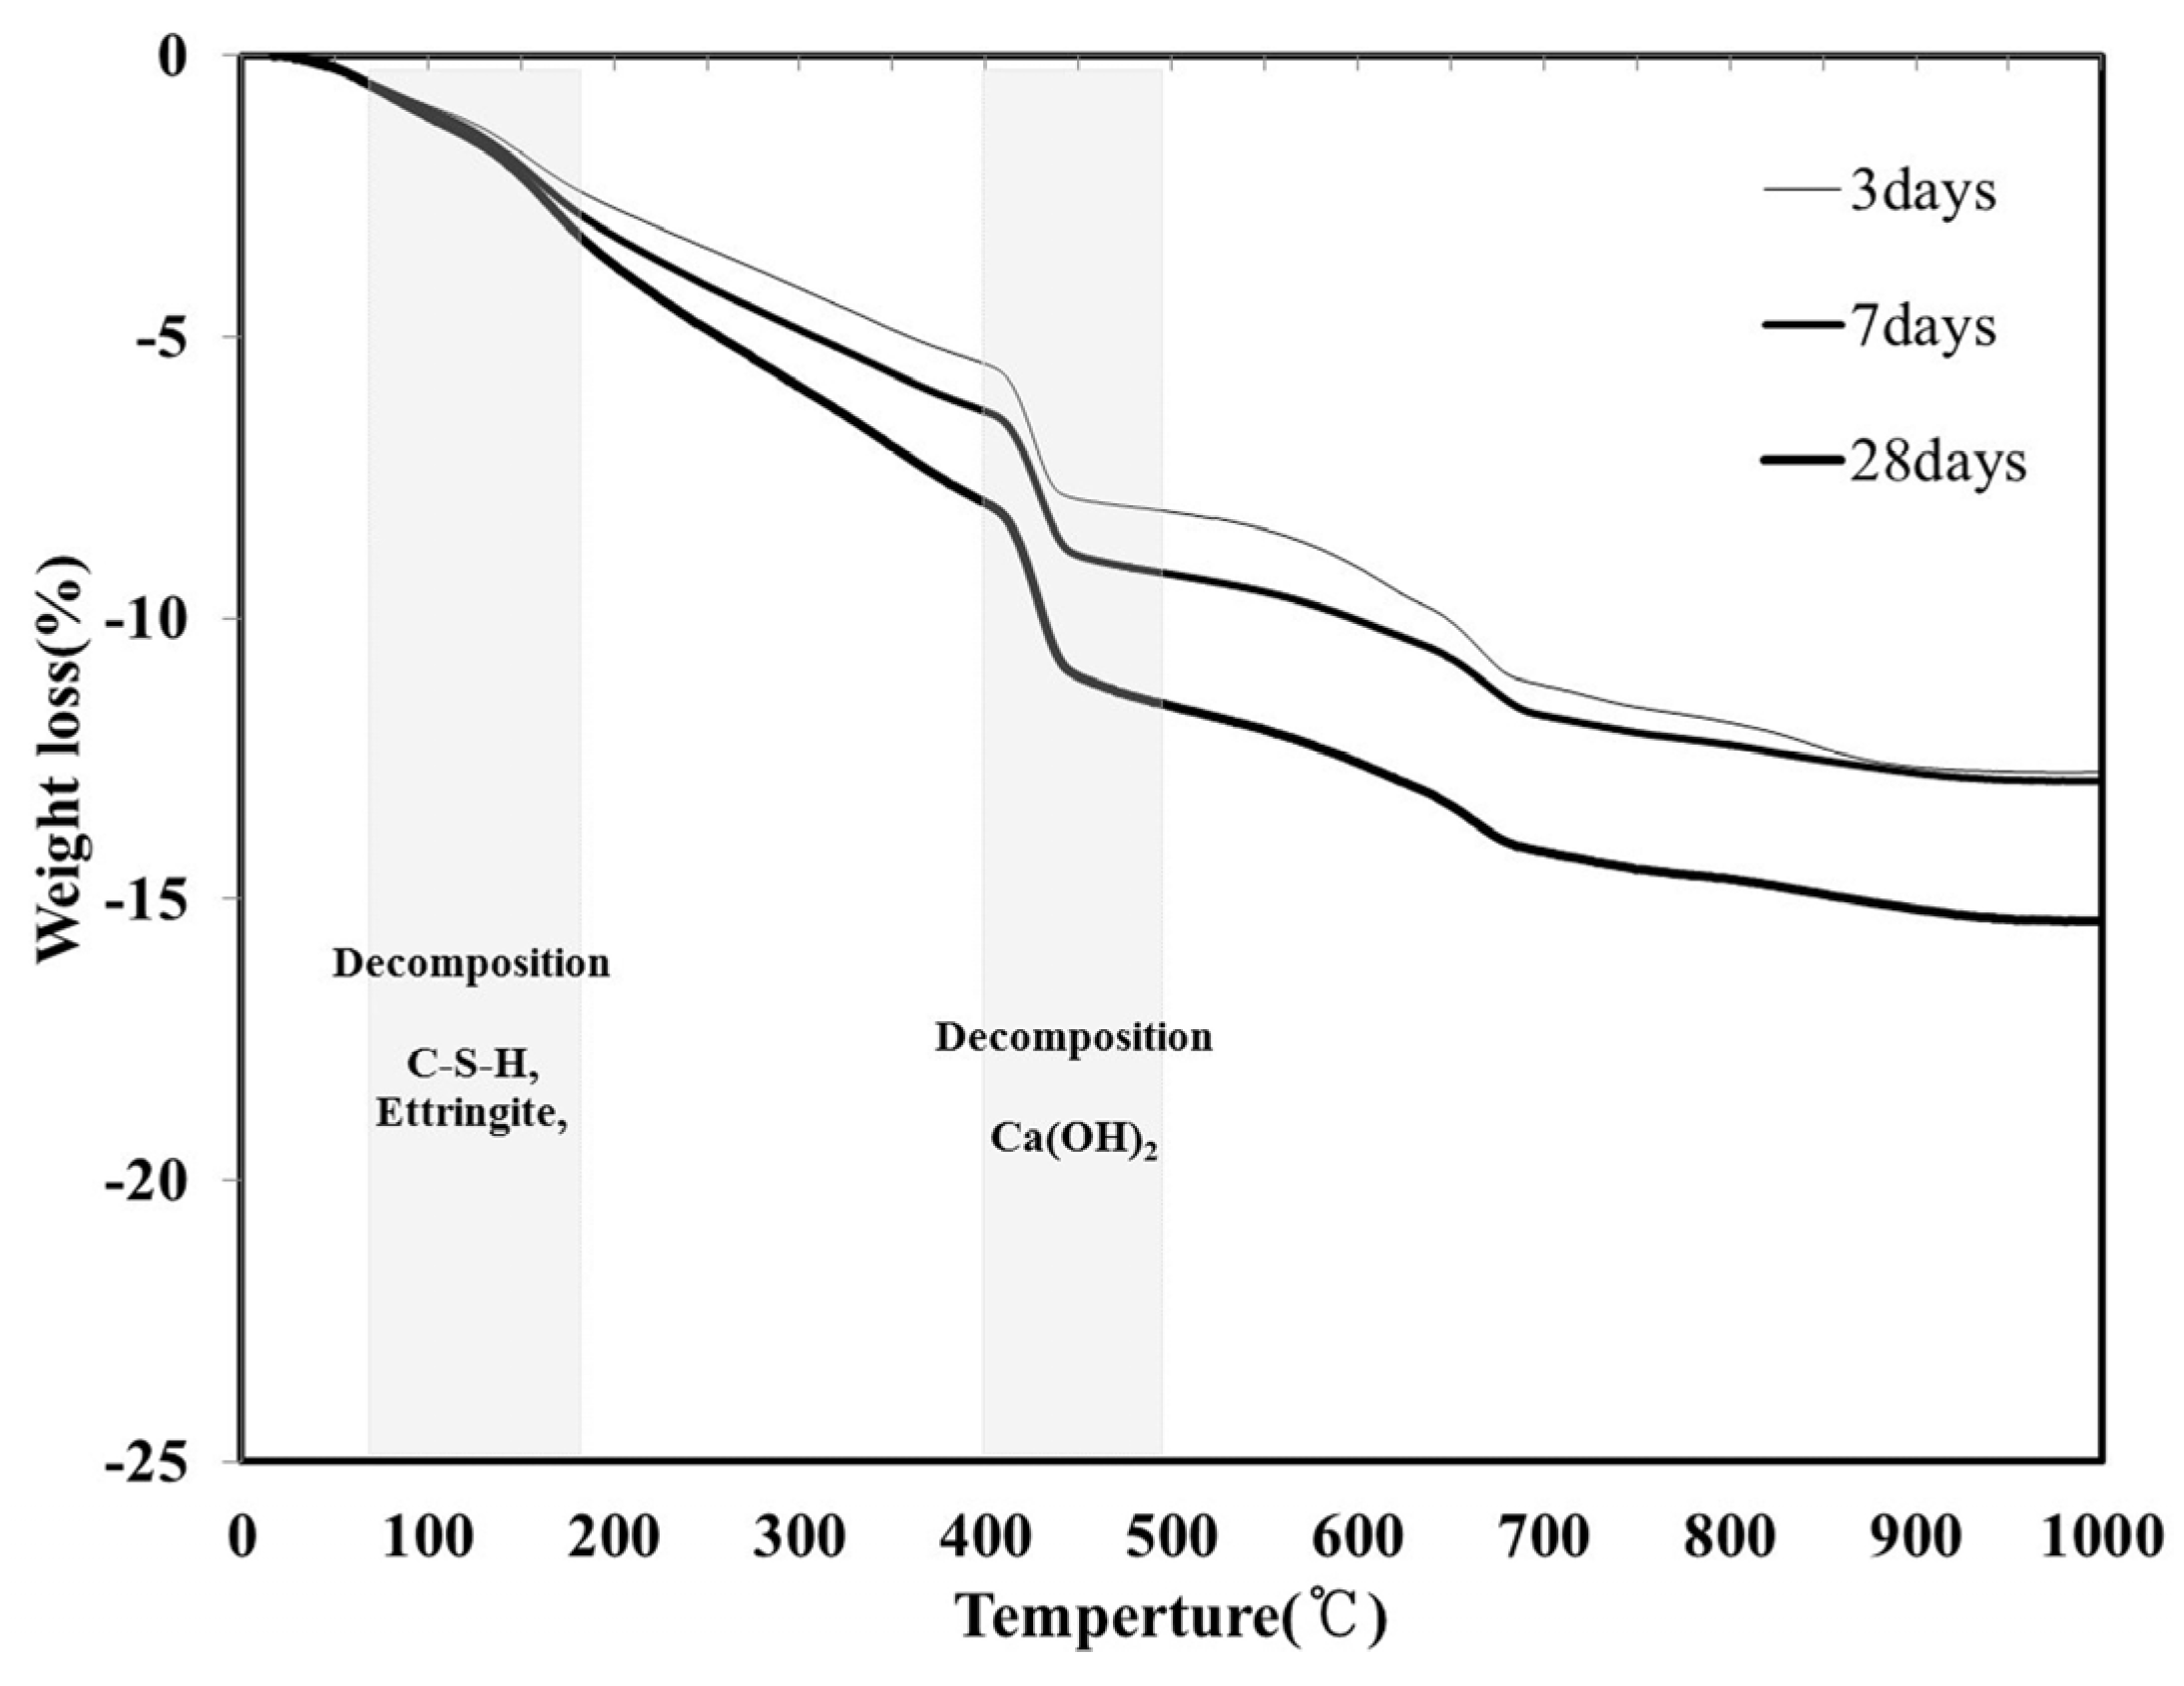
Figure 7 shows the TGA results (following 3, 7 and 28 days) for the LH100 specimen, using 100% LHC. For all the aging conditions, the mass decreased because of the decomposition of hydration products such as C–S–H and ettringite in the temperature range of 70–180 °C. In the temperature range of 400–480 °C, a decrease in the mass due to the decomposition of another hydration product, Ca(OH)
2, was observed. Because the amount of hydration product of the LH100 specimen increased with aging, there was also an increase in the mass reduction, as shown in
Figure 7.
Figure 7.
Thermogravimetric analysis (TGA) curve of the LH100 specimen at 3, 7 and 28 days.
Figure 7.
Thermogravimetric analysis (TGA) curve of the LH100 specimen at 3, 7 and 28 days.
Table 5 shows the bound water per 100 g of LHC, as calculated for the LH100, LH80FA20, LH80MFA20 and LH80MFA15L5 specimens using the TGA measurement results. In all specimens, the amount of bound water increased with aging. For the specimens in which the LHC was substituted by FA and LP (LH80FA20, LH80MFA20 and LH80MFA15LP5), owing to the acceleration of the hydration, there was an increase in the bound water content compared with that of LH100, which used 100% LHC.
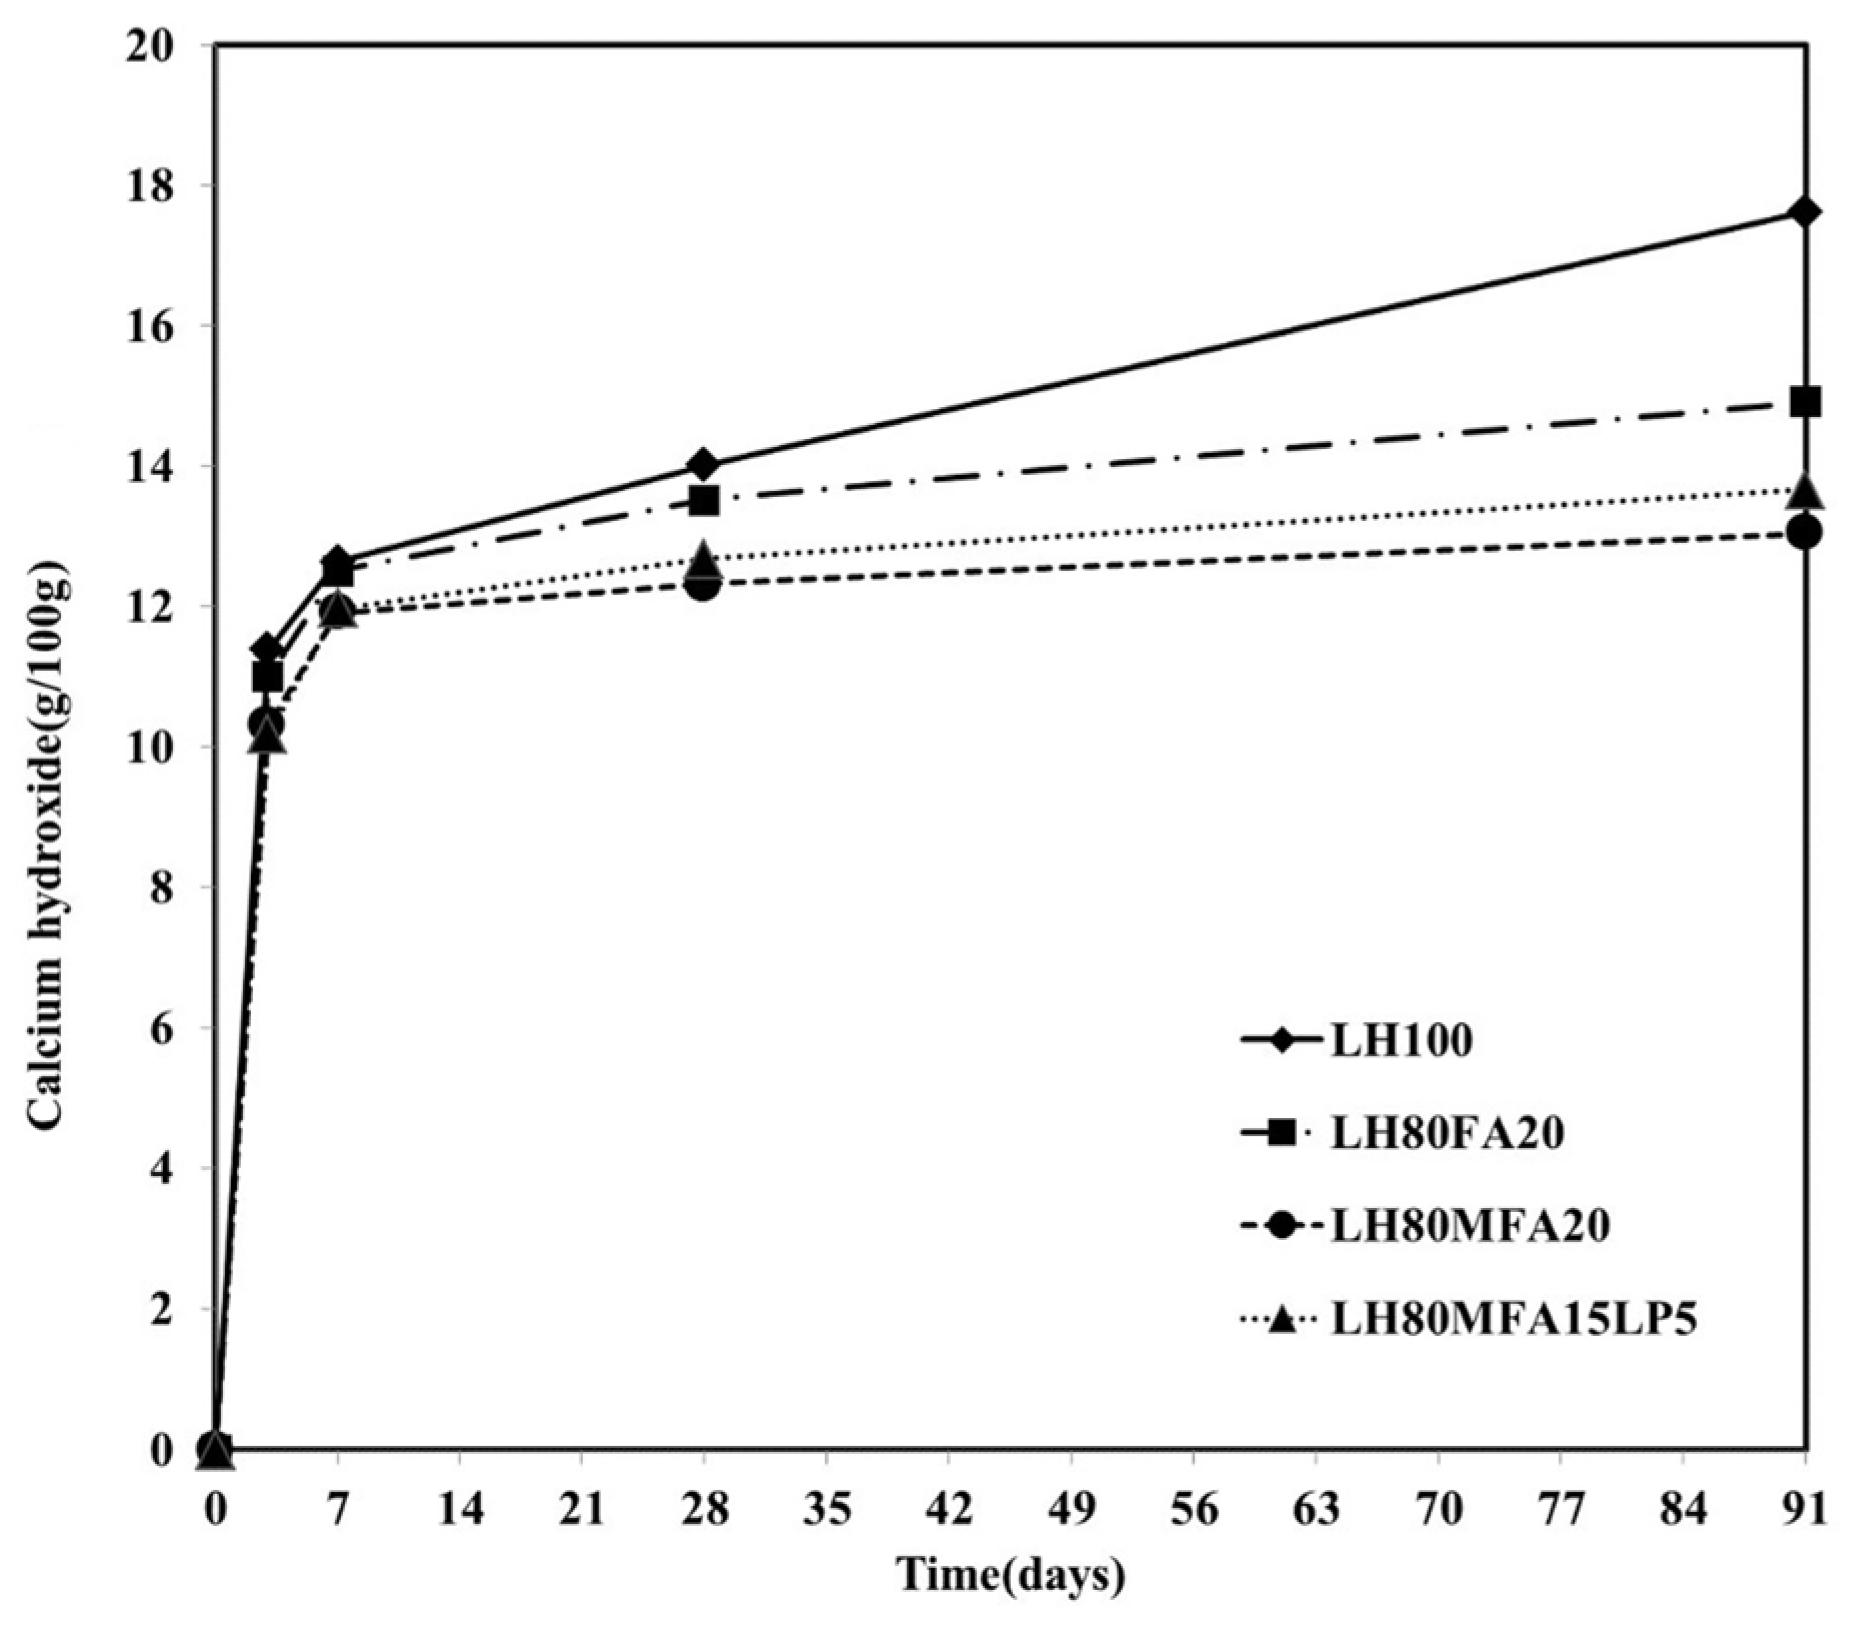
Figure 8 shows the Ca(OH)
2 content by age for the LH100, LH80FA20, LH80MFA20 and LH80MFA15L5 specimens. The Ca(OH)
2 contents were similar for all the specimens until an aging period of 7 days. However, following 28 days of aging, the Ca(OH)
2 contents of the LH80FA20, LH80MFA20 and LH80MFA15L5 specimens were much lower than that of the LH100 specimen. Following 91 days of aging, the difference in the Ca(OH)
2 content between these specimens was far larger. In the case of the LH100 specimen, the amount of Ca(OH)
2 continuously increased with aging because of the hydration of the cement. However, when FA was used as SCM, the Ca(OH)
2 was consumed by a pozzolanic reaction wherein additional C–S–H is formed because the Ca(OH)
2 produced through the hydration of the cement reacts with the amorphous silicate of the FA [
27,
28]. The pozzolanic reaction of the FA was observed after 7 or 28 days of aging, and it densifies the internal structure of the cement paste and increases the long-term strength [
29].
Table 5.
Amount of bound water per 100 g of LHC.
Table 5.
Amount of bound water per 100 g of LHC.
| Binder | 3 days | 7 days | 28 days |
|---|
| Bound Water (g) | Bound Water (g) | Bound Water (g) |
|---|
| LH100 | 8.60 | 9.86 | 12.22 |
| LH80FA20 | 8.61 | 11.03 | 12.82 |
| LH80MFA20 | 9.43 | 12.05 | 13.06 |
| LH80MFA15LP5 | 8.75 | 11.02 | 12.23 |
Figure 8.
Ca(OH)2 content.
Figure 8.
Ca(OH)2 content.
Following 28 days of aging, the Ca(OH)
2 content of the LH80MFA20 specimen with a high FA fineness is lower than that of the LH80FA20 specimen with a low FA fineness. Because the pozzolanic reactivity increases as the fineness of the FA increases, the Ca(OH)
2 consumption also increases [
17,
20,
30,
31]. Following 28 days of aging of the LH80MFALP15 specimen (in which 15% MFA and 5% LP is used as SCM for 20% of the LHC), the Ca(OH)
2 consumption was greater than that for the LH80FA20 specimen (in which 20% of the LHC is replaced with FA, which has a lower fineness than MFA) and lower than that for the LH80MFA20 specimen (in which 20% of the LHC is replaced with MFA). Specifically, following 28 days, the Ca(OH)
2 was consumed because of the pozzolanic reaction of the MFA. However, the influence of LP on the Ca(OH)
2 consumption was small.
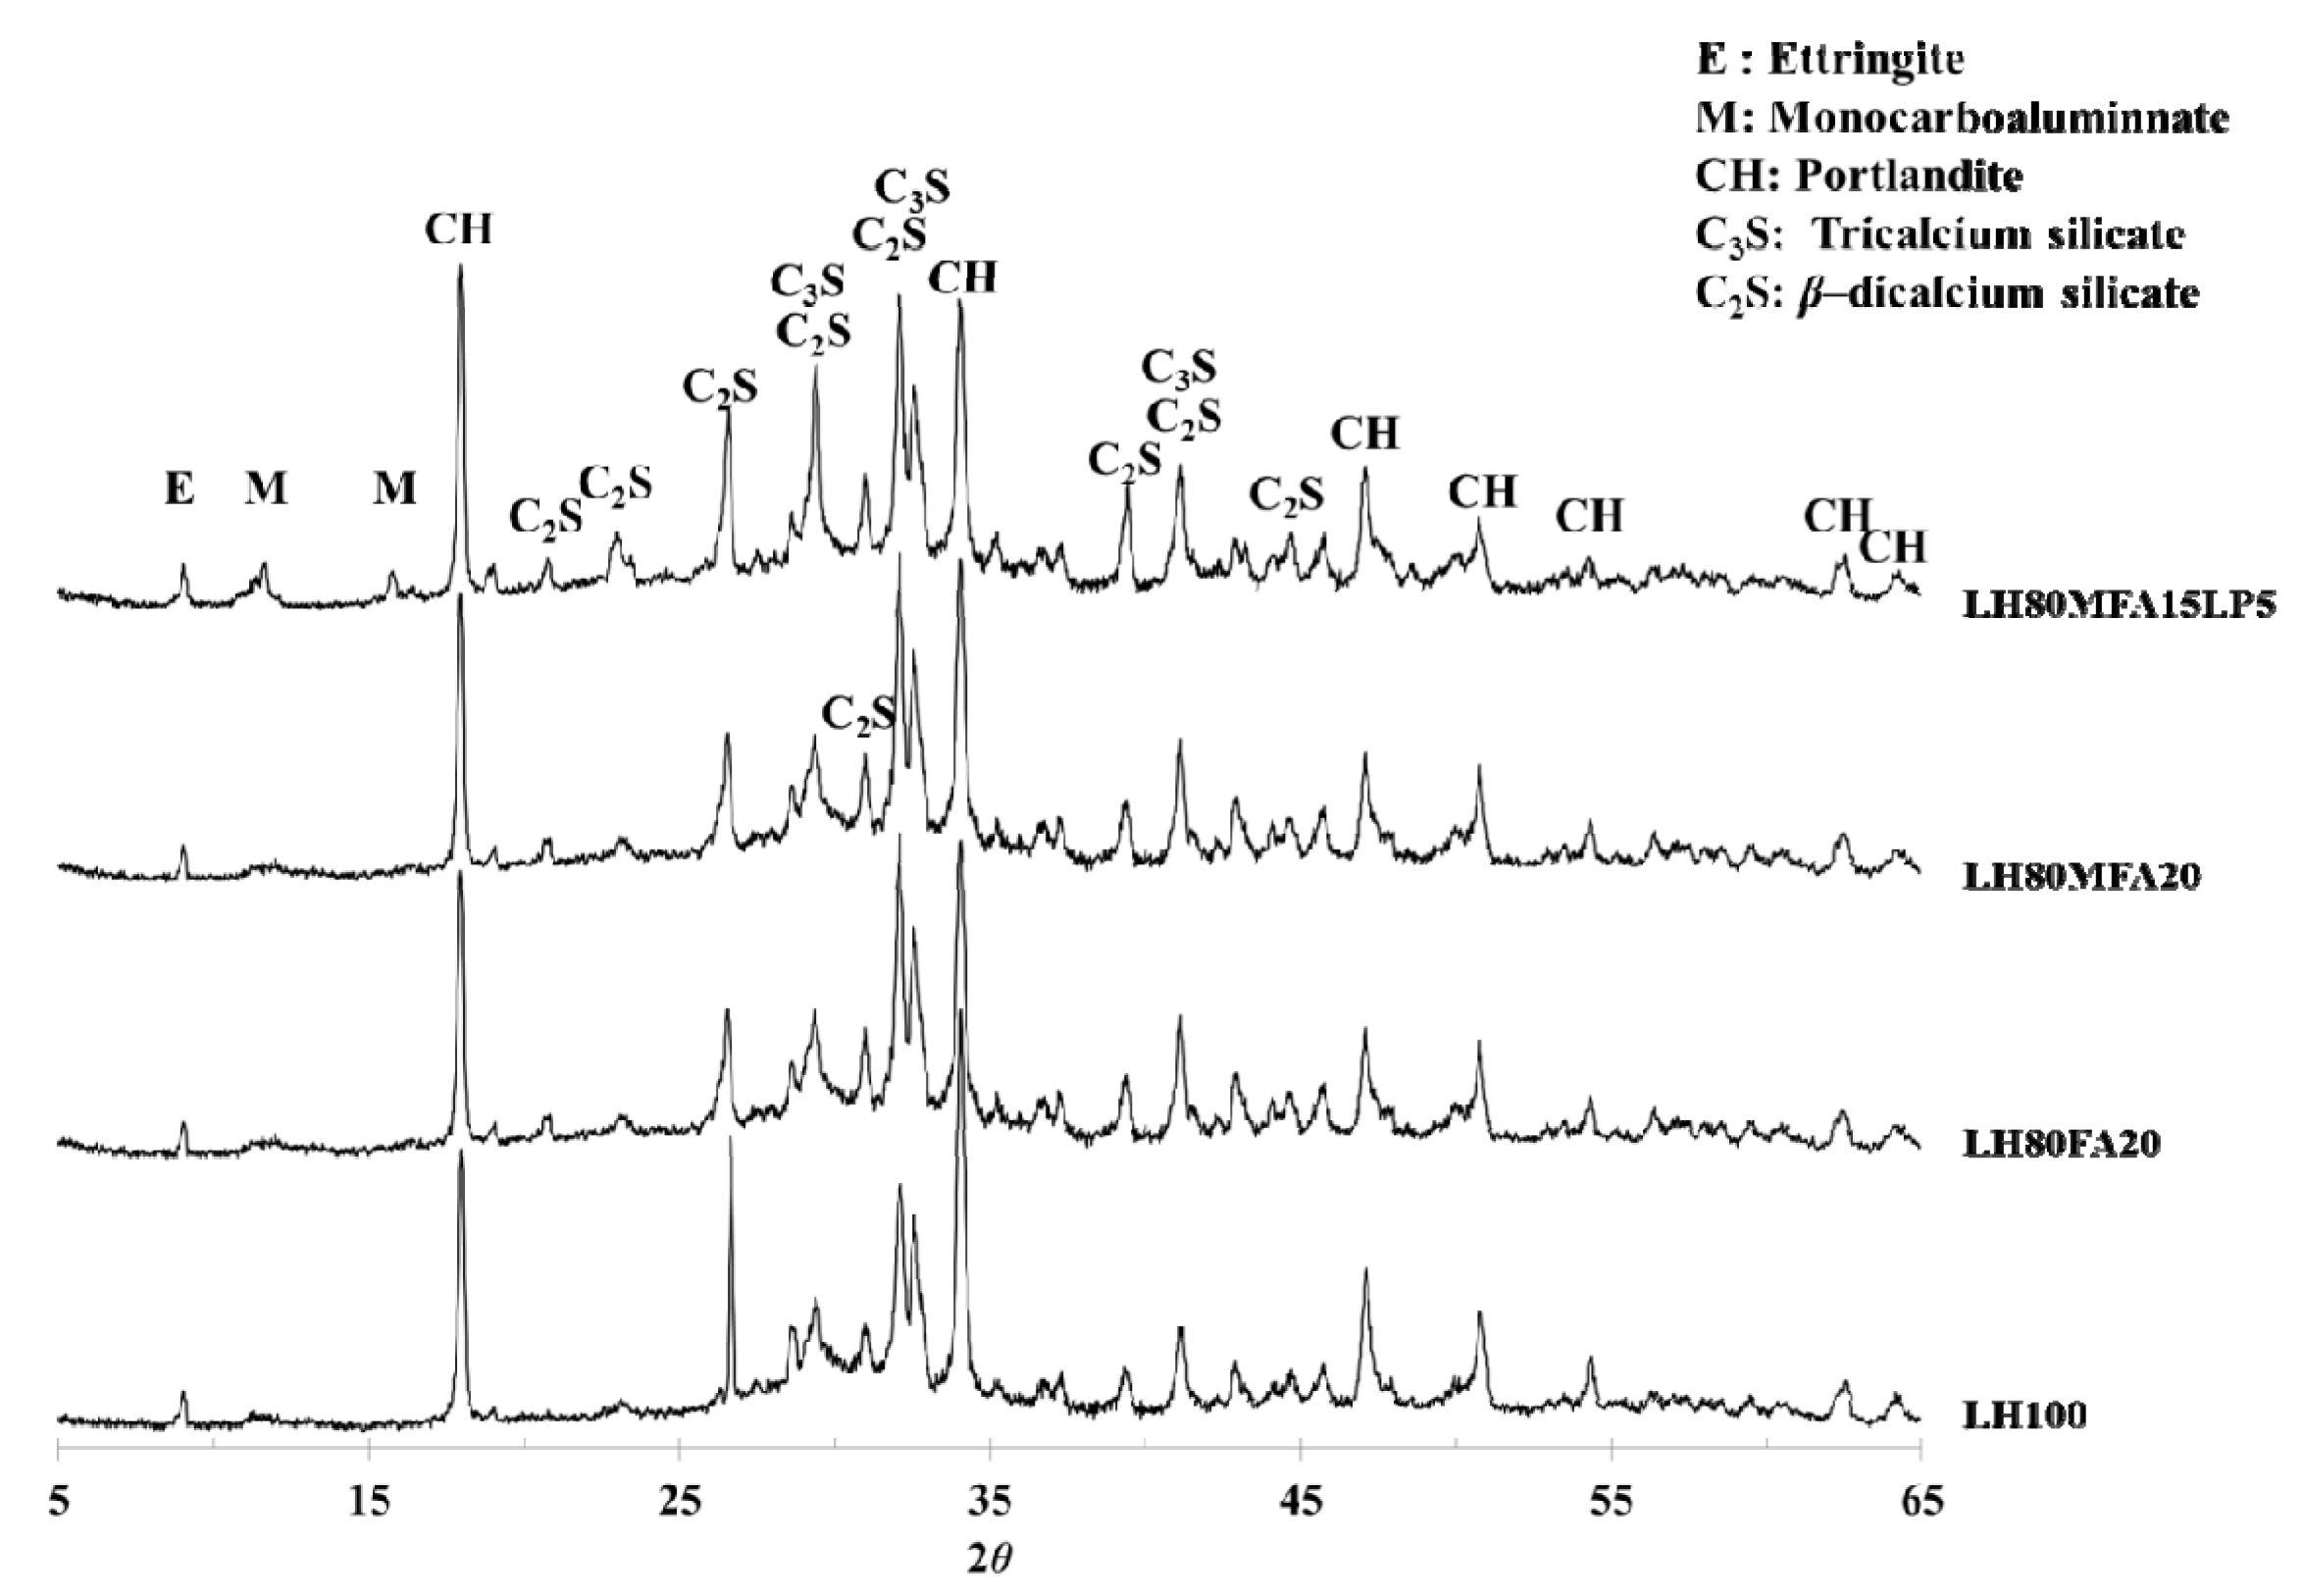
3.3. XRD
Figure 9 shows XRD patterns of the LH100, LH80FA20, LH80MFA20 and LH80MFA15LP5 specimens at 28 days. In all the specimens, portlandite (Ca(OH)
2) was observed as a major crystal phase. Ettringite and unhydrated C
2S and C
3S were also observed. C
3A, a cement mineral, forms ettringite through a hydration reaction. However, if the amount of sulfate decreases within the cement paste, the ettringite reacts with the unhydrated C
3A and produces monosulfate. In the case of such a conversion from ettringite to monosulfate, the volume of the hydration product decreases, and the porosity of the cement paste increases. However, if OPC is replaced by LP, the ettringite is not converted into monosulfate, and carboaluminate (hemicarboaluminate, monocarboaluminate) is produced [
28,
29,
32].
LHC was used as the cement in this study. Compared with OPC, it has a lower C
3A content and can thus form carboaluminate by reacting with CaCO
3. However, monocarboaluminate was observed in the LH80MFA15LP5 specimen (in which a mixture of FA and LP was used as SCM), and this was not observed in the other specimens. This result correlates with the results of other researchers; when a mixture of FA and LP is used as SCM, alumina is supplied from the FA, and carboaluminate is subsequently formed [
17,
28].
Figure 9.
X-ray diffraction (XRD) patterns at 28 days.
Figure 9.
X-ray diffraction (XRD) patterns at 28 days.
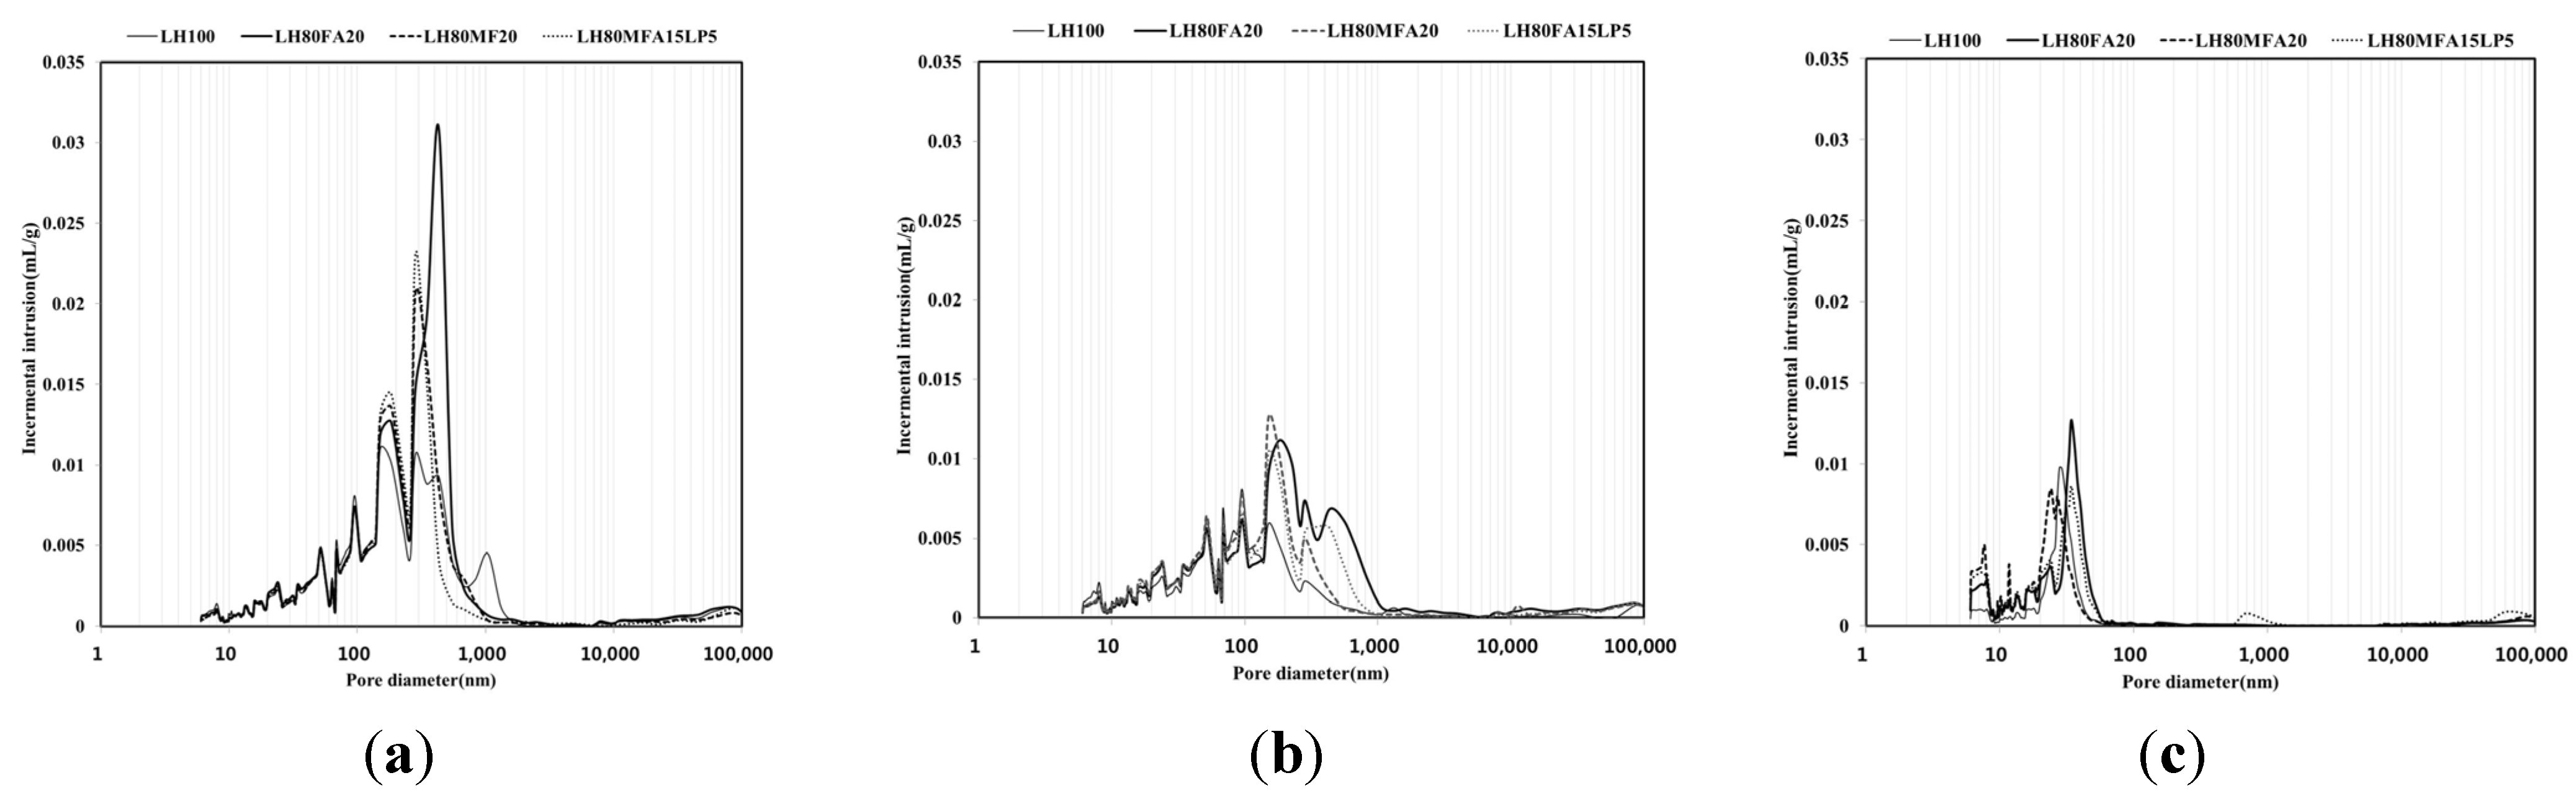
3.4. MIP
Figure 10 shows the pore-size distribution for the LH100, LH80FA20, LH80MFA20 and LH80MFA15LP5 specimens with respect to age (3, 7 and 28 days). As the curing age increased, the porosity of each specimen decreased. At 3 and 7 days of ageing, macro-capillary pores of size 50–1000 nm were observed; however, following 28 days of aging, these macro-capillary pores were not observed. At 28 days of aging, the pores of each specimen consisted of micro-capillary pores of size 50 nm or smaller; the specimens that had been aged for 3 and 7 days had a similar amount of gel pores of size 10 nm or less. However, at 28 days, the specimens using binders in which FA was used as SCM (LH80FA20, LH80MFA20 and LH80MFA15LP5) had a larger amount of gel pores of size 10 nm or less than the specimen using LHC alone (LH100). At 28 days, the FA with a high fineness had a larger amount of gel pores than the FA with a low fineness. However, there was no increase in the amount of gel pores for the substitution mixture of FA and LP.
As the aging progressed, the number of micropores inside the pastes increased, and the average pore size for each specimen decreased (
Table 6). At 3 and 7 days of aging, the LH100 binder had a smaller average pore size than the specimens that used FA or LP as SCM (LH80FA20, LH80MFA20 and LH80MFA15LP5). However, at 28 days of aging, the specimens that used FA as SCM (LH80FA20, LH80MFA20 and LH80MFA15LP5) exhibited a smaller average pore size than that of the LH100 specimen. Additional hydrates were produced by the pozzolanic reaction of the FA, and the density of pores within the paste was high [
20].
Figure 10.
Pore-size distribution at: (a) 3 days; (b) 7 days; (c) 28 days.
Figure 10.
Pore-size distribution at: (a) 3 days; (b) 7 days; (c) 28 days.
Table 6.
Average pore size.
Table 6.
Average pore size.
| Binder | 3 Days | 7 Days | 28 Days |
|---|
| Average Pore Size (nm) | Average Pore Size (nm) | Average Pore Size (nm) |
|---|
| LH100 | 42.0 | 28.5 | 21.2 |
| LH80FA20 | 49.7 | 38.1 | 18.5 |
| LH80MFA20 | 49.1 | 32.9 | 15.0 |
| LH80MFA15LP5 | 46.3 | 33.6 | 16.7 |


