
Enhancing Corrosion and Wear Resistance of AA6061 by Friction Stir Processing with Fe78Si9B13 Glass Particles

Abstract
:1. Introduction
2. Experimental Procedure
3. Results


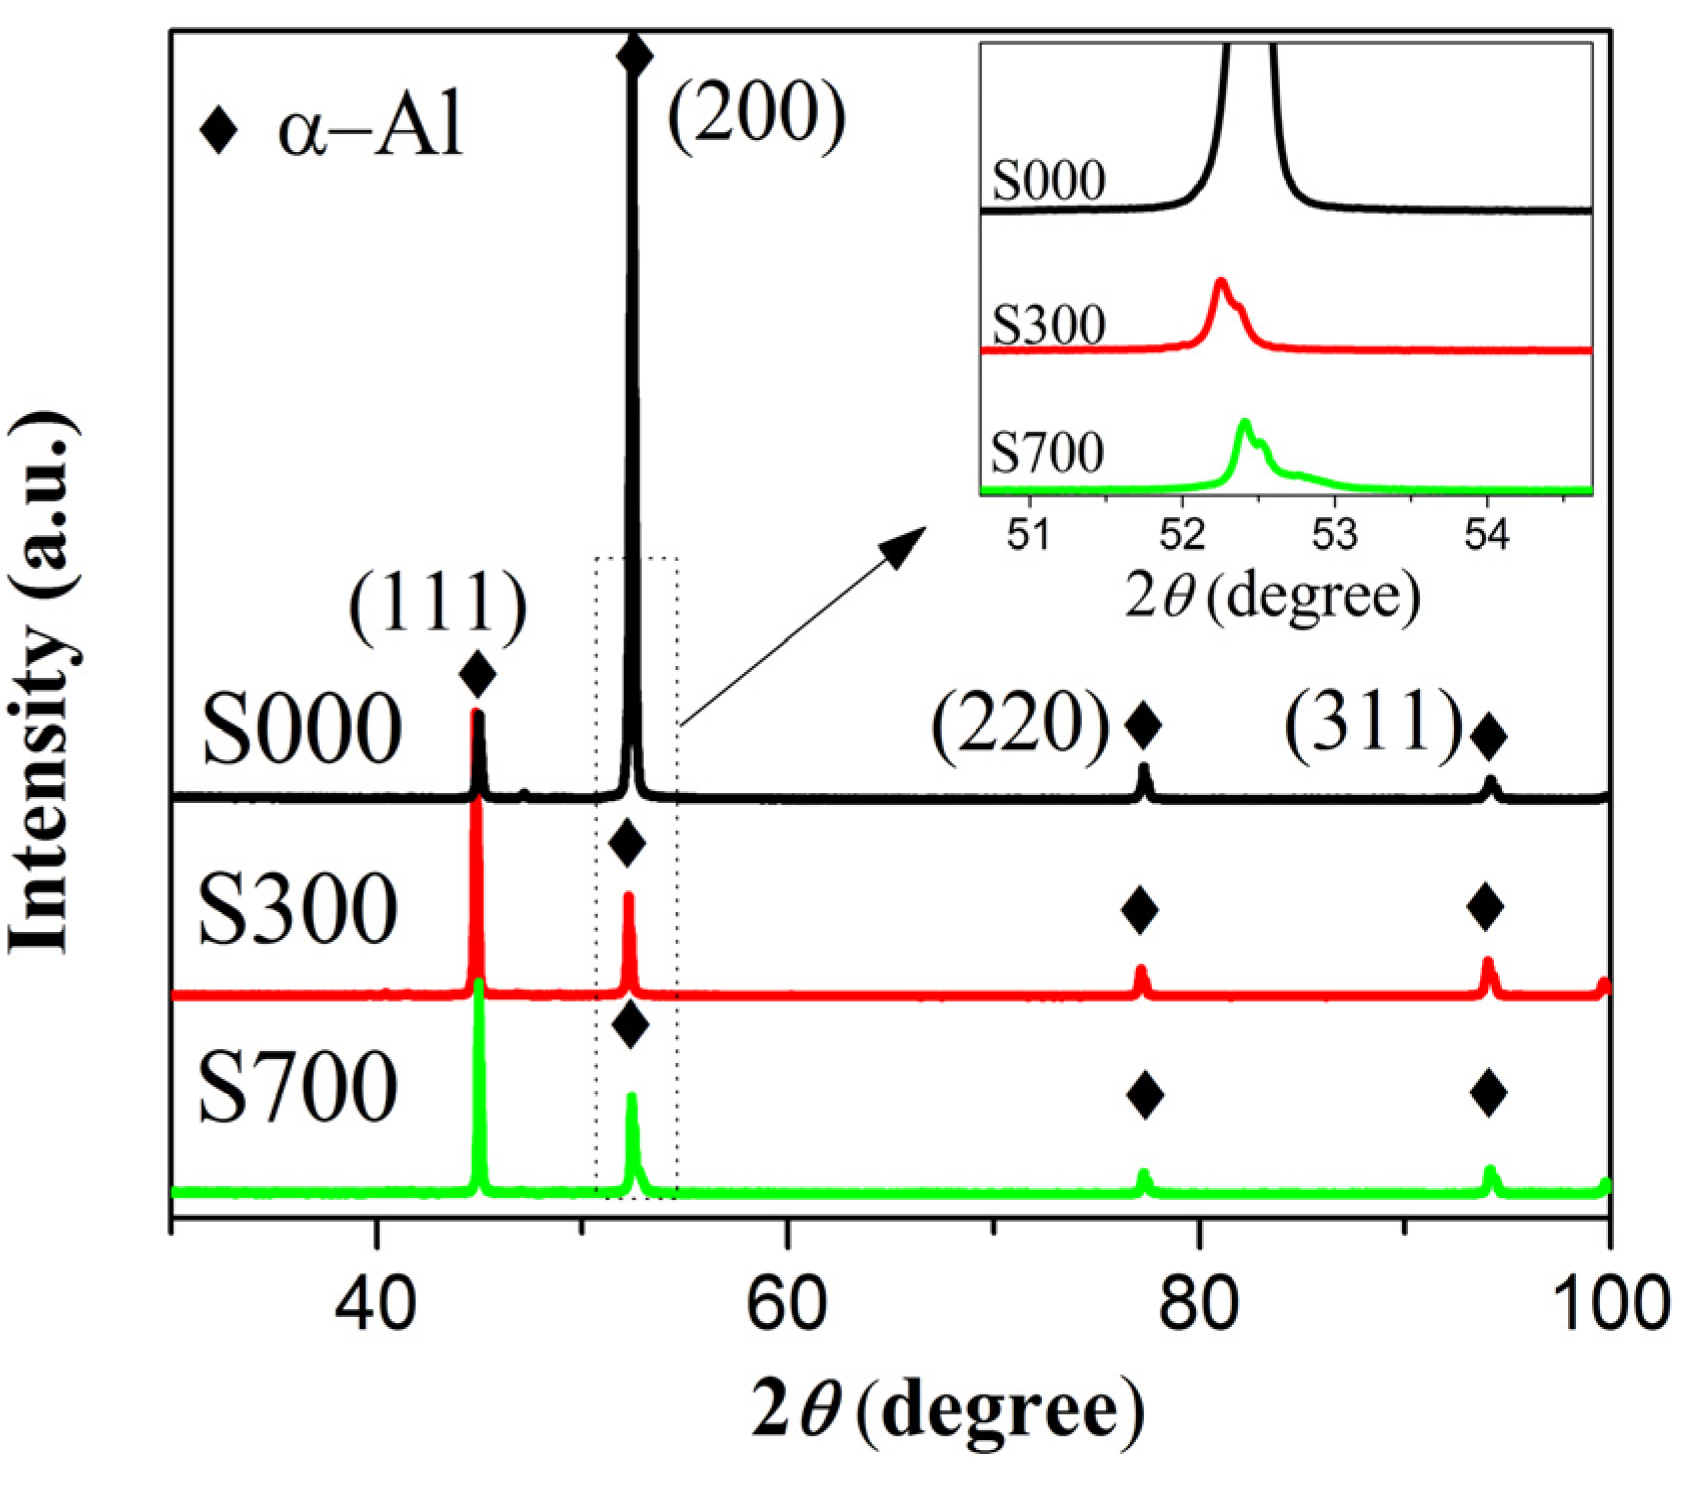
| Sample | 2θ (degree) | a0 (angstrom) | (a0 − a0*)/a0* (%) | F | F’ |
|---|---|---|---|---|---|
| S000 | 52.434 | 4.0495 | 0.003 | 0.7530 | 0.7462 |
| S300 | 52.252 | 4.0626 | 0.330 | 0.0031 | 0.0293 |
| S700 | 52.406 | 4.0515 | 0.052 | 0.1023 | 0.1009 |

4. Discussion
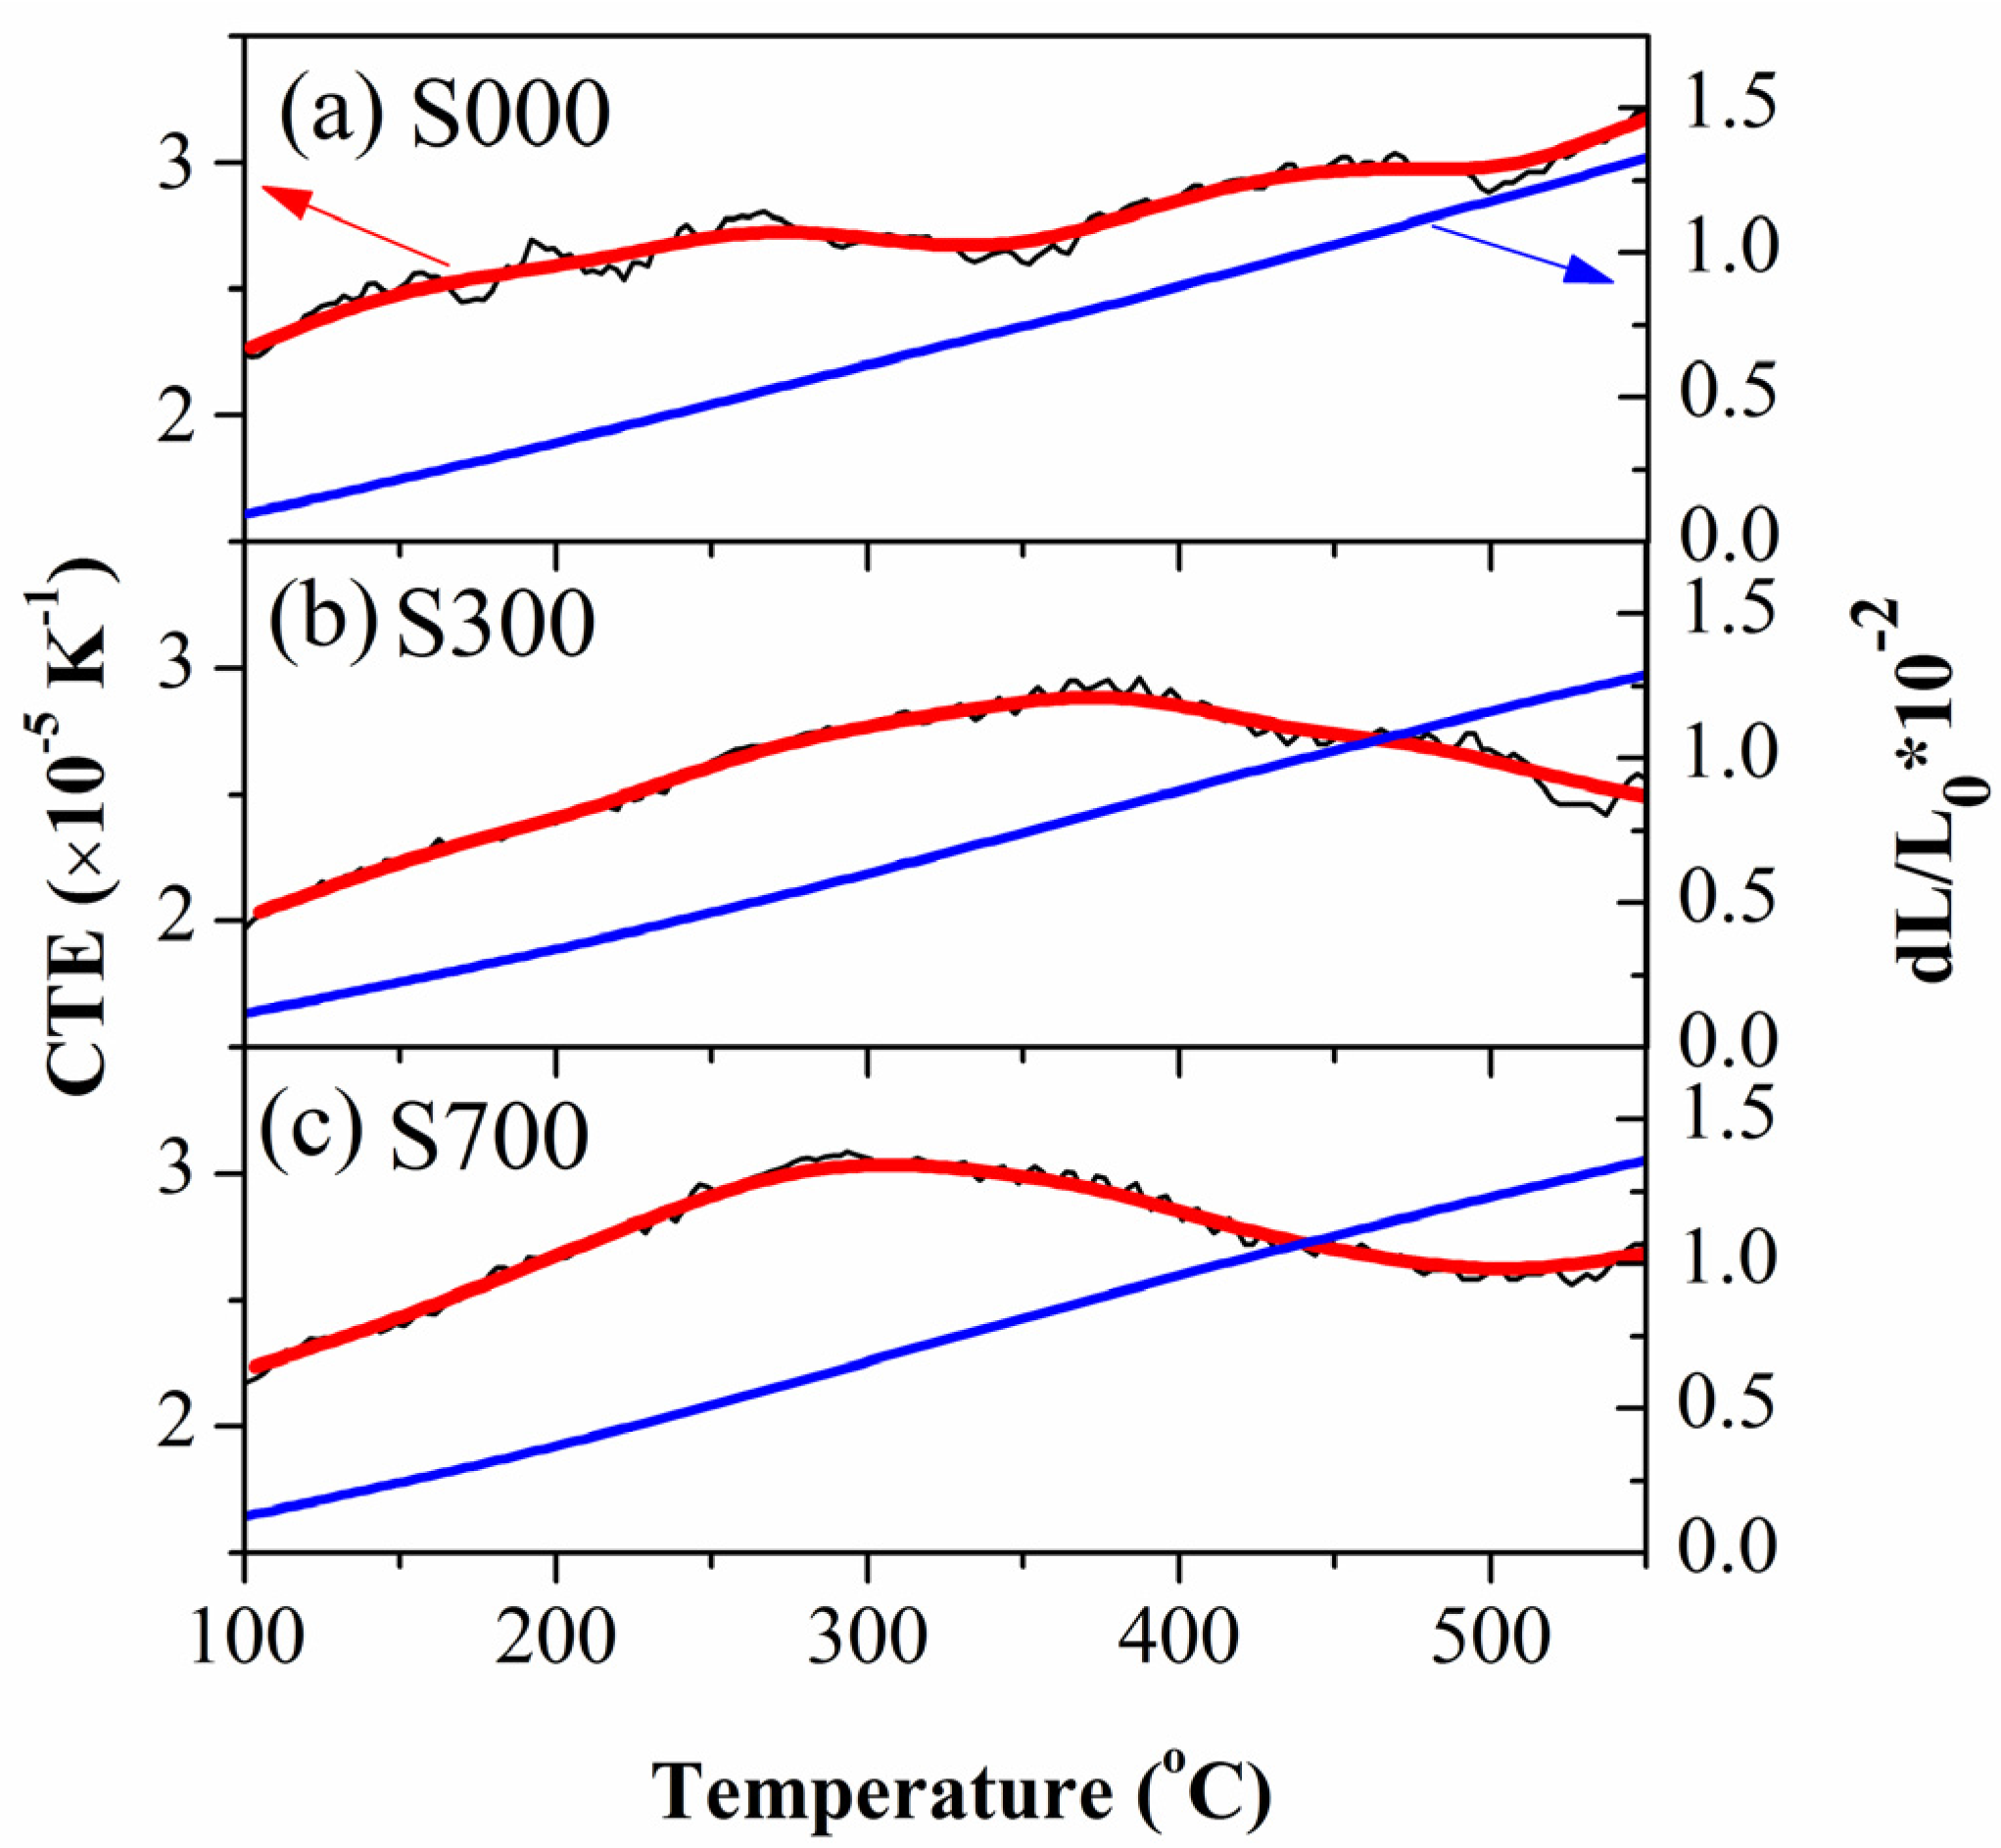
4.1. Microstructure and Thermal Expansion Behavior of FSP Samples
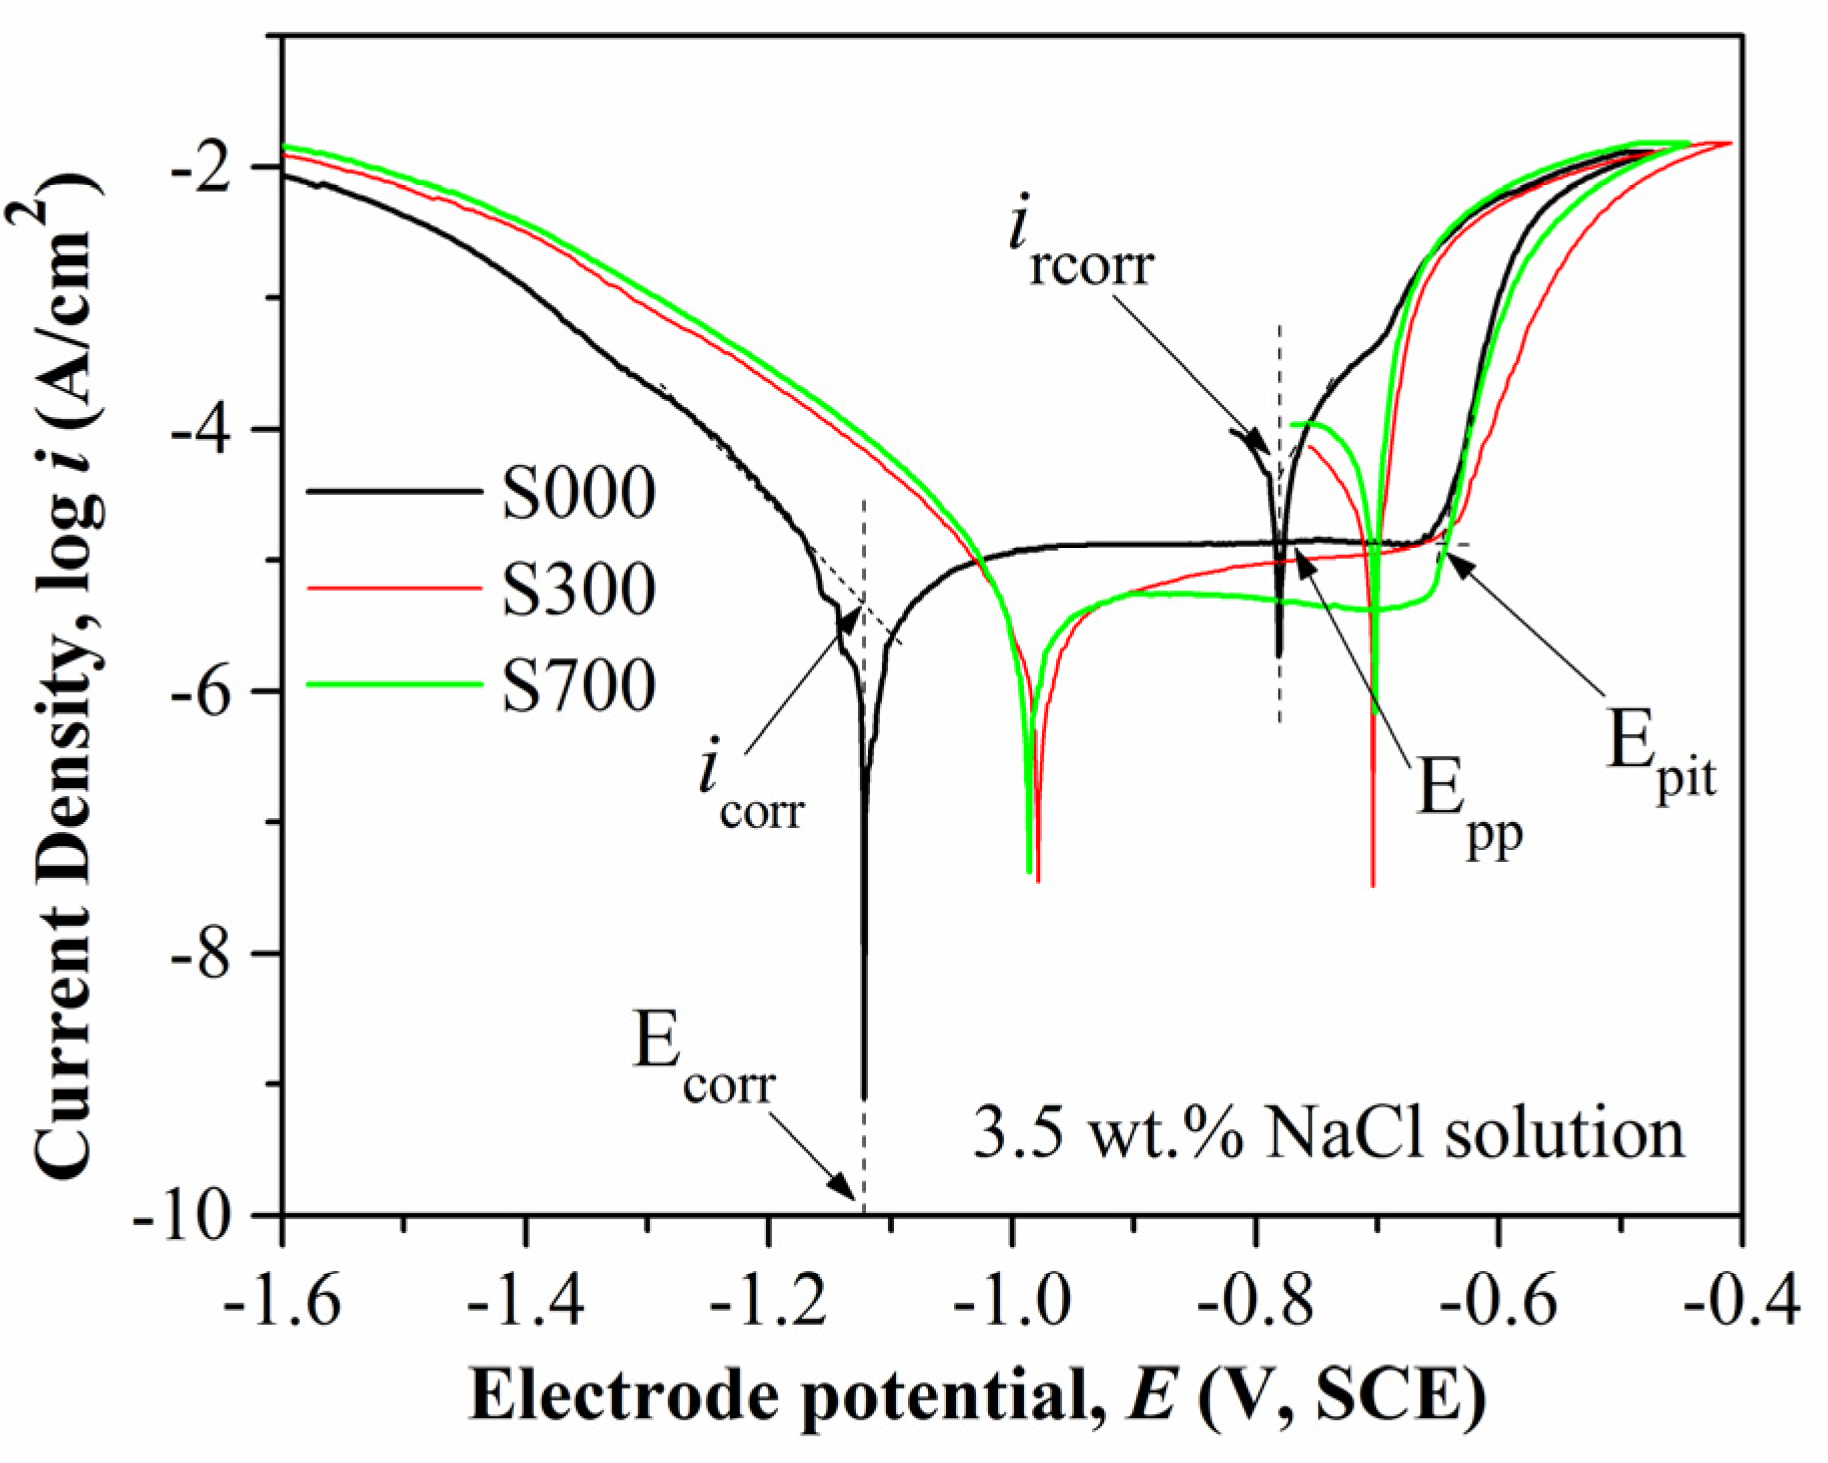
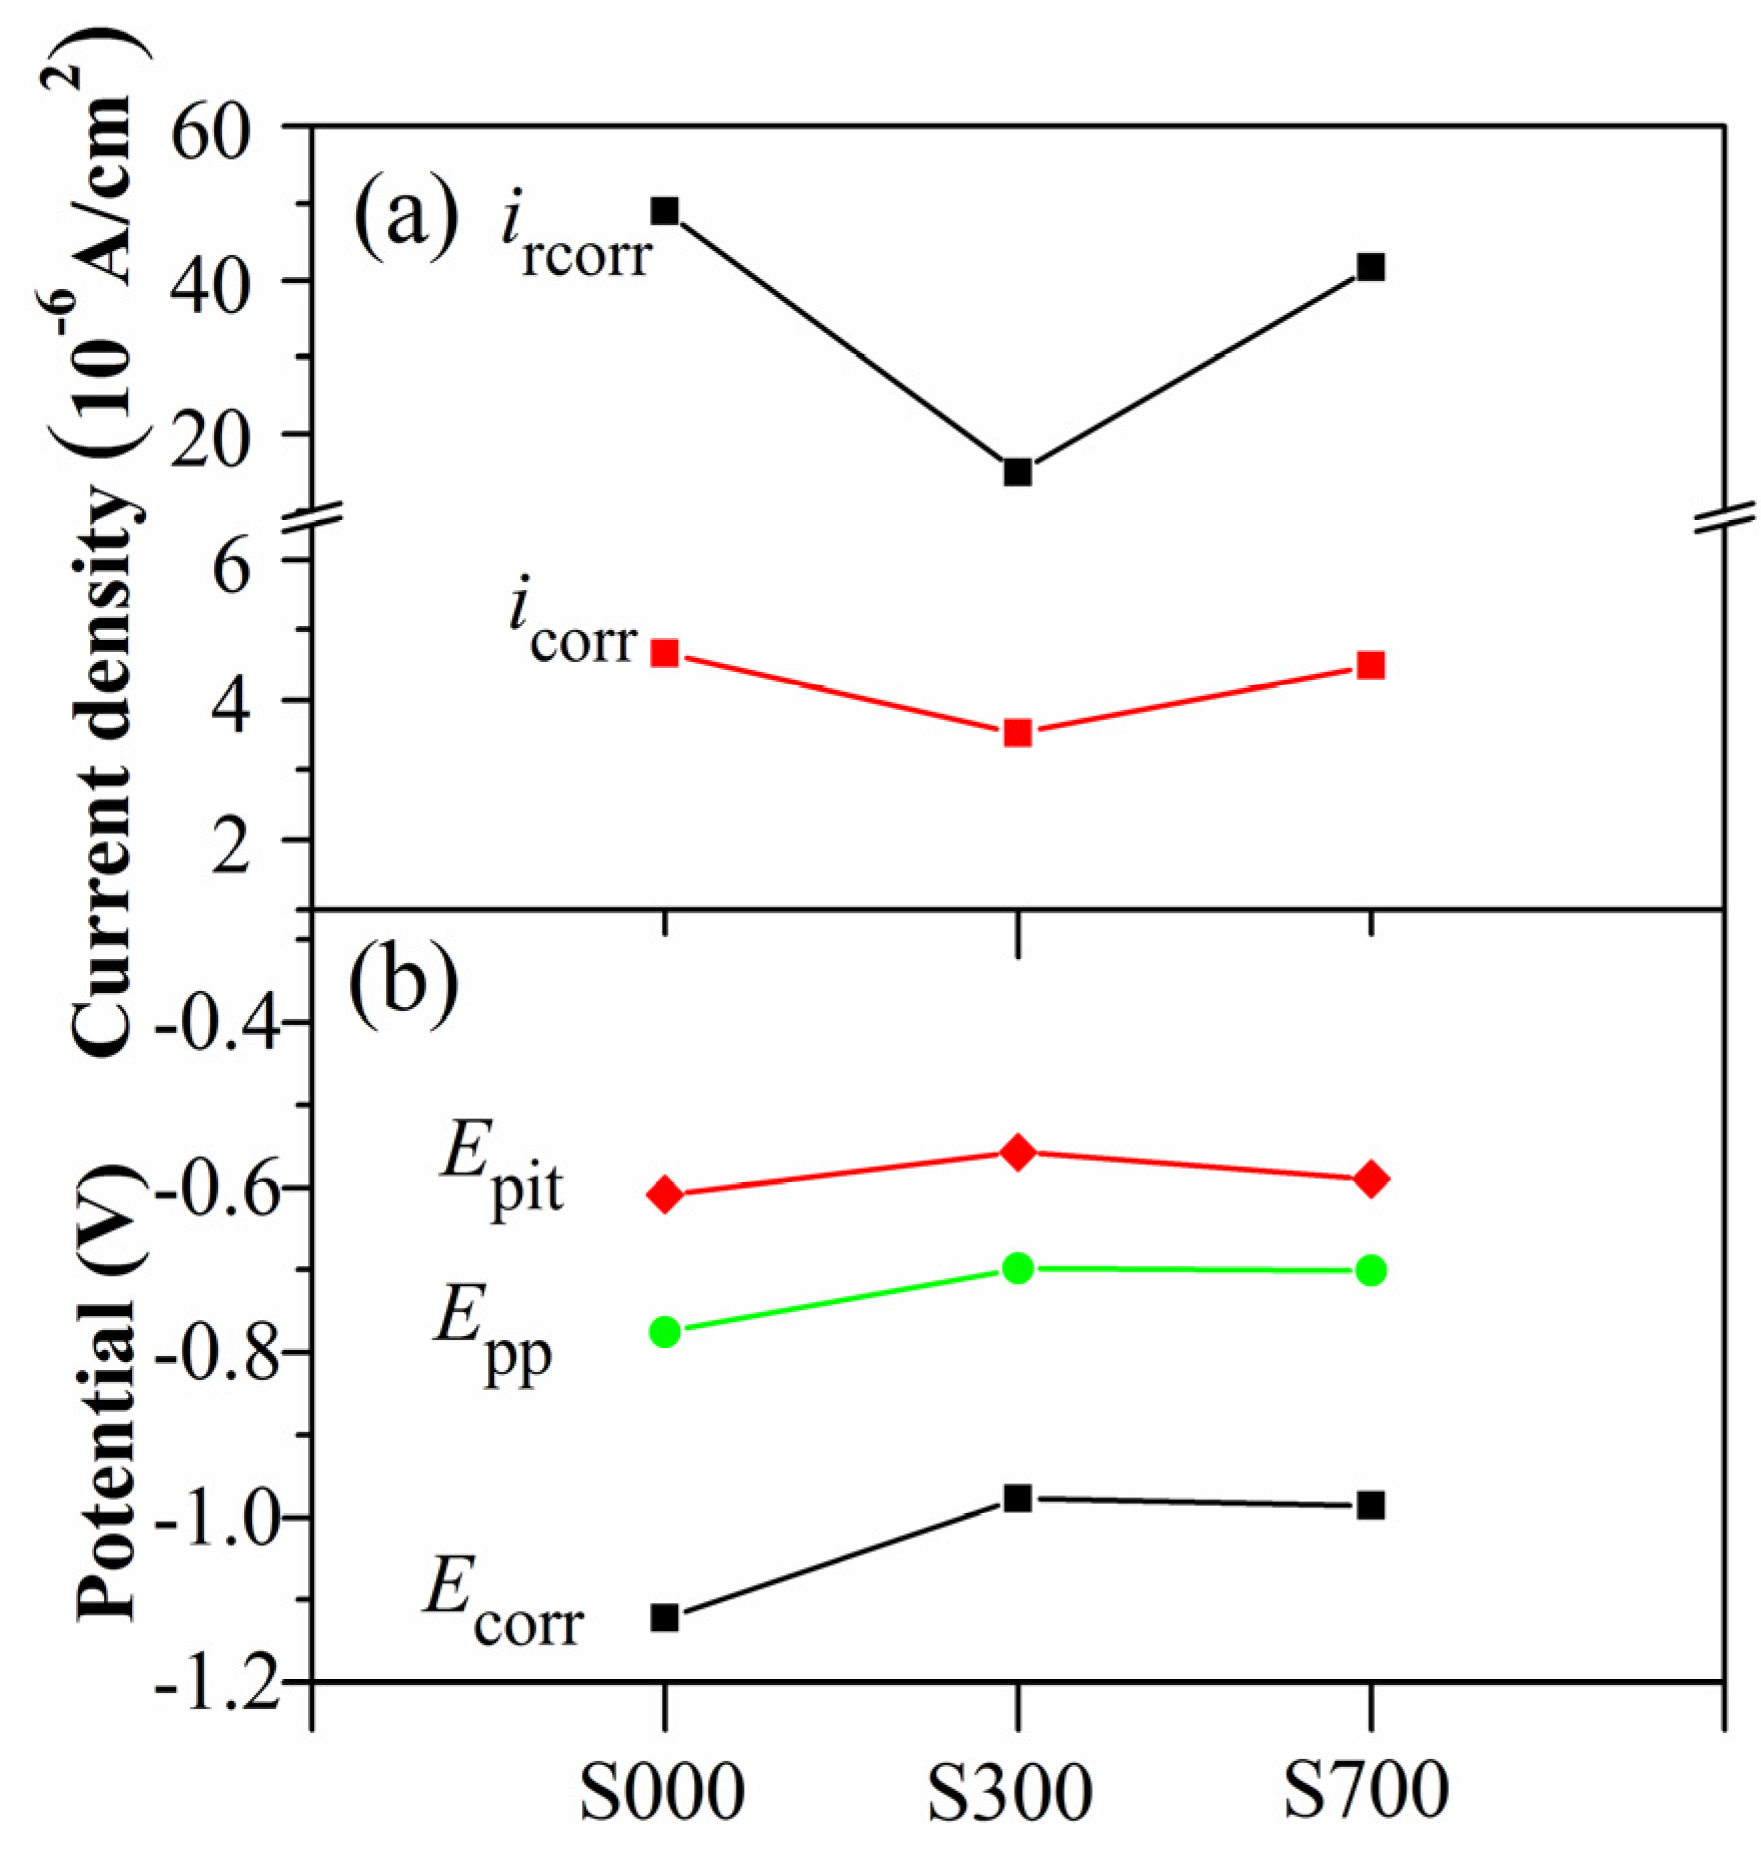
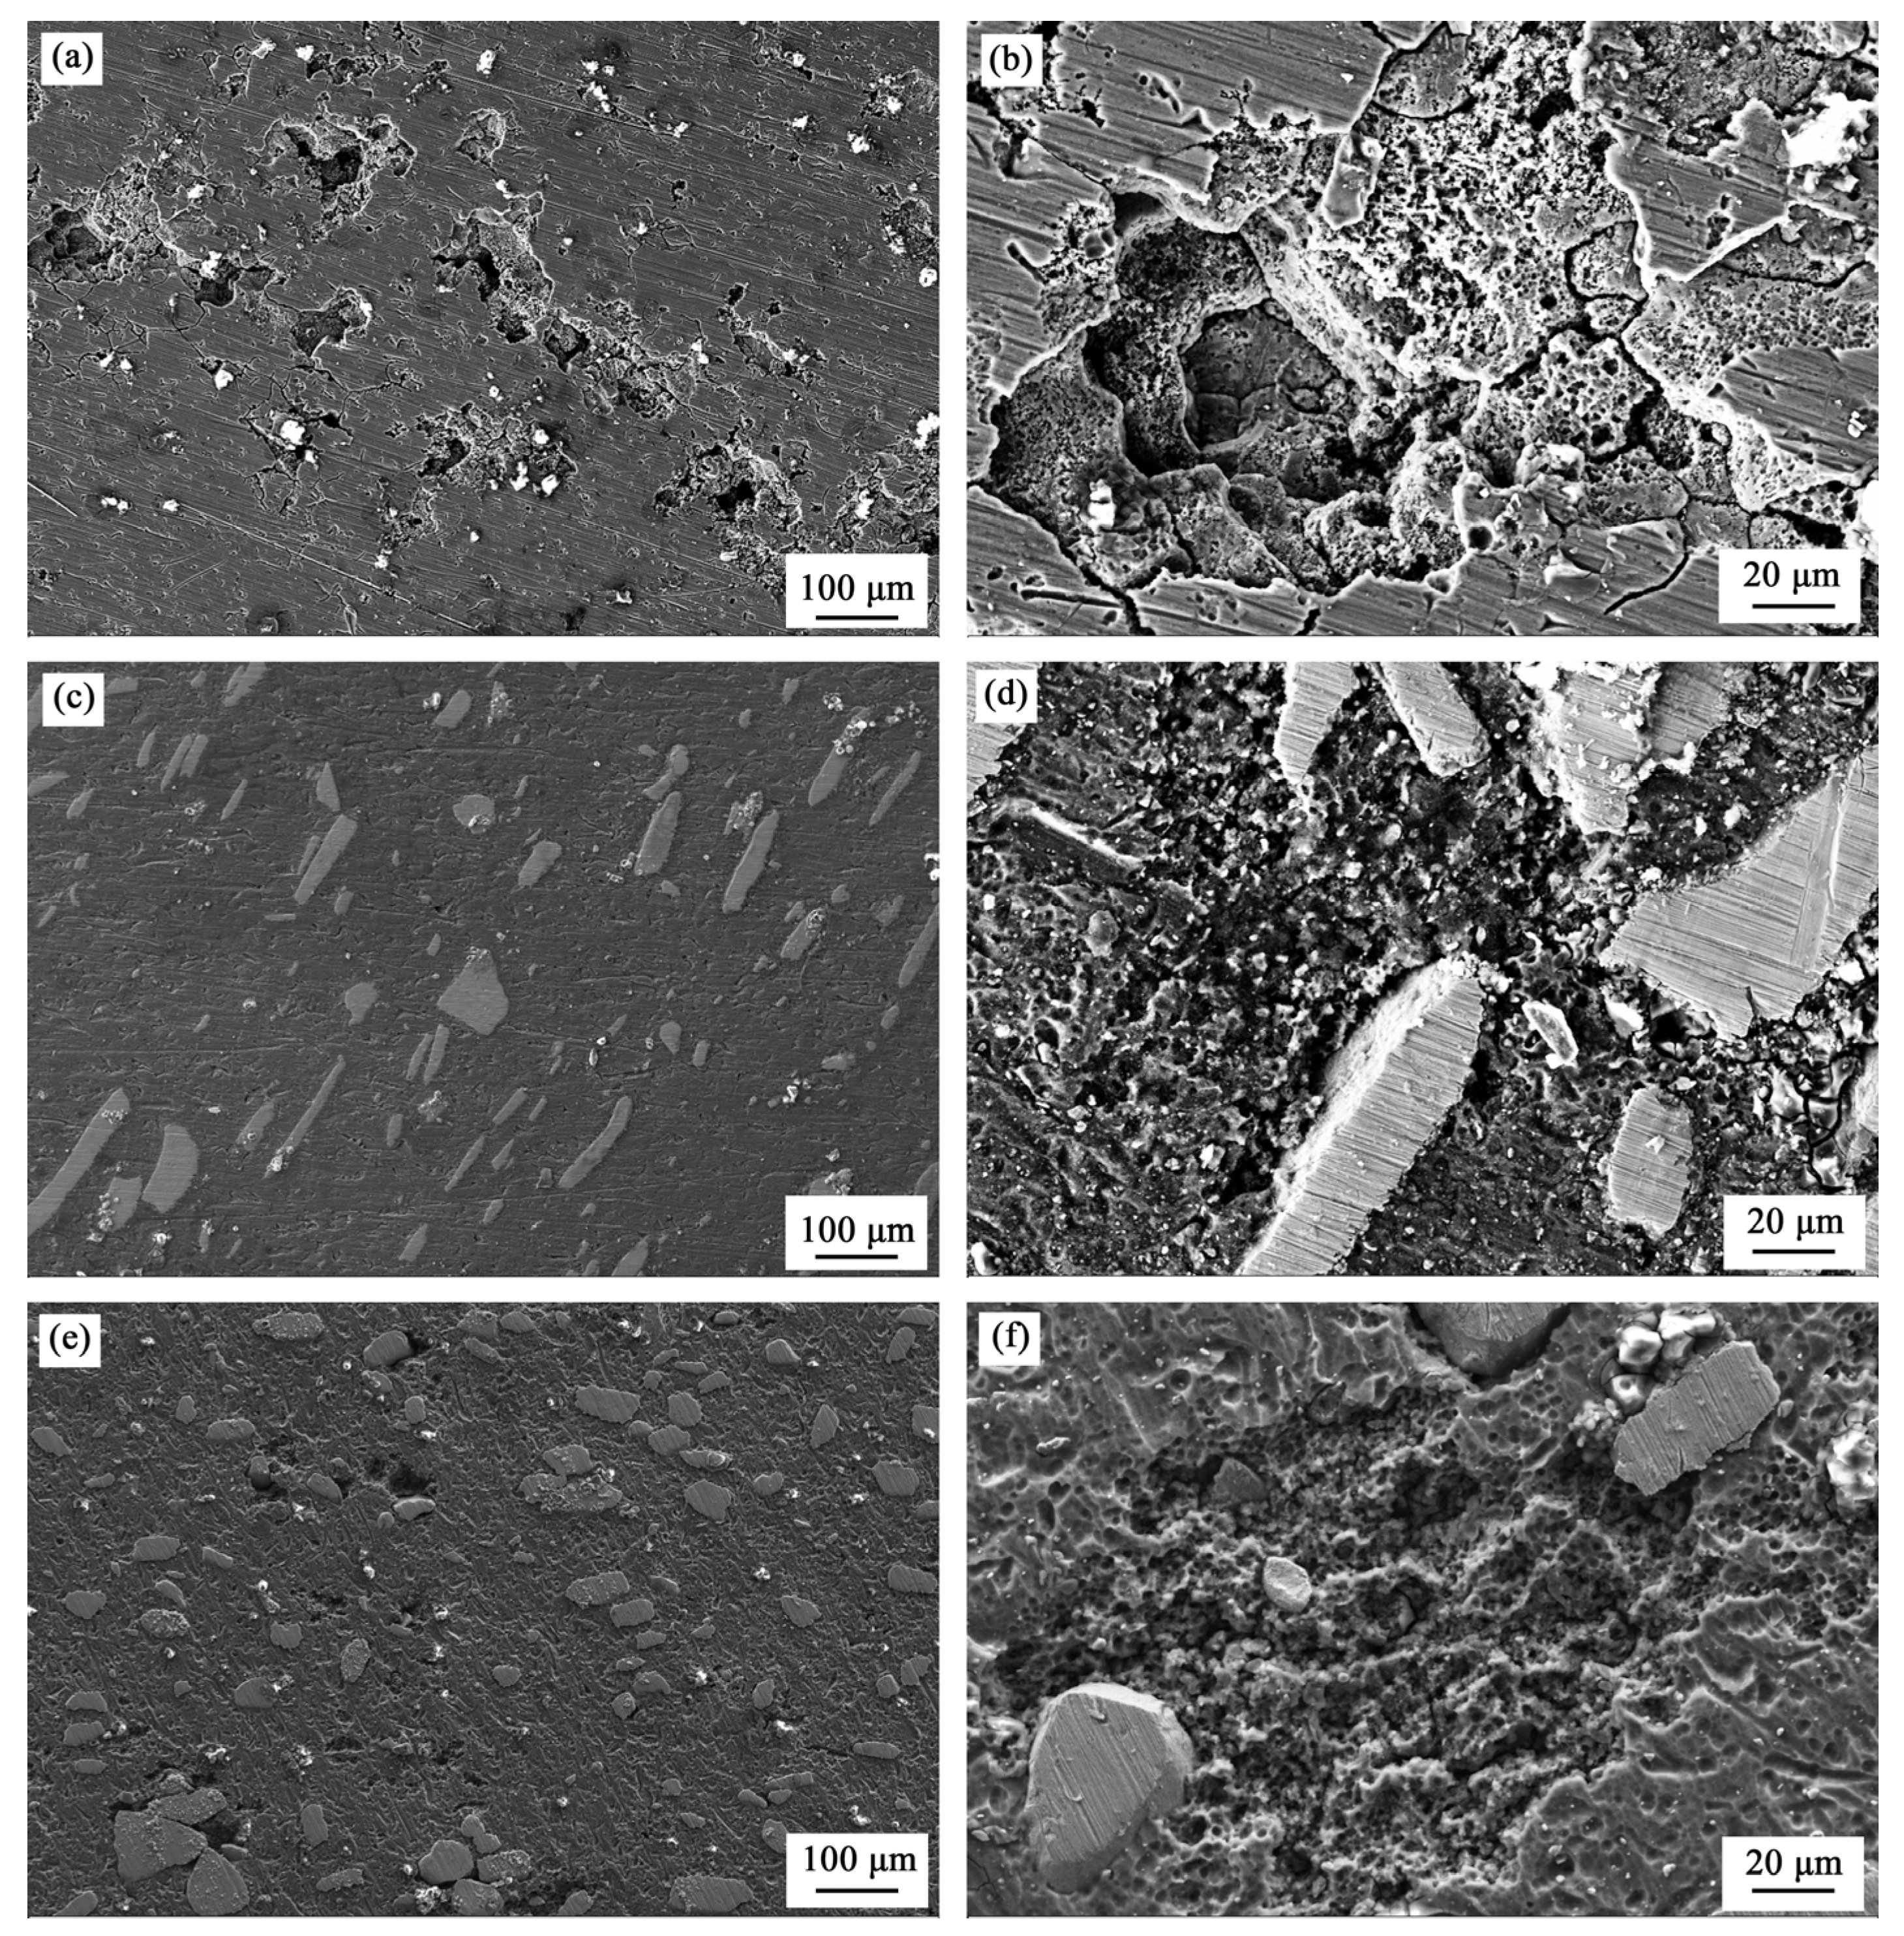
4.2. Corrosion and Wear Behavior of FSP Samples
5. Conclusions
Acknowledgments
Author Contributions
Conflicts of Interest
References
- Bakes, H.; Benjamin, D. Metals Handbook; ASM international: Metal Park, OH, USA, 1979. [Google Scholar]
- Vasudevan, A.K.; Doherty, R.D. Aluminum Alloys-Contemporary Research and Applications: Contemporary Research and Applications; Elsevier: Amsterdam, The Netherland, 2012. [Google Scholar]
- Ravi, N.; Sastikumar, D.; Subramanian, N.; Nath, A.K.; Masilamani, V. Microhardness and Microstructure Studies on Laser Surface Alloyed Aluminum Alloy with Ni-Cr. Mater. Manuf. Process. 2000, 15, 395–404. [Google Scholar] [CrossRef]
- Miracle, D.B. Metal matrix composites–From science to technological significance. Compos. Sci. Technol. 2005, 65, 2526–2540. [Google Scholar] [CrossRef]
- Shafiei-Zarghani, A.; Kashani-Bozorg, S.F.; Zarei-Hanzaki, A. Microstructures and mechanical properties of Al/Al2O3 surface nano-composite layer produced by friction stir processing. Mater. Sci. Eng. A 2009, 500, 84–91. [Google Scholar] [CrossRef]
- Budinski, K.G. Surface Engineering for Wear Resistance; Prentice Hall: Upper Saddle River, NJ, USA, 1988. [Google Scholar]
- Mabhali, L.; Pityana, S.L.; Sacks, N. Laser Surface Alloying of Aluminum (AA1200) with Ni and SiC Powders. Mater. Manuf. Process. 2010, 25, 1397–1403. [Google Scholar] [CrossRef]
- Gupta, M.; Mohamed, F.A.; Lavernia, E.J. Solidification behavior of AI-Li-SiCp MMCs processed using variable co-deposition of multi-phase materials. Mater. Manuf. Process. 1990, 5, 165–196. [Google Scholar] [CrossRef]
- Mishra, R.S.; Mahoney, M.W.; McFadden, S.X.; Mara, N.A.; Mukherjee, A.K. High strain rate superplasticity in a friction stir processed 7075 Al alloy. Scripta Mater. 1999, 42, 163–168. [Google Scholar] [CrossRef]
- Mishra, R.S.; Ma, Z.Y.; Charit, I. Friction stir processing: A novel technique for fabrication of surface composite. Mater. Sci. Eng. A 2003, 341, 307–310. [Google Scholar] [CrossRef]
- Ma, Z.Y. Friction stir processing technology: A review. Metall. Mater. Trans. A 2008, 39, 642–658. [Google Scholar] [CrossRef]
- Aruri, D.; Adepu, K.; Adepu, K.; Bazavada, K. Wear and mechanical properties of 6061-T6 aluminum alloy surface hybrid composites [(SiC+Gr) and (SiC+Al2O3)] fabricated by friction stir processing. J. Mater. Process. Tech. 2013, 2, 362–369. [Google Scholar] [CrossRef]
- Clyne, T.W.; Withers, P.J.; Minges, M.L. An Introduction to Metal Matrix Composites; Cambridge University Press: Cambridge, UK, 1995. [Google Scholar]
- Ahlatci, H.; Ko Er, T.; Candan, E.; Imeno Lu, H. Wear behaviour of Al/(Al2O3p+SiCp) hybrid composites. Tribol. Int. 2006, 39, 213–220. [Google Scholar] [CrossRef]
- Liu, Z.Y.; Xiao, B.L.; Wang, W.G.; Ma, Z.Y. Tensile strength and electrical conductivity of carbon nanotube reinforced aluminum matrix composites fabricated by powder metallurgy combined with friction stir processing. J. Mater. Sci. Technol. 2014, 30, 649–655. [Google Scholar] [CrossRef]
- Makino, A.; Kubota, T.; Chang, C.; Makabe, M.; Inoue, A. FeSiBP bulk metallic glasses with high magnetization and excellent magnetic softness. J. Magn. Magn. Mater. 2008, 320, 2499–2503. [Google Scholar] [CrossRef]
- Makino, A.; Kubota, T.; Makabe, M.; Chang, C.T.; Inoue, A. FeSiBP metallic glasses with high glass-forming ability and excellent magnetic properties. Mater. Sci. Eng. B 2008, 148, 166–170. [Google Scholar] [CrossRef]
- Inoue, A. Stabilization of metallic supercooled liquid and bulk amorphous alloys. Acta Mater. 2000, 48, 279–306. [Google Scholar] [CrossRef]
- Luborsky, F.E. Amorphous Metallic Alloys; Butterworth and Co.: London, UK, 1983. [Google Scholar]
- Davis, J.R. Aluminum and Aluminum Alloys; ASM international: Metal Park, OH, USA, 1993. [Google Scholar]
- Zhou, Y. Materials Analysis and Testing Technology; Harbin Institute of Technology Press: Harbin, China, 2007. [Google Scholar]
- Lotgering, F.K. Topotactical reactions with ferrimagnetic oxides having hexagonal crystal structures—I. J. Inorg. Nucl. Chem. 1959, 9, 113–123. [Google Scholar] [CrossRef]
- Wilde, B.E.; Williams, E. The use of current/voltage curves for the study of localized corrosion and passivity breakdown on stainless steels in chloride media. Electrochim. Acta 1971, 16, 1970–1985. [Google Scholar] [CrossRef]
- Azushima, A.; Kopp, R.; Korhonen, A.; Yang, D.Y.; Micari, F.; Lahoti, G.D.; Groche, P.; Yanagimoto, J.; Tsuji, N.; Rosochowski, A. Severe plastic deformation (SPD) processes for metals. CIRP Ann. Manuf. Technol. 2008, 57, 716–735. [Google Scholar] [CrossRef]
- Nikulin, I.; Malopheyev, S.; Kipelova, A.; Kaibyshev, R. Effect of SPD and friction stir welding on microstructure and mechanical properties of Al-Cu-Mg-Ag sheets. Mater. Lett. 2012, 66, 311–313. [Google Scholar] [CrossRef]
- Raj, K.H.; Sharma, R.S.; Singh, P.; Dayal, A. Study of friction stir processing (FSP) and high pressure torsion (HPT) and their effect on mechanical properties. Proc. Eng. 2011, 10, 2904–2910. [Google Scholar] [CrossRef]
- Mazilkin, A.A.; Straumal, B.B.; Rabkin, E.; Baretzky, B.; Enders, S.; Protasova, S.G.; Kogtenkova, O.A.; Valiev, R.Z. Softening of nanostructured Al-Zn and Al-Mg alloys after severe plastic deformation. Acta Mater. 2006, 54, 3933–3939. [Google Scholar] [CrossRef]
- Straumal, B.B.; Mazilkin, A.A.; Baretzky, B.; Schütz, G.; Rabkin, E.; Valiev, R.Z. Accelerated diffusion and phase transformations in Co-Cu alloys driven by the severe plastic deformation. Mater. Trans. 2012, 53, 63–71. [Google Scholar] [CrossRef]
- Straumal, B.B.; Gornakova, A.S.; Mazilkin, A.A.; Fabrichnaya, O.B.; Kriegel, M.J.; Baretzky, B.; Jiang, J.Z.; Dobatkin, S.V. Phase transformations in the severely plastically deformed Zr-Nb alloys. Mater. Lett. 2012, 81, 225–228. [Google Scholar] [CrossRef]
- Sato, Y.S.; Kokawa, H.; Enomoto, M.; Jogan, S.; Hashimoto, T. Precipitation sequence in friction stir weld of 6063 aluminum during aging. Metall. Mater. Trans. A 1999, 30, 3125–3130. [Google Scholar] [CrossRef]
- Steuwer, A.; Dumont, M.; Peel, M.; Preuss, M.; Withers, P.J. The variation of the unstrained lattice parameter in an AA7010 friction stir weld. Acta Mater. 2007, 55, 4111–4120. [Google Scholar] [CrossRef]
- Woo, W.; Choo, H.; Brown, D.W.; Vogel, S.C.; Liaw, P.K.; Feng, Z. Texture analysis of a friction stir processed 6061-T6 aluminum alloy using neutron diffraction. Acta Mater. 2006, 54, 3871–3882. [Google Scholar] [CrossRef]
- El-Danaf, E.A.; El-Rayes, M.M.; Soliman, M.S. Friction stir processing: An effective technique to refine grain structure and enhance ductility. Mater. Design 2010, 31, 1231–1236. [Google Scholar] [CrossRef]
- Woo, W.; Balogh, L.; Ungár, T.; Choo, H.; Feng, Z. Grain structure and dislocation density measurements in a friction-stir welded aluminum alloy using X-ray peak profile analysis. Mater. Sci. Eng. A 2008, 498, 308–313. [Google Scholar] [CrossRef]
- Huber, T.; Degischer, H.P.; Lefranc, G.; Schmitt, T. Thermal expansion studies on aluminium-matrix composites with different reinforcement architecture of SiC particles. Compos. Sci. Technol. 2006, 66, 2206–2217. [Google Scholar] [CrossRef]
- Uju, W.A.; Oguocha, I.N.A. A study of thermal expansion of Al-Mg alloy composites containing fly ash. Mater. Design 2012, 33, 503–509. [Google Scholar] [CrossRef]
- Berry, C.R. Effect of internal strains on linear expansion, X-Ray lattice constant, and density of crystals. J. Appl. Phys. 1953, 24, 658–659. [Google Scholar] [CrossRef]
- Ma, H.J.; Zhang, J.T.; Li, G.H.; Zhang, W.X.; Wang, W.M. Effect of Zr on the thermal stability and magnetic properties of Fe78Si9B13 glassy alloy. J. Alloy. Compd. 2010, 501, 227–232. [Google Scholar] [CrossRef]
- Zhang, Q.; Wu, G.; Jiang, L.; Chen, G. Thermal expansion and dimensional stability of Al-Si matrix composite reinforced with high content SiC. Mater. Chem. Phys. 2003, 82, 780–785. [Google Scholar] [CrossRef]
- Straumal, B.B.; Protasova, S.G.; Mazilkin, A.A.; Rabkin, E.; Goll, D.; Schütz, G.; Baretzky, B.; Valiev, R.Z. Deformation-driven formation of equilibrium phases in the Cu–Ni alloys. J. Mater. Sci. 2012, 47, 360–367. [Google Scholar] [CrossRef]
- Straumal, B.B.; Dobatkin, S.V.; Rodin, A.O.; Protasova, S.G.; Mazilkin, A.A.; Goll, D.; Baretzky, B. Structure and properties of nanograined Fe-C alloys after severe plastic deformation. Adv. Eng. Mater. 2011, 13, 463–469. [Google Scholar] [CrossRef]
- Su, J.Q.; Nelson, T.W.; Mishra, R.; Mahoney, M. Microstructural investigation of friction stir welded 7050-T651 aluminium. Acta Mater. 2003, 51, 713–729. [Google Scholar] [CrossRef]
- Ralston, K.D.; Birbilis, N.; Davies, C.H.J. Revealing the relationship between grain size and corrosion rate of metals. Scripta Mater. 2010, 63, 1201–1204. [Google Scholar] [CrossRef]
- Ralston, K.D.; Birbilis, N. Effect of grain size on corrosion: A review. Corrosion 2010, 66, 1201–1204. [Google Scholar] [CrossRef]
- Rao, A.G.; Katkar, V.A.; Gunasekaran, G.; Deshmukh, V.P.; Prabhu, N.; Kashyap, B.P. Effect of multipass friction stir processing on corrosion resistance of hypereutectic Al-30Si alloy. Corros. Sci. 2014, 83, 198–208. [Google Scholar] [CrossRef]
- Staron, P.; KoçAk, M.; Williams, S.; Wescott, A. Residual stress in friction stir-welded Al sheets. Physica B 2004, 350, E491–E493. [Google Scholar] [CrossRef]
- Van Boven, G.; Chen, W.; Rogge, R. The role of residual stress in neutral pH stress corrosion cracking of pipeline steels. Part I: Pitting and cracking occurrence. Acta Mater. 2007, 55, 29–42. [Google Scholar] [CrossRef]
- Prevey, P.; Cammett, J. The influence of surface enhancement by low plasticity burnishing on the corrosion fatigue performance of AA7075-T6. Int. J. Fatigue 2004, 26, 975–982. [Google Scholar] [CrossRef]
- Tam, M.K.; Shek, C.H. Crystallization and corrosion resistance of Cu50Zr45Al5 bulk amorphous alloy. Mater. Chem. Phys. 2006, 100, 34–37. [Google Scholar] [CrossRef]
- Naka, M.; Hashimoto, K.; Masumoto, T. Corrosion behavior of amorphous and crystalline Cu50Ti50 and Cu50 Zr50 alloys. J. Non-Cryst. Solids 1978, 30, 29–36. [Google Scholar] [CrossRef]
- Gurcan, A.B.; Baker, T.N. Wear behaviour of AA6061 aluminium alloy and its composites. Wear 1995, 188, 185–191. [Google Scholar] [CrossRef]
- Mohammadzadeh, R.; Akbari, A.; Drouet, M. Microstructure and wear properties of AISI M2 tool steel on RF plasma nitriding at different N2–H2 gas compositions. Surf. Coat. Technol. 2014, 258, 566–573. [Google Scholar] [CrossRef]
- Li, J.; Lu, Y.; Zhang, H.; Xin, L. Effect of grain size and hardness on fretting wear behavior of Inconel 600 alloys. Tribol. Int. 2015, 81, 215–222. [Google Scholar] [CrossRef]
- Niu, Y.C.; Bian, X.F.; Wang, W.M.; Jin, S.F.; Liu, X.J.; Zhang, J.Y.; Qin, G.L. The use of flow behavior and thermal expansion to monitor structural change of amorphous Fe78Si9B13 ribbon. J. Non-Cryst. Solids 2005, 351, 3854–3860. [Google Scholar] [CrossRef]
© 2015 by the authors; licensee MDPI, Basel, Switzerland. This article is an open access article distributed under the terms and conditions of the Creative Commons Attribution license (http://creativecommons.org/licenses/by/4.0/).
Share and Cite
Guo, L.; Liu, Y.; Shen, K.; Song, C.; Yang, M.; Kim, K.; Wang, W. Enhancing Corrosion and Wear Resistance of AA6061 by Friction Stir Processing with Fe78Si9B13 Glass Particles. Materials 2015, 8, 5084-5097. https://doi.org/10.3390/ma8085084
Guo L, Liu Y, Shen K, Song C, Yang M, Kim K, Wang W. Enhancing Corrosion and Wear Resistance of AA6061 by Friction Stir Processing with Fe78Si9B13 Glass Particles. Materials. 2015; 8(8):5084-5097. https://doi.org/10.3390/ma8085084
Chicago/Turabian StyleGuo, Lingyu, Yan Liu, Kechang Shen, Chaoqun Song, Min Yang, Kibuem Kim, and Weimin Wang. 2015. "Enhancing Corrosion and Wear Resistance of AA6061 by Friction Stir Processing with Fe78Si9B13 Glass Particles" Materials 8, no. 8: 5084-5097. https://doi.org/10.3390/ma8085084