
The Effect of Particle Size on Thermal Conduction in Granular Mixtures

Abstract
:1. Introduction
2. Materials and Methods
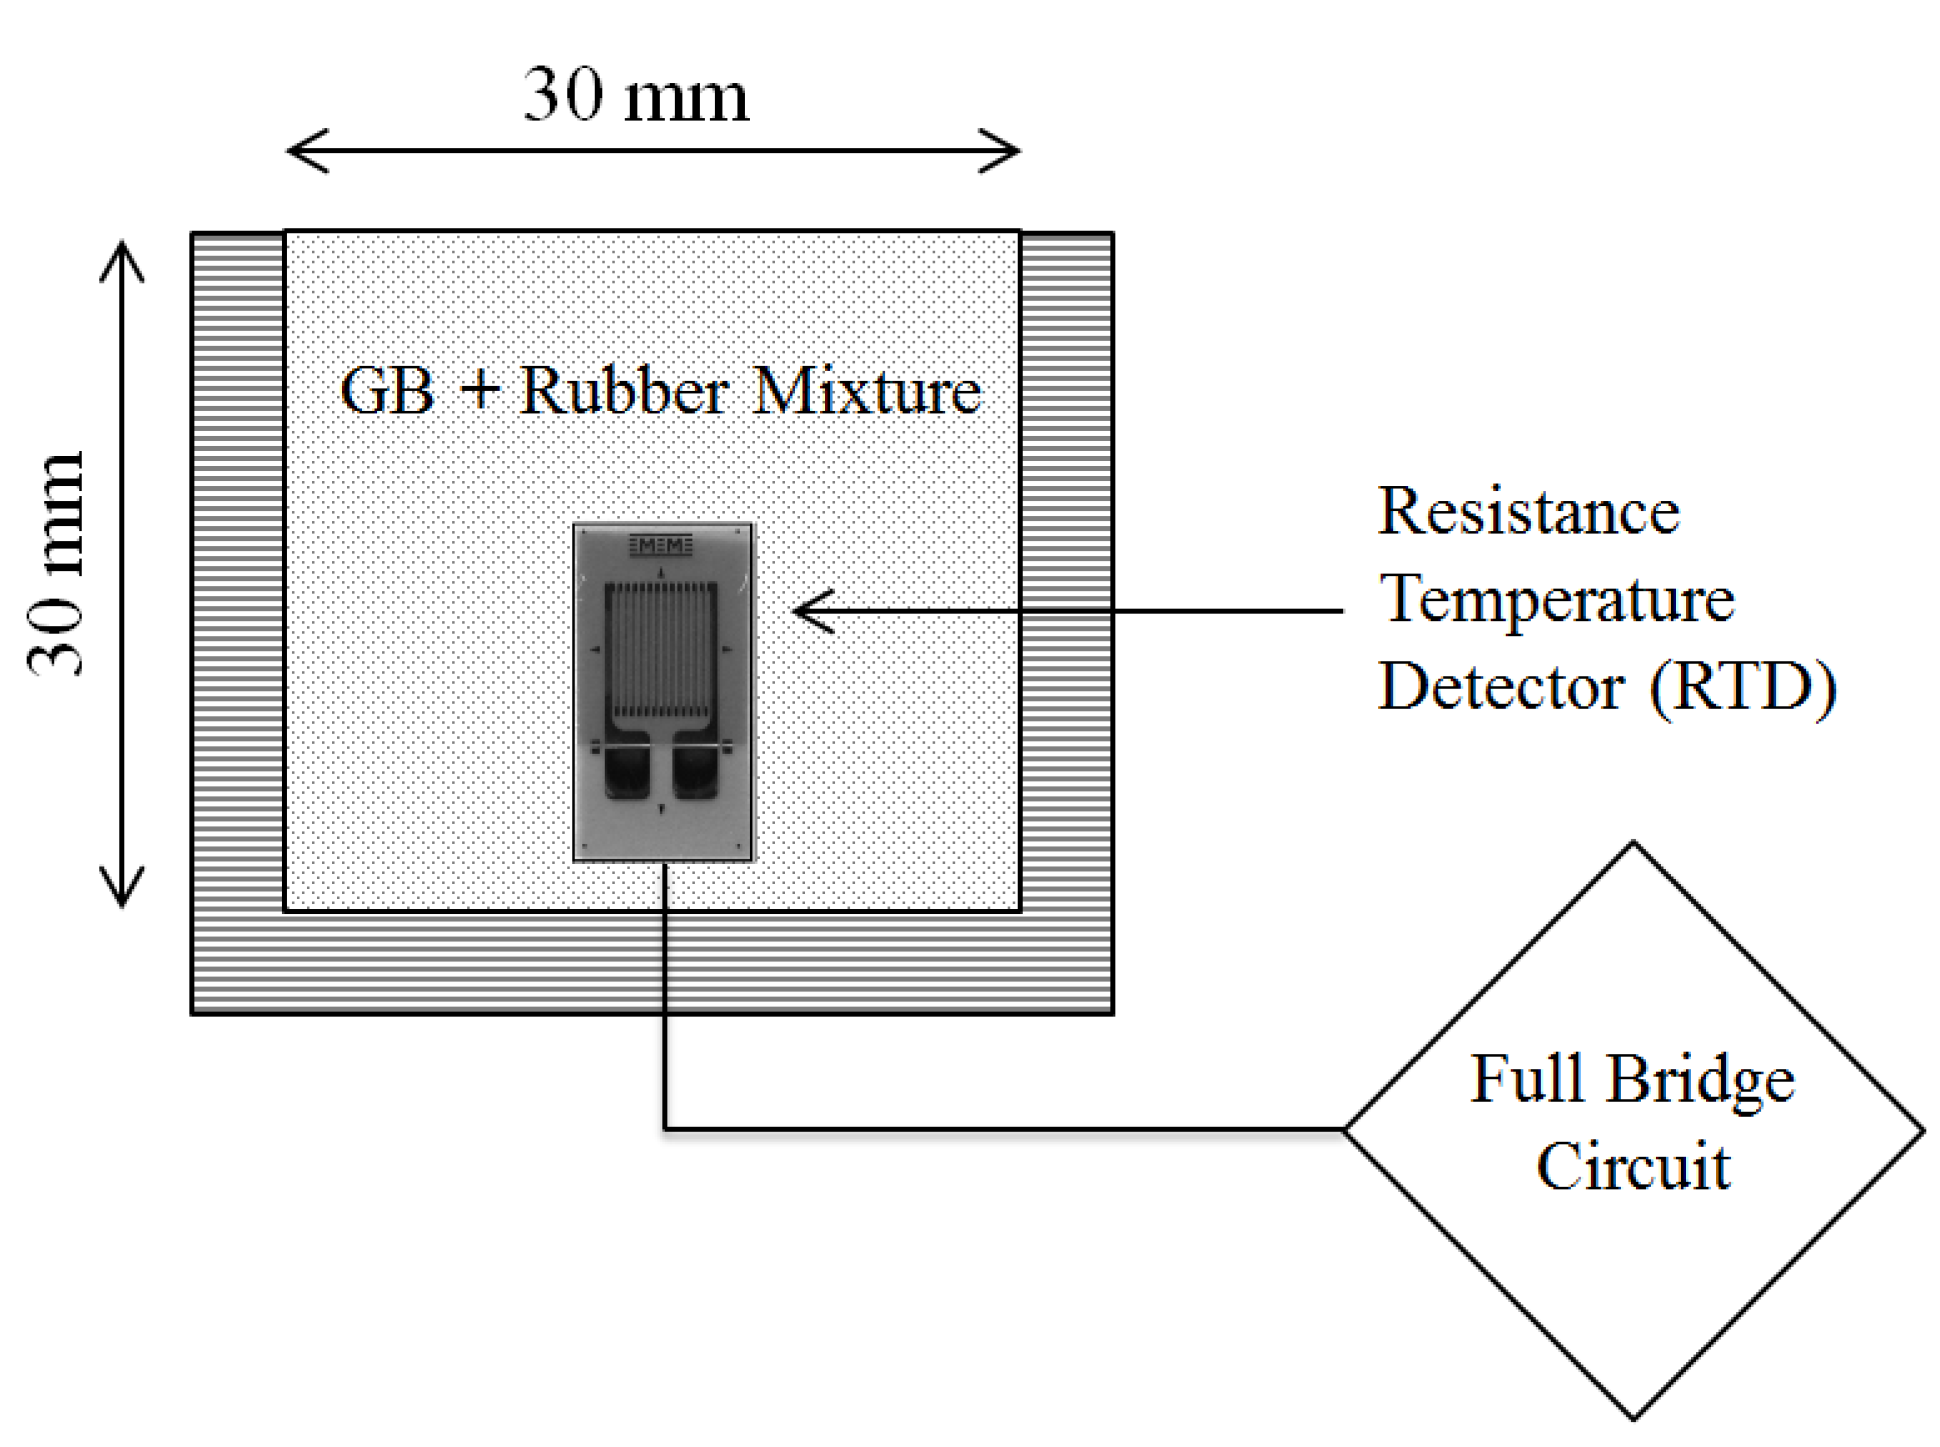
2.1. Materials

| Case | Particle Diameter | ||
|---|---|---|---|
| Glass Bead | Rubber | ||
| Case 1 | 0.212∼0.3 | 0.25∼0.3 | ∼1 |
| Case 2 | 0.212∼0.3 | 0.85∼1.13 | ∼4 |
| Case 3 | 0.212∼0.3 | ∼0.112 | ∼0.25 |
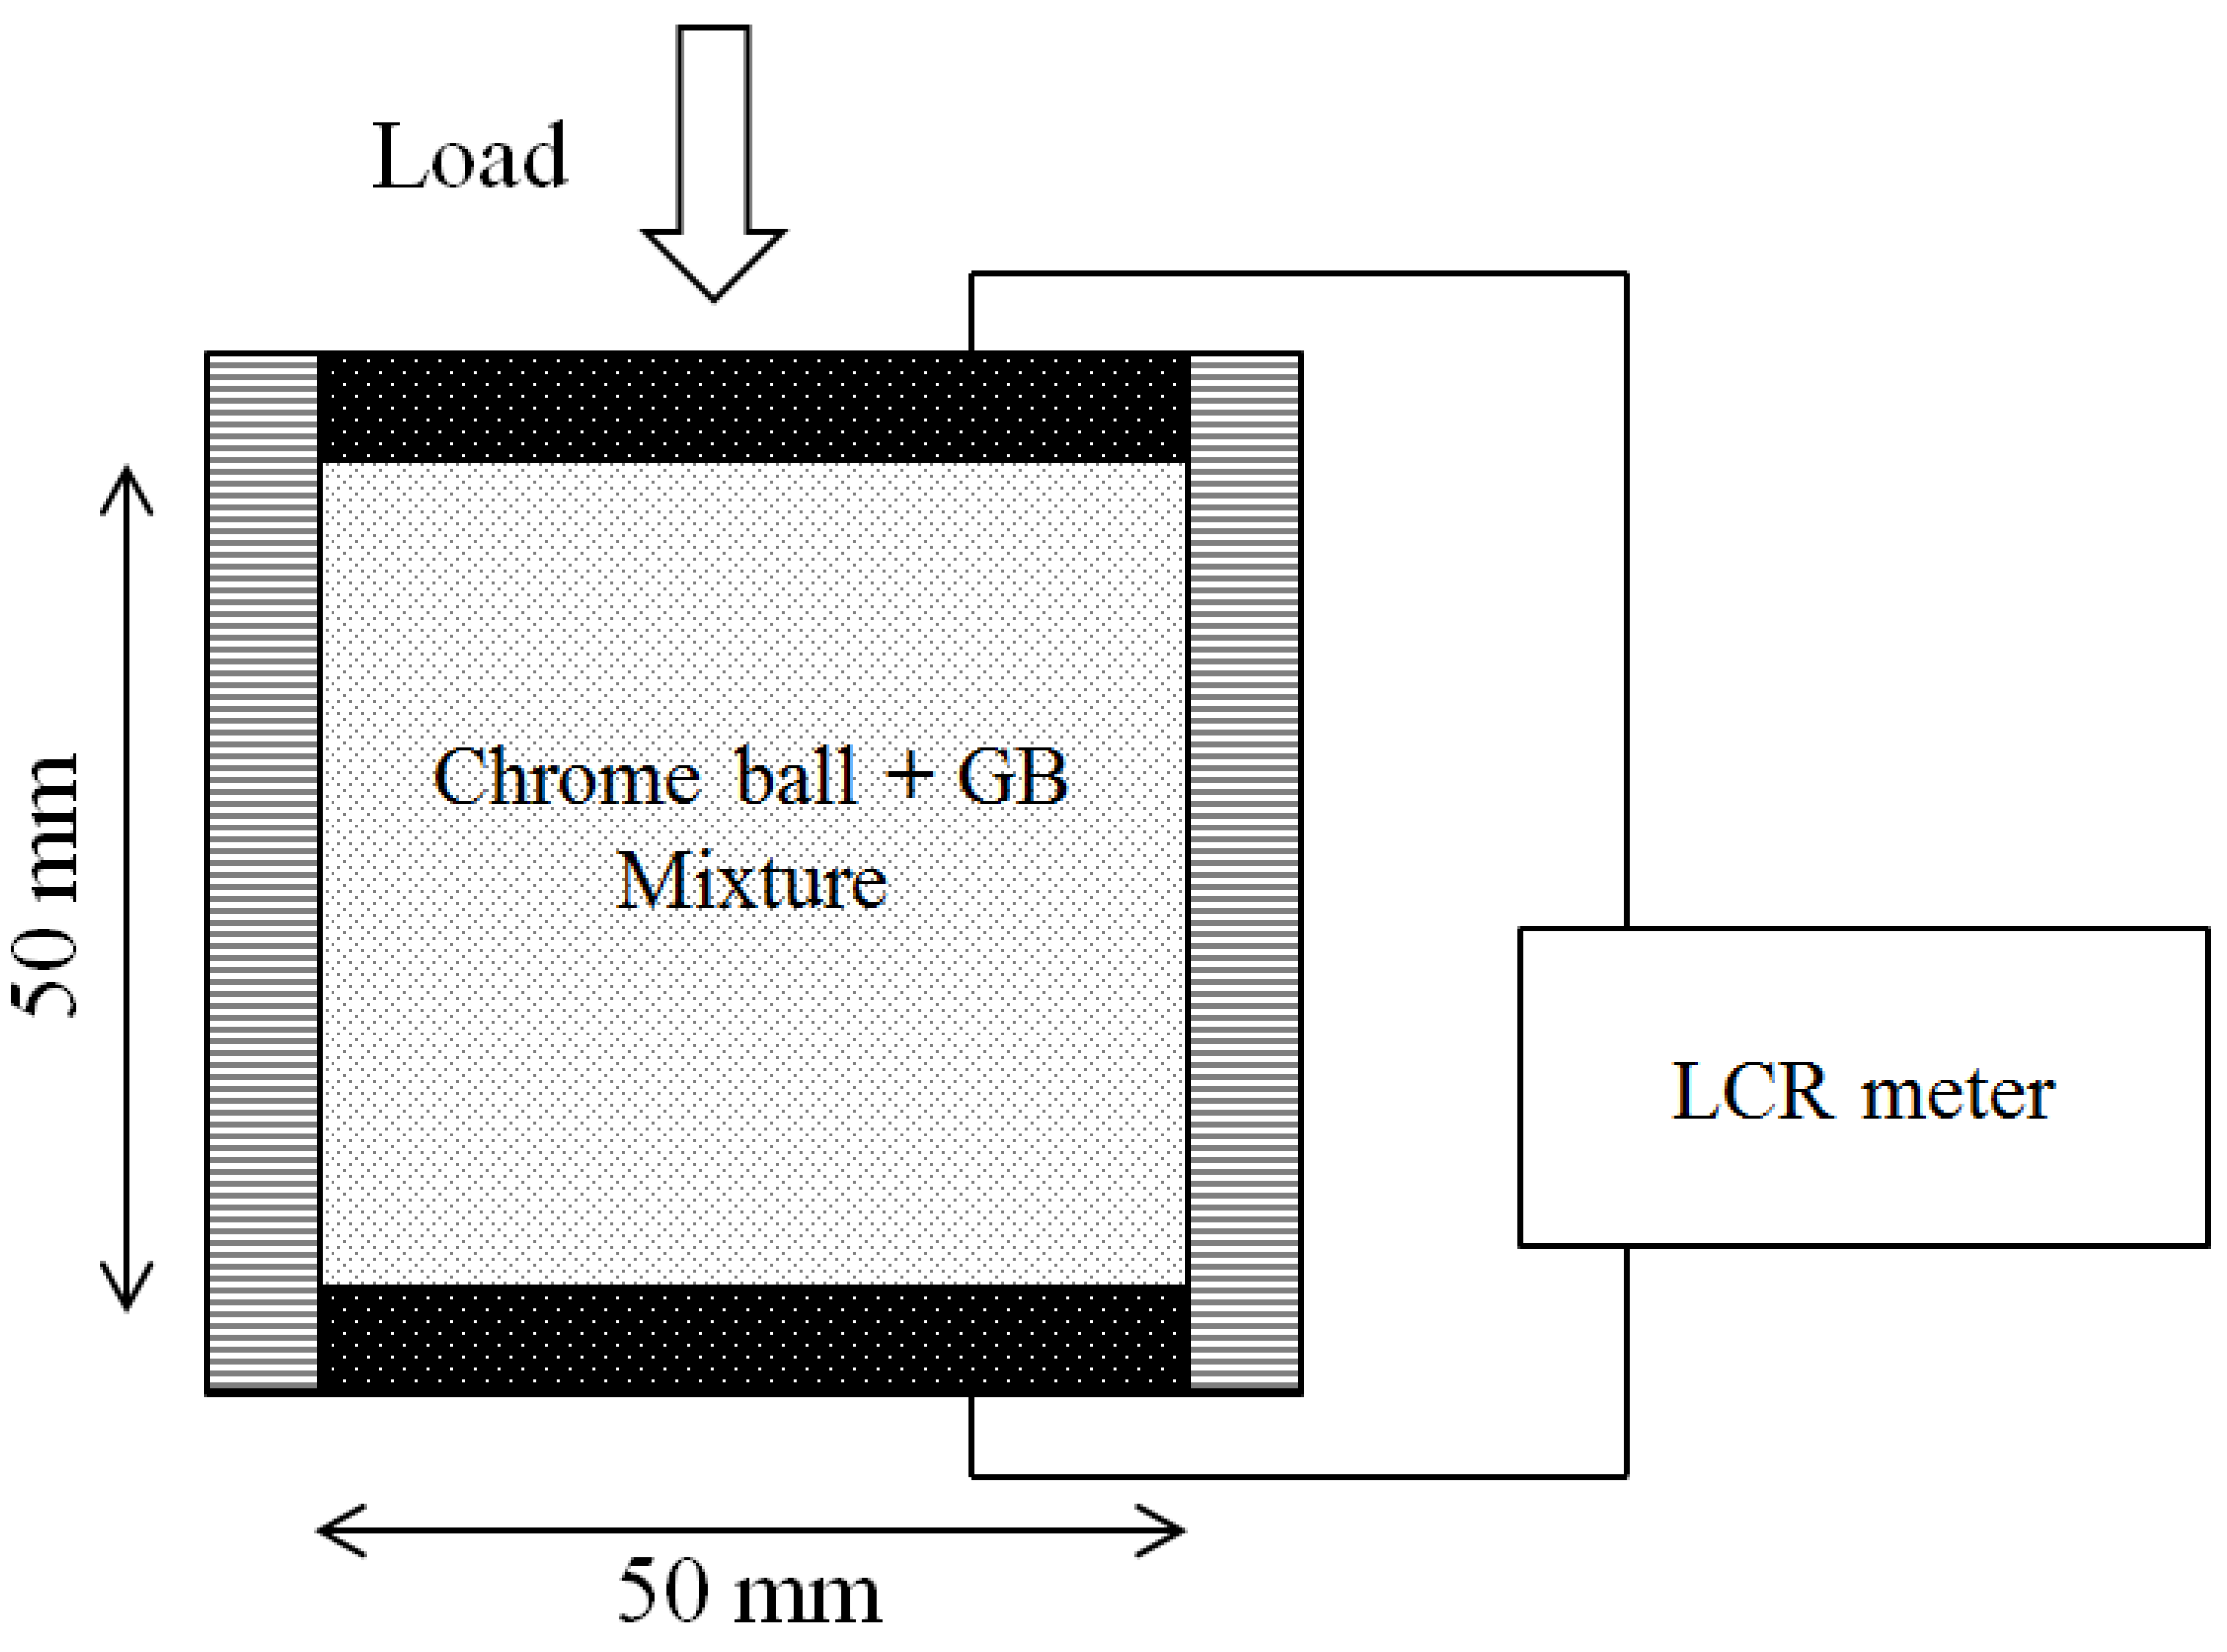
Method
| Vol. Fraction, (%) | Porosity | ||
|---|---|---|---|
| Case 1 | Case 2 | Case 3 | |
| 0 | 0.65 | 0.63 | 0.59 |
| 10 | 0.65 | 0.58 | 0.55 |
| 22 | 0.62 | 0.61 | 0.59 |
| 39 | 0.55 | 0.55 | 0.48 |
| 63 | 0.51 | 0.48 | 0.44 |
| 80 | 0.38 | 0.40 | 0.39 |
| 100 | 0.40 | 0.40 | 0.40 |

3. Numerical Simulation
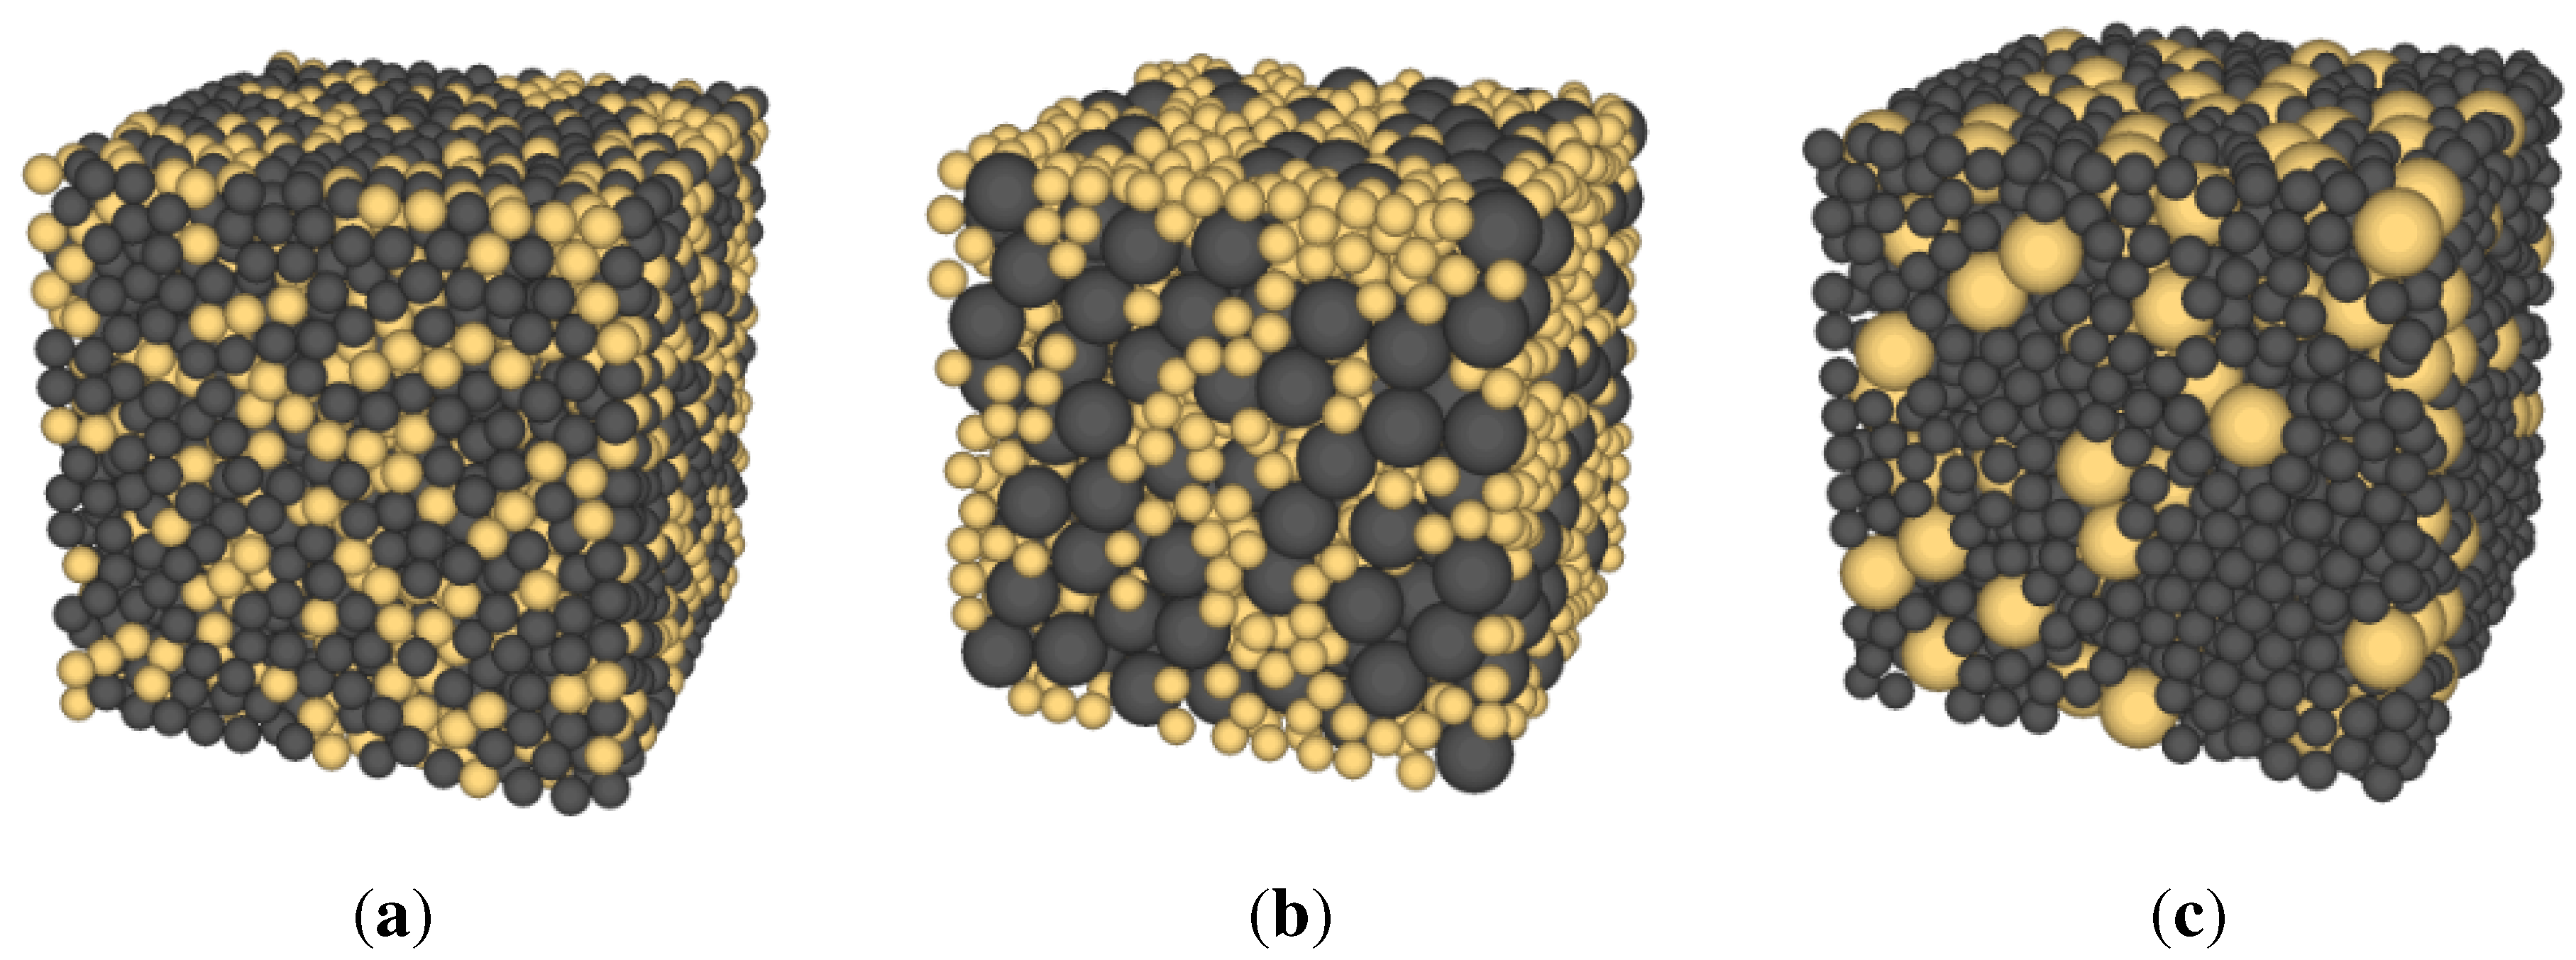
3.1. Generation of Packing
| Values | Rubber Particle | Glass Bead | Chrome Ball | |
|---|---|---|---|---|
| DEM | Specific gravity | 1.05 | 2.51 | 7.81 |
| Shear modulus (MPa) | ||||
| Poisson’s ratio | 0.5 | 0.31 | 0.31 | |
| Friction coefficient | 0.5 | 0.31 | 0.31 | |
| Network model | Thermal conductivity (W/mK) | 0.25 | 1.124 | - |
| Electrical resistivity | - | to | 219 |

Network Model
4. Results
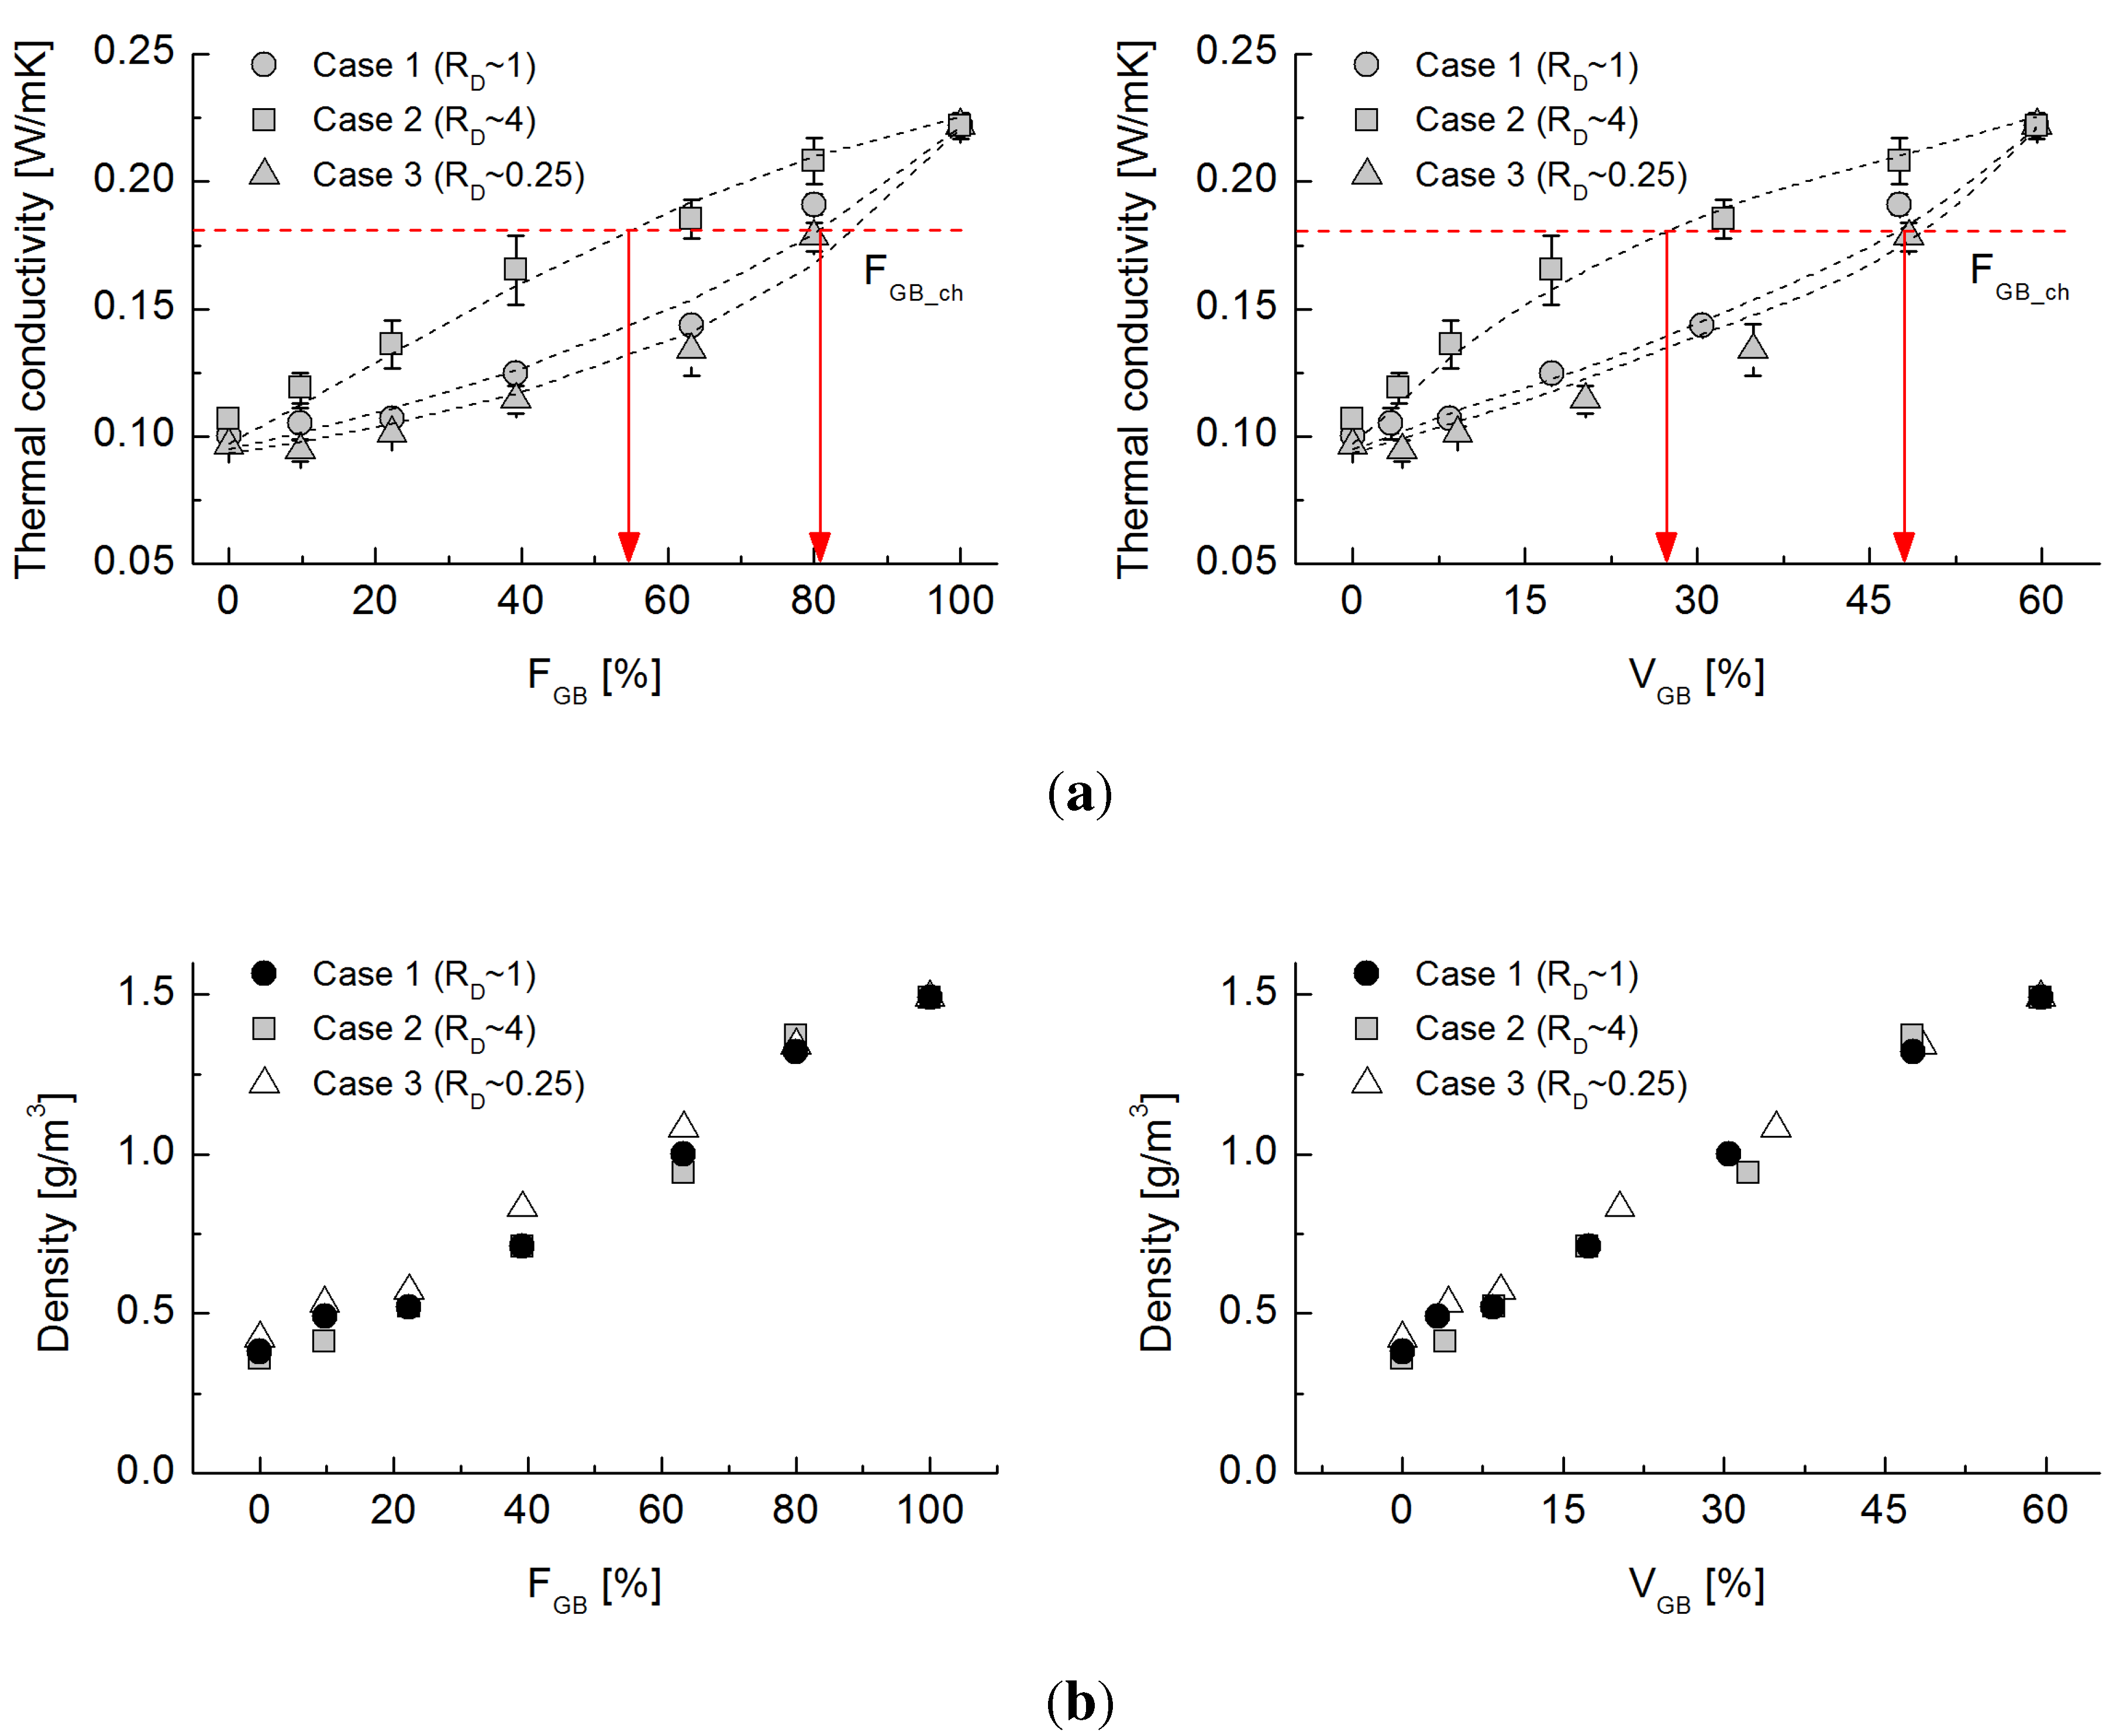
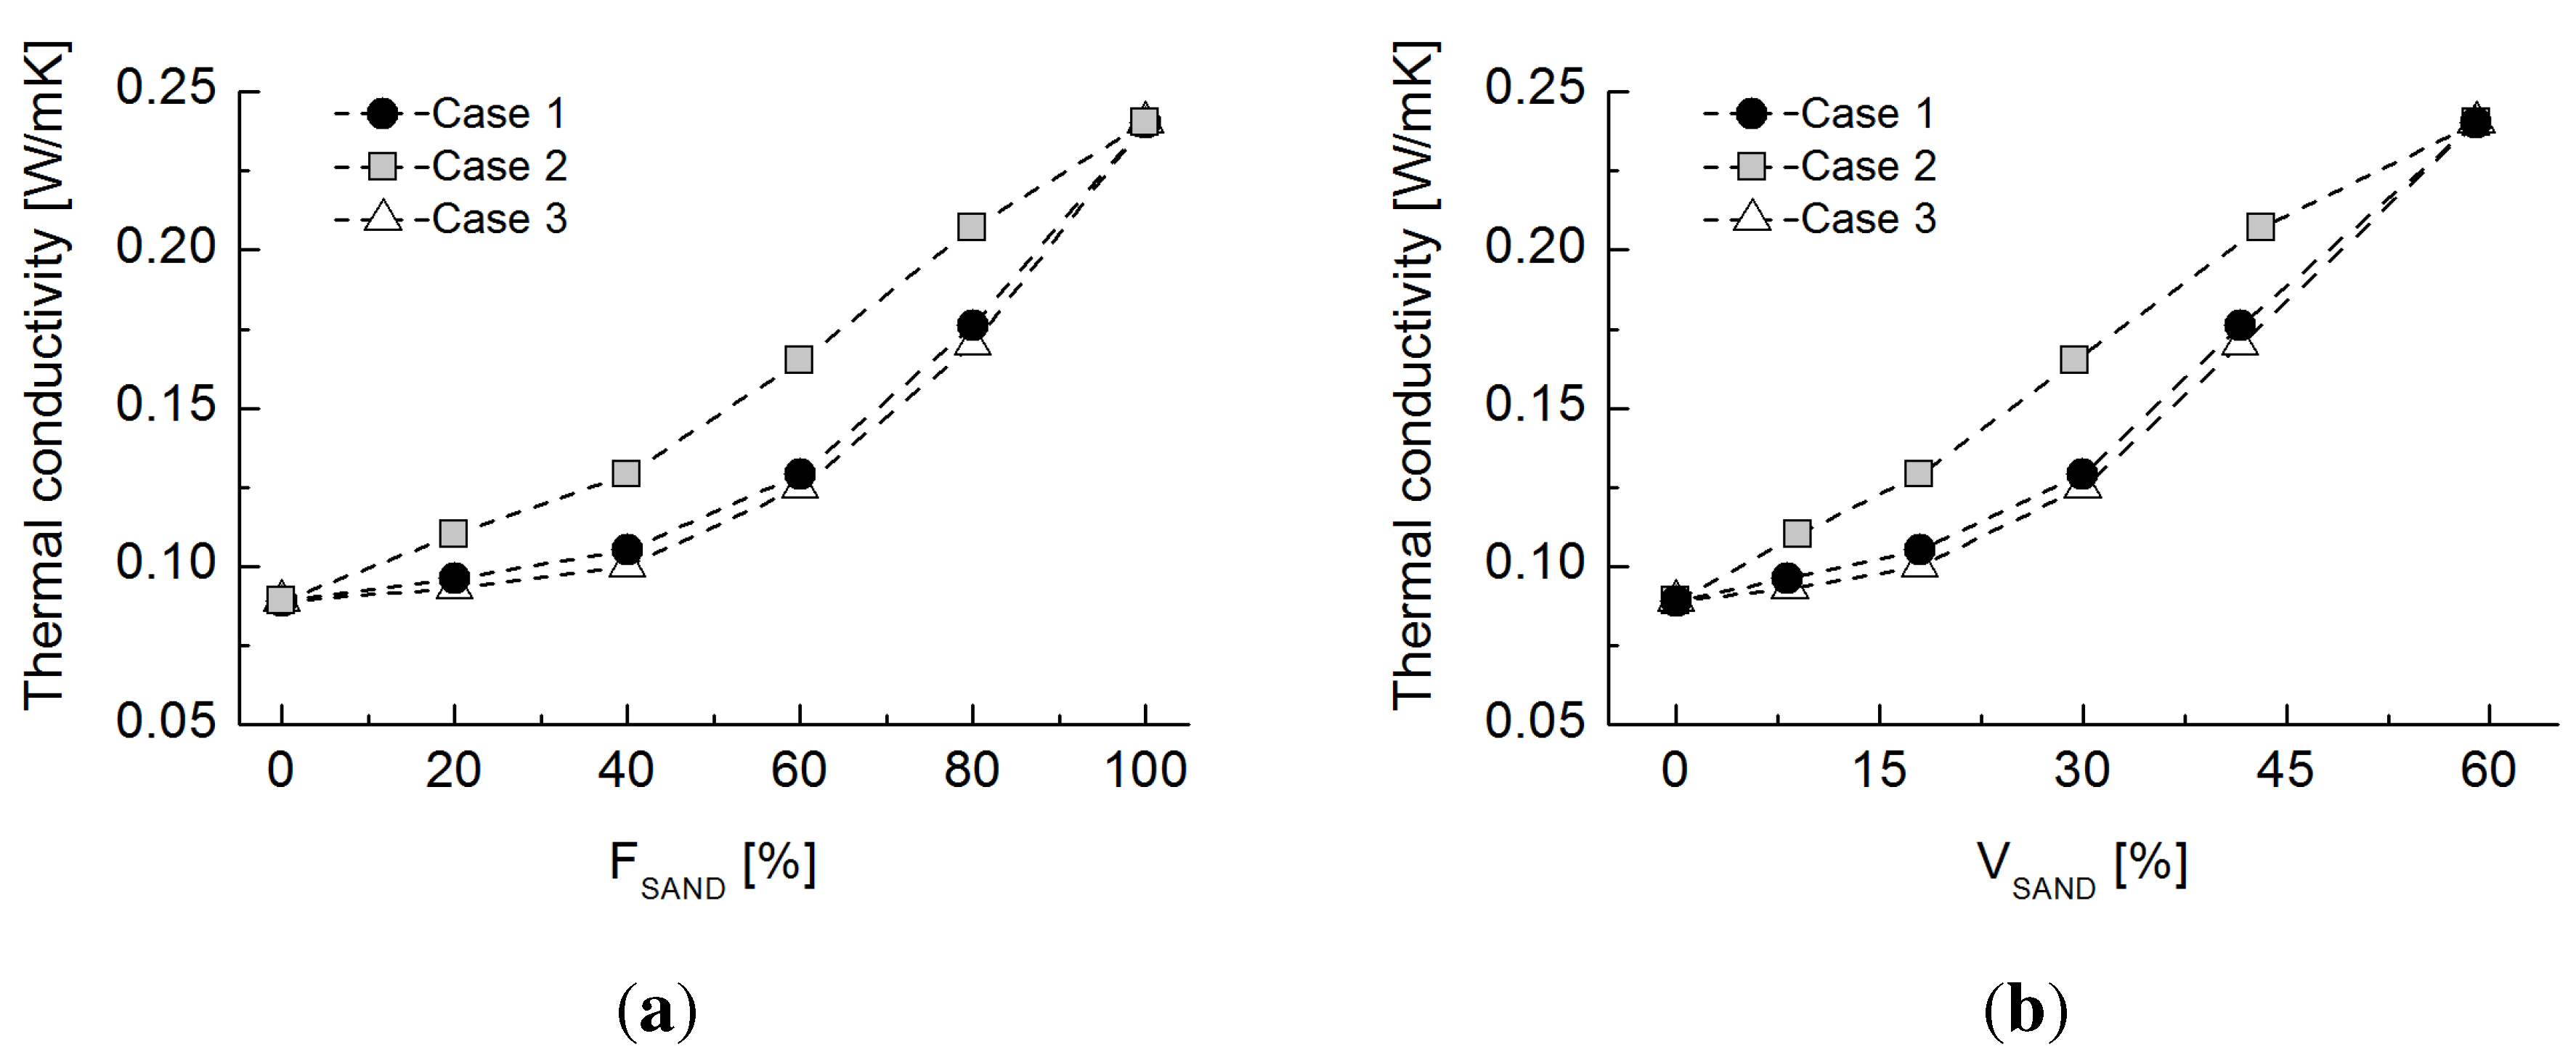
4.1. Effective Thermal Conductivity

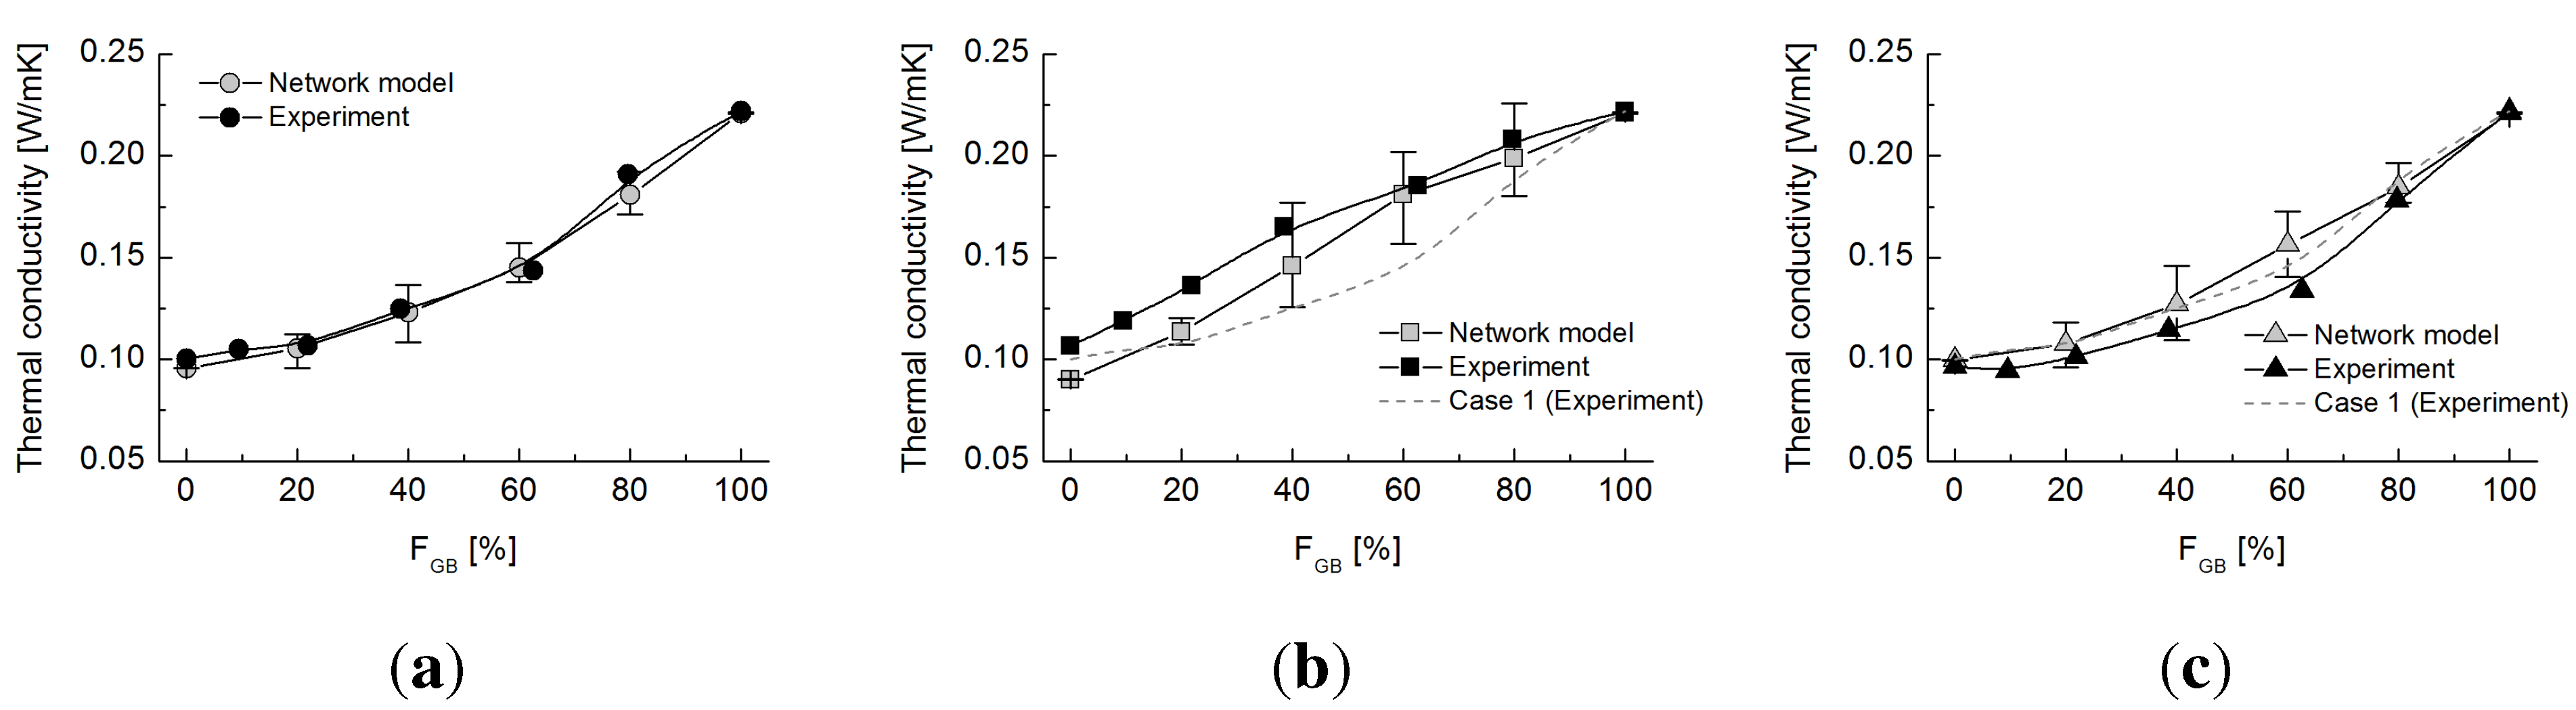
4.2. Network Model

4.3. Dominant Factors Influencing Thermal Conduction


5. Discussion
5.1. Sand-Rubber Mixture Test
| Vol.Fraction, (%) | Porosity | ||
|---|---|---|---|
| Case 1 | Case 2 | Case 3 | |
| 0 | 0.62 | 0.61 | 0.62 |
| 20 | 0.59 | 0.55 | 0.58 |
| 40 | 0.55 | 0.55 | 0.55 |
| 60 | 0.50 | 0.51 | 0.50 |
| 80 | 0.48 | 0.46 | 0.49 |
| 100 | 0.41 | 0.41 | 0.41 |
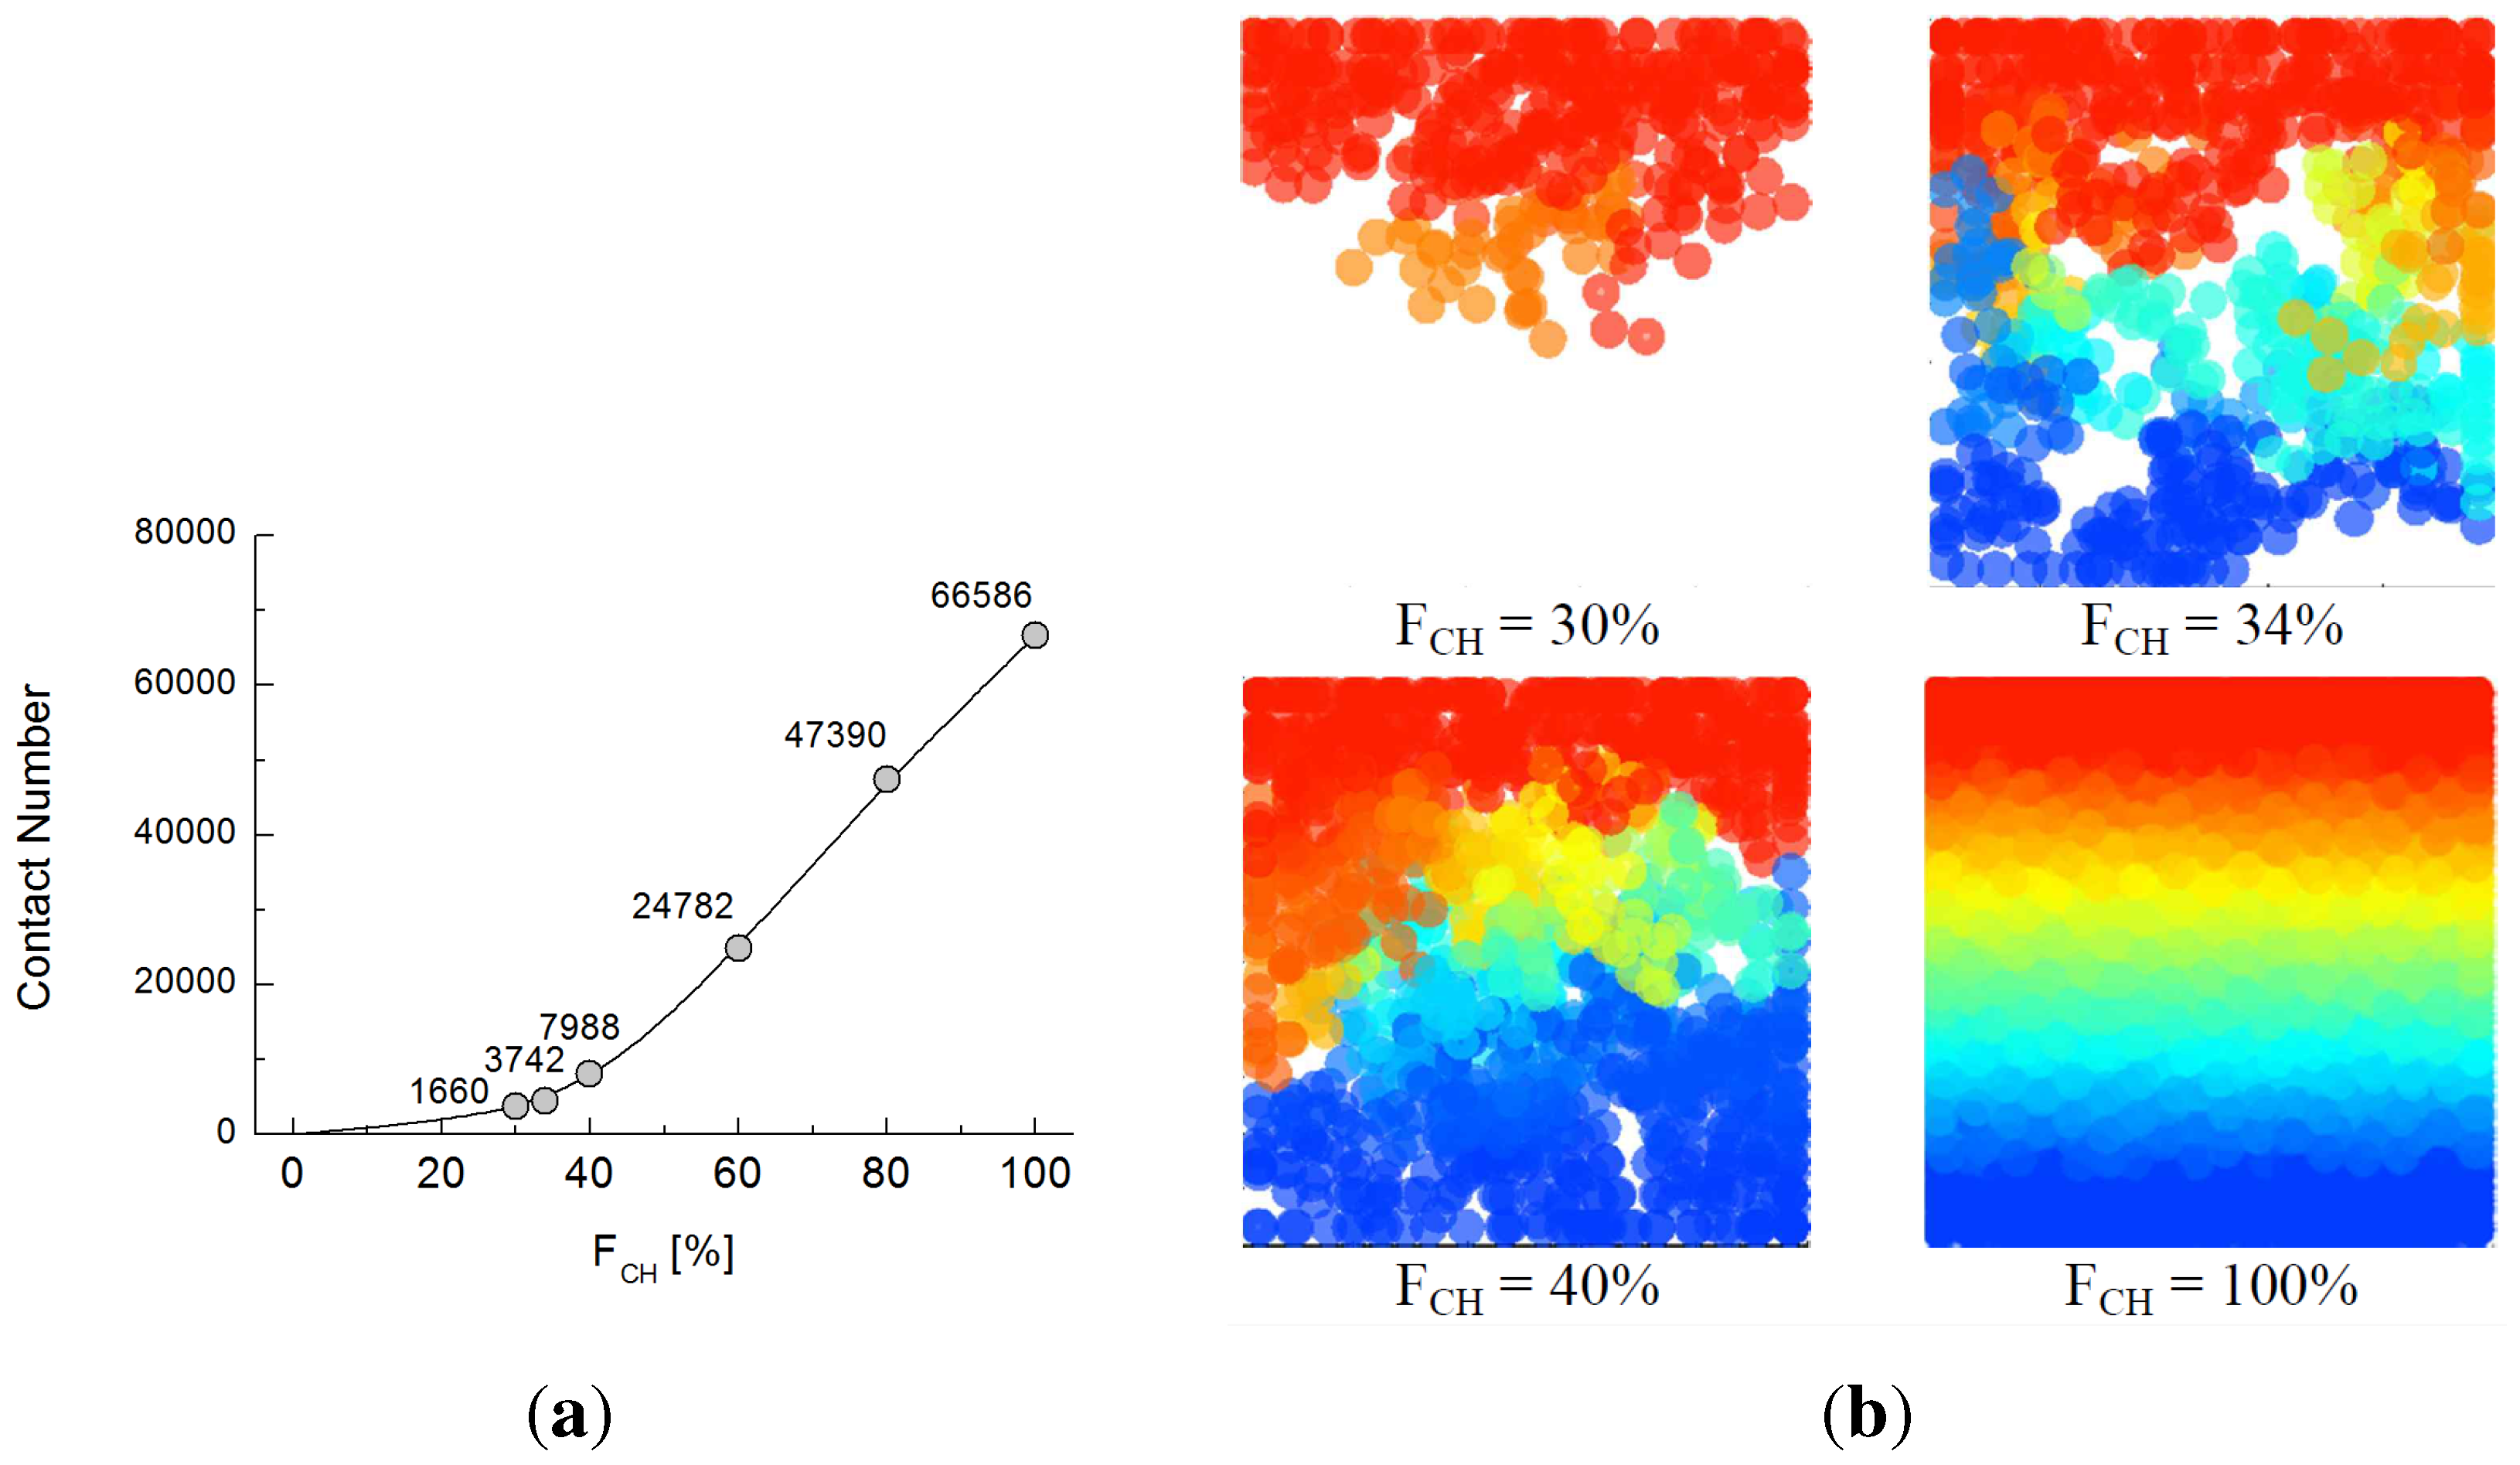
5.2. Effect of Particle Contact
| Case | Particle Diameter | ||
|---|---|---|---|
| Chrome Ball | Glass Bead | ||
| Case 1 | 1∼0.84 | 1.19∼0.3 | ∼1 |
| Case 2 | 1∼1.68 | 2.38∼0.3 | ∼2 |
| Case 3 | 1∼0.4 | 0.6∼0.3 | ∼0.5 |
| Vol. Fraction, (%) | Porosity | ||
|---|---|---|---|
| Case 1 | Case 2 | Case 3 | |
| 0 | 0.36 | 0.36 | 0.36 |
| 20 | 0.36 | 0.36 | 0.36 |
| 40 | 0.38 | 0.36 | 0.37 |
| 60 | 0.37 | 0.39 | 0.38 |
| 80 | 0.39 | 0.38 | 0.38 |
| 100 | 0.39 | 0.39 | 0.39 |


6. Conclusions
Acknowledgments
Author Contributions
Conflicts of Interest
References
- Balunaini, U.; Yoon, S.; Prezzi, M.; Salgado, R. Pullout response of uniaxial geogrid in tire shred–sand mixtures. Geotech. Geol. Eng. 2014, 32, 505–523. [Google Scholar] [CrossRef]
- Feng, Z.; Sutter, K. Dynamic properties of granulated rubber/sand mixtures. ASTM Geotech. Test. J. 2000, 23, 338–344. [Google Scholar]
- Lee, J.; Dodds, J.; Santamarina, J. Behavior of rigid-soft particle mixtures. J. Mater. Civil Eng. 2007, 19, 179–184. [Google Scholar] [CrossRef]
- Lee, J. Thermal and Electrical Behaviors of Selected Geomaterials. Ph.D. Thesis, University of Western Ontario, London, ON, Canada, 2012. [Google Scholar]
- Lee, C.; Shin, H.; Lee, J. Behavior of sand–rubber particle mixtures: Experimental observations and numerical simulations. Int. J. Numer. Anal. Methods Geomech. 2014, 38, 1651–1663. [Google Scholar] [CrossRef]
- Zornberg, J.; Cabral, A.; Viratjandr, C. Behaviour of tire shred sand mixtures. Can. Geotech. J. 2004, 41, 227–241. [Google Scholar] [CrossRef]
- Hamilton, R.; Crosser, O. Thermal conductivity of heterogeneous two-component systems. Ind. Eng. Chem. Fundam. 1962, 1, 187–191. [Google Scholar] [CrossRef]
- Yun, T.; Santamarina, J. Fundamental study of thermal conduction in dry soils. Granul. Matter 2008, 10, 197–207. [Google Scholar] [CrossRef]
- Gustafsson, S. Transient plane source techniques for thermal conductivity and thermal diffusivity measurements of solid materials. Rev. Sci. Instrum. 1991, 62, 797–804. [Google Scholar] [CrossRef]
- Evans, M.; Lee, J.; Yun, T.; Valdes, R. Thermal conductivity in granular mixtures: Experimental and numerical studies. In Proceedings of the International Symposium on Deformation Characteristics of Geomaterials, Seoul, Korea, 1–3 September 2011; pp. 815–820.
- Kim, D.; Kim, Y.; Lee, J.; Yun, T. Thermal and electrical response of unsaturated hydrophilic and hydrophobic granular materials. ASTM Geotech. Test. J. 2011, 34, 562–570. [Google Scholar]
- Yun, T.; Evans, T. Three-dimensional random network model for thermal conductivity in particulate materials. Comput. Geotech. 2010, 37, 991–998. [Google Scholar] [CrossRef]
- Holtzman, R.; Silin, D.; Patzek, T. Frictional granular mechanics: A variational approach. Int. J. Numer. Methods Eng. 2010, 81, 1259–1280. [Google Scholar] [CrossRef]
- Choo, J.; Kim, Y.; Lee, J.; Yun, T.; Lee, J.; Kim, Y. Stress-induced evolution of anisotropic thermal conductivity of dry granular materials. Acta Geotech. 2013, 8, 91–106. [Google Scholar] [CrossRef]
- O’Sullivan, C.; Bray, J. Selecting a suitable time step for discrete element simulations that use the central difference time integration scheme. Eng. Comput. 2004, 21, 278–303. [Google Scholar] [CrossRef]
- Batchelor, G.; O’Brien, R. Thermal or electrical conduction through a granular material. Proc. R. Soc. Lond. A Math. Phys. Sci. 1977, 355, 313–333. [Google Scholar] [CrossRef]
- Lee, J.; Yun, T. Electrical Conduction of Granular Media: Experimental and Numerical Studies. In Proceedings of the GeoCongress 2012 State of the Art and Practice in Geotechnical Engineering, Oaklenda, CA, USA, 25–29 March 2012; pp. 2362–2371.
© 2015 by the authors; licensee MDPI, Basel, Switzerland. This article is an open access article distributed under the terms and conditions of the Creative Commons Attribution license (http://creativecommons.org/licenses/by/4.0/).
Share and Cite
Lee, J.; Yun, T.S.; Choi, S.-U. The Effect of Particle Size on Thermal Conduction in Granular Mixtures. Materials 2015, 8, 3975-3991. https://doi.org/10.3390/ma8073975
Lee J, Yun TS, Choi S-U. The Effect of Particle Size on Thermal Conduction in Granular Mixtures. Materials. 2015; 8(7):3975-3991. https://doi.org/10.3390/ma8073975
Chicago/Turabian StyleLee, Junghwoon, Tae Sup Yun, and Sung-Uk Choi. 2015. "The Effect of Particle Size on Thermal Conduction in Granular Mixtures" Materials 8, no. 7: 3975-3991. https://doi.org/10.3390/ma8073975
APA StyleLee, J., Yun, T. S., & Choi, S.-U. (2015). The Effect of Particle Size on Thermal Conduction in Granular Mixtures. Materials, 8(7), 3975-3991. https://doi.org/10.3390/ma8073975