
A Photolithographic Approach to Polymeric Microneedles Array Fabrication

 ,
, 

Abstract
:1. Introduction
2. Experimental Section
2.1. Materials
2.2. Direct Photolithographic Methods
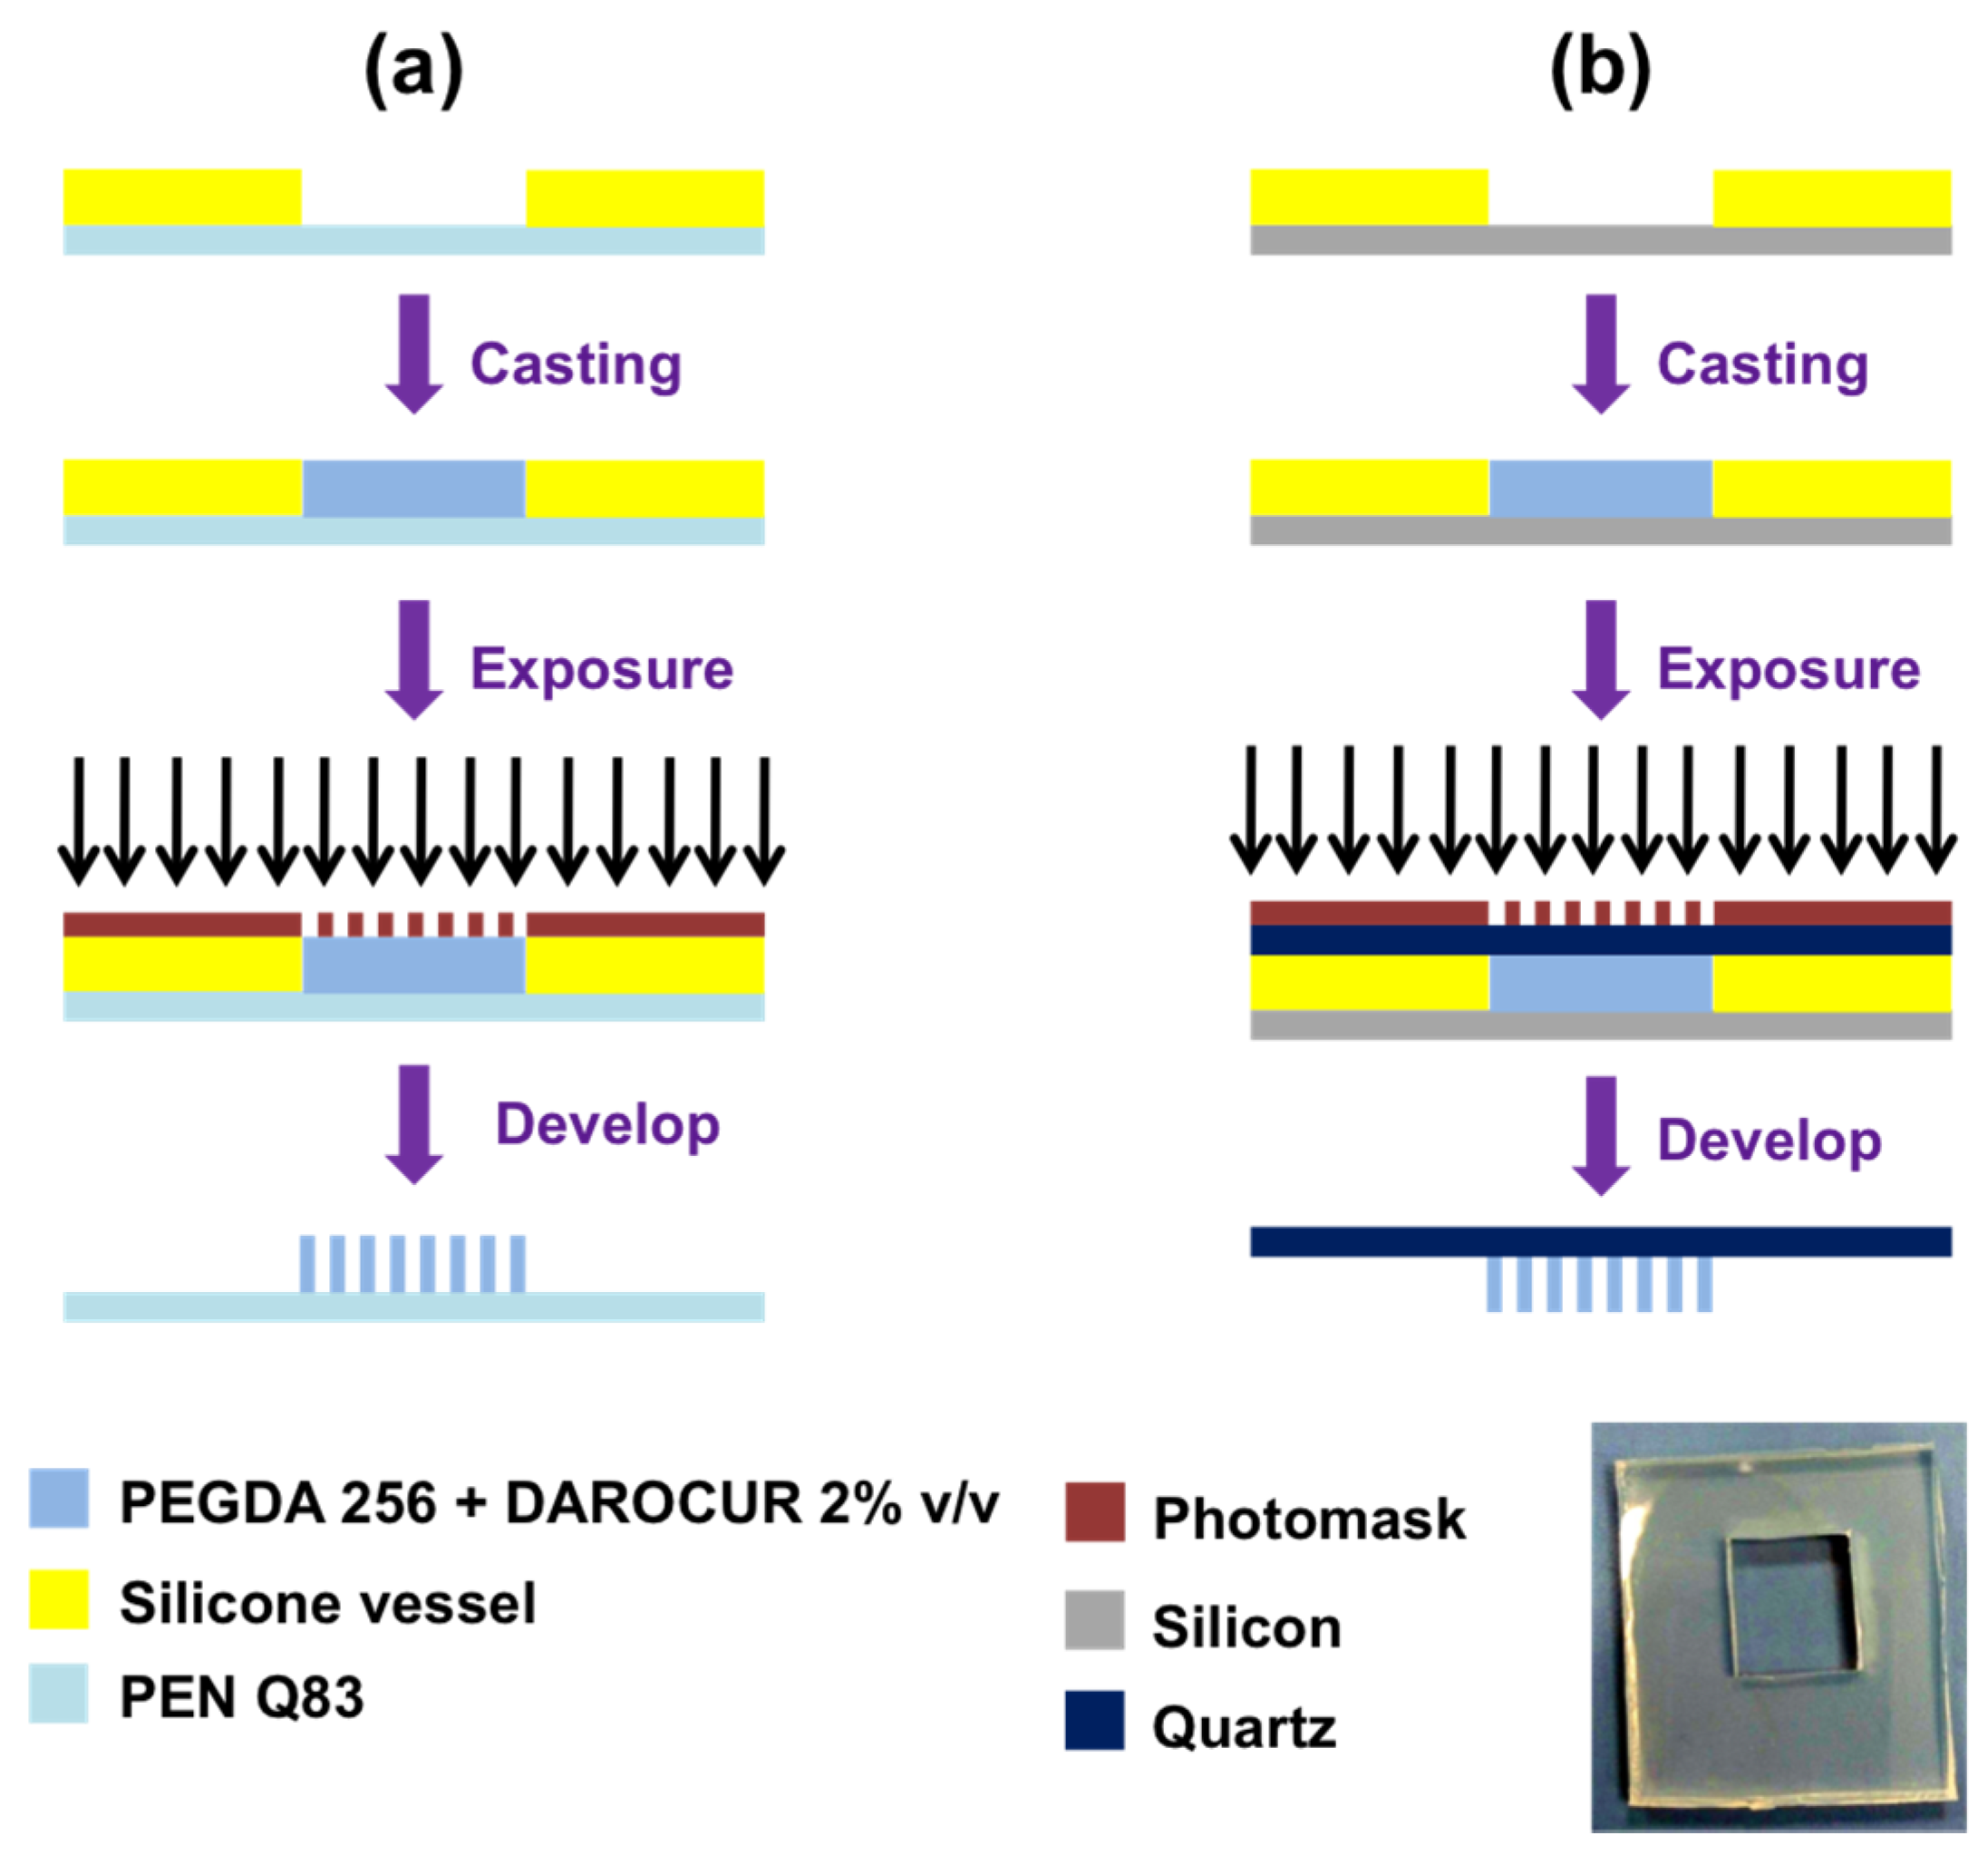
2.2.1. Method 1
2.2.2. Method 2
2.3. Characterization
2.3.1. Image Analysis
2.3.2. Scanning Electron Microscopy
2.3.3. Mechanical Tests
3. Results and Discussion
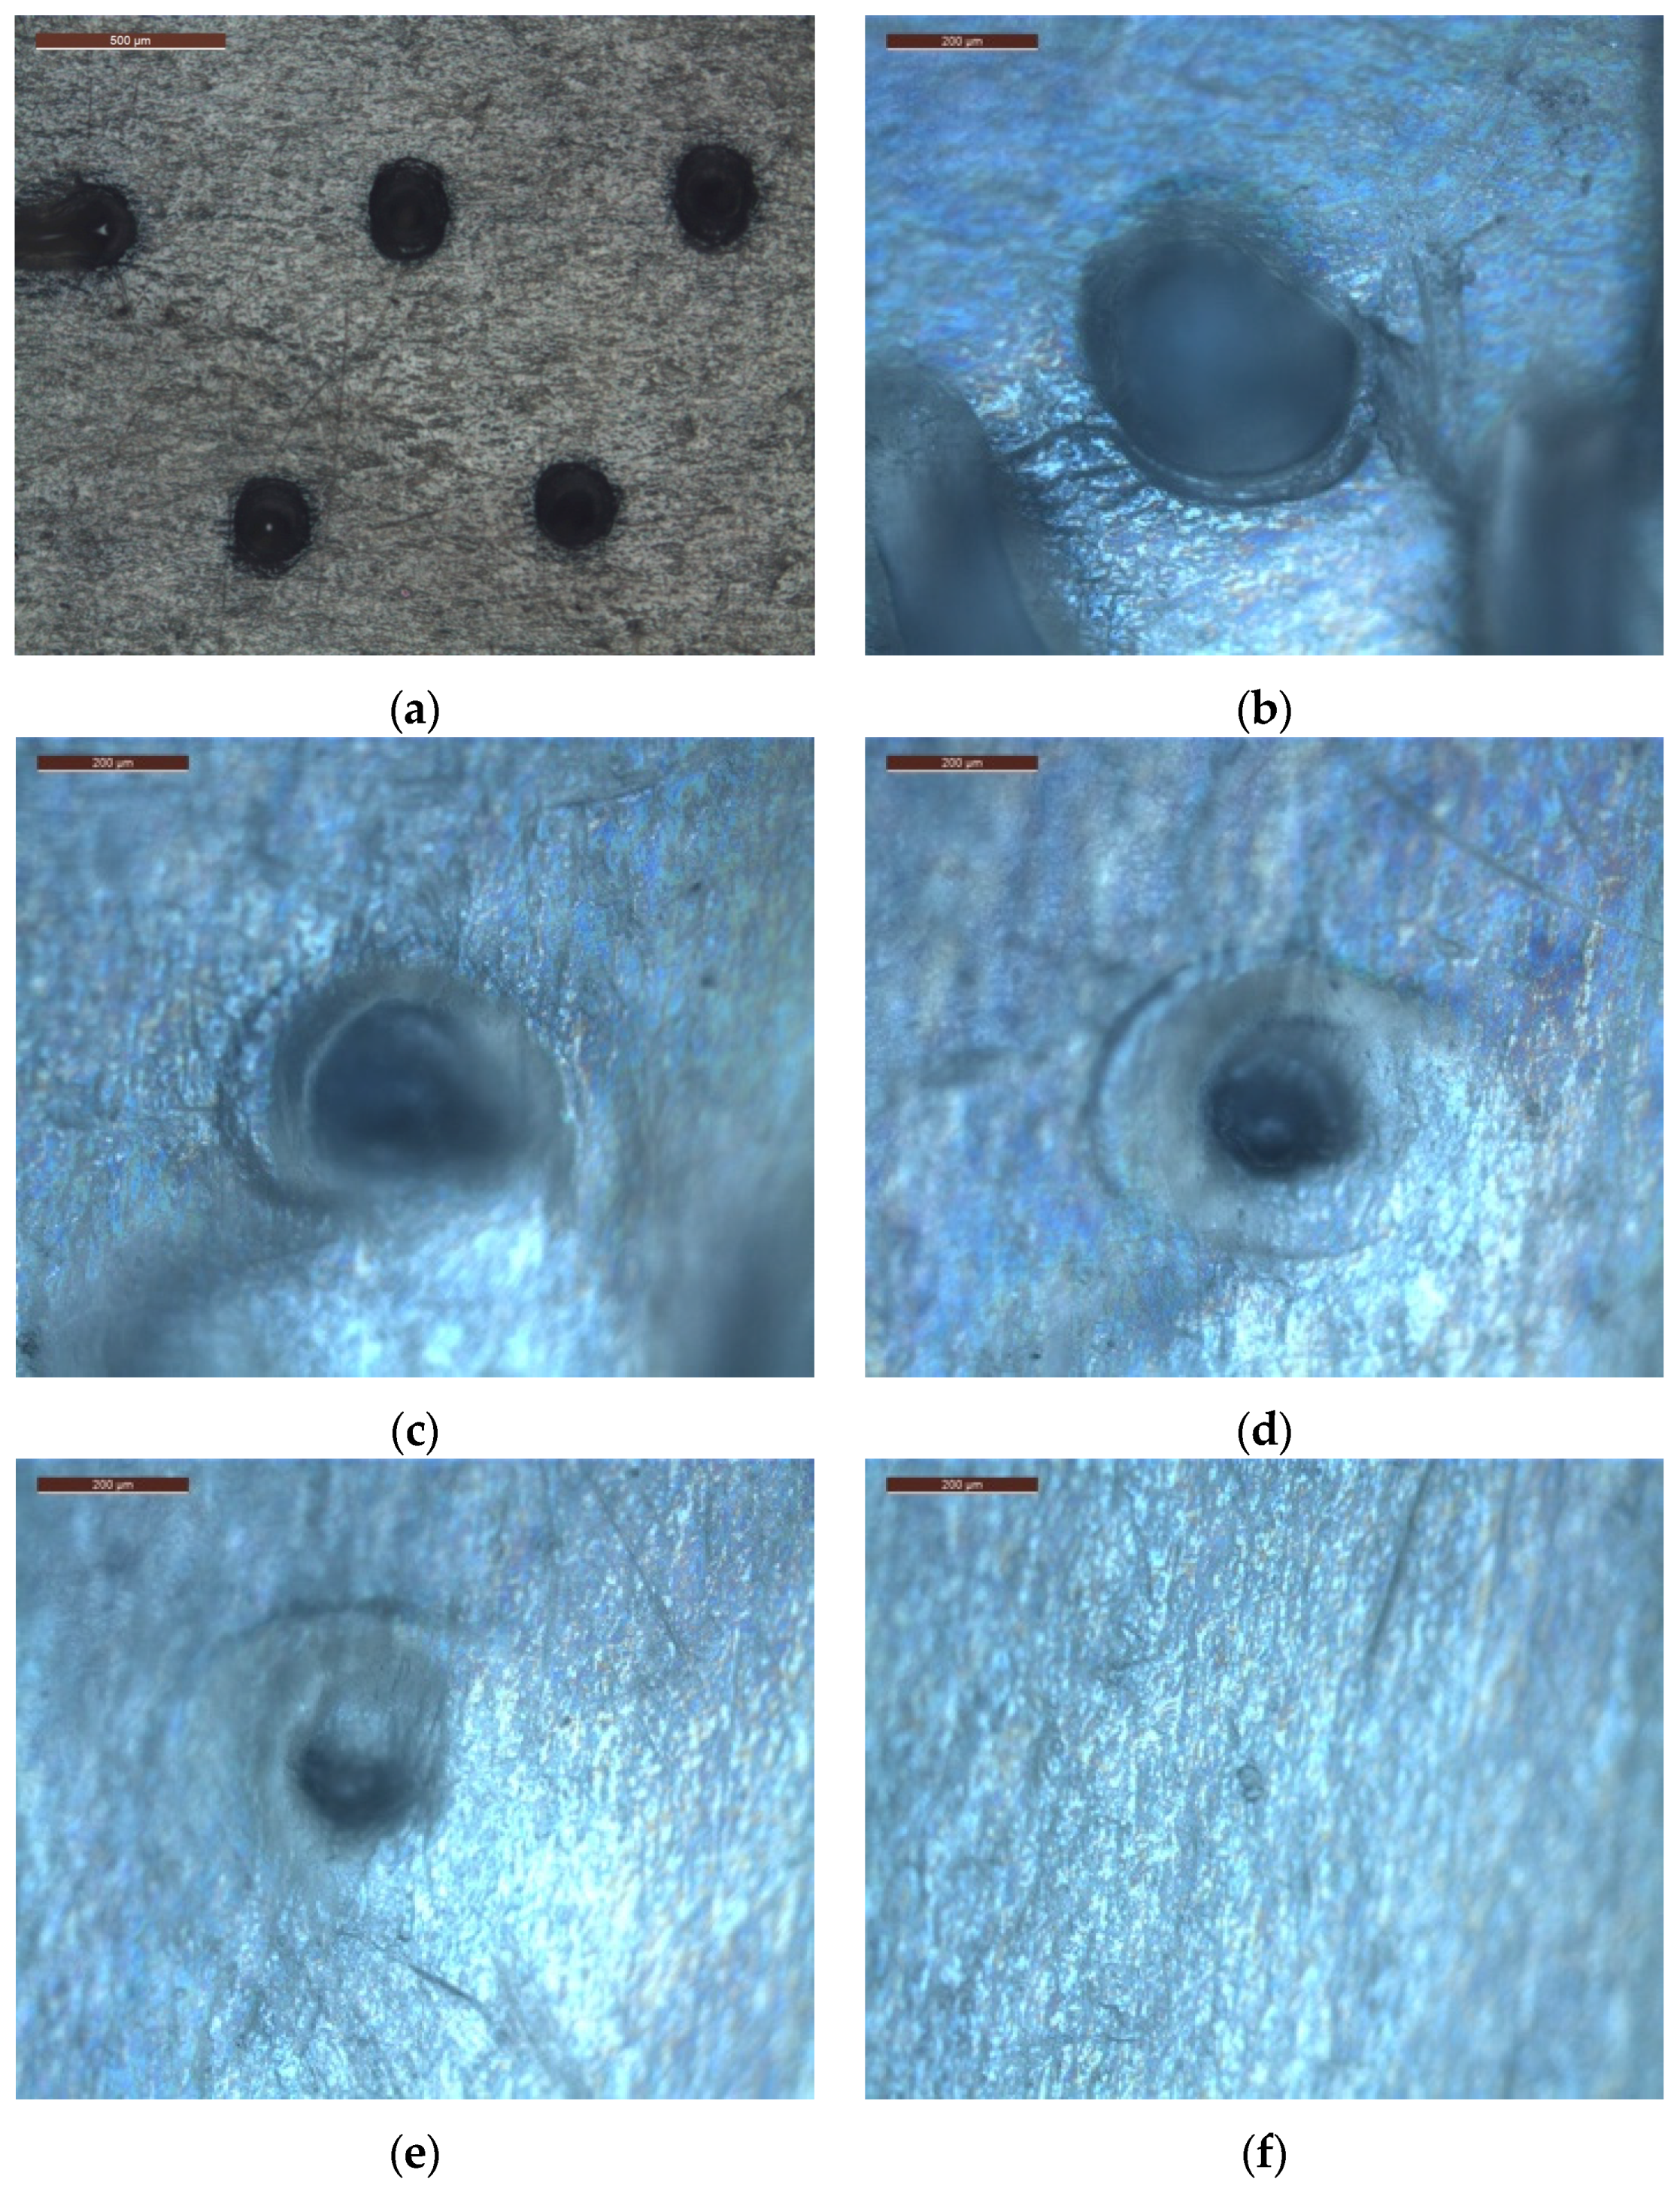
3.1. Method 1

| Sample Name | Dose (J/cm2) | Deposition Method | Array Type | Height (μm) | Shape |
|---|---|---|---|---|---|
| 1B1 | 18 | Casting in vessel (2 mm) | B | 150 | cylinder |
| 2B1 | 18 | Spinning (400 rpm) | B | 70 | cylinder |
| 3B1 | 18 | Spinning (800 rpm) | B | 20 | cylinder |
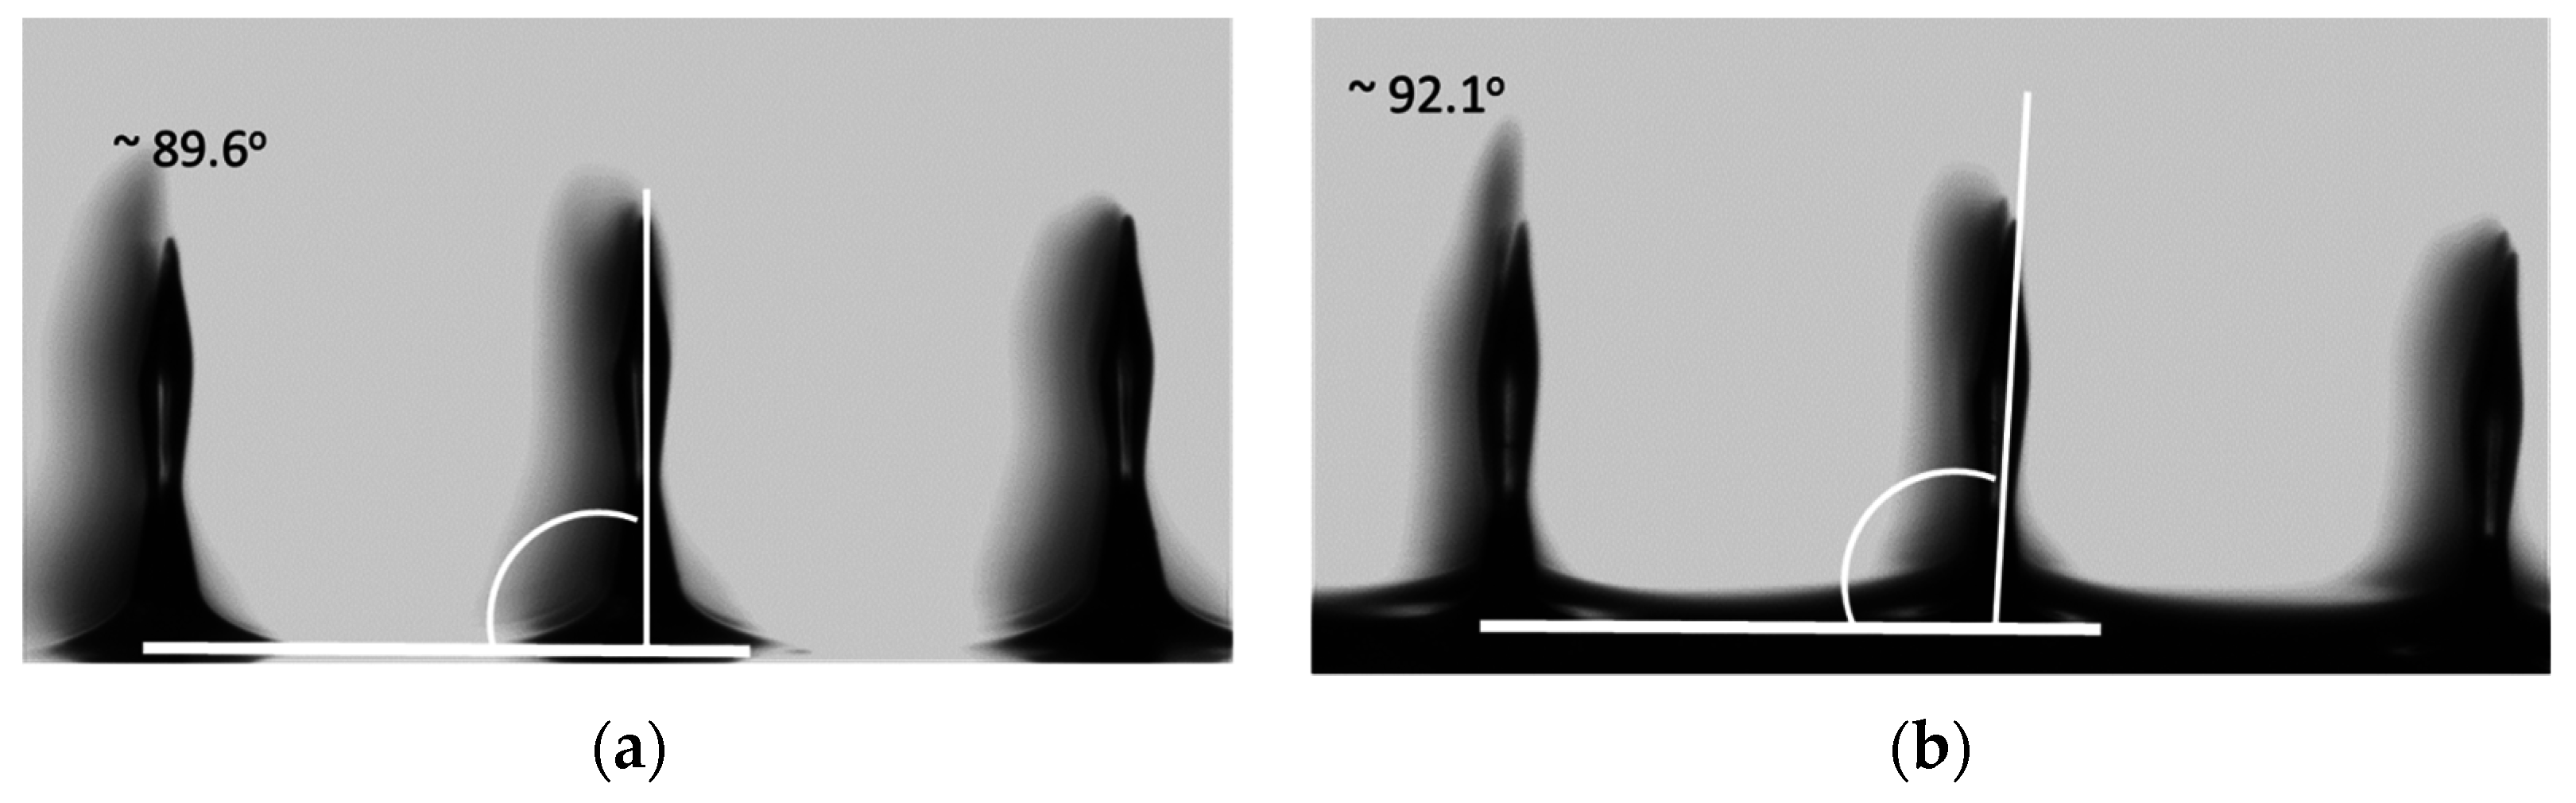
3.2. Method 2
| Sample Name | Exposure Time (s) | Array Type | Height (μm) | Shape |
|---|---|---|---|---|
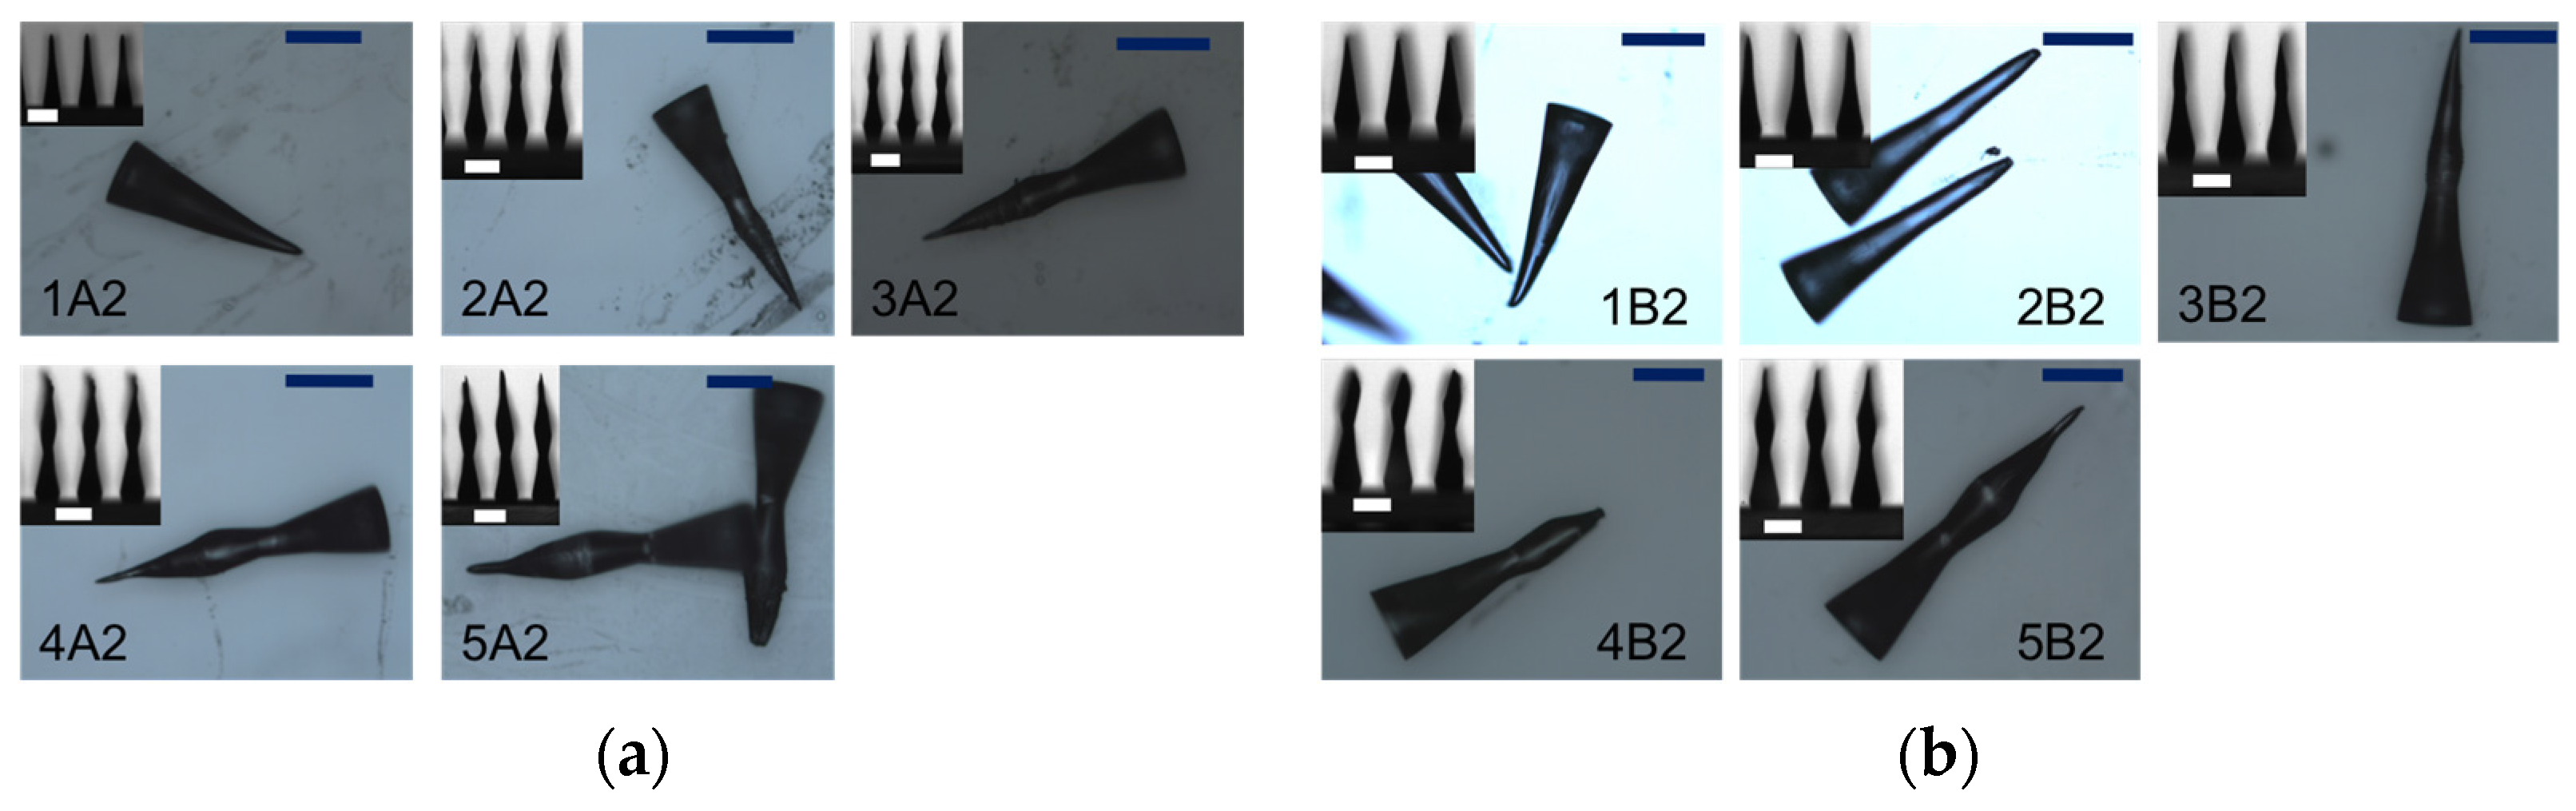
| 1A2 | 5 | A | 1340 | cone |
| 2A2 | 7.5 | A | 1430 | lance |
| 3A2 | 10 | A | 1450 | lance |
| 4A2 | 12.5 | A | 1700 | lance |
| 5A2 | 15 | A | 2240 | lance |
| 1B2 | 5 | B | 1230 | cone |
| 2B2 | 7.5 | B | 1430 | cone |
| 3B2 | 10 | B | 1690 | lance |
| 4B2 | 12.5 | B | 1700 | lance |
| 5B2 | 15 | B | 2000 | lance |
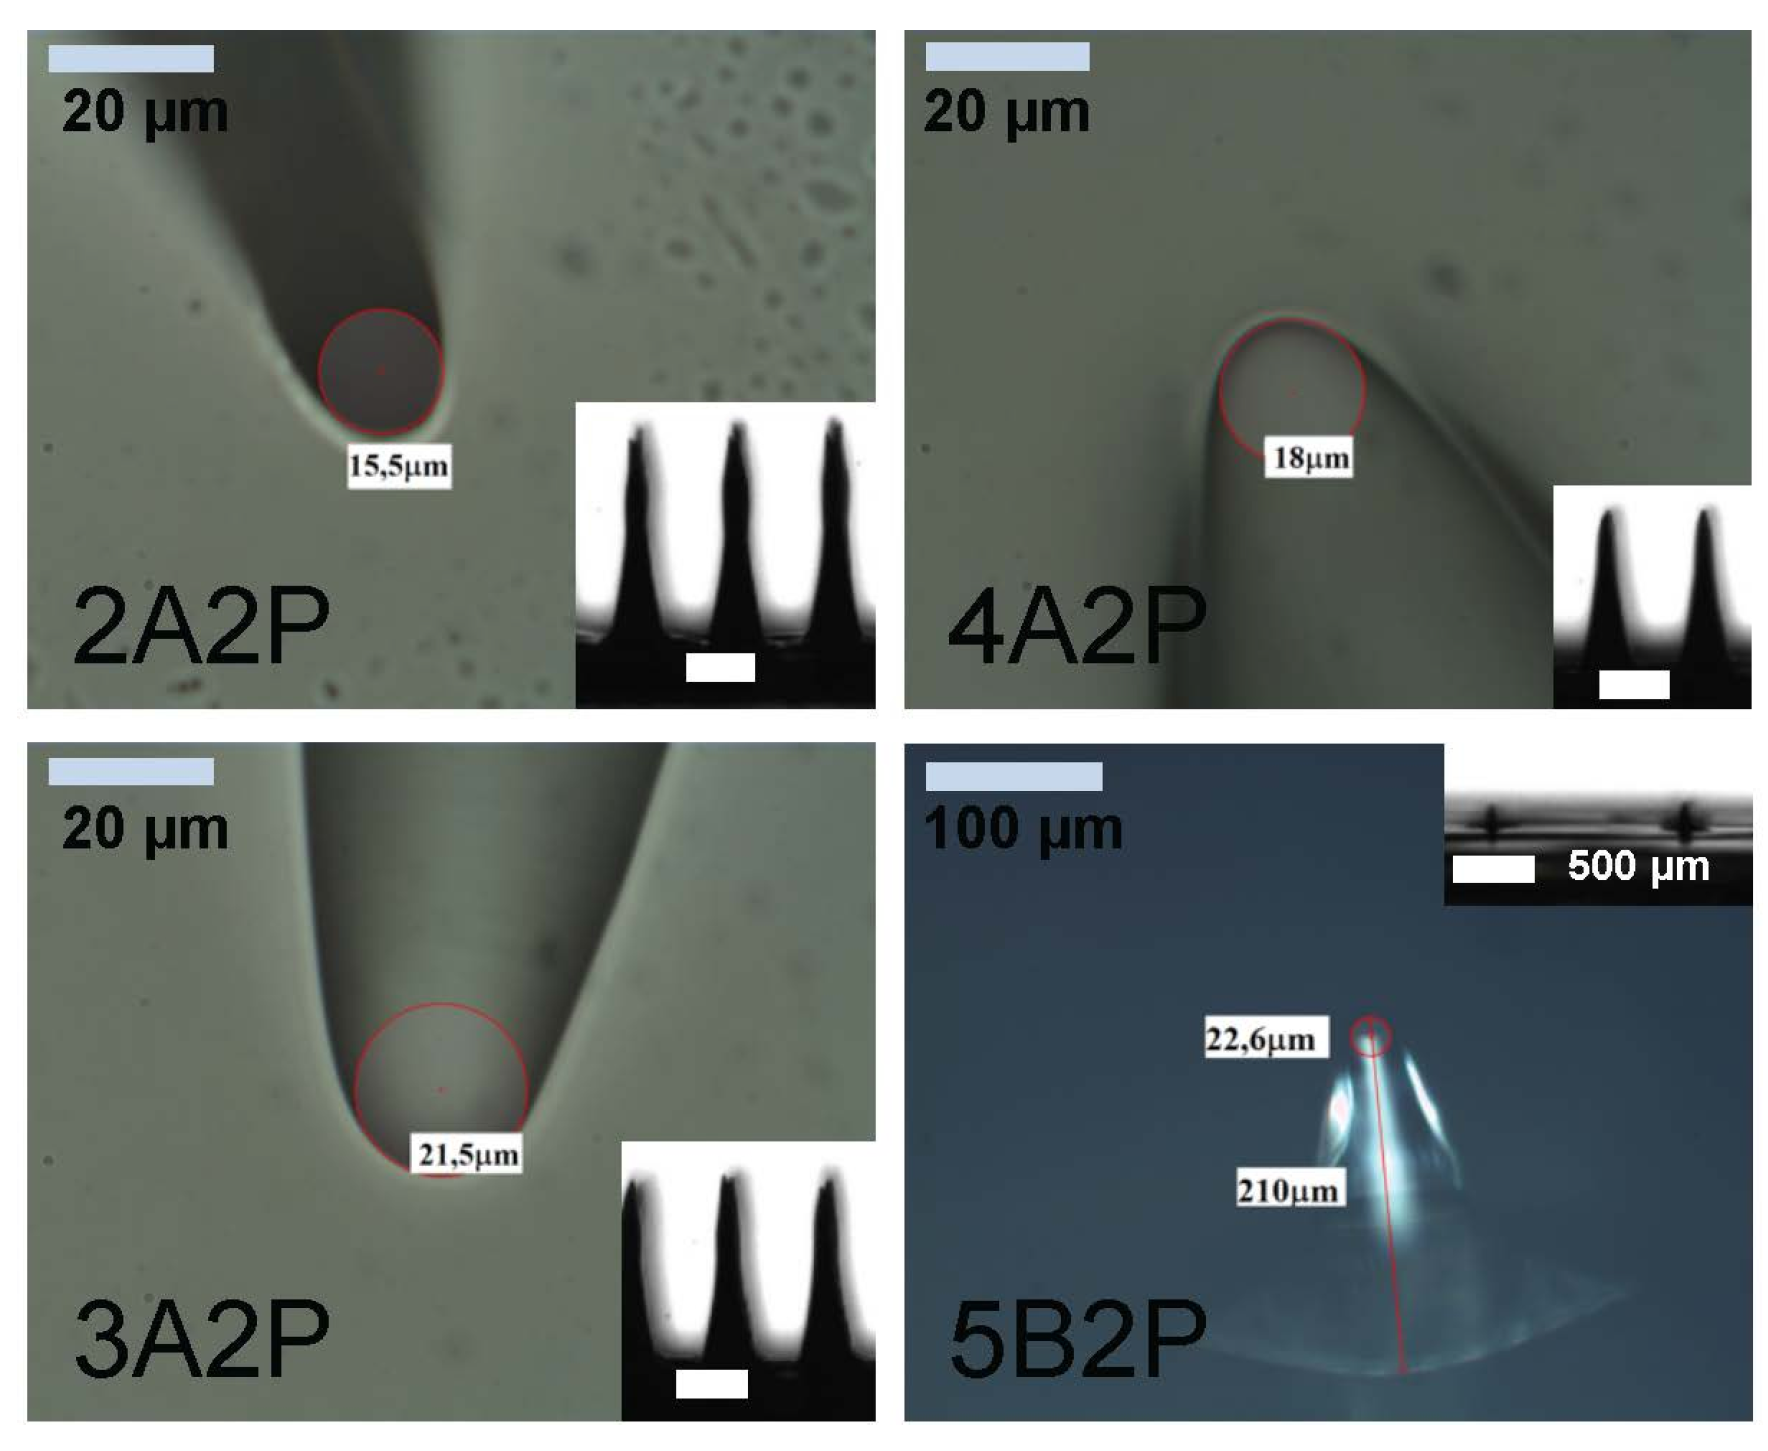
| Sample Name | Power Radiation (mW/cm2) | Array Type | Exposure Time (s) | Height (μm) | Diameter (μm) |
|---|---|---|---|---|---|
| 1A2P | 18 | A | 7.5 | 1450 | 4 |
| 2A2P | 15 | A | 7.5 | 1450 | 15.5 |
| 3A2P | 12 | A | 7.5 | 1180 | 21.5 |
| 4A2P | 9 | A | 7.5 | 940 | 18.0 |
| 5B2P | 9 | B | 7.5 | 210 | 22.6 |


4. Conclusions
Acknowledgments
Author Contributions
Conflicts of Interest
References
- Ashraf, M.W.; Tayyaba, S.; Afzulpurkar, N. Micro electromechanical systems (MEMS) based microfluidic devices for biomedical applications. Int. J. Mol. Sci. 2011, 12, 3648–3704. [Google Scholar] [CrossRef] [PubMed]
- Pasut, G.; Veronese, F.M. Polymer-drug conjugation, recent achievements and general strategies. Progress Polym. Sci. 2007, 32, 933–961. [Google Scholar] [CrossRef]
- Henry, S.; Mcallister, D.V.; Allen, M.G.; Prausnitz, M.R. Microfabricated microneedles: A novel approach to transdermal drug delivery. J. Pharm. Sci. 1998, 87, 922–925. [Google Scholar] [CrossRef] [PubMed]
- Valdés-Ramíreza, G.; Windmiller, J.R.; Claussen, J.C.; Martinez, A.G.; Kuralay, F.; Zhou, M.; Zhou, N.; Polsky, R.; Miller, P.R.; Naravan, R.; et al. Multiplexed and switchable release of distinct fluids from microneedle platforms via conducting polymer nanoactuators for potential drug delivery. Sens. Actuators B 2012, 161, 1018–1024. [Google Scholar] [CrossRef] [PubMed]
- Mukerjee, E.V.; Collins, S.D.; Isseroff, R.R.; Smith, R.L. Microneedle array for transdermal biological fluid extraction and in situ analysis. Sens. Actuators A Phys. 2004, 114, 267–275. [Google Scholar] [CrossRef]
- Donnelly, R.F.; Morrow, D.I. J.; McCarron, P.A.; Woolfson, A.D.; Morrissey, A.; Juzenas, P.; Juzeniene, A.; Iani, A.; McCarthy, H.O.; Moan, J. Microneedle-mediated intradermal delivery of 5-aminolevulinic acid: Potential for enhanced topical photodynamic therapy. J. Controll. Release 2008, 129, 154–162. [Google Scholar] [CrossRef] [PubMed]
- Miller, P.R.; Skooga, S.A.; Edwards, T.L.; Lopez, D.M.; Wheeler, D.R.; Arango, D.C.; Xiao, X.; Brozik, S.M.; Wangc, J.; Polsky, R.; et al. Multiplexed microneedle-based biosensor array for characterization of metabolic acidosis. Talanta 2012, 88, 739–742. [Google Scholar] [CrossRef] [PubMed]
- Wilke, N.; Mulcahy, A.; Ye, S.R.; Morrissey, A. Process optimization and characterization of silicon microneedles fabricated by wet etch technology. Microelectron. J. 2005, 36, 650–656. [Google Scholar] [CrossRef]
- Tan, J.L.; Tien, J.; Pirone, D.M.; Gray, D.S.; Bhadriraju, K.; Chen, C.S. Cells lying on a bed of microneedles: An approachto isolate mechanical force. Proc. Natl. Acad. Sci. 2003, 100, 1484–1489. [Google Scholar] [CrossRef] [PubMed]
- Vecchione, R.; Coppola, S.; Esposito, E.; Casale, C.; Vespini, V.; Grilli, S.; Ferraro, P.; Netti, P.A. Electro-drawn drug-loaded biodegradable polymer microneedles as a viable route to hypodermic injection. Adv. Funct. Mater. 2014, 24, 3515–3523. [Google Scholar] [CrossRef]
- Sun, W.; Araci, Z.; Inayathullah, M.; Manickam, S.; Zhang, X.; Bruce, M.A.; Marinkovich, P.M.; Lane, A.T.; Milla, C.; Rajadas, J.; et al. Polyvinylpyrrolidone microneedles enable delivery of intact proteins for diagnostic and therapeutic applications. Acta Biomater. 2013, 9, 7767–7774. [Google Scholar] [CrossRef] [PubMed]
- Kim, M.Y.; Jung, B.; Park, J.H. Hydrogel swelling as a trigger to release biodegradable polymer microneedlesin skin. Biomaterials 2012, 33, 668–678. [Google Scholar] [CrossRef] [PubMed]
- McGrath, M.G.; Vucen, S.; Vrdoljak, A.; Kelly, A.; O’Mahony, C.; Crean, A.M.; Moore, A. Production of dissolvable microneedles using an atomised spray process: Effect of microneedle composition on skin penetration. Eur. J. Pharm. Biopharm. 2014, 86, 200–211. [Google Scholar] [CrossRef] [PubMed]
- Choi, C.K.; Lee, K.J.; Youn, Y.N.; Jang, E.H.; Kim, W.; Min, B.K.; Ryu, W.H. Spatially discrete thermal drawing of biodegradable microneedles for vasculardrug delivery. Eur. J. Pharm. Biopharm. 2013, 83, 224–233. [Google Scholar] [CrossRef] [PubMed]
- Mellott, M.B.; Searcy, K.; Pishko, M.V. Release of protein from highly cross-linked hydrogels of poly(ethylene glycol) diacrylate fabricated by UV polymerization. Biomaterials 2001, 22, 929–941. [Google Scholar] [CrossRef]
- Di Matteo, A.; Di Palma, V.; Bevilacqua, M.F.; Cimmino, A. Biosensor. U.S. Patent 13,929,654, 16 January 2014. [Google Scholar]
- Hahn, M.S. Patterning of PEG-based hydrogels—Engineering spatial complexity. Mater. Matters 2010, 5, 62–66. [Google Scholar]
- Politi, J.; Spadavecchia, J.; Iodice, M.; de Stefano, L. Oligopeptide-heavy metal interaction monitoring by hybrid gold nanoparticle based assay. Analyst 2015, 140, 149–155. [Google Scholar] [CrossRef] [PubMed]
- Nada, A.M.A.; Dawy, M.; Salama, A.H. Dielectric properties and ac-conductivity of cellulose polyethylene glycol blends. Mater. Chem. Phys. 2004, 84, 205–215. [Google Scholar] [CrossRef]
- Larrañeta, E.; Moore, J.; Vicente-Pérez, E.M.; González-Vázquez, P.; Lutton, R.; Woolfson, A.D.; Donnelly, R.F. A proposed model membrane and test method for microneedle insertion studies. Int. J. Pharm. 2014, 472, 65–73. [Google Scholar] [CrossRef] [PubMed]
- Mack, C. Fundamental Principles of Optical Lithography: The Science of Microfabrication; John Wiley & Sons: Hoboken, NJ, USA, 2008. [Google Scholar]
- Kochhar, J.S.; Goh, W.J.; Chan, S.Y.; Kang, L. A simple method of microneedle array fabrication for transdermal drug delivery. Drug Dev. Ind. Pharm. 2013, 39, 299–309. [Google Scholar] [CrossRef] [PubMed]
- Dutta, J. Synthesis and characterization of γ-irradiated PVA/PEG/CaCl2 hydrogel for wound dressing. Am. J. Chem. 2012, 2, 6–11. [Google Scholar] [CrossRef]
- Revzin, A.; Tompkins, R.G.; Toner, M. Surface engineering with poly(ethylene glycol) photolithography to create high-density cell arrays on glass. Langmuir 2003, 19, 9855–9862. [Google Scholar] [CrossRef]
- Liu, Y.; Liu, Y.; Matharu, Z.; Rahimian, A.; Revzin, A. Detecting multiple cell-secreted cytokines from the same aptamer-functionalized electrode. Biosens. Bioelectron. 2015, 64, 43–50. [Google Scholar] [CrossRef] [PubMed]
- Chaudhri, B.P.; Ceyssens, F.; de Moor, P.; Hoof, C.V.; Puers, R. A high aspect ratio SU-8 fabrication technique for hollow microneedles for transdermal drug delivery and blood extraction. J. Micromech. Microeng. 2010, 20, 1–6. [Google Scholar] [CrossRef]
- Yoshida, K.; Lewinsky, I.; Nielsen, M.; Hylleberg, M. Implantation mechanics of tungsten microneedles into peripheral nerve truks. Med. Biol. Eng. Comput. 2007, 45, 413–420. [Google Scholar] [CrossRef] [PubMed]
- Yang, S.Y.; O’Cearbhaill, E.D.; Sisk, G.C.; Park, K.M.; Cho, W.K.; Villiger, M.; Bouma, B.E.; Pomahac, B.; Karp, J.M. A bio-inspired swellable microneedle adhesive for mechanical interlocking with tissue. Nat. Commun. 2013, 4, 1–10. [Google Scholar] [CrossRef] [PubMed]
- Browning, M.B.; Cereceres, S.N.; Luong, P.T.; Cosgriff-Hernandez, E.M. Determination of the in vivo degradation mechanism of PEGDA hydrogels. J. Biomed. Mater. Res. Part A 2014, 102A, 4244–4251. [Google Scholar]
© 2015 by the authors; licensee MDPI, Basel, Switzerland. This article is an open access article distributed under the terms and conditions of the Creative Commons by Attribution (CC-BY) license (http://creativecommons.org/licenses/by/4.0/).
Share and Cite
Dardano, P.; Caliò, A.; Di Palma, V.; Bevilacqua, M.F.; Di Matteo, A.; De Stefano, L. A Photolithographic Approach to Polymeric Microneedles Array Fabrication. Materials 2015, 8, 8661-8673. https://doi.org/10.3390/ma8125484
Dardano P, Caliò A, Di Palma V, Bevilacqua MF, Di Matteo A, De Stefano L. A Photolithographic Approach to Polymeric Microneedles Array Fabrication. Materials. 2015; 8(12):8661-8673. https://doi.org/10.3390/ma8125484
Chicago/Turabian StyleDardano, Principia, Alessandro Caliò, Vincenza Di Palma, Maria Fortuna Bevilacqua, Andrea Di Matteo, and Luca De Stefano. 2015. "A Photolithographic Approach to Polymeric Microneedles Array Fabrication" Materials 8, no. 12: 8661-8673. https://doi.org/10.3390/ma8125484
APA StyleDardano, P., Caliò, A., Di Palma, V., Bevilacqua, M. F., Di Matteo, A., & De Stefano, L. (2015). A Photolithographic Approach to Polymeric Microneedles Array Fabrication. Materials, 8(12), 8661-8673. https://doi.org/10.3390/ma8125484