3.1. Orthogonal Array of Pitting Geometry
Using orthogonal array testing, we can maximize the test coverage while minimizing the number of test cases to consider [
43,
44]. The experimental arrangement can be optimized by adopting appropriate arrays for different variables and levels. By using range analysis and variance analysis, the influence of every variable on experimental results can be described quantitatively. In this study, the orthogonal array L
9(3
4) was used for experimental arrangement and data analysis. The experimental runs with four parameters are operated using Orthogonality Experiment Assistant, a statistical software which incorporates a L
9(3
4) orthogonal array table. The software determines nine significant experimental runs instead of 81 runs in the case of 4 variables, with 3 levels each (3
4 = 81) [
45]. The selected physical variables are the pit shape, corrosion mass loss ratio, and pit depth. In order to estimate the "accidental error" occurring in the experiment, the variable of last column is usually adopted as blank, denoted as "error". The experimental levels are shown in
Table 5.
The ductile fracture process of corroded reinforcement is as follows. Local plastic deformation develops along the pit, which causes a stress redistribution. The re-distributed stresses will affect the overall stress in the specimen, which can generate plastic deformation in other places. This could cause a necking and/or fracture with dimple cleavage in the weak place of the specimen. Obviously, the fracture of corroded reinforcement originates the excessive plastic deformation in pitting. Therefore, the maximum equivalent plastic strain (denoted as PEEQ in ABAQUS) is adopted as the index for this numerical simulation.
Table 5.
Variables and levels for orthogonal test.
Table 5.
Variables and levels for orthogonal test.
| Level | Variables |
|---|
| (A) Pit Shape | (B) Corrosion Mass Loss Ratio(S)/% | (C) Pit Depth/mm | (D) Error |
|---|
| (a) | Spherical | 1.0 | 1.0 | - |
| (b) | Ellipsoidal | 1.5 | 1.5 | - |
| (c) | Triangular pyramid | 2.0 | 2.0 | - |
3.2. Finite Element Model
Finite element analysis (FEA) was carried out using ABAQUS/Standard implicit solver and the models used are shown in
Figure 7. The overall length of the specimen is 50 mm. The pit was assumed as spherical pit, ellipsoidal pit, and triangular pyramid pit, the size of which was determined based on three parameters: the size of the surface, the depth of the pit, and the volume of the pit. Owing to the existence of pits, the model was partitioned into three parts in order to generate different mesh grid. The two end regions of the model were meshed by using an eight-node brick element with reduced integration (C3D8R). The middle part of the model with pits was meshed by using a 10-node quadratic tetrahedral element (C3D10). A fine mesh was used in the middle part of the model in order to achieve accurate results. The boundary conditions employed are as follows: one end of the cylinder was assumed to be fully fixed and the other end was subjected to a tensile force. The applied displacement was 8.5 mm. The material used is classical metal plasticity and the related stress-strain data used are shown in
Figure 8. The number of element used in each model was 9831, 13201, 12831, 18361, 22437, 16500, 29765 and 27830, respectively. These were based on the trials to achieve good accuracy but without increasing extra computational efforts.
Figure 7.
Finite element models: (a) FEA model of corroded reinforcement with circular pits; (b) FEA model of corroded reinforcement with ellipsoidal pits; (c) FEA model of corroded reinforcement with triangular pyramid pits.
Figure 7.
Finite element models: (a) FEA model of corroded reinforcement with circular pits; (b) FEA model of corroded reinforcement with ellipsoidal pits; (c) FEA model of corroded reinforcement with triangular pyramid pits.
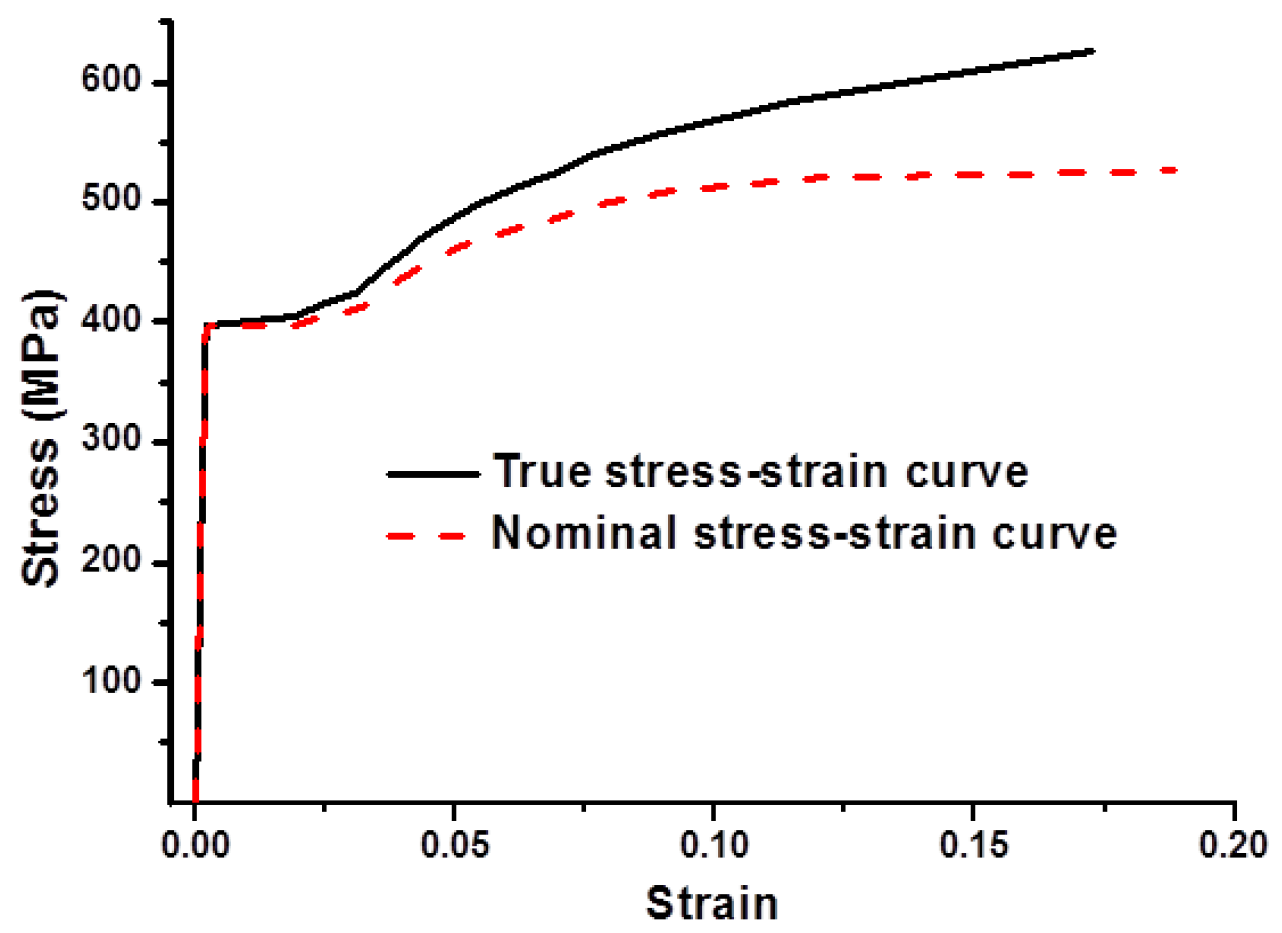
Figure 8.
Stress-strain curves of uncorroded reinforcing bar.
Figure 8.
Stress-strain curves of uncorroded reinforcing bar.
When using ABAQUS for elastic-plastic analysis, the modeling of materials nonlinearity requires the definition of a true stress-strain relationship for isotropic metals [
46]. Therefore, the nominal stress-strain relation should be converted to the true stress-strain relation. The transformation formula is shown in Equation (2):
where ε
true is the true strain, σ
true is the true stress, ε
nom is the nominal strain, and σ
nom is the nominal stress.
Tensile testing was conducted for the uncorroded reinforcement by using a servo-hydraulic testing machine. The detailed testing procedure is reported in a previous study [
47]. The nominal and true stress-strain curves of the uncorroded reinforcement are shown in
Figure 8, from which Young’s modulus and Poisson’s ratio were found to be
Es = 200 GPa and μ = 0.3.
3.3. Results and Discussion
The detailed conditions for FEA are shown in
Table 6. As is shown in
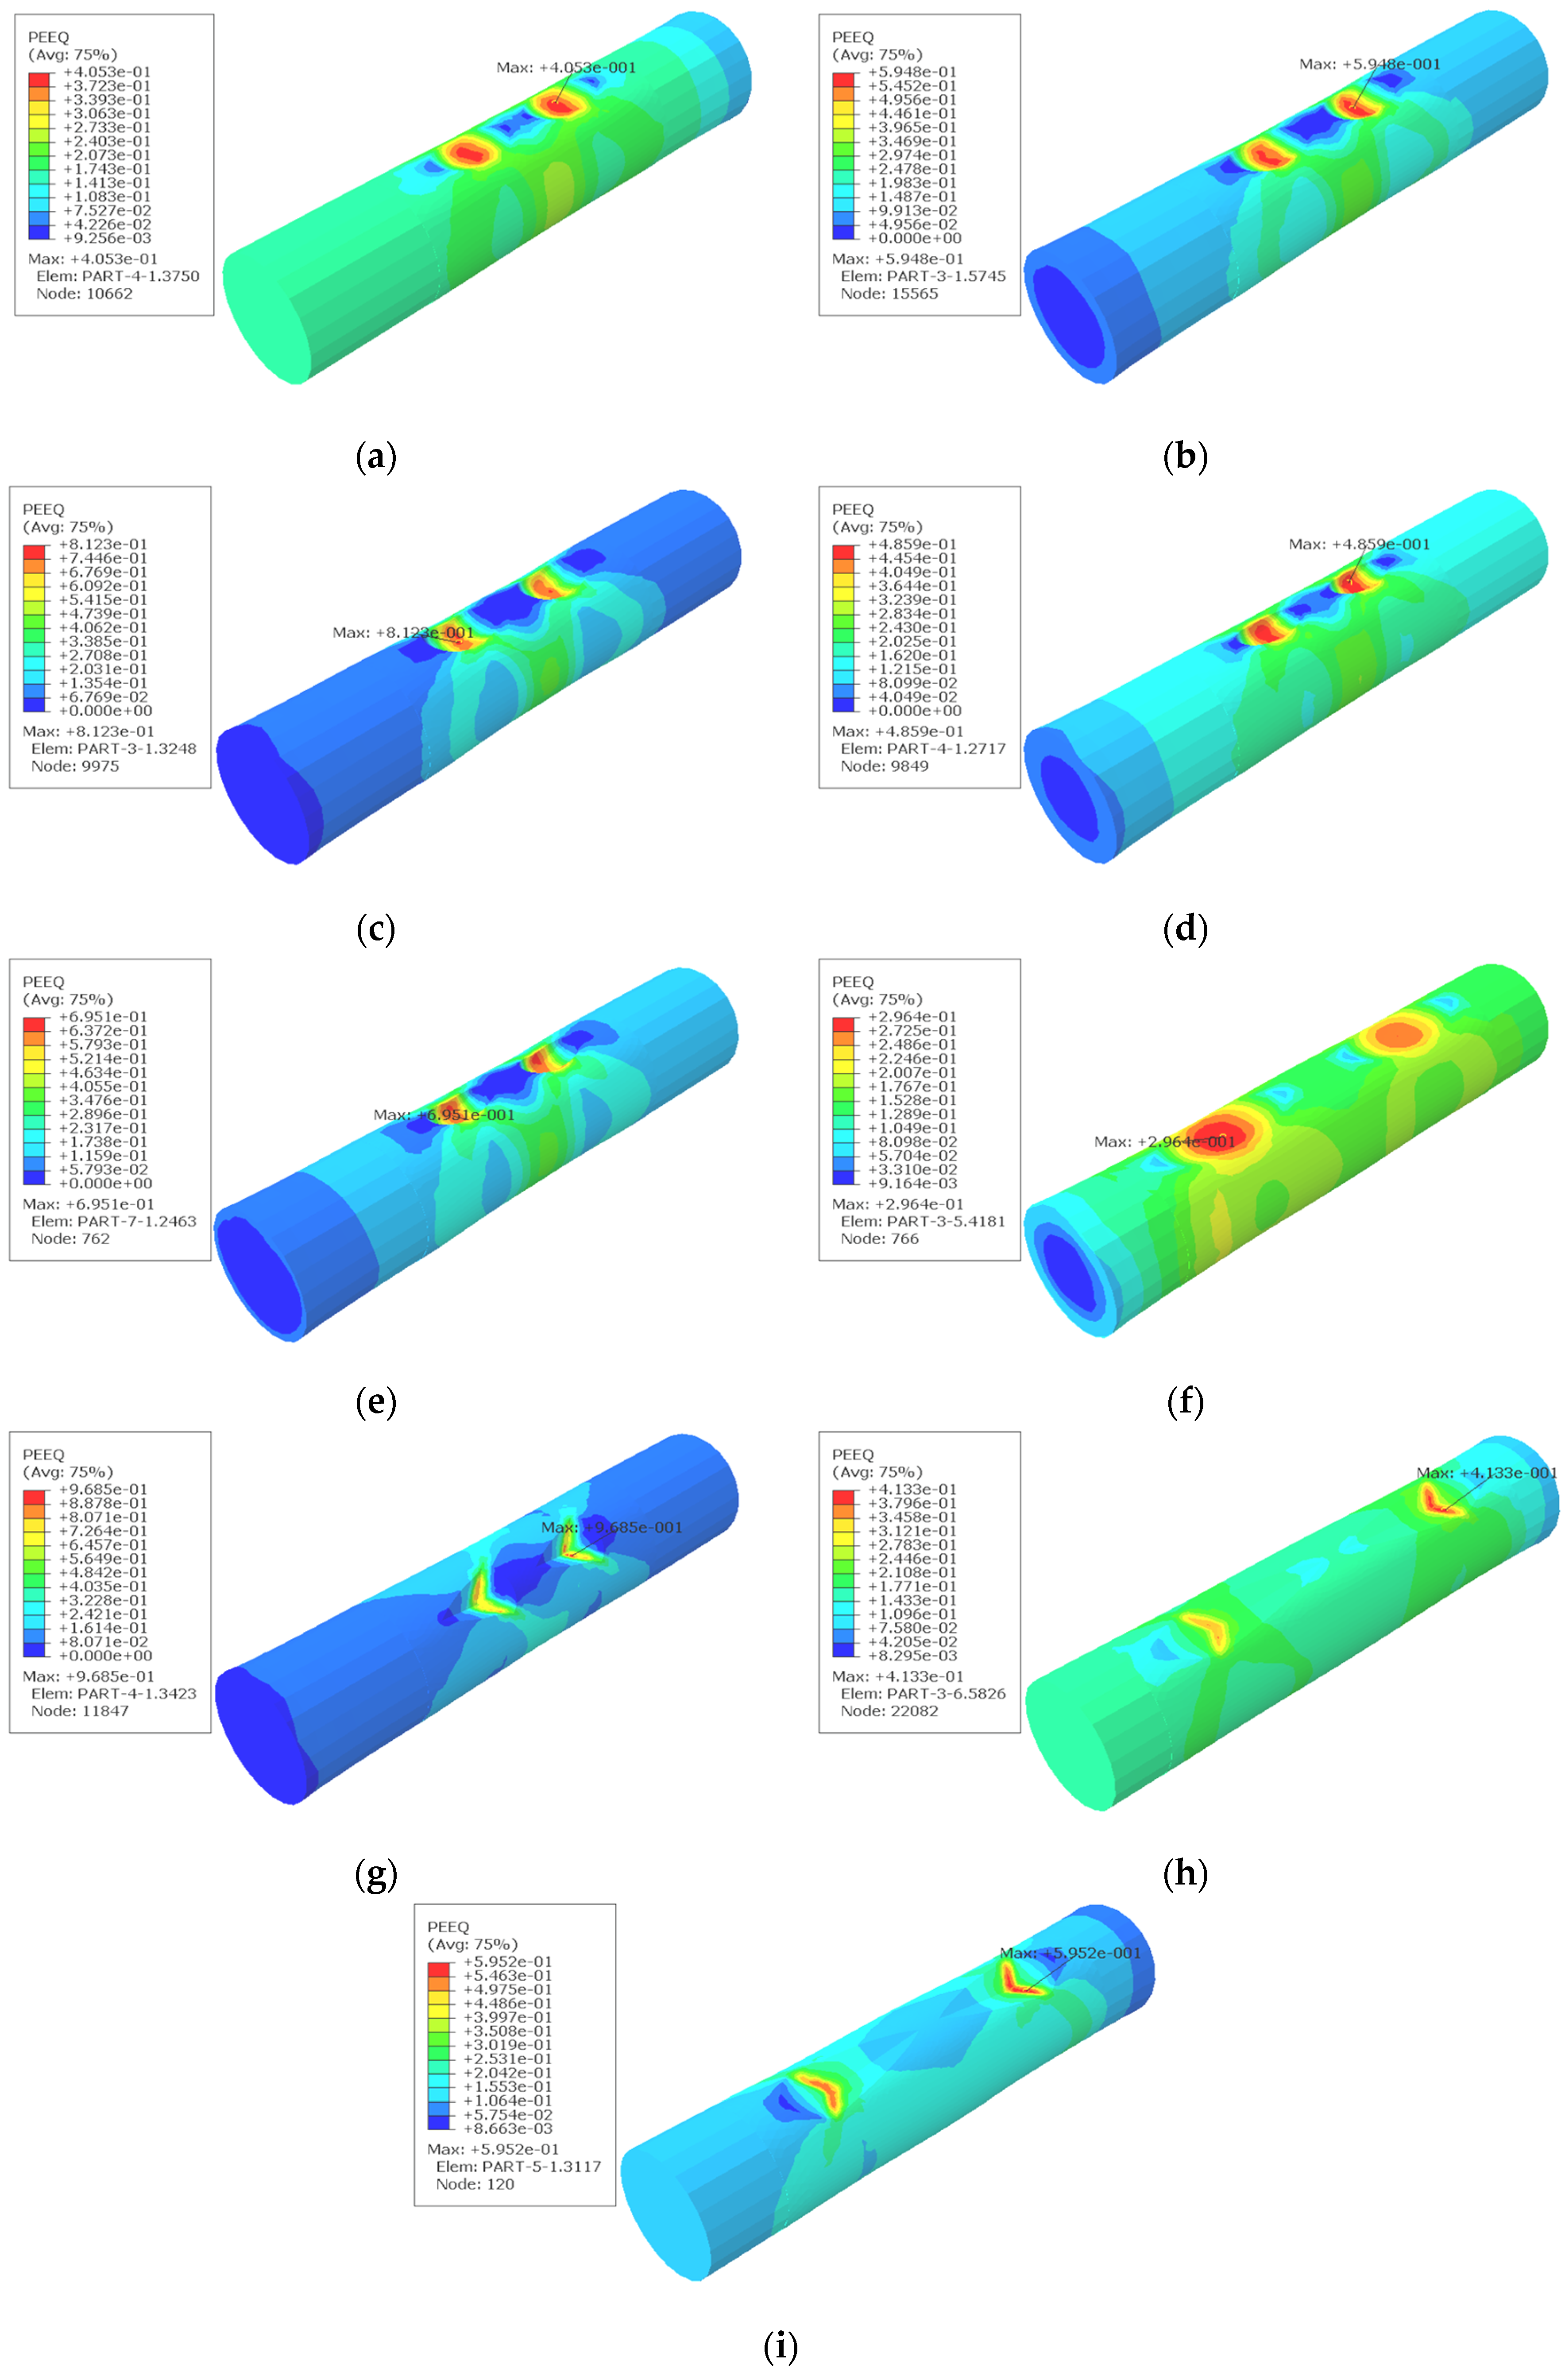
Figure 9, the existence of pits leads to stress concentration in the reinforcement, which causes to the deterioration of the plastic deformation of the reinforcement. The stress concentration around corrosion pits is obvious. As is expected, all of the maximum equivalent plastic strains (PEEQ) occur around the corrosion pits.
Table 6 and
Table 7 show the range analysis and variance analysis of the maximum equivalent plastic strain (PEEQ). In the range analysis of orthogonal test,
Ki is the average PEEQ for a certain variable at level
i, and by comparing to
Ki, the optimal level of variables can be confirmed. The definition of parameter
Y is
, and
Y scales the effect of variables on the result. A high
Y value of a certain variable means that this variable has a relatively strong effect on the result [
48,
49]. Obviously, the
Y value of column D (error) should be the minimum among the four columns, which means the experimental results are reliable. In the variance analysis, the
F-test is sensitive to non-normality and the related
F value is a key parameter in the
F-test statistic. If the obtained F value is equal to or larger than the critical F value, then the result is significant at that level of probability. In this case,
F0.05 = 6.94. Since
FPit shape and
FPit depth are all greater than 6.94, the results are significant at the 5% significance level. It is observed from the tables that the orders of influence of each variable are pit depth > pit shape > corrosion mass loss ratio > error. The two variables, pit depth and pit shape, are significant factors affecting the tensile behavior of reinforcement. The maximum equivalent plastic strain (PEEQ) increases remarkably with the increase of pit depth, which leads to the failure of corroded reinforcement under low loads. Since the
F value of corrosion mass loss ratio is less than the critical value (
F0.05), corrosion mass loss ratio is not a significant variable regarding the mechanical properties of reinforcement. Given the same amount of mass loss in reinforcement, localized corrosion appears to be the more dangerous damage type than uniform corrosion, owing to the localized and concentrated material deterioration, which causes local stress concentration and could lead to catastrophic failure of the material in that area.
Figure 9.
Results of equivalent plastic strains (PEEQ) obtained from FEA based on
Table 6: (
a) 1#; (
b) 2#; (
c) 3#; (
d) 4#; (
e) 5#; (
f) 6#; (
g) 7#; (
h) 8#; (
i) 9#.
Figure 9.
Results of equivalent plastic strains (PEEQ) obtained from FEA based on
Table 6: (
a) 1#; (
b) 2#; (
c) 3#; (
d) 4#; (
e) 5#; (
f) 6#; (
g) 7#; (
h) 8#; (
i) 9#.
Table 6.
Experimental arrangement and range analysis. PEEQ: Equivalent plastic strain.
Table 6.
Experimental arrangement and range analysis. PEEQ: Equivalent plastic strain.
| Experiment No. | (A) | (B) | (C) | (D) | Index |
|---|
| Pit Shape | S/% | Pit Depth/mm | Error | PEEQ |
|---|
| 1# | Spherical (a) | 1.0 (a) | 1.0 (a) | (a) | 0.4053 |
| 2# | Spherical (a) | 1.5 (b) | 1.5 (b) | (b) | 0.5948 |
| 3# | Spherical (a) | 2.0 (c) | 2.0 (c) | (c) | 0.8123 |
| 4# | Ellipsoidal (b) | 1.0 (a) | 1.5 (b) | (c) | 0.4859 |
| 5# | Ellipsoidal (b) | 1.5 (b) | 2.0 (c) | (a) | 0.6951 |
| 6# | Ellipsoidal (b) | 2.0 (c) | 1.0 (a) | (b) | 0.2964 |
| 7# | Triangular pyramid (c) | 1.0 (a) | 2.0 (c) | (b) | 0.9687 |
| 8# | Triangular pyramid (c) | 1.5 (b) | 1.0 (a) | (c) | 0.4133 |
| 9# | Triangular pyramid (c) | 2.0 (c) | 1.5 (b) | (a) | 0.5952 |
| Range Analysis | PEEQ | PEEQ | PEEQ | PEEQ | - |
| KI | 0.609 | 0.624 | 0.376 | 0.570 |
| KII | 0.492 | 0.568 | 0.559 | 0.620 |
| KIII | 0.659 | 0.568 | 0.825 | 0.571 |
| Y | 0.167 | 0.056 | 0.449 | 0.05 |
Table 7.
Analysis of variance.
Table 7.
Analysis of variance.
| Source | Index | Sum of Squares of Deviations | Degree of Freedom | F Value | Critical Value |
|---|
| pit shape | PEEQ | 0.044 | 2 | 8.00 ** | F0.05 = 6.94 |
| corrosion mass loss ratio (S) | PEEQ | 0.006 | 2 | 1.091 |
| pit depth | PEEQ | 0.306 | 2 | 55.636 ** |
Different pit shape also has an obvious influence on the mechanical properties of the corroded reinforcement. A growing corrosion pit will essentially be inducing a corresponding increase in stress and strain [
7]. Huang summarizes the stress concentration factor for different corrosion pit shape ratios. The stress concentration factor increases with the depth of the pit, and the stress tends to increase when the pit is more elongated in the direction normal to the applied load [
8].
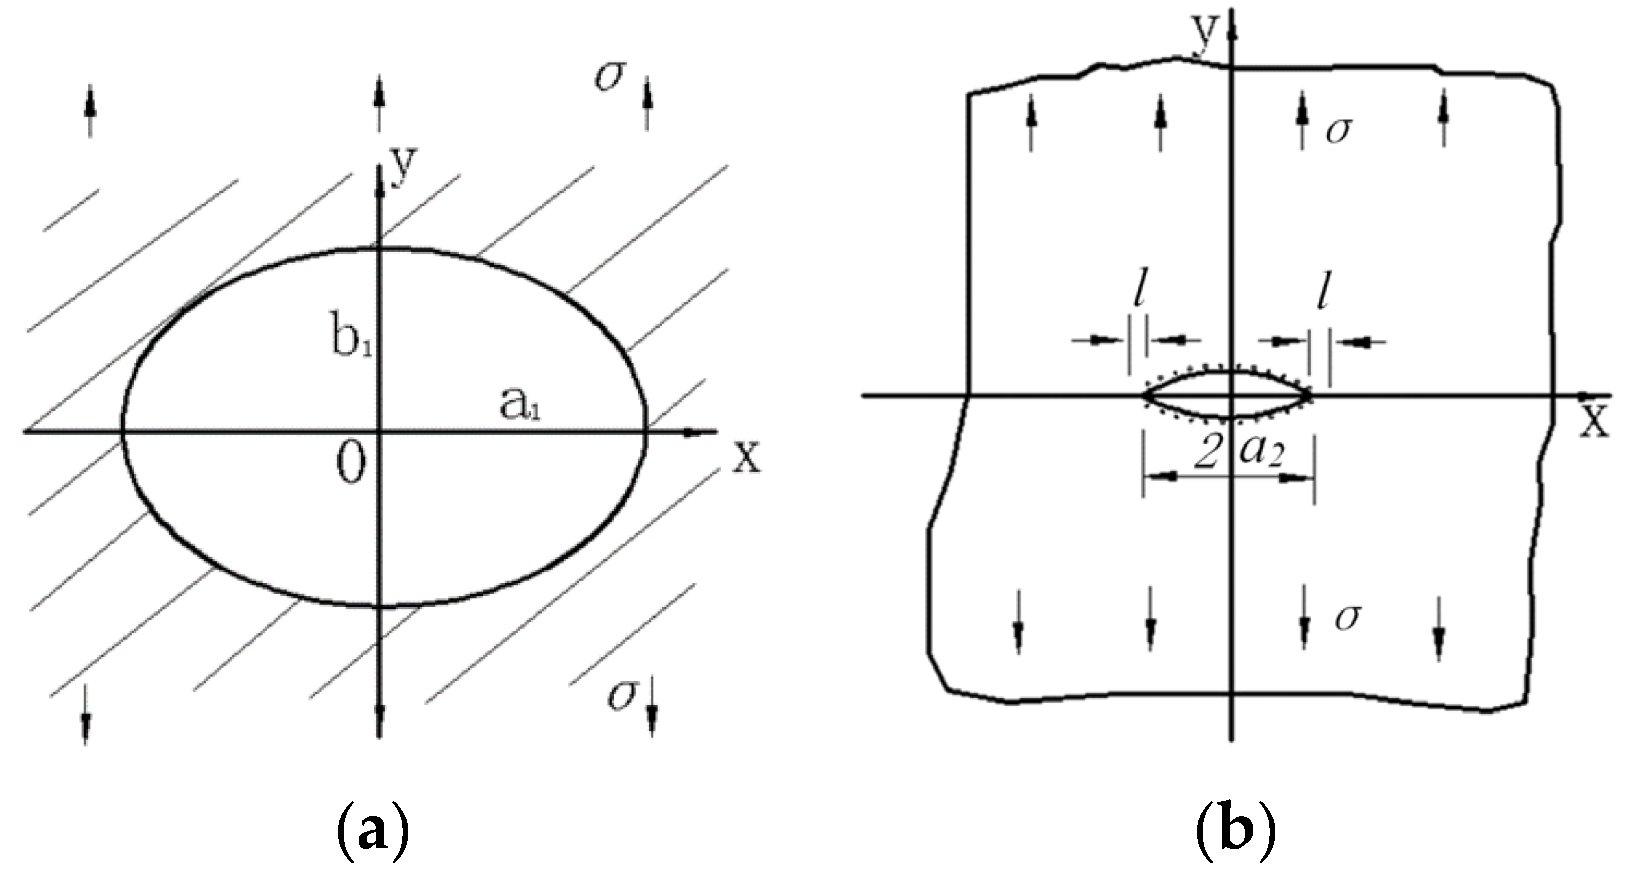
Figure 10 shows an ellipsoidal pit in a 2-dimensional infinite solid under far-field tensile forces [
50]. According to the results of Inglis on the stress concentration around an elliptical hole [
51], the stress distribution is described in Equation (3) and Equation (4). Based on three-dimensional reconstruction techniques, Azevedo [
52] calculated the stress concentration factor of corroded SAE 2205 duplex stainless steel samples with 3D pits. The results showed that 3D reconstruction data of pits is valid for the calculation of stress concentration factors using the Inglis equation. In this sense, the use of the data of 3D pits along with FEA might lead to interesting calculations of stress concentration factor in irregular pits.
Figure 10.
Elliptical hole defect of infinite-plate model: (a) Elliptical hole in infinite plate; (b) Crack propagation.
Figure 10.
Elliptical hole defect of infinite-plate model: (a) Elliptical hole in infinite plate; (b) Crack propagation.
when λ ≠ 1,
when λ = 1,
where σ
b is the largest stress concentration, σ is the macroscopic stress, λ =
b1/
a1, and ρ =
a1/
l,
a and
b are the major and minor axes, respectively.
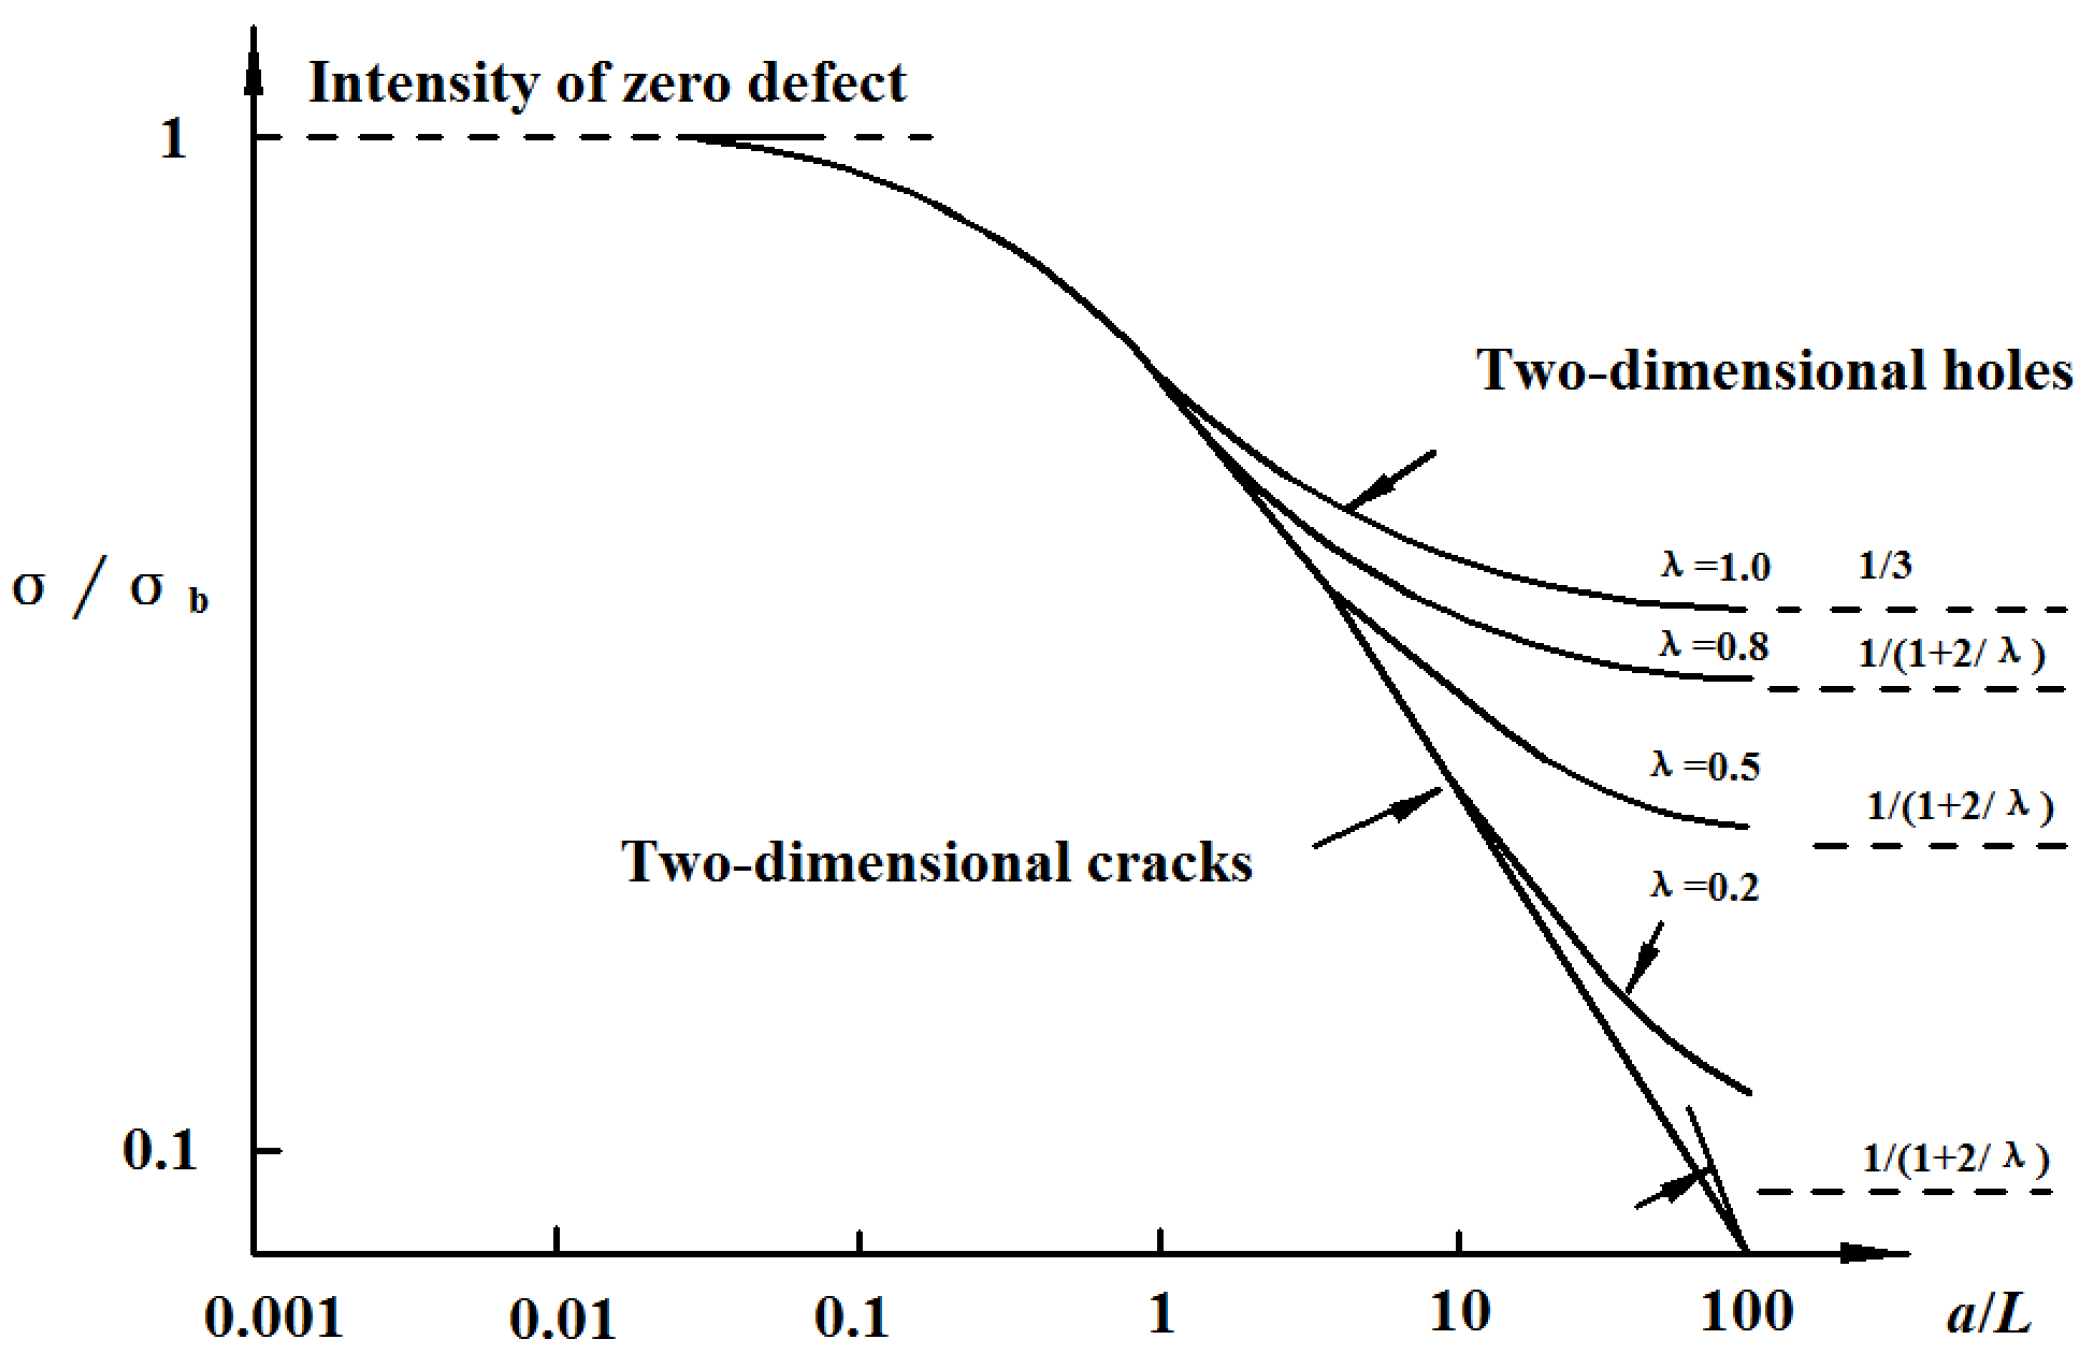
Figure 11 shows the relationship between defect size and failure strength [
50]. When λ = 1, an ellipsoidal hole reduces to a spherical hole and the strength of materials reaches its maximum. With the decrease of λ, an ellipsoidal hole gradually transits to a slender hole and the strength of materials decreases rapidly. It explains that a corrosion pit with a circle pattern has a blunt feature, which leads to less stress concentration. Obviously, a triangular pyramid-shaped pit is more irregular, which causes localized and concentrated material deterioration and leads to larger equivalent plastic strain.
Figure 11.
Influence of defect on failure stress.
Figure 11.
Influence of defect on failure stress.
To further discuss the effect of non-uniform corrosion on the mechanical properties of reinforcement, another FEA analysis was conducted. It is hard to establish different FEA models with identical corrosion mass loss ratios but with different pit distributions. Here, three models with different arithmetical mean deviations but with similar corrosion mass losses were constructed. The maximum difference of corrosion mass loss ratio is only 0.38%, as is shown in
Table 8.
Table 8.
Constructor parameters of corroded reinforcement.
Table 8.
Constructor parameters of corroded reinforcement.
| Code | Pit Shape | S/% | Ra of Quadrant Surface-1/μm | Ra of Quadrant Surface-2/μm | Ra of Quadrant Surface-3/μm | Ra of Quadrant Surface-4/μm | (Ra)ave/μm | (Ra)max/μm |
|---|
| Ra-1 | Spherical | 1.72 | 417 | 202 | 179 | 251 | 262 | 417 |
| Ra-2 | Spherical | 1.82 | 287 | 491 | 223 | 456 | 364 | 491 |
| Ra-3 | Spherical | 2.10 | 467 | 610 | 440 | 340 | 464 | 610 |
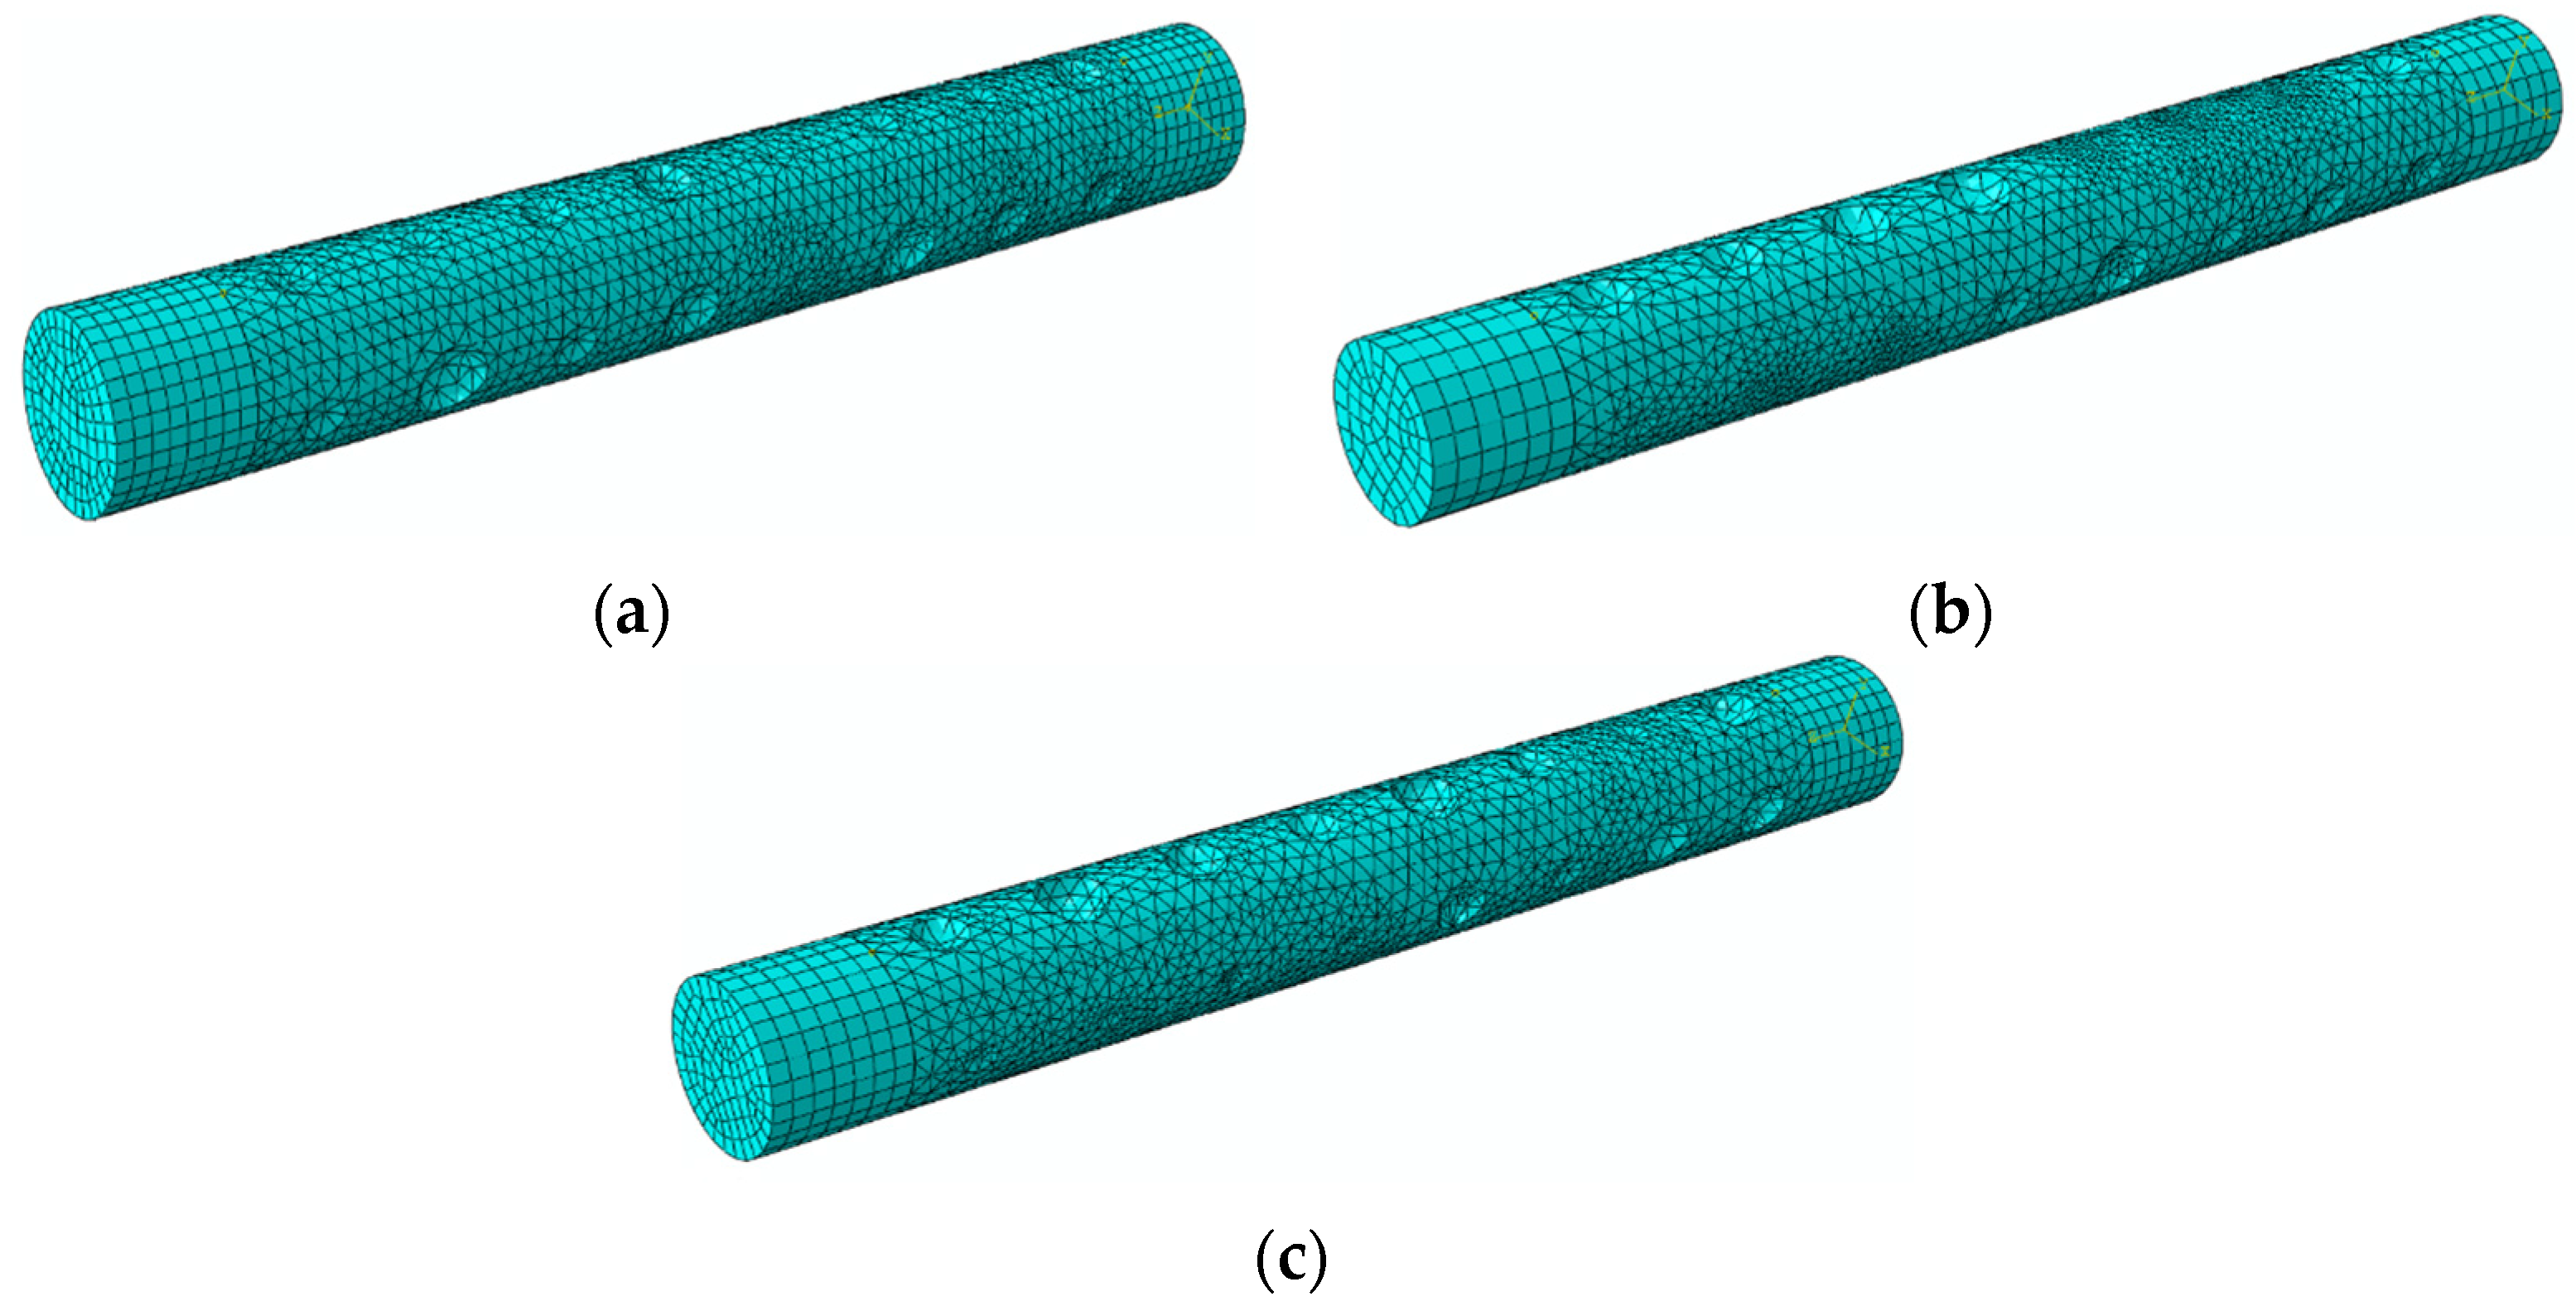
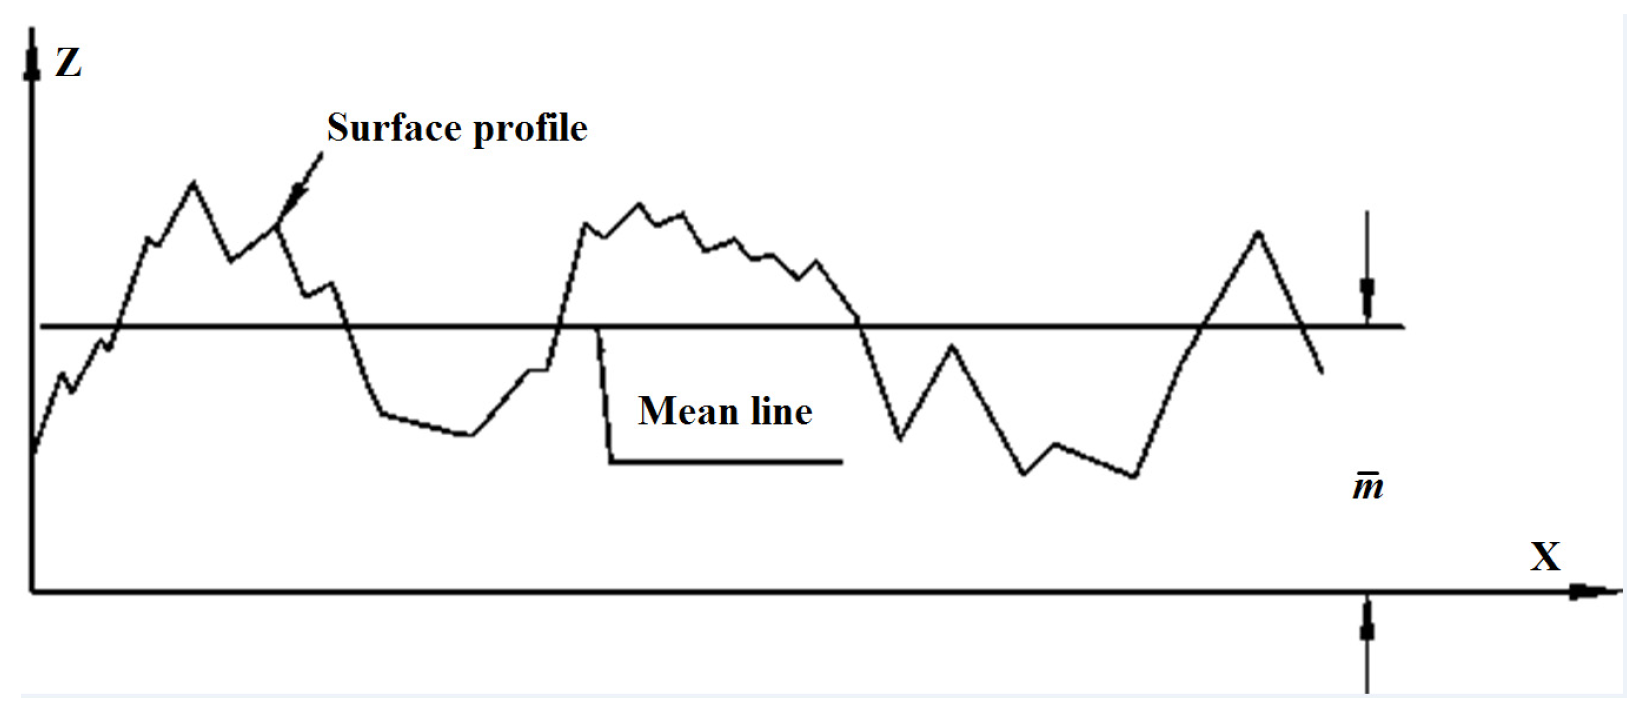
Figure 12 shows the finite element model with different pit distribution. The element type, mesh, boundary condition and constitution model are the same as those described in
Section 3.2. The overall length of the model is 100 mm. The spherical pits are distributed on the surface profiles at four lines along the axial direction, equally distributed on the reinforcement surface. Each surface has eight pits with different depth. By using Equation (1), the related arithmetical mean deviation (
Ra) was calculated, as is shown in
Table 8.
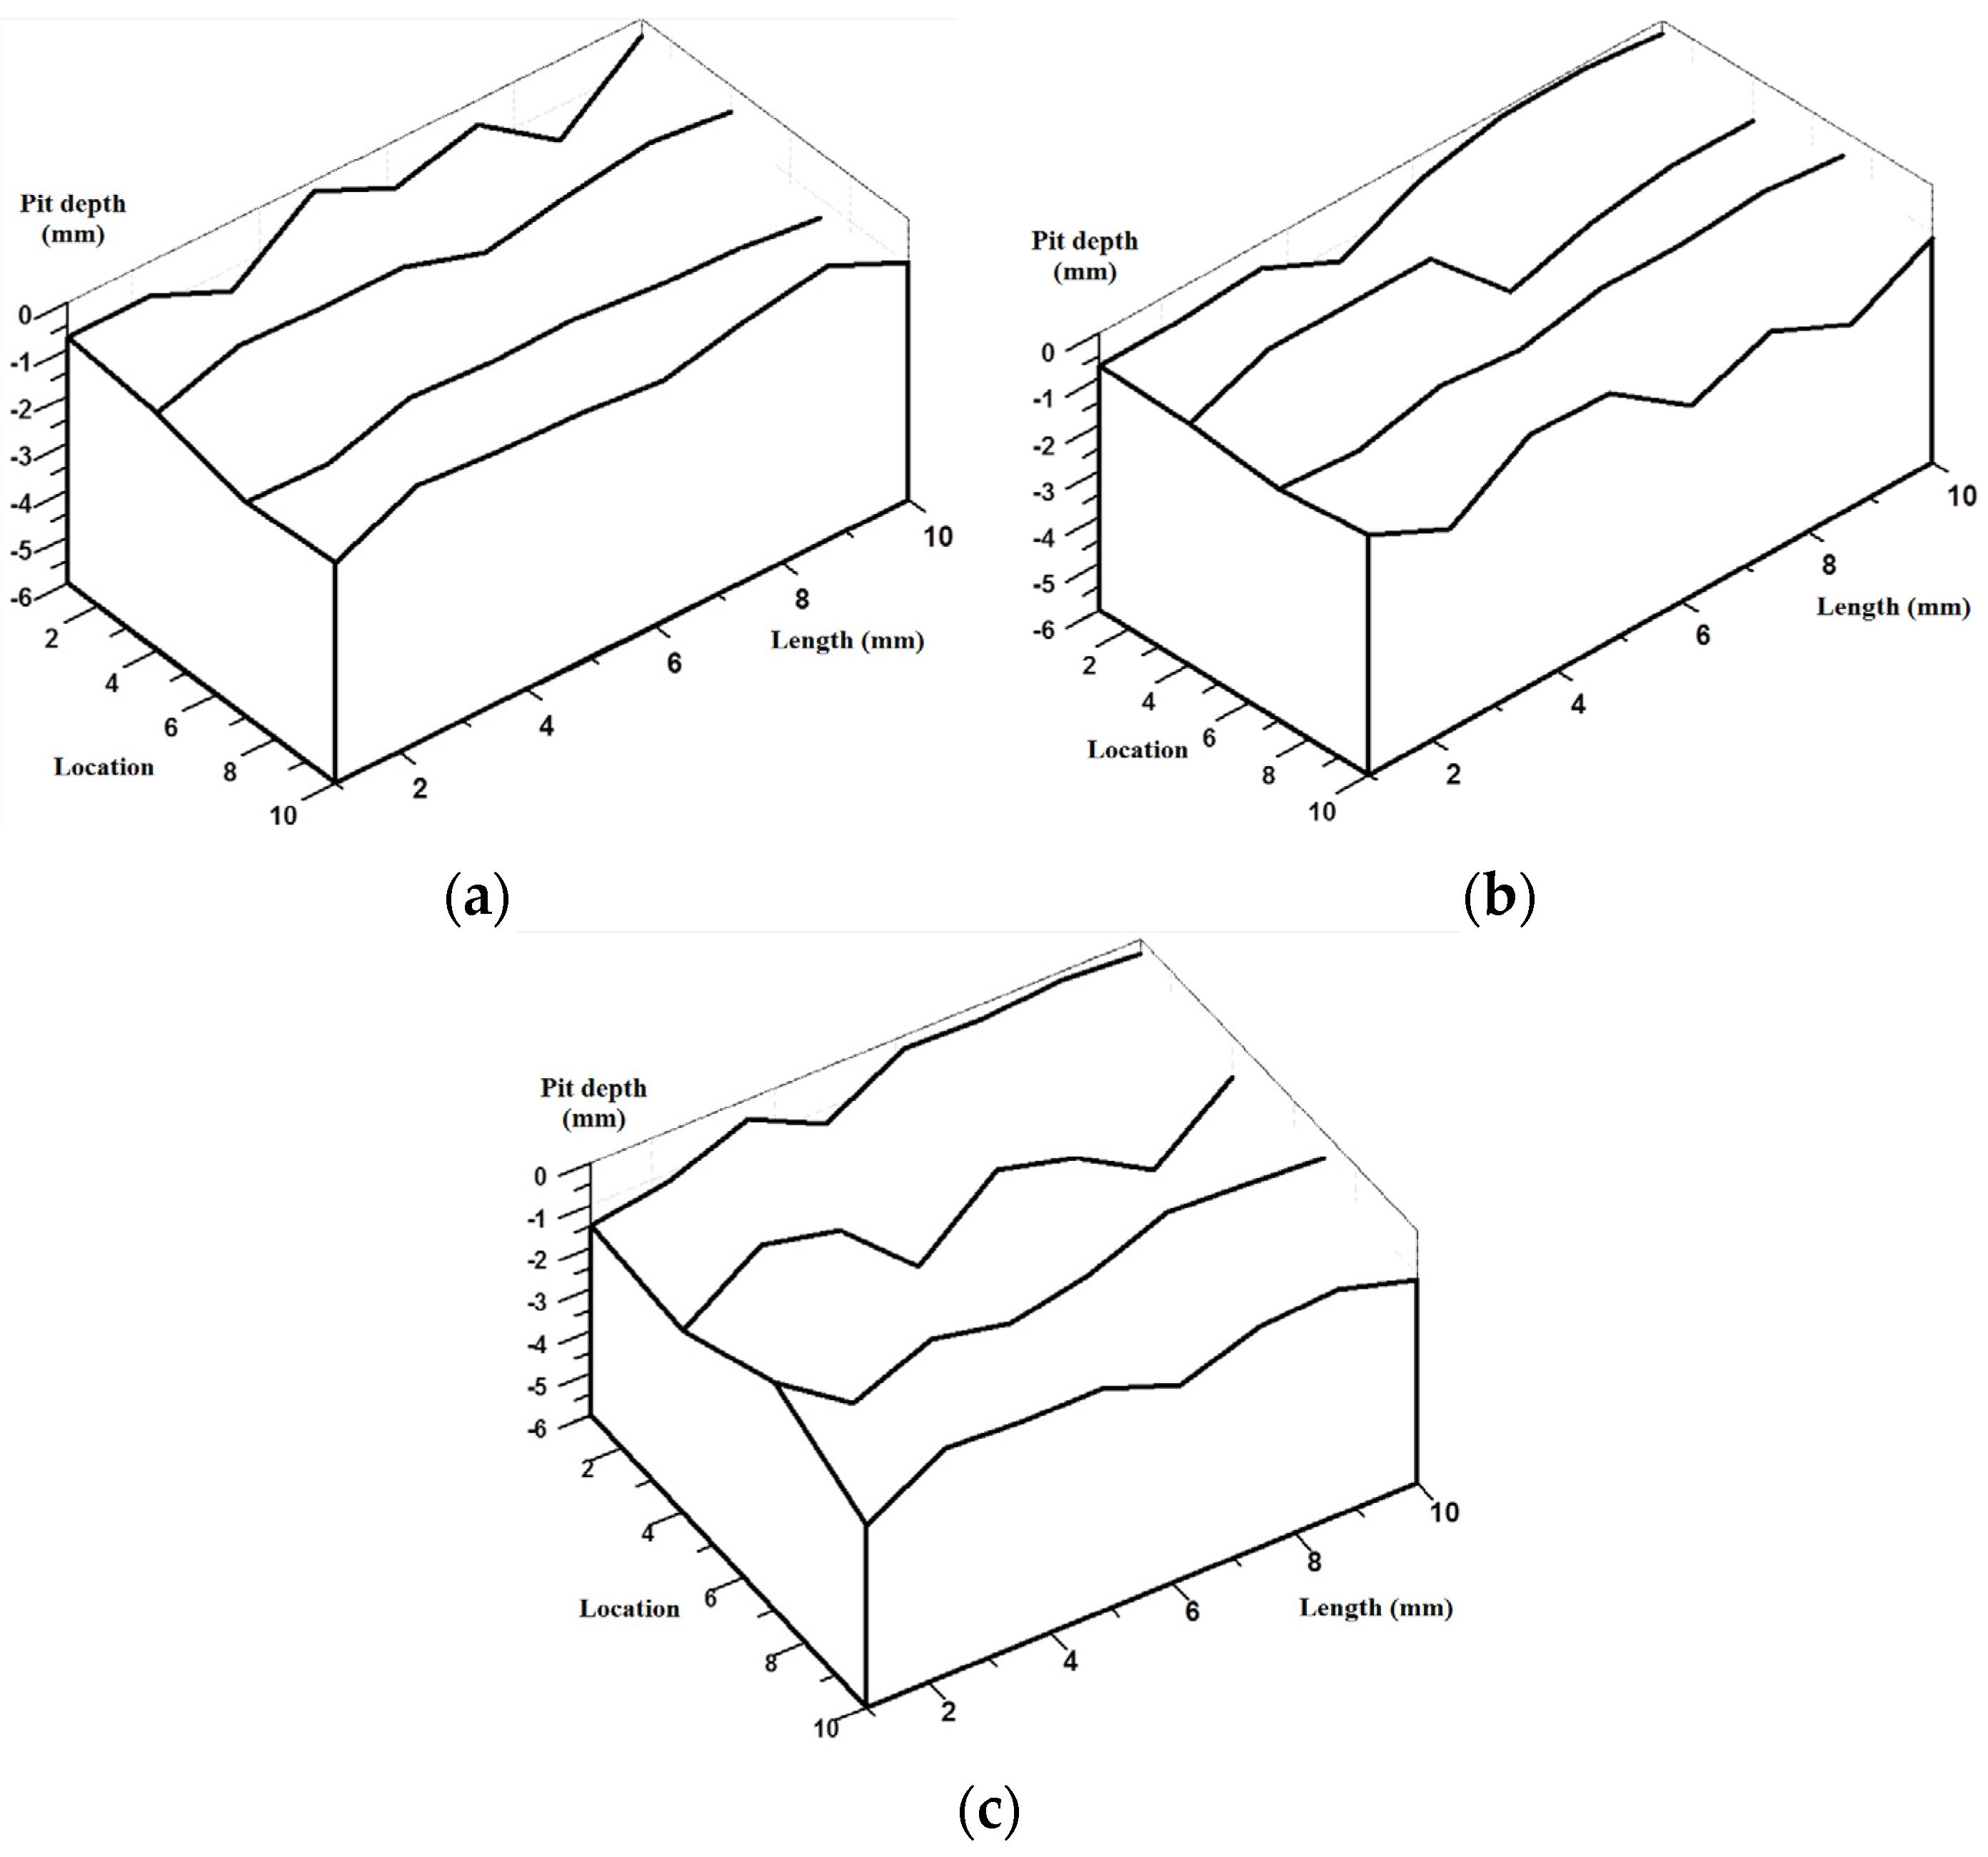
Figure 13 plots the related surface profile curves of the three FEA models. It can be seen from the figure that, although the corrosion mass loss ratios (
S) have no significant differences between the three models, the tortuosity of each curve is found to increase with increased arithmetical mean deviation (
Ra). This indicates that the non-uniform distribution of pit depth increases with surface roughness of reinforcement.
Figure 12.
FEA models with different pit distributions based on
Table 8: (
a)
Ra-1; (
b)
Ra-2; (
c)
Ra-3.
Figure 12.
FEA models with different pit distributions based on
Table 8: (
a)
Ra-1; (
b)
Ra-2; (
c)
Ra-3.
Figure 13.
Surface profile curves of finite element models based on
Table 8: (
a)
Ra-1; (
b)
Ra-2; (
c)
Ra-3.
Figure 13.
Surface profile curves of finite element models based on
Table 8: (
a)
Ra-1; (
b)
Ra-2; (
c)
Ra-3.
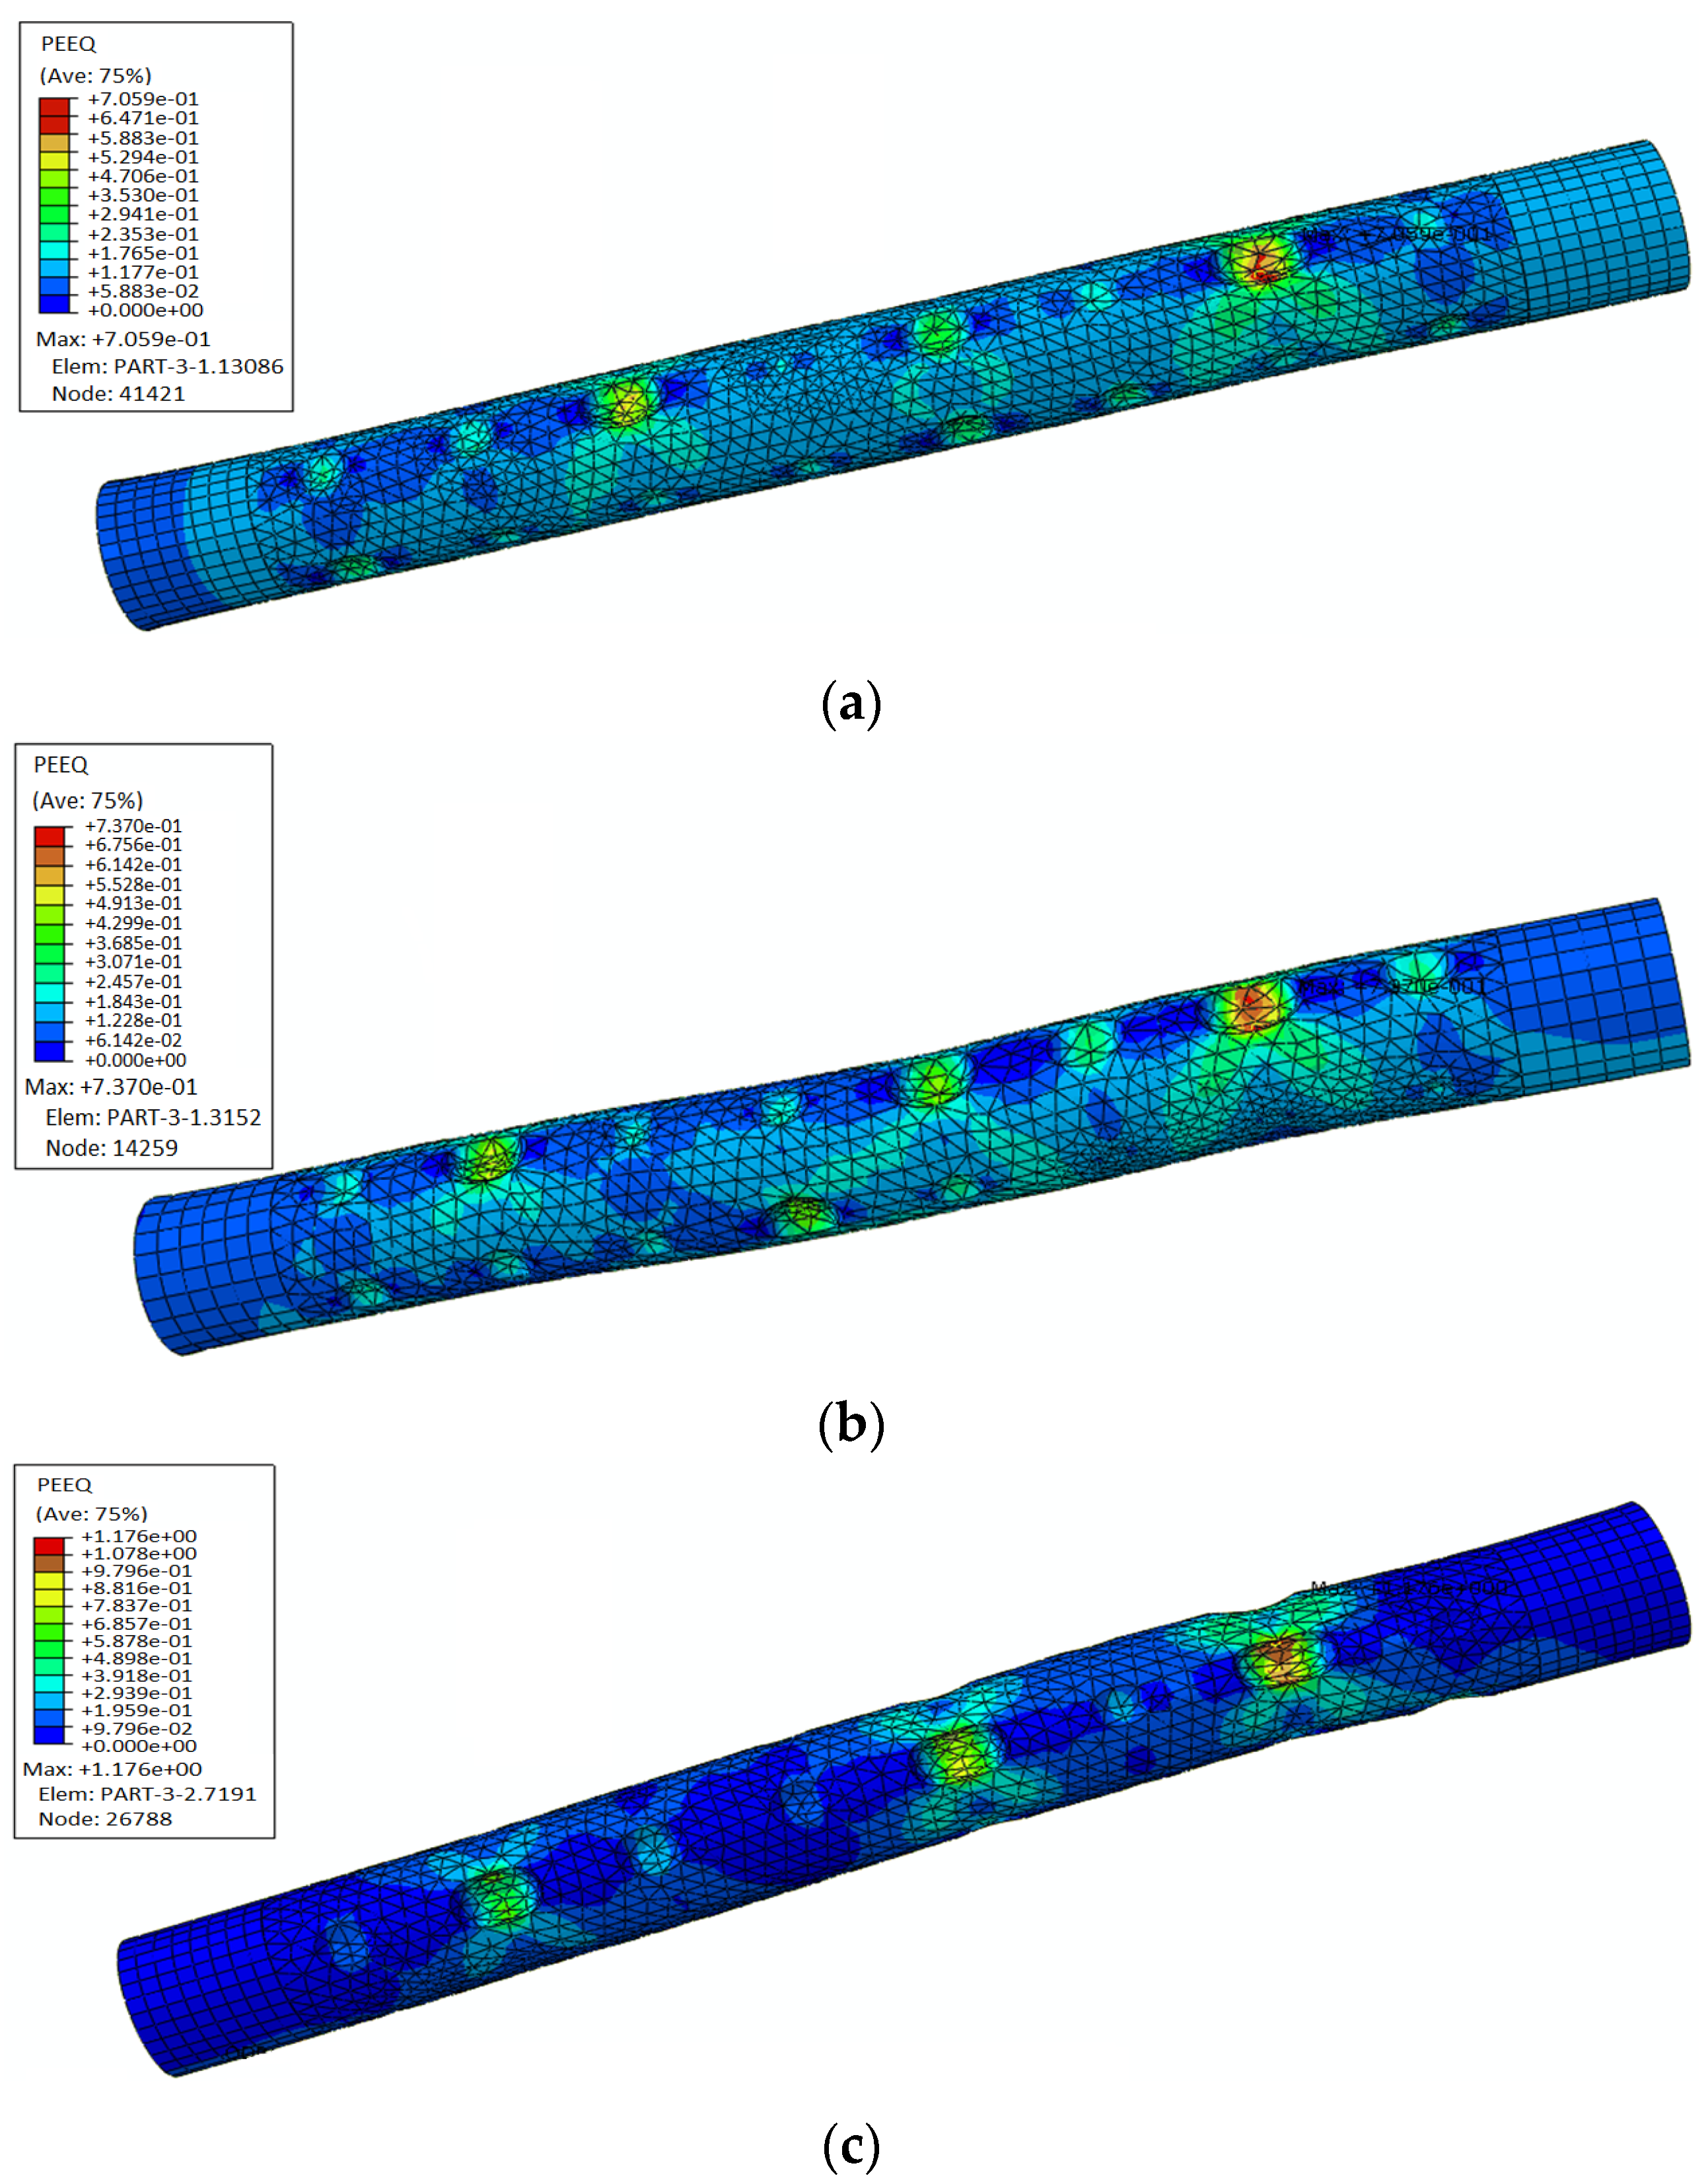
As is shown in
Figure 14 and
Figure 15, the non-uniform distribution of pits has a significant influence on the mechanical properties of the corroded reinforcement. In general, under the condition of similar corrosion mass loss ratios, the maximum equivalent plastic strain (PEEQ) of corroded reinforcement increases with the increase of
Ra. The maximum equivalent plastic strain (PEEQ) on
Ra-1 is 0.7059, hence 0.7059 increases up to 0.737 on
Ra-2. The increment is 4.4%. However, on
Ra-3 the PEEQ is 1.176; hence, compared to
Ra-1 is an increase of 66.5%, which is very substantial. As shown in
Table 8, the maximum arithmetical mean deviation (
Ra)
max on
Ra-1 is 417 μm, hence 417 μm increases up to 491 μm on
Ra-2. The increment is 74 μm. However, on
Ra-3 the (
Ra)
max is 610; hence, compared to
Ra-2, an increase of 119 μm. Therefore, the influence of maximum arithmetical mean deviation (
Ra)
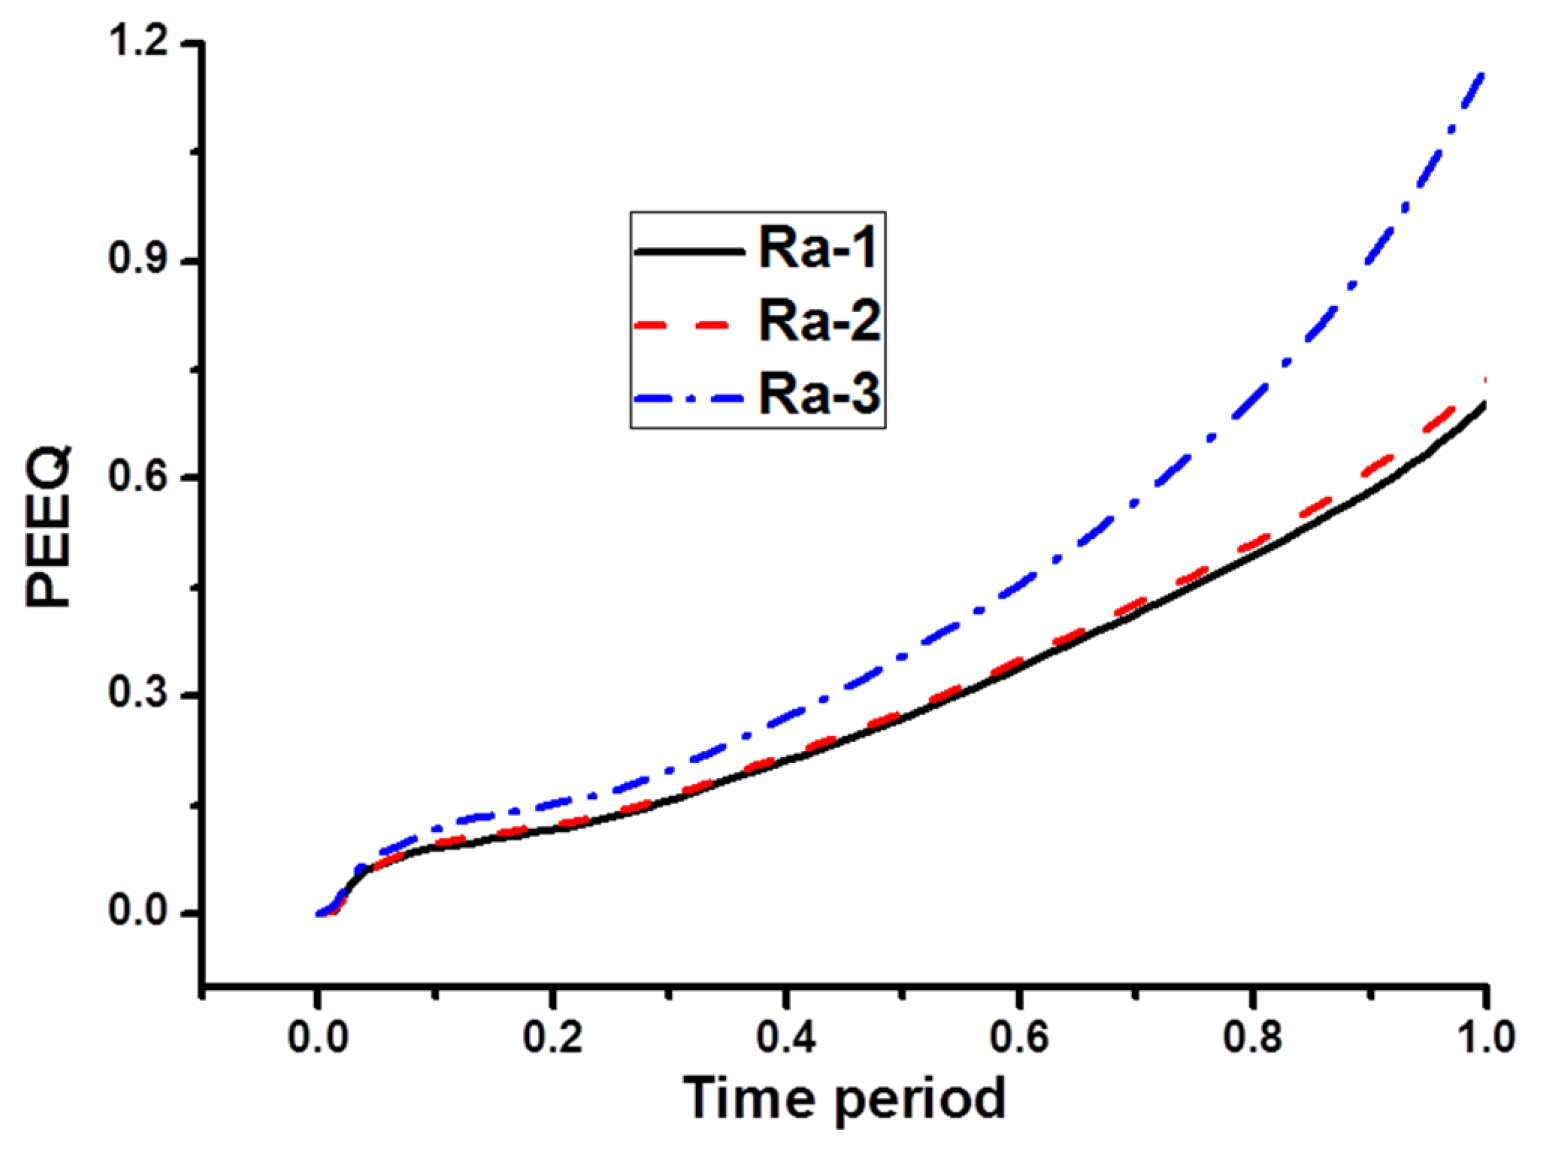
max may be the main reason for the rapid increment of PEEQ. The most disadvantageous location coincides with the pit with the maximum depth. The maximum equivalent plastic strain (PEEQ) increases generally with the increase of load time-history, which leads to the failure of corroded reinforcement under low loads.
Figure 14.
Results of finite element analysis based on
Table 8: (
a)
Ra-1; (
b)
Ra-2; (
c)
Ra-3.
Figure 14.
Results of finite element analysis based on
Table 8: (
a)
Ra-1; (
b)
Ra-2; (
c)
Ra-3.
Figure 15.
Load time-history of maximum equivalent plastic strain.
Figure 15.
Load time-history of maximum equivalent plastic strain.
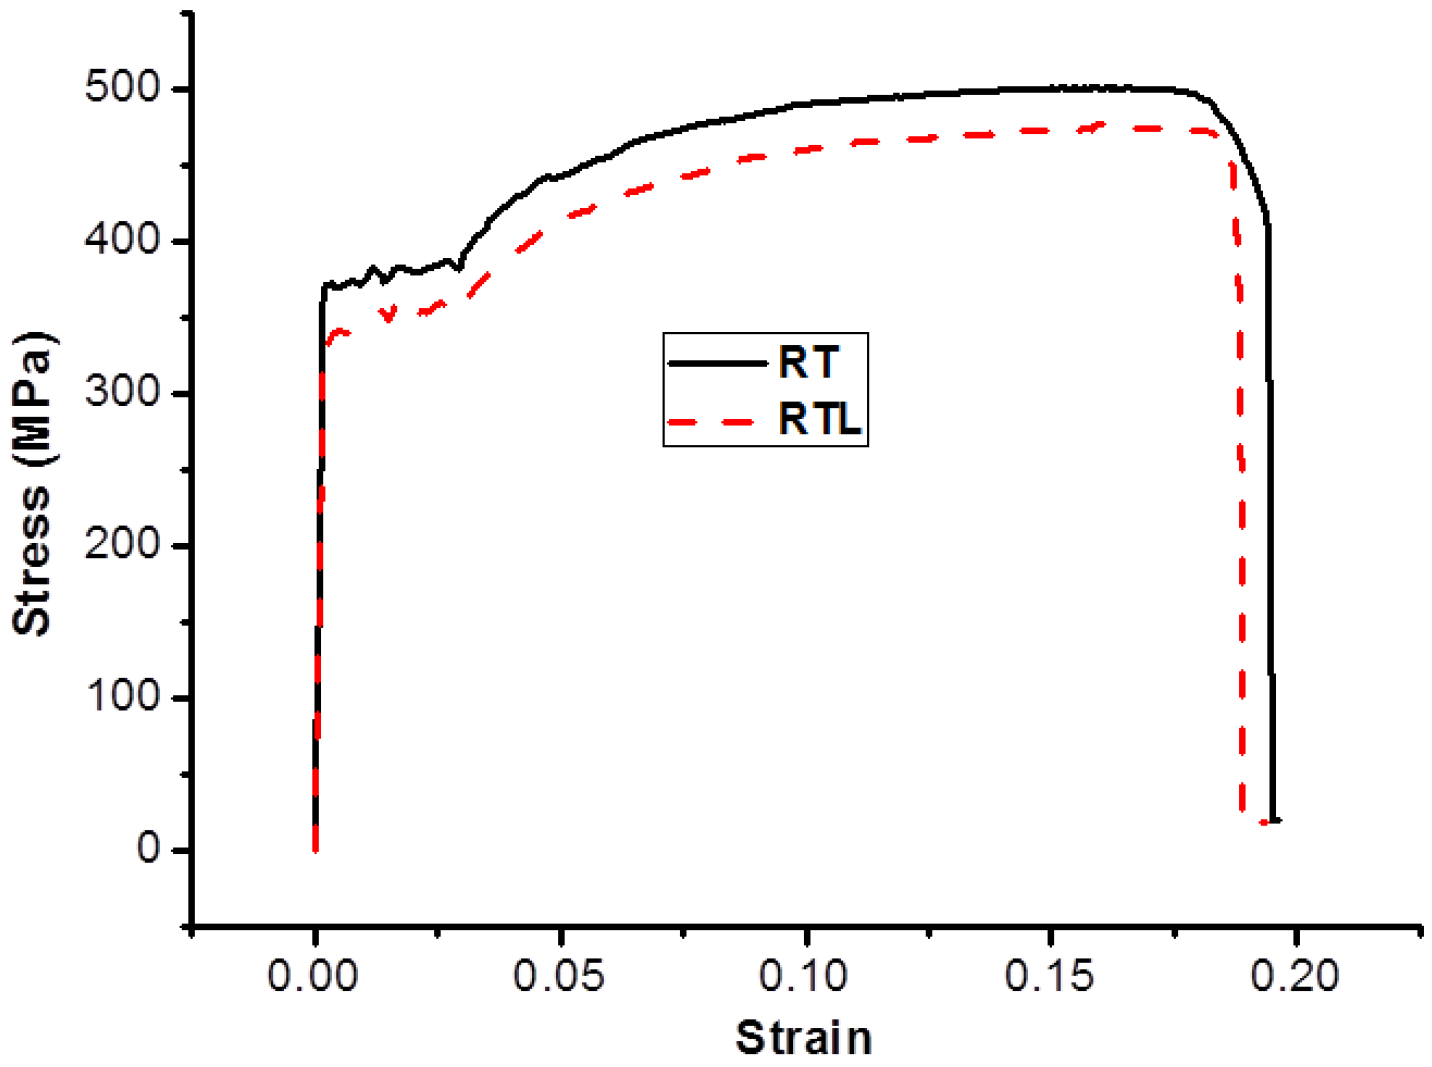
In order to verify the results of FEA, tensile tests of the two specimens, RT and RTL, was conducted.
Figure 16 shows the stress-strain curves of the two reinforcements. It is observed from the figure that there exists an obvious difference in the strength. Owing to the more complicated corrosion pitting morphology of reinforcement under the combined effects of carbonation and static loading, the mechanical properties of RTL are remarkably lower than those of the RT specimen. Since the two specimens have similar corrosion mass loss ratios, the results indicate that the yield strength and ultimate strength of RTL reached 340 and 470 MPa, at values of 92% and 94% of RT, respectively.
Figure 16.
Stress-strain curves of RT and RTL specimens.
Figure 16.
Stress-strain curves of RT and RTL specimens.


