1. Introduction
The development of eco-friendly composite concepts by employing raw materials from natural renewable sources is a strong driver in actual research on lightweight structures [
1]. Since a few years, a number of natural fibre reinforcements, in the form of fabric textiles or pre-preg assemblies, have made their way as commercial products, readily available to the composite industry for direct employment in traditional manufacturing processes as well. Even so, the use of such materials is still somewhat inhibited by a lack of knowledge or predictability of the mechanical behaviour of the bulk composite, especially with reference to accumulation of damage or other irreversible processes under both static and cyclic loading [
2].
Flax fibres are actually the leading choice among natural bast fibres, for their slightly superior structural performances, but also for their comparatively more competitive costs and weight [
1,
3,
4,
5]. The assembly of natural flax fibres into continuous reinforcements is essential for achieving adequate stiffness and strength for structural applications [
6]. The actual most common type of such long reinforcement consists of yarns of twisted fibres, usually assembled into woven fabrics or, in a few cases, even pre-preg tapes. The helical structure resulting from yarn spinning provides only a quasi-unidirectional alignment of elementary fibres, with the twisting angle usually ranging between 5 and 20 degrees [
4,
7]. If such twisting angle is too low, the dry yarn might end up having poor tensile strength, hampering its processability [
6]. A high twist angle would instead results in an excessive off-axis orientation reducing the mechanical performances of the final composite [
6,
7].
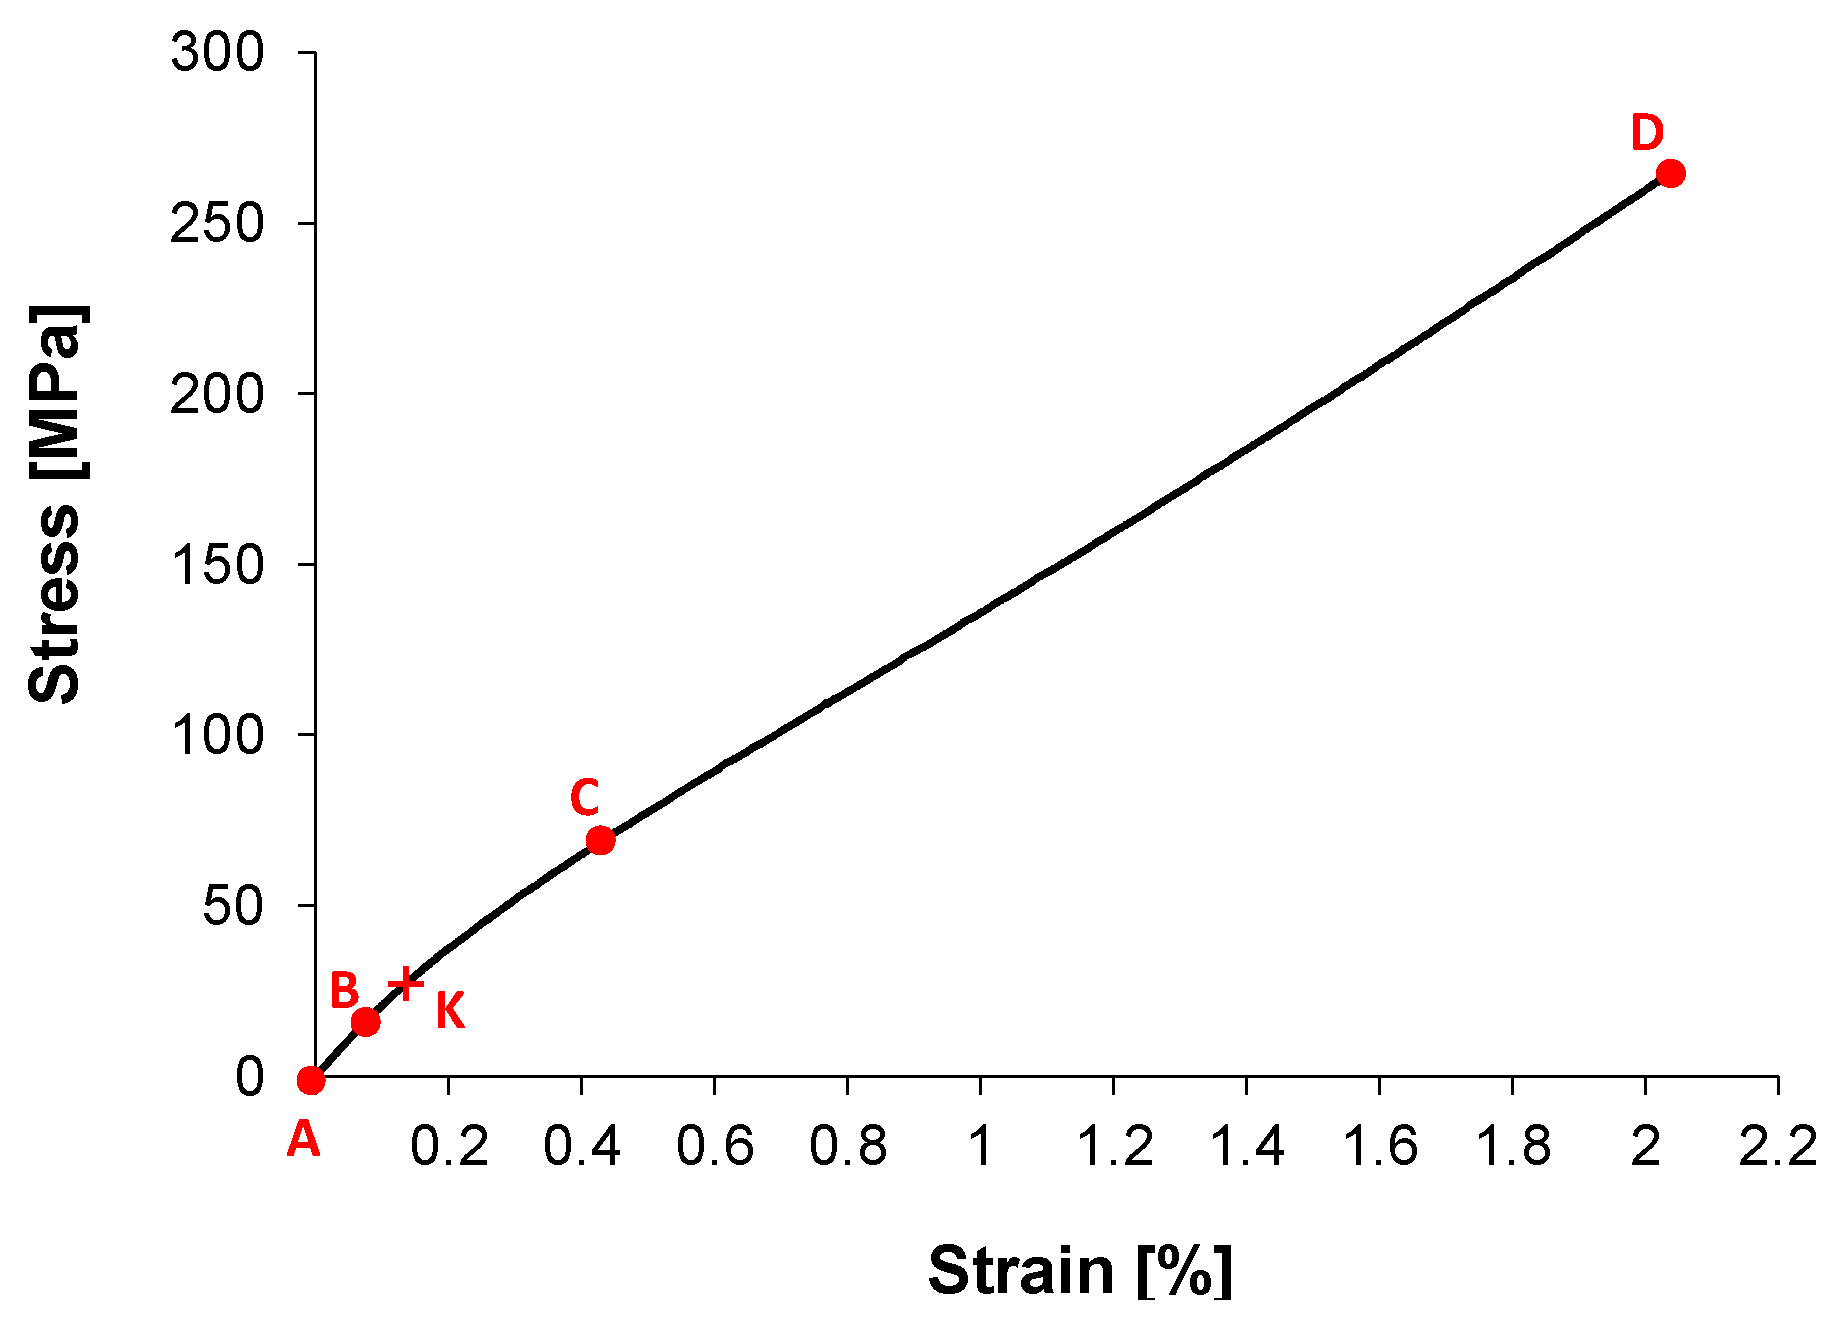
In order to assess the final macroscopic reinforcing effect, tensile samples from unidirectional (UD) composites are then primarily tested along the reinforcement direction. Data in the literature from flax, but also from other bast fibre reinforced UD composites, have shown a peculiar behaviour, exemplified by the stress-strain curve shown in
Figure 1 [
4,
8,
9,
10,
11,
12,
13,
14,
15,
16,
17,
18]. A bilinear trend is observed, with a first linear elastic region AB, followed by a nonlinear interval BC and a successive quasilinear stage CD up to brittle failure. The change of slope between AB and CD determines a rather marked change of stiffness, generally in the order of 30%–50%. The first linear stage AB ends at relatively low stress and strain levels (in the order of 0.1%–0.3%). The final quasilinear CD stage sometimes exhibits a slightly increasing (hardening) or decreasing (softening) trend. Such bilinear tensile behaviour for UD composites is found almost unchanged for both thermoplastic [
12,
13] and thermosetting matrix composites, as well as for twisted yarns, in prepregs and dry fabrics, low twisted rovings and also untwisted and non-crimped assemblies [
4,
14]. In light of this, the behaviour is most likely to be correlated with the intrinsic strain behaviour of elementary fibres [
19].
Figure 1.
Typical tensile curve of a unidirectional (UD) Flax Fibre Reinforced Composite (FFRC) along the reinforcement orientation.
Figure 1.
Typical tensile curve of a unidirectional (UD) Flax Fibre Reinforced Composite (FFRC) along the reinforcement orientation.
The mentioned marked and early reduction of composite stiffness should raise some big concerns among designers and final users, but actually only a few works yet have fully addressed such macroscopic features of plant continuous fibre reinforced composites.
In particular, some works explain the change of slope in the tensile curve as the macroscopic manifestation of a collective viscoelastic reorientation of Micro-Fibrils present in the secondary cell walls of each elementary flax fibre [
9,
15,
16,
19]. Shah
et al. [
9] also suggest that a contribution to the non-linear behaviour might arise from the untwisting/stretching of the fibre yarns, although the tensile non linearity has been observed also with un-twisted fibre assemblies [
4,
8,
10]. A few works [
8,
14,
16] have found out that in the knee region of the tensile curve (BC in
Figure 1) only low Acoustic Emission events are detected, which might indicate that changes are induced by silent Micro-Fibrils reorientation or intra-fibre microstructural failures rather than noisier crack damage events at the mesoscale. In particular, Kersani
et al. [
14] suggest that the non-linearity of the composite and of the single fibres under tension are directly correlated, and reported that fibre/matrix debonding failures start at strain values only twice those of the yield knee (point K in
Figure 1). It is widely accepted that the progressive alignment of Micro-Fibrils along the load direction is the cause for the late increase in stiffness in elementary fibres [
9,
18,
19]. Such increase, though, does not seem to fully transfer in the UD composite (CD range of
Figure 1), where a quasi-linear trend is observed up to brittle failure. Kersani
et al. [
14] suggest that this lack of stiffness improvement is due to the fabric crimp and yarn twists, which determine a further misorientation of elementary fibres, simultaneously hampering the elementary fibres reaching the hardening stage. In this regard, it is observed that a few works in the literature, testing UD composites employing non-crimped and un-twisted fibre assemblies, indeed report some evidence of hardening in the CD stage of the tensile curve, which might be a sign of a higher impact of Micro-Fibrils’ reorientation for such straight reinforcements [
4,
8,
10,
15].
Charlet
et al. [
15] suggest that the non-linear tensile behaviour of composites is also correlated to internal sliding between bundled fibres,
i.e., agglomerated fibres which have not been properly separated in the fibres’ extraction process [
18]. In fact, within such bundles, the matrix resin has not penetrated, and fibres are bound together by a weak pectin interface. Also, Ramoney
et al. [
20] identify early evidence of fibre–fibre interface debonding by using Acoustic Emission techniques.
Some authors have also correlated the non-linear tensile behaviour of elementary fibres to the influence of local kink bands and dislocation defects [
19,
21]. Kink bands are usually introduced by the isolation process of fibres from the plant, and determine local low stiffness bulged regions, which interrupt the geometrical and mechanical continuity of the fibre. After a certain load, threshold kink bands tend to straighten up, thus contributing to the temporary non-linear load increase and stiffness reduction. A further interesting finding by Bailey [
19] is that, by repeating loading-unloading cycles, the tensile curve evolves towards a more linear Hookean behaviour.
Hughes [
8] suggests that kink band defects have also a fundamental role in determining the non-linear behaviour of UD composites. Under tensile loading, the low stiff kink bands produce local stress concentrations in the matrix, leading to early local fibre/matrix debonding, which Hughes also links to low-level acoustic emission detected at the onset of the non-linearity. Further evidence is found by Hughes [
8] by reporting that an improved fibre/matrix shear strength, achieved by special fibre sizing, determines a higher yield point and a subsequent smaller stiffness reduction.
While the majority of quoted studies have investigated monotonic tensile behaviours, some more recent works have extended the analysis by applying low speed repeated loading/unloading cycles [
9,
10]. These works have highlighted some further interesting features: cycling with load amplitudes higher than the yield point (K in
Figure 1) gives rise to a permanent inelastic deformation and to a certain amount of energy loss (area of hysteresis of cycles); the major amount of energy loss is comprised in the first cycles; immediate reloading after previous cycling finds the material stiffness and yield point substantially modified from the values of the virgin material. Such findings demonstrate the onset of some levels of irreversible modifications, activated by loading above the knee yield point, whose knowledge, still very limited, is though fundamental for a correct modelling of the material at the design stage.
This work presents results of tensile tests on UD composites made from a quasi-unidirectional flax fabric using twisted yarns. Three lamination procedures have been implemented giving rise to different fibre volume fractions. Two characterizations are in particular proposed. In the first one, the stiffness response of the material is investigated after repeated monotonic and cyclic loadings, with load cycles having different ratios of σmin/σmax (R-ratio). In the second, Infrared Thermography is used to monitor the full field temperature of specimen during monotonic and cyclic loading. In the case of monotonic loading, the thermal signal is analysed to correlate departures from the linear thermoelastic behaviour with the onset of energy loss mechanisms. The thermal signal acquired during cycling is instead post-processed to evaluate the Thermoelastic Signal. Maps of the Thermoelastic signal component and the second harmonic component are in particular obtained for cycles with different R-ratios, allowing to investigate the extent of elastic behaviour of the material.
4. Thermal Analysis
An Infrared (IR) Thermocamera was used to sample the specimen temperature during tensile tests. A cooled sensor high thermal resolution Flir X6540sc model was, in particular, used in combination with the FLIR Research IR 3.4 software for remote control and thermograms basic processing.
The temperature was acquired on two specific occasions:
during a time window of 30 s within each of the six steps of cyclic loading shown in
Figure 8.
If a linear elastic behaviour characterises the material, then the only thermo-mechanical coupling should be represented by the Thermoelastic effect [
25]. This means that temperature should follow a variation according to the Thermoelastic law for orthotropic materials, given by [
26]:
where
α is the Coefficient of Thermal Expansion,
ρ and
Cp density and specific heat at constant pressure of the bulk material, and
T the absolute mean temperature of the sample. Subscripts
L,
T in the tensorial parameters refer to the material principal directions,
i.e., the yarns warp direction for
L and the weft direction for
T. For unidirectional tensile loading, by indicating with
1 and
2, respectively, the higher and lower principal stress directions, two scenarios are possible:
the surfacing fibres are aligned with load direction, i.e., L = 1. In this case, it is ΔσL > 0 and σT = 0 (second term in parenthesis in Equation (2) becomes null);
the surfacing fibres are transverse to the load, i.e., T = 1 and L = 2 (this is for instance the case of the surfacing weft ties of the fabric). In this case it is ΔσL = Δσ2 = 0 and ΔσT = Δσ1 > 0 (first term in parenthesis in Equation (2) becomes null).
4.1. Thermographic Analysis of Monotonic Loading Tests
Assuming
ΔL>0 in Equation (2) (see e.g., [
27]), the evolution of sample temperature during monotonic elastic loading should be linearly decreasing. Some authors [
28,
29] have indicated a departure from linearity and an inversion of trend as a sign that the material is starting to experience some inelastic deformation or damage which are generally associated with the generation of irreversible heating opposing the thermoelastic cooling trend.
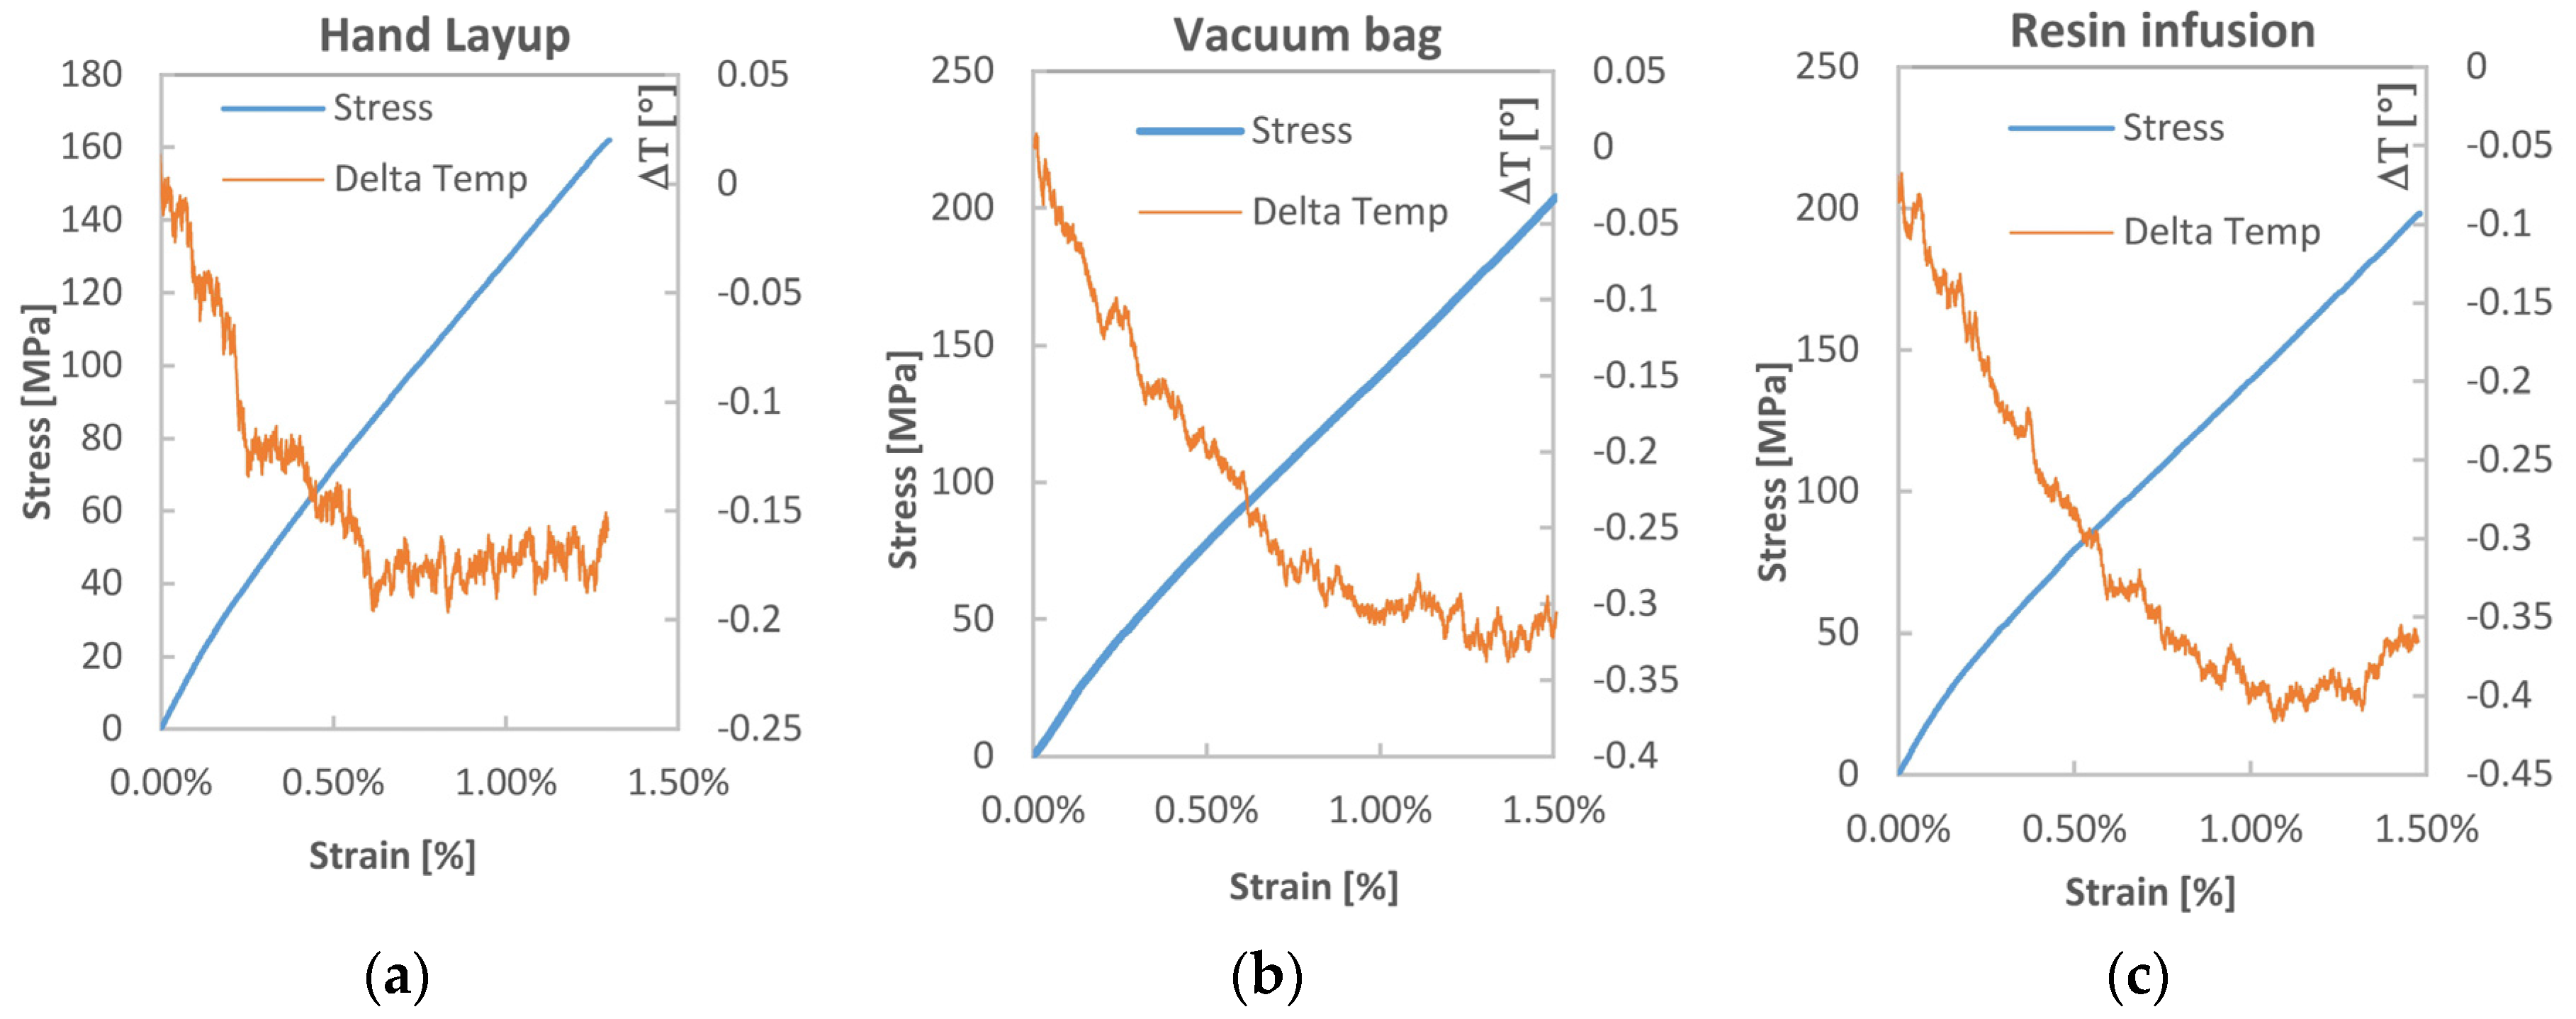
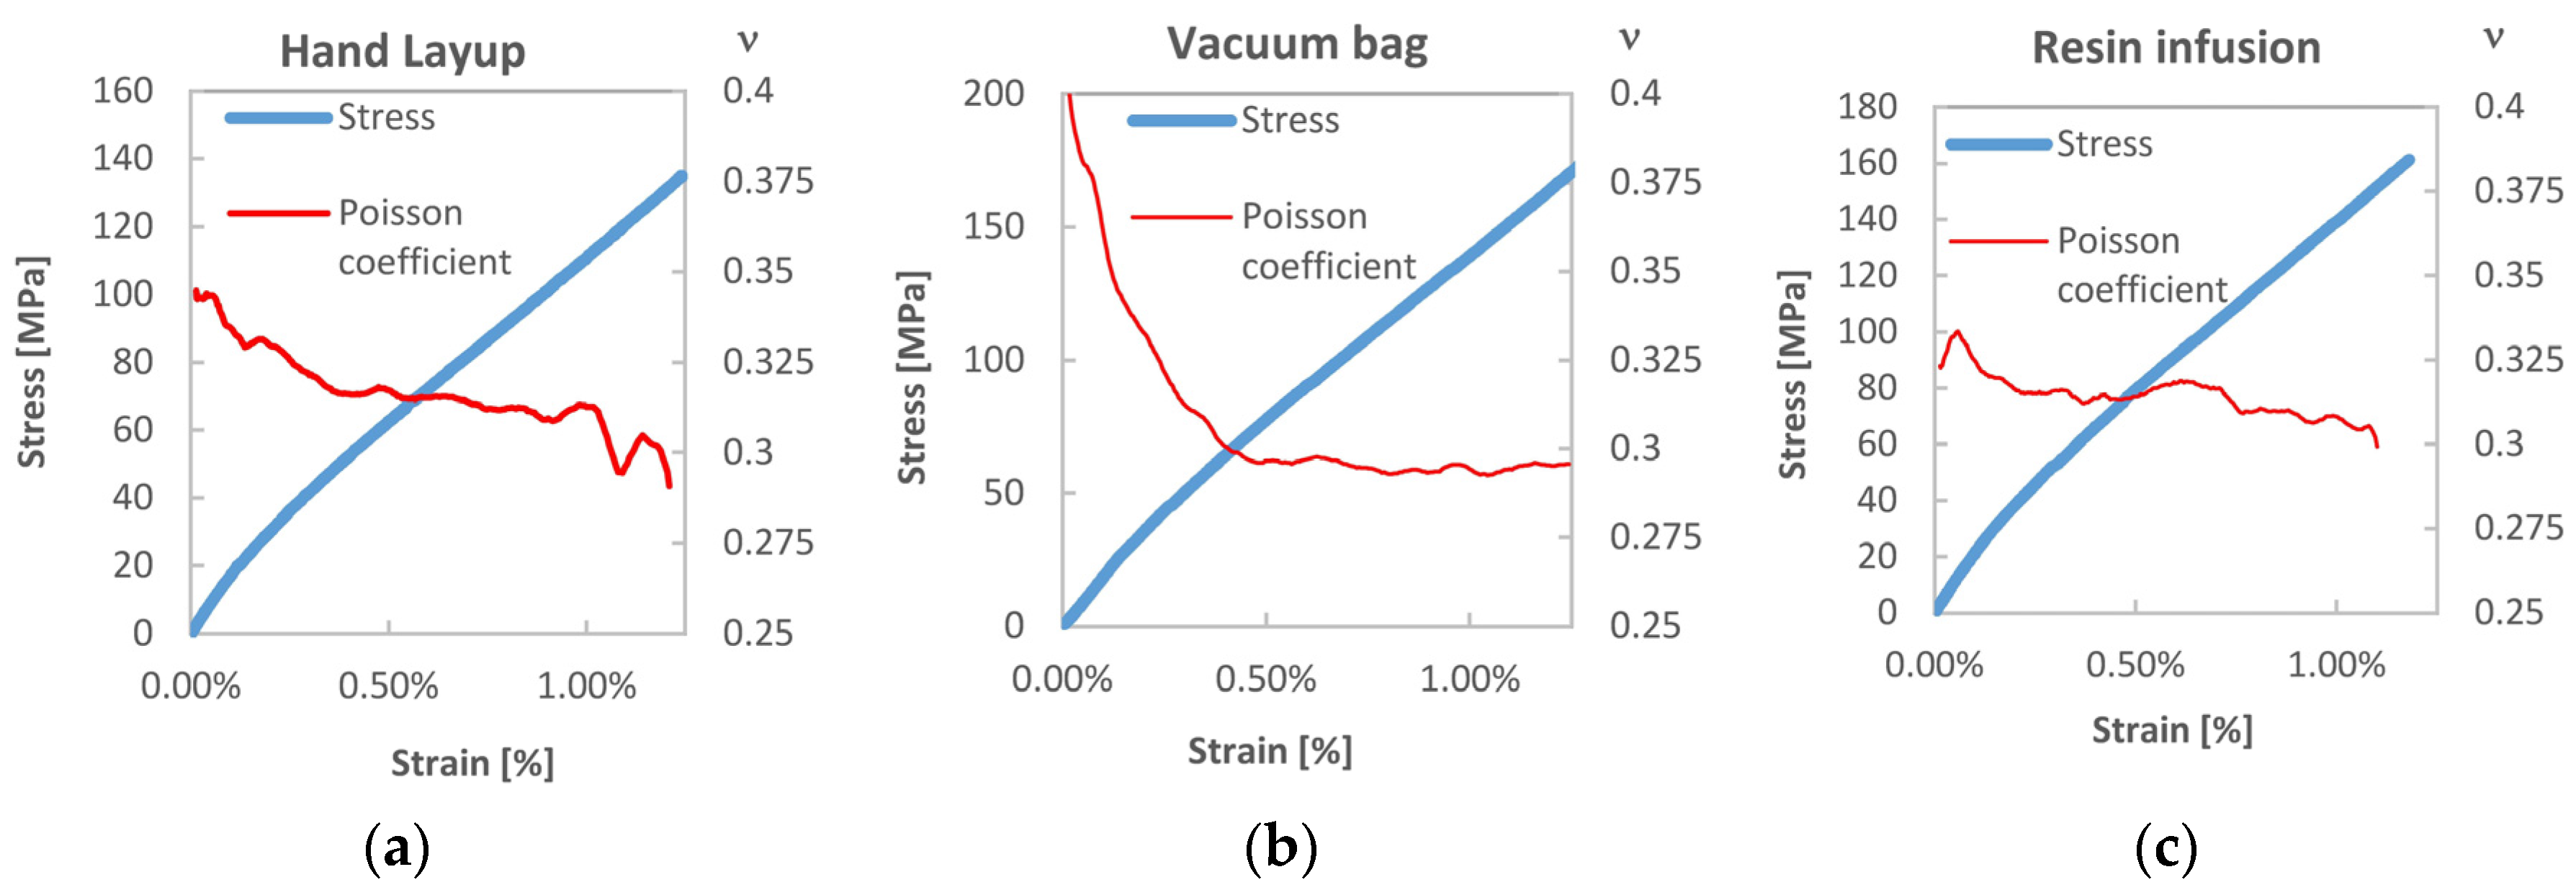
Figure 10 shows the evolution of temperature measured during monotonic tensile tests. This is superpositioned to the stress-strain curves for each batch of material, in order to correlate the departure of temperature from linearity with the level of strain reached by the material. The plotted temperature is the average value over a central area of the sample comprising about 3000 pixels.
Figure 10.
Evolution of temperature during monotonic tensile tests overlapped to the stress strain curves for for the: (a) hand lay-up, (b) vacuum bag and (c) resin infusion laminated composites.
Figure 10.
Evolution of temperature during monotonic tensile tests overlapped to the stress strain curves for for the: (a) hand lay-up, (b) vacuum bag and (c) resin infusion laminated composites.
Results of the temperature measurements (
Figure 10), although quite noisy, do show a quasi-linear initial trend, extending for a temperature decrease of about 0.2 °C. This first trend starts to depart from linearity at values of strain generally above 0.5%, and hence well after the non-linear BC region of the tensile curve. The non-linear behaviour tends to an inversion from temperature decrease to temperature increase, determining a minimum point that is fully onset at values of strain above 1%. If such departure from linearity is to be correlated to dissipative micro-damage setting on the material, it is then meaningful to highlight how such evidence starts only after the second linear region CD of the curve has onset. This occurrence can be linked to the acoustic emission results presented by Kersani
et al. [
14], who also indicated the development of damage related acoustic activity at similar levels of the tensile curve.
4.2. Thermoelastic Stress Analysis
A second thermographic analysis was carried out consisting of the evaluation of the thermoelastic signal,
i.e.,
ΔT of Equation (2), during the fatigue cycling defined in
Table 4 and
Figure 8. A lock-in filtering was, in particular, implemented to determine the thermoelastic signal, according with the classical approach of Thermoelastic Stress Analysis (TSA) applied to orthotropic materials [
26,
27]. In particular, the temperature for all cyclic loading steps was acquired under the following constant Thermocamera settings: integration time 1767 μs, frame sub-window 128 × 172 pixels corresponding to a spatial resolution of about 0.23 mm/pixel, instantaneous field of view (iFOV) of 0.25 mm, frame rate 100 Hz, sampling window 30 s. The acquired thermograms were exported from Flir Research IR to Matlab, and further post-processed with an in-house developed algorithm able to obtain both the thermoelastic signal (principal harmonic) and the second harmonic signal by means of a Fast Fourier Transform based lock-in analysis [
30]. Results of TSA are reported in
Figure 11,
Figure 12,
Figure 13,
Figure 14,
Figure 15 and
Figure 16.
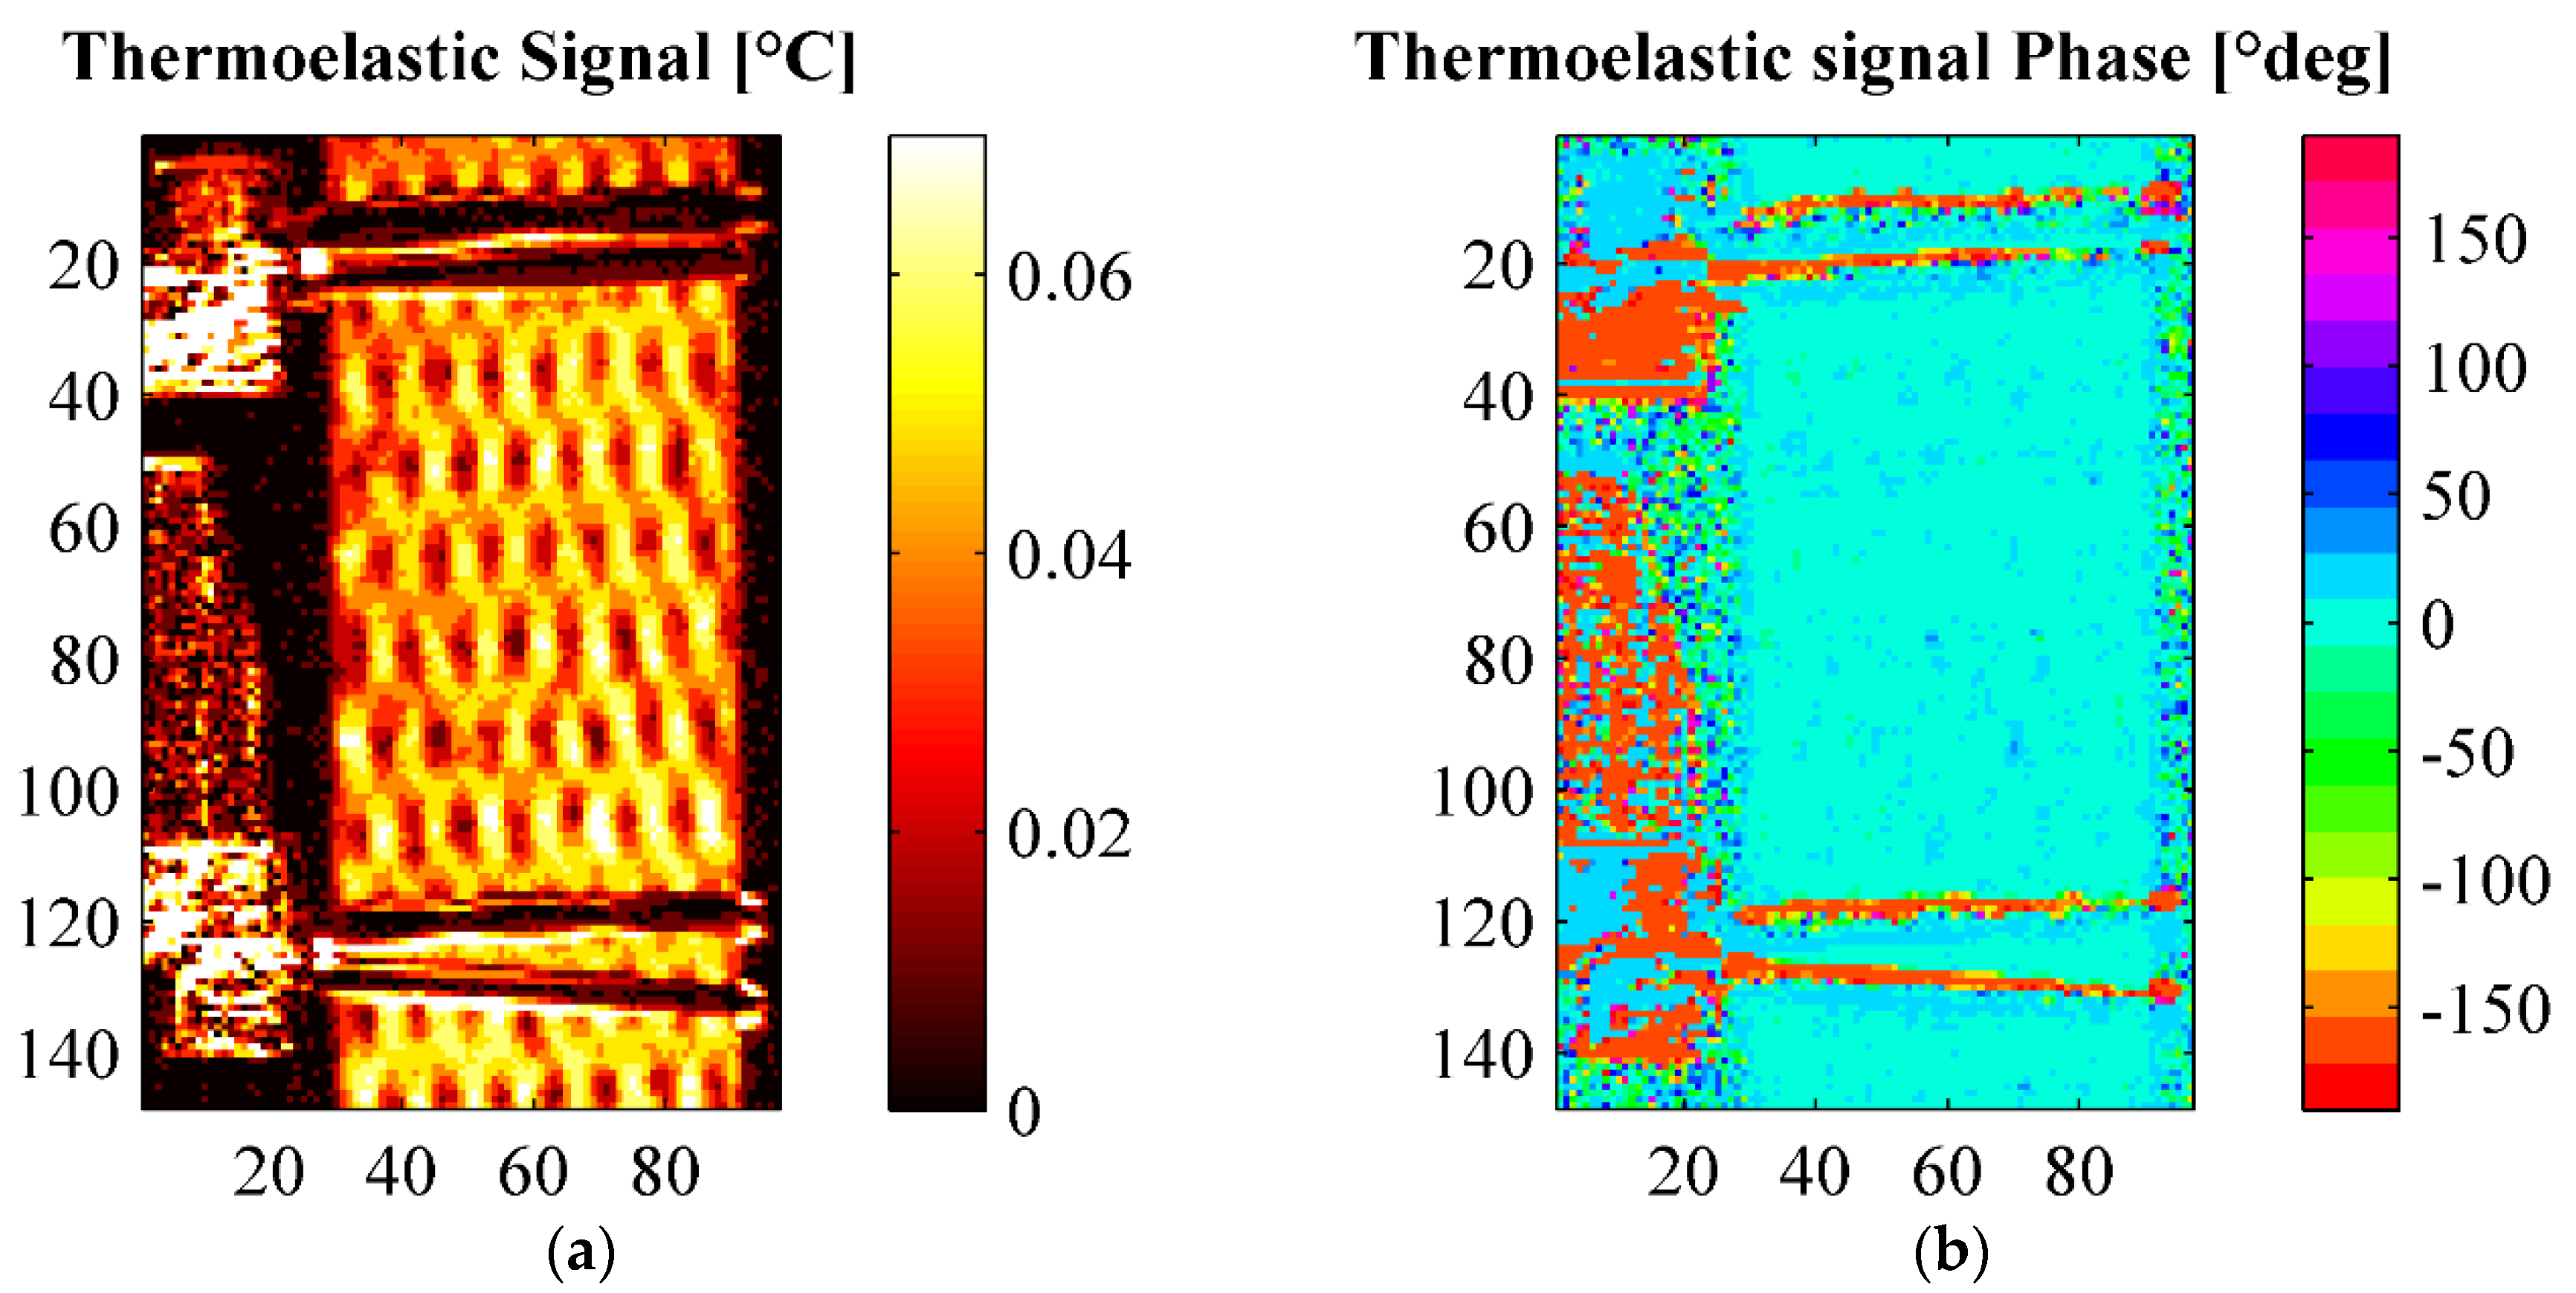
Figure 11 in particular shows an example of amplitude and phase maps of the thermoelastic signal. The acquired sample area is about 15 × 40 mm. It is possible to recognise on the left hand side of the sample the knives of a MTS clip on gage used to monitor strain and fixed on the sample by elastic bands.
Figure 12,
Figure 13 and
Figure 14 collect maps of the thermoelastic signal amplitude from HL, VB and RI at each of the six loading steps applied (see
Table 4).
Figure 11.
Thermoelastic signal amplitude and phasefrom an HL sample under loading step 1 (see
Table 4). (
a) Amplitude; (
b) Phase.
Figure 11.
Thermoelastic signal amplitude and phasefrom an HL sample under loading step 1 (see
Table 4). (
a) Amplitude; (
b) Phase.
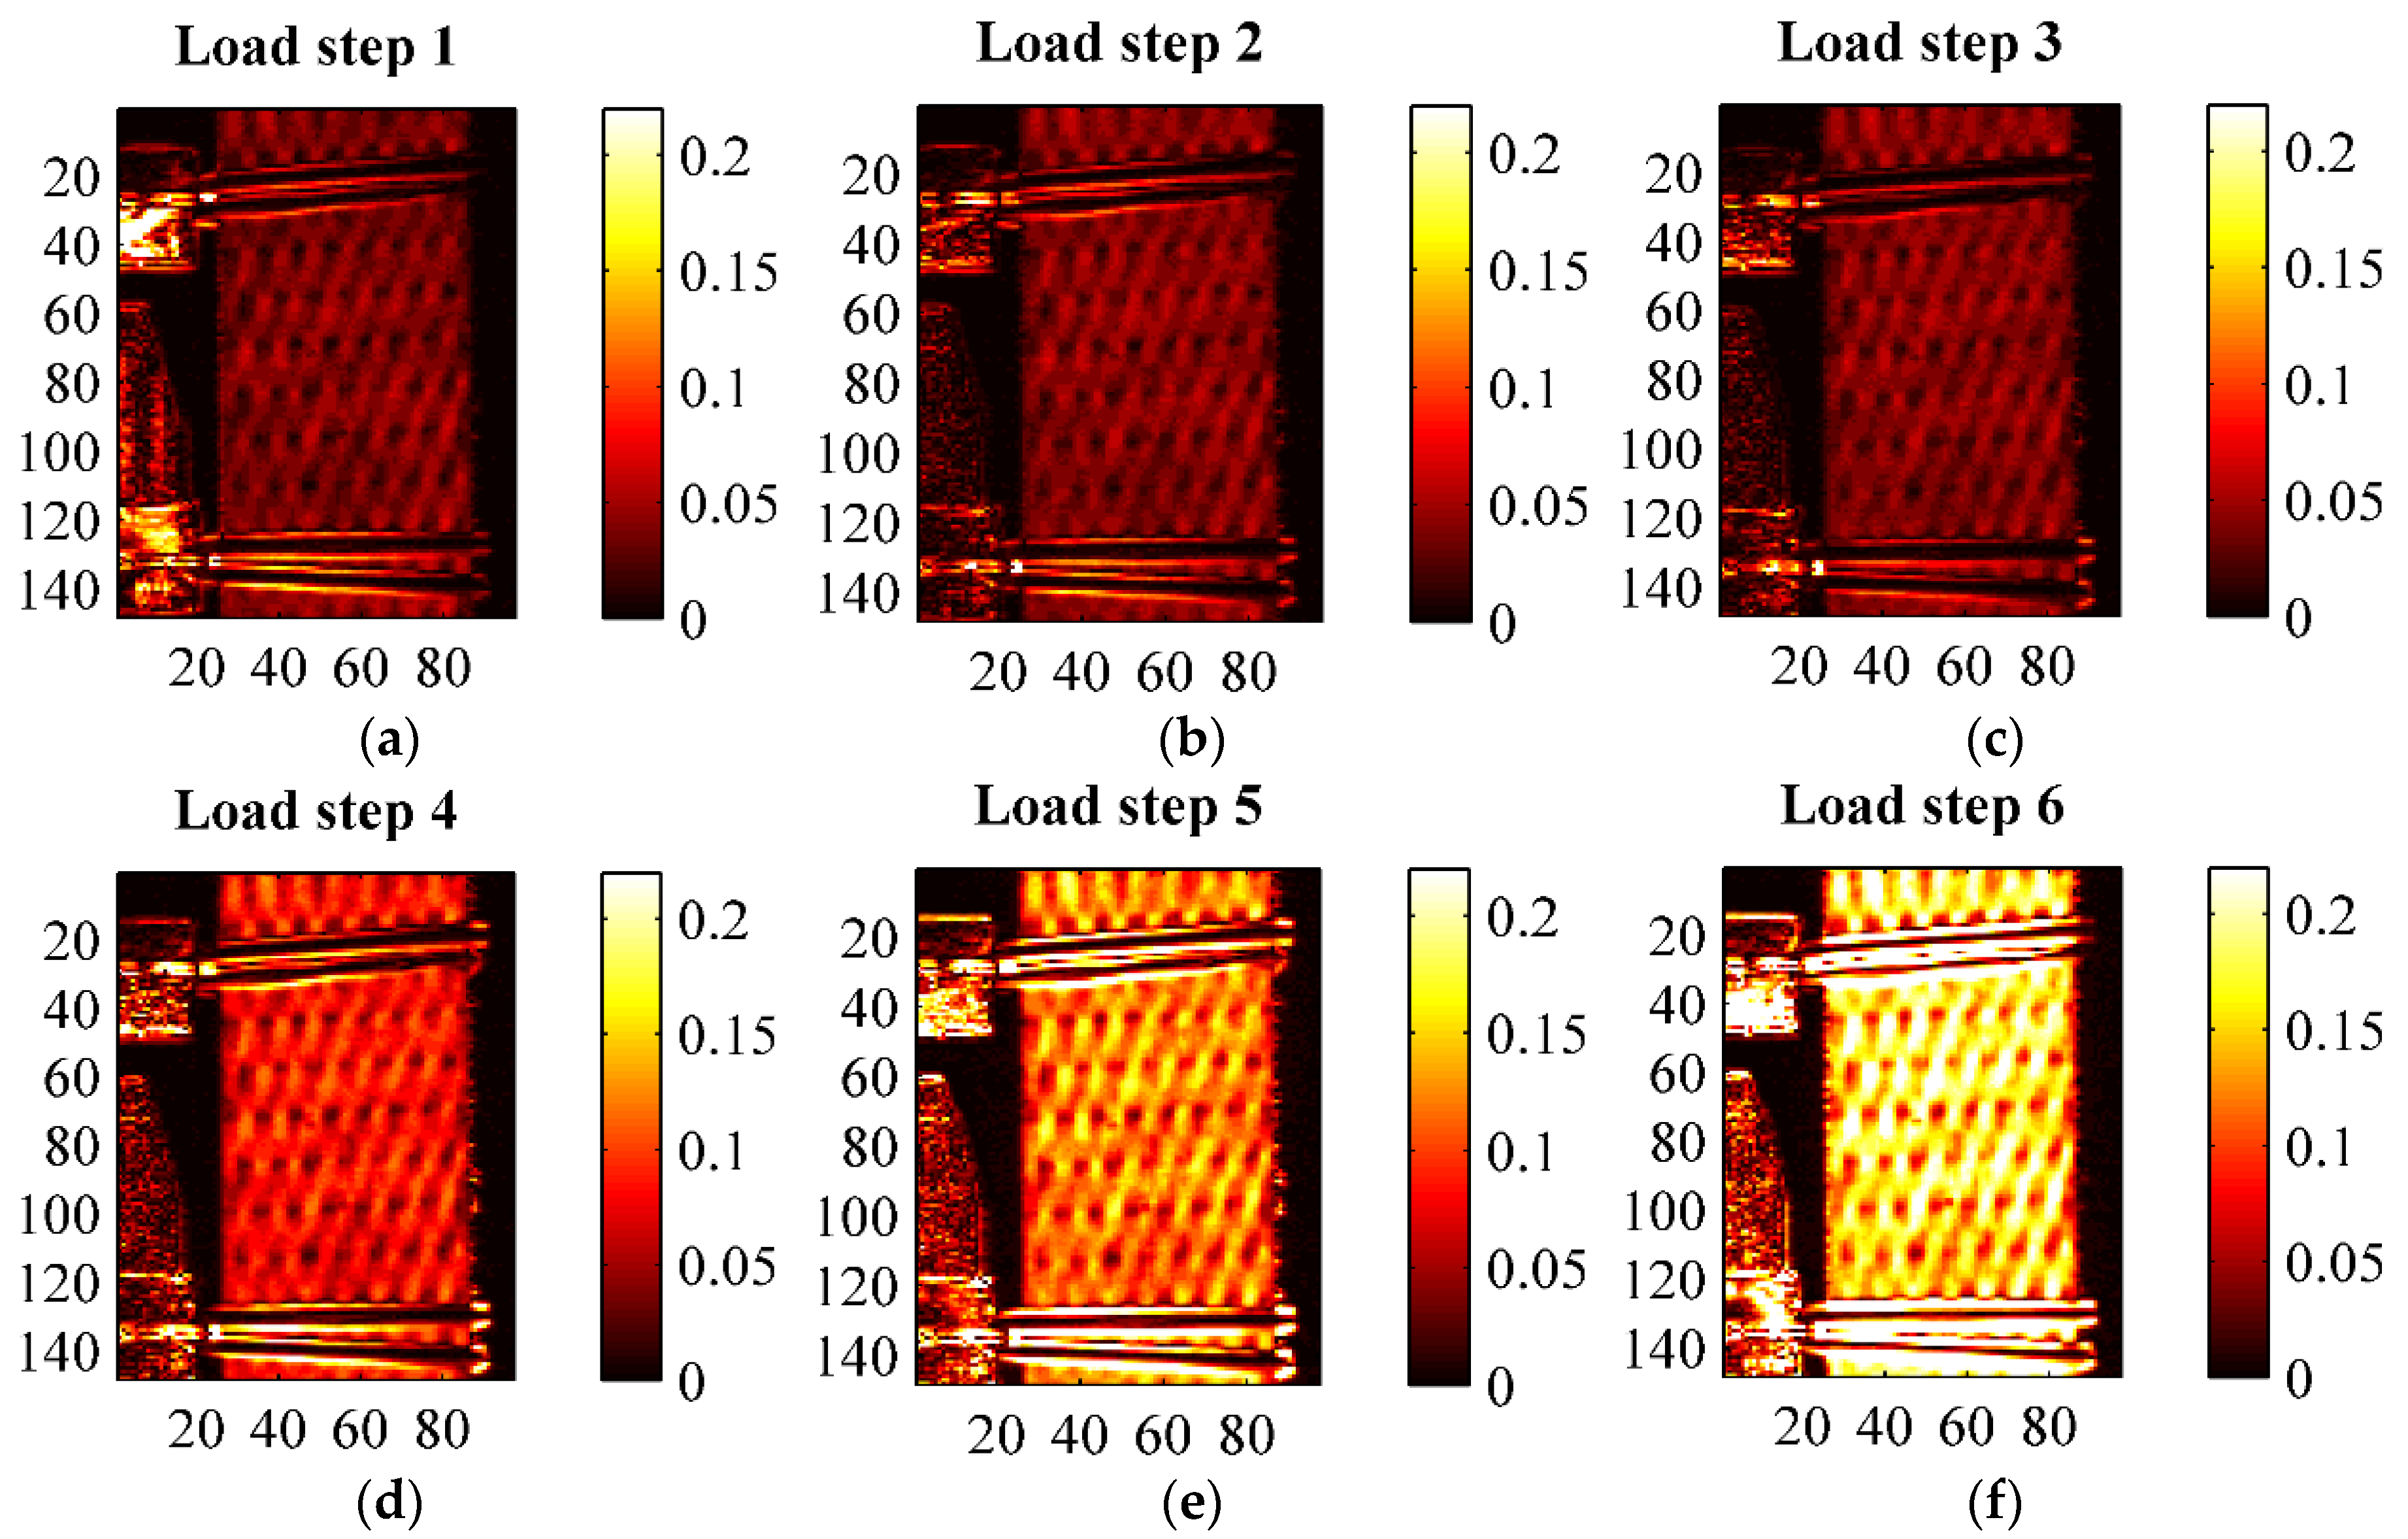
Figure 12.
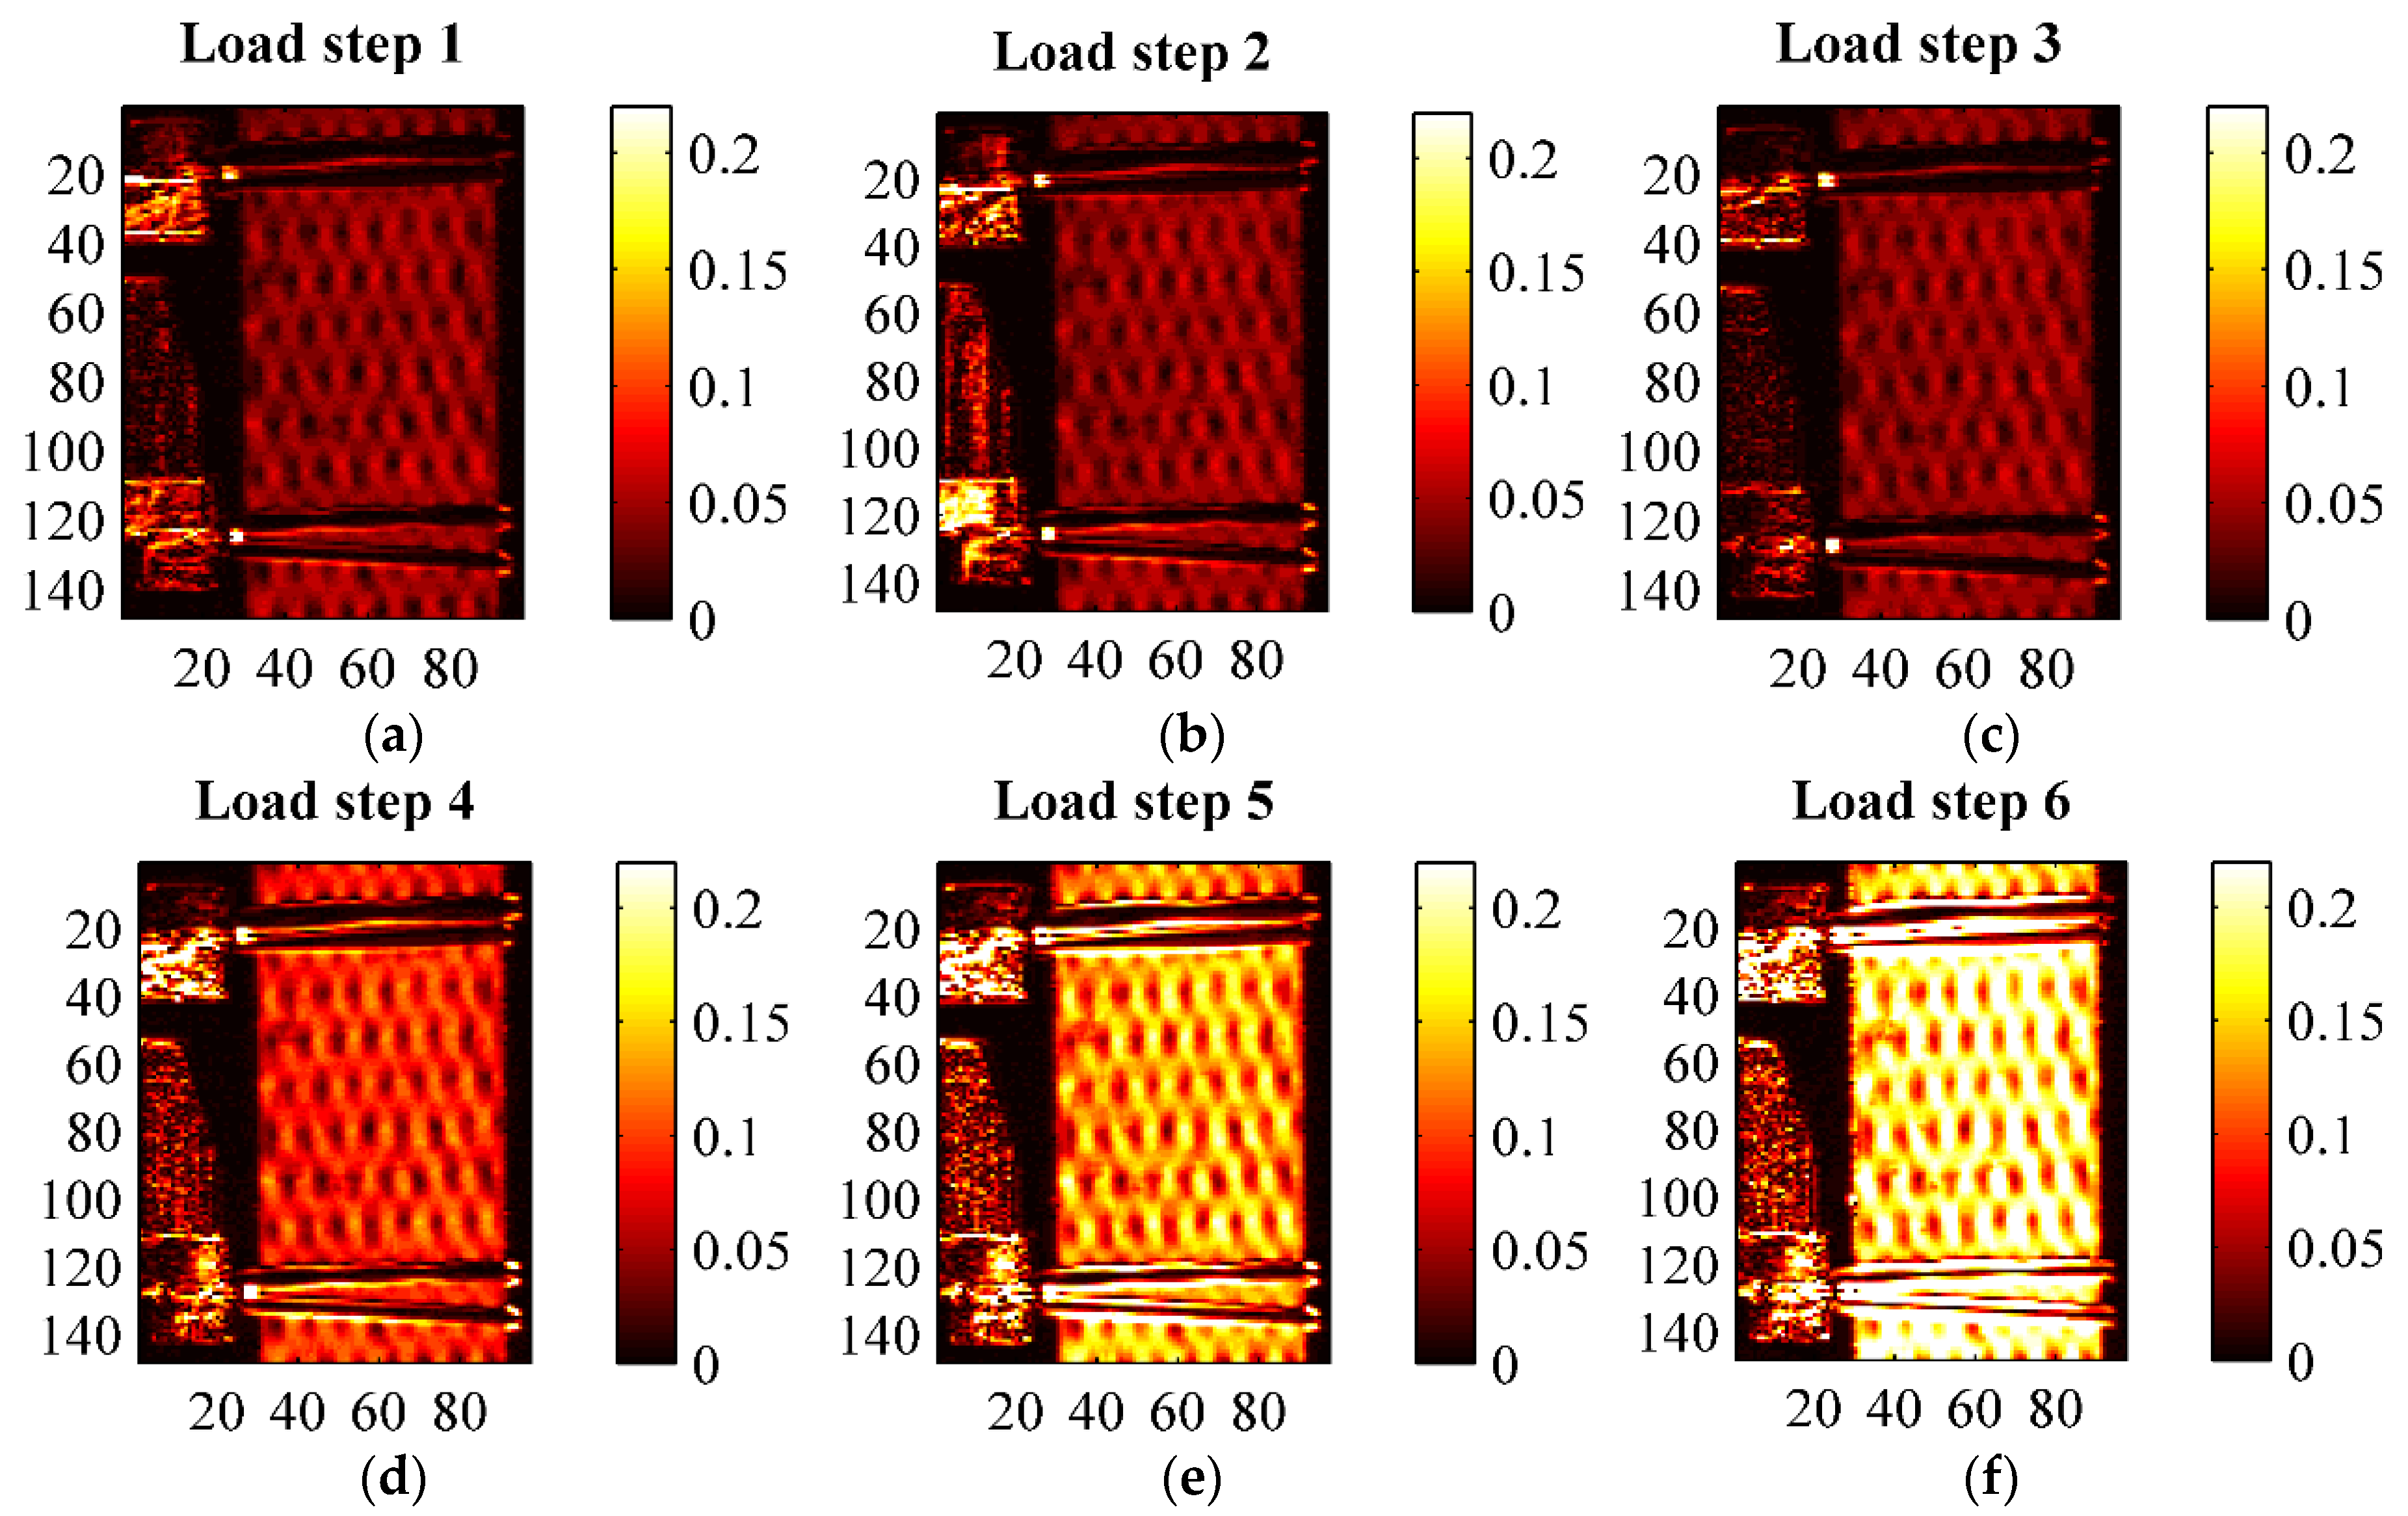
Thermoelastic signal amplitude ΔT in (°C) from an HL sample at the various loading steps. (a) load step 1; (b) load step 2; (c) load step 3; (d) load step 4; (e) load step 5; (f) load step 6.
Figure 12.
Thermoelastic signal amplitude ΔT in (°C) from an HL sample at the various loading steps. (a) load step 1; (b) load step 2; (c) load step 3; (d) load step 4; (e) load step 5; (f) load step 6.
Figure 13.
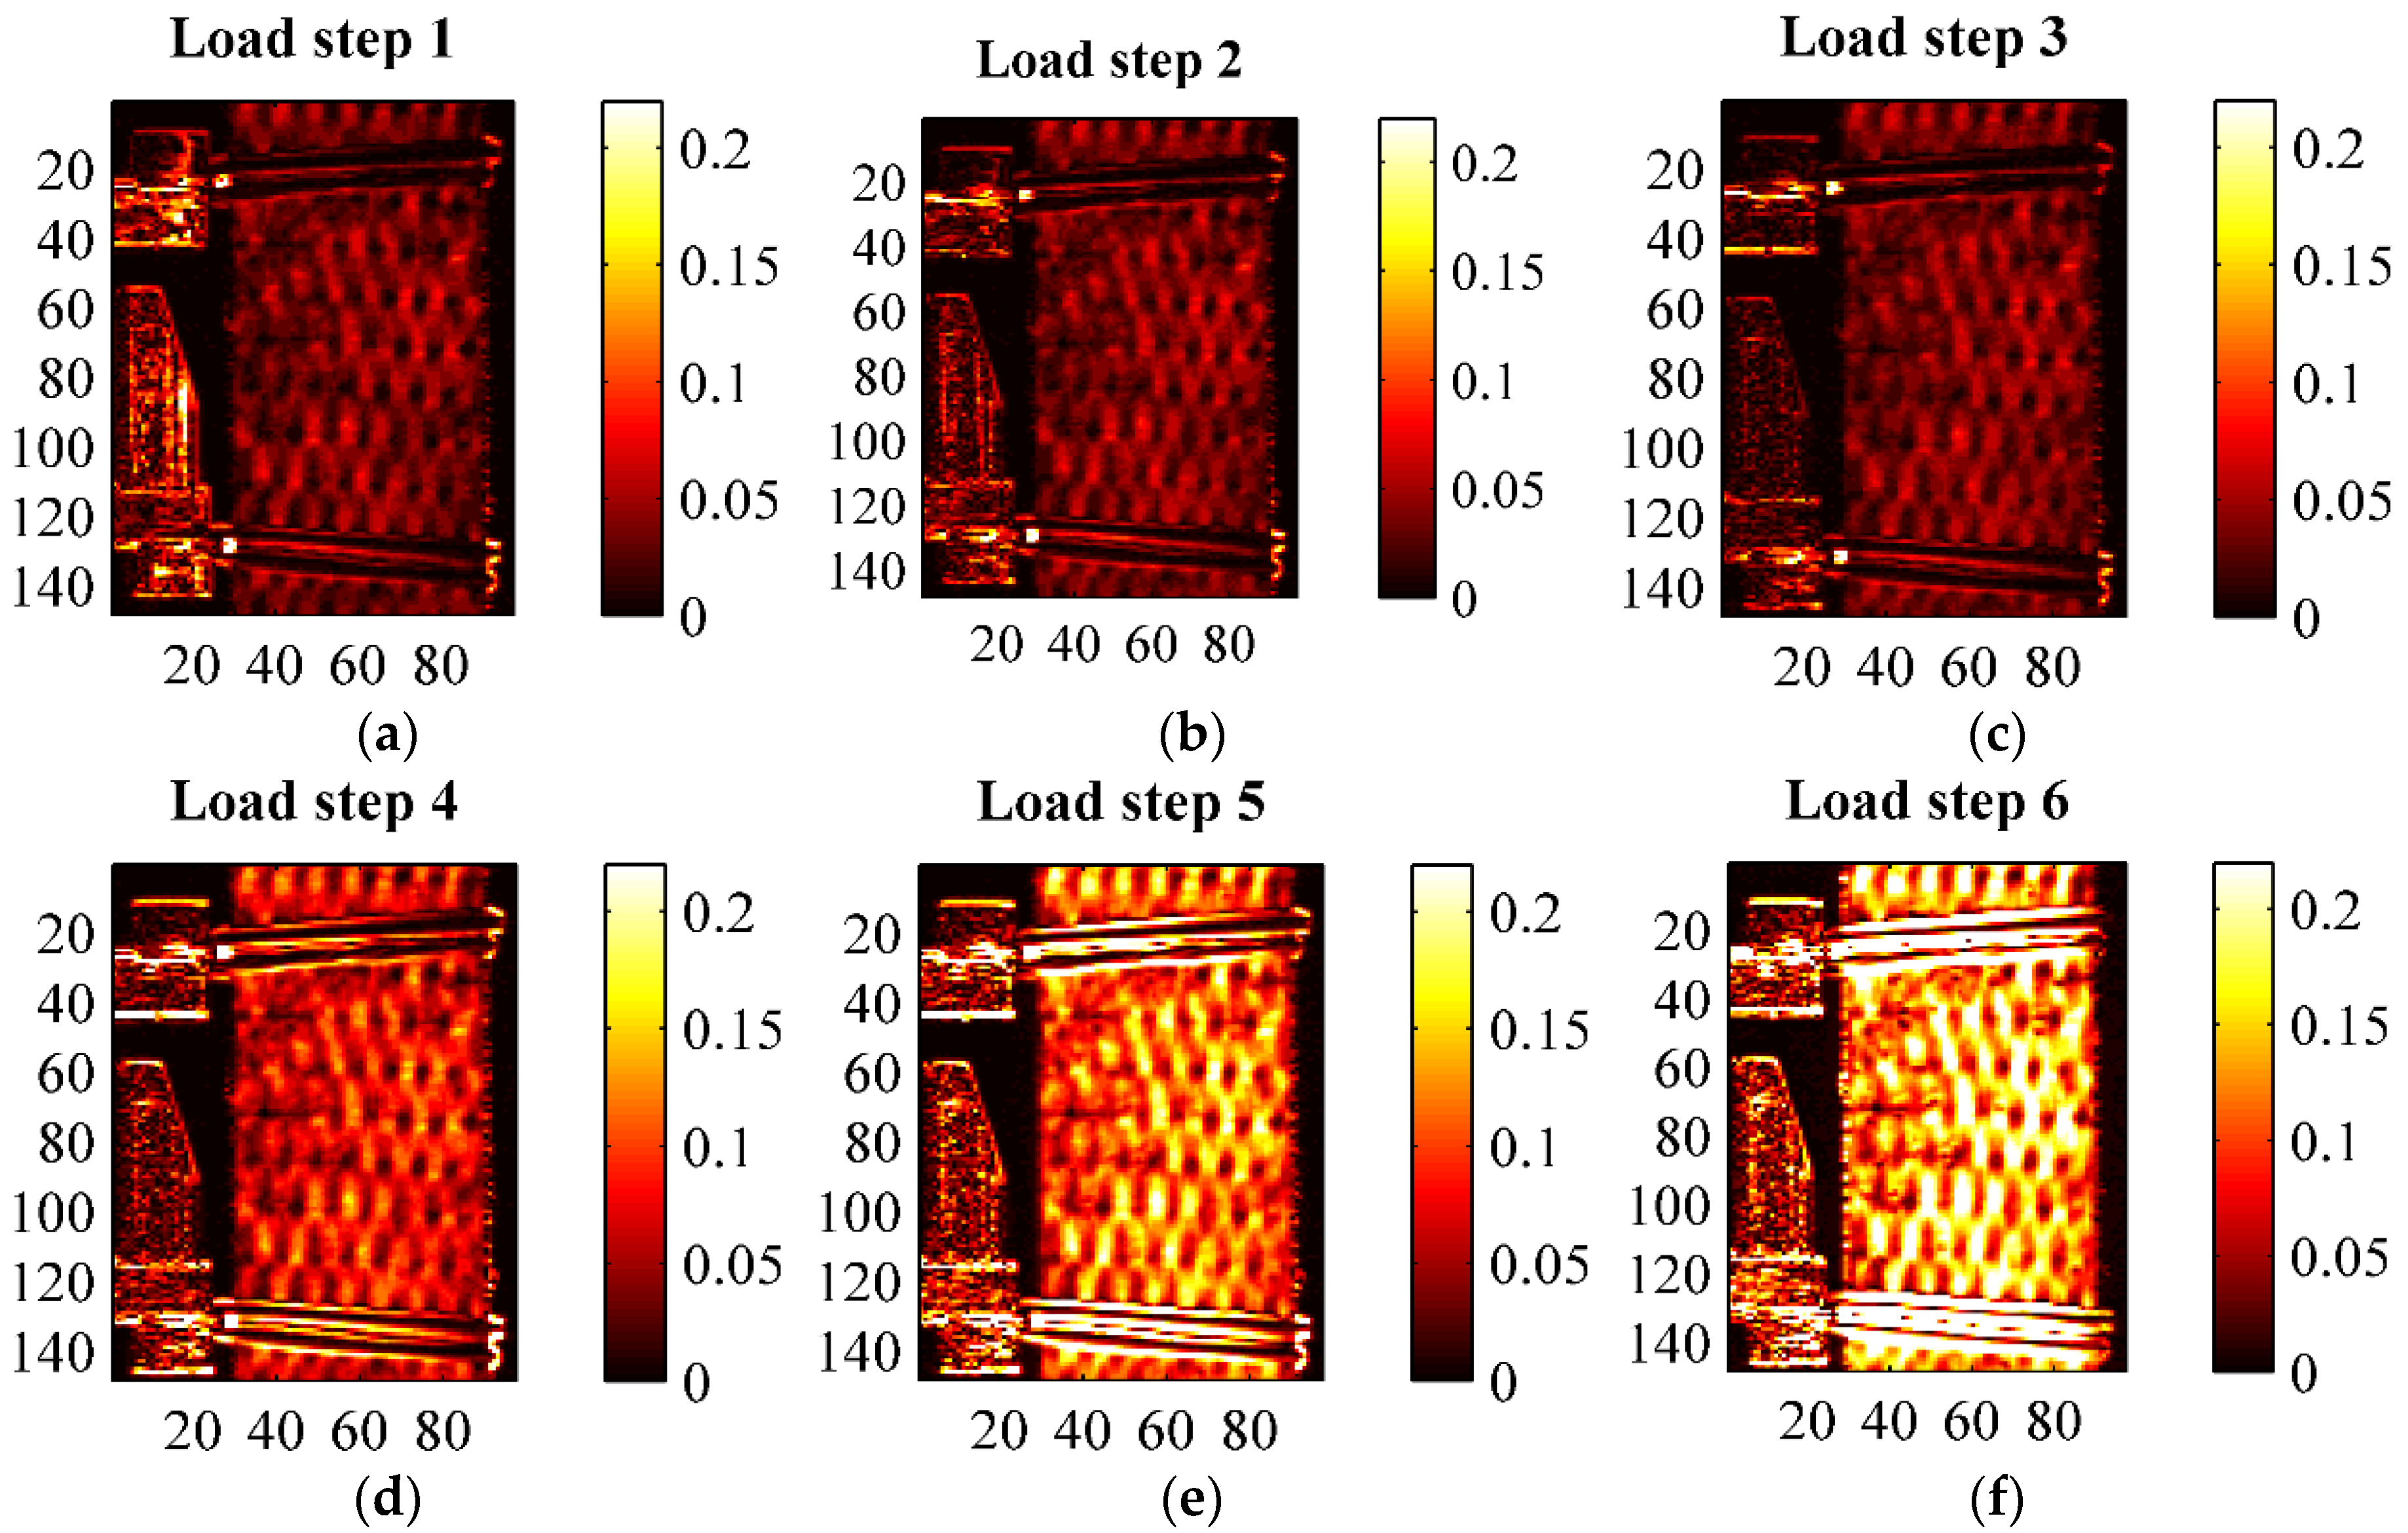
Thermoelastic signal amplitude ΔT in (°C) from a VB sample at the various loading steps. (a) load step 1; (b) load step 2; (c) load step 3; (d) load step 4; (e) load step 5; (f) load step 6.
Figure 13.
Thermoelastic signal amplitude ΔT in (°C) from a VB sample at the various loading steps. (a) load step 1; (b) load step 2; (c) load step 3; (d) load step 4; (e) load step 5; (f) load step 6.
Figure 14.
Thermoelastic signal amplitude ΔT in (°C) from a RI sample at the various loading steps. (a) load step 1; (b) load step 2; (c) load step 3; (d) load step 4; (e) load step 5; (f) load step 6.
Figure 14.
Thermoelastic signal amplitude ΔT in (°C) from a RI sample at the various loading steps. (a) load step 1; (b) load step 2; (c) load step 3; (d) load step 4; (e) load step 5; (f) load step 6.
Figure 15.
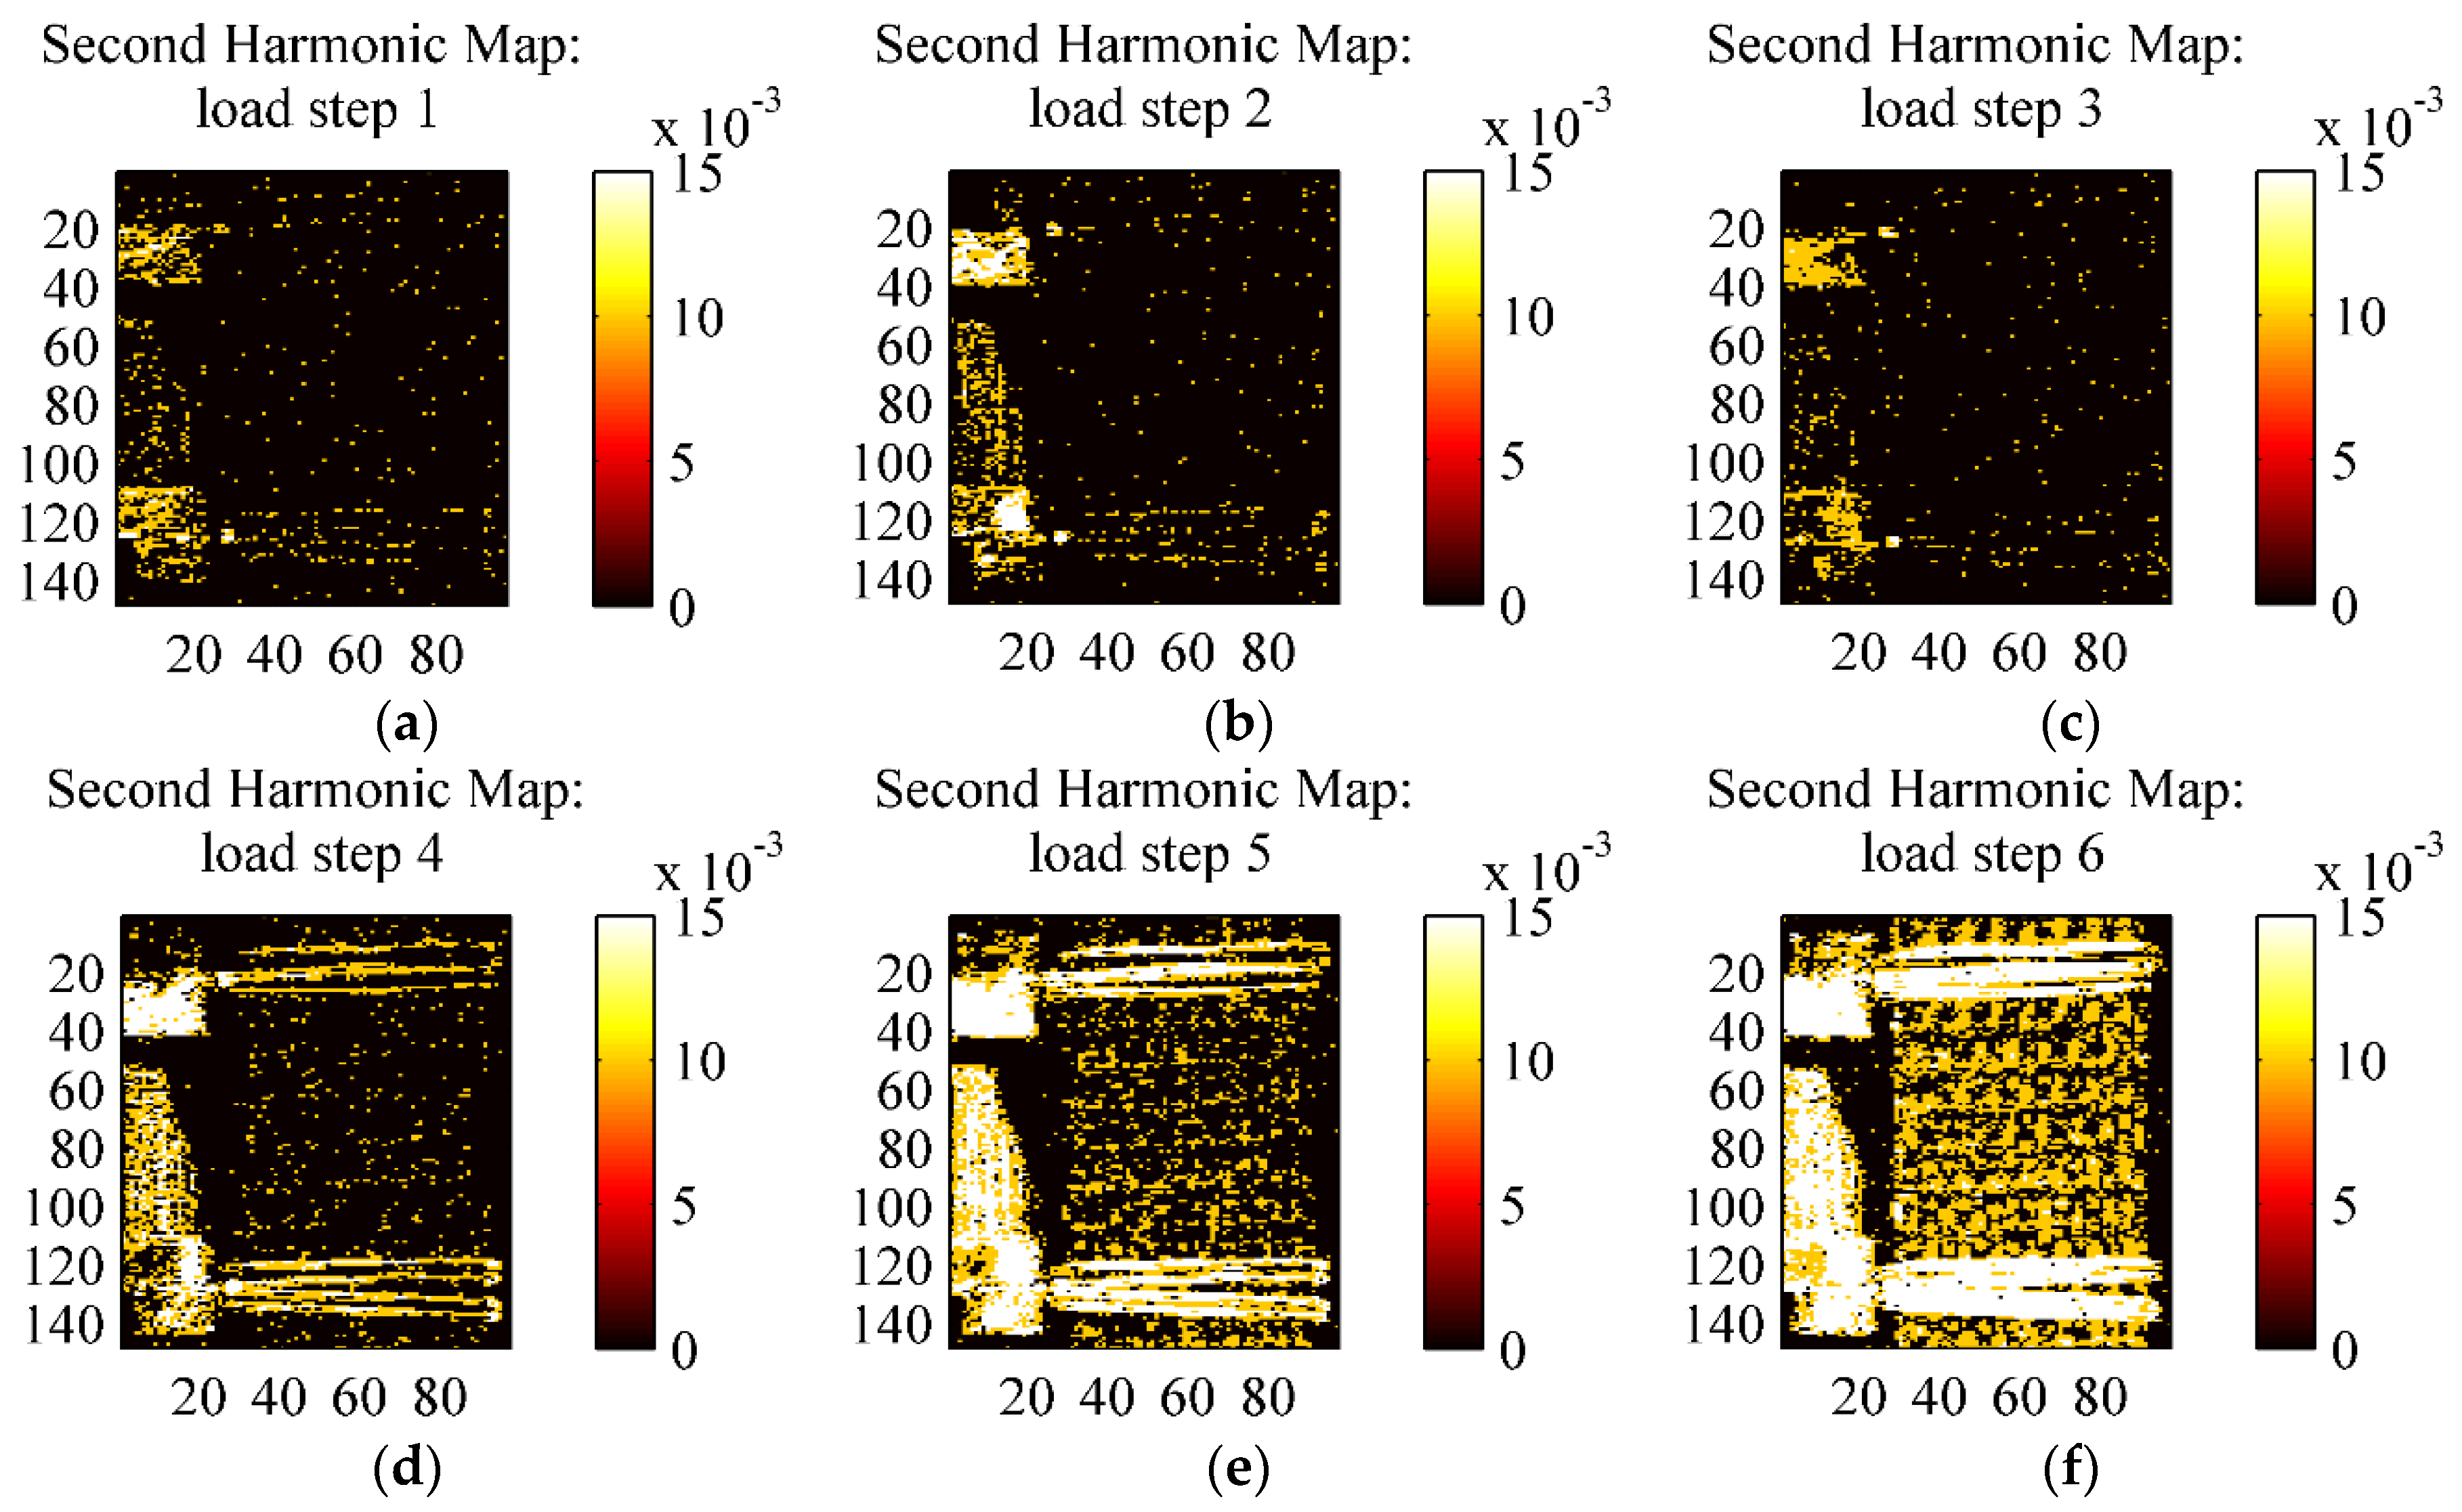
Full field second harmonic signal amplitude in (°C) from an HL sample at the various loading steps. (a) load step 1; (b) load step 2; (c) load step 3; (d) load step 4; (e) load step 5; (f) load step 6.
Figure 15.
Full field second harmonic signal amplitude in (°C) from an HL sample at the various loading steps. (a) load step 1; (b) load step 2; (c) load step 3; (d) load step 4; (e) load step 5; (f) load step 6.
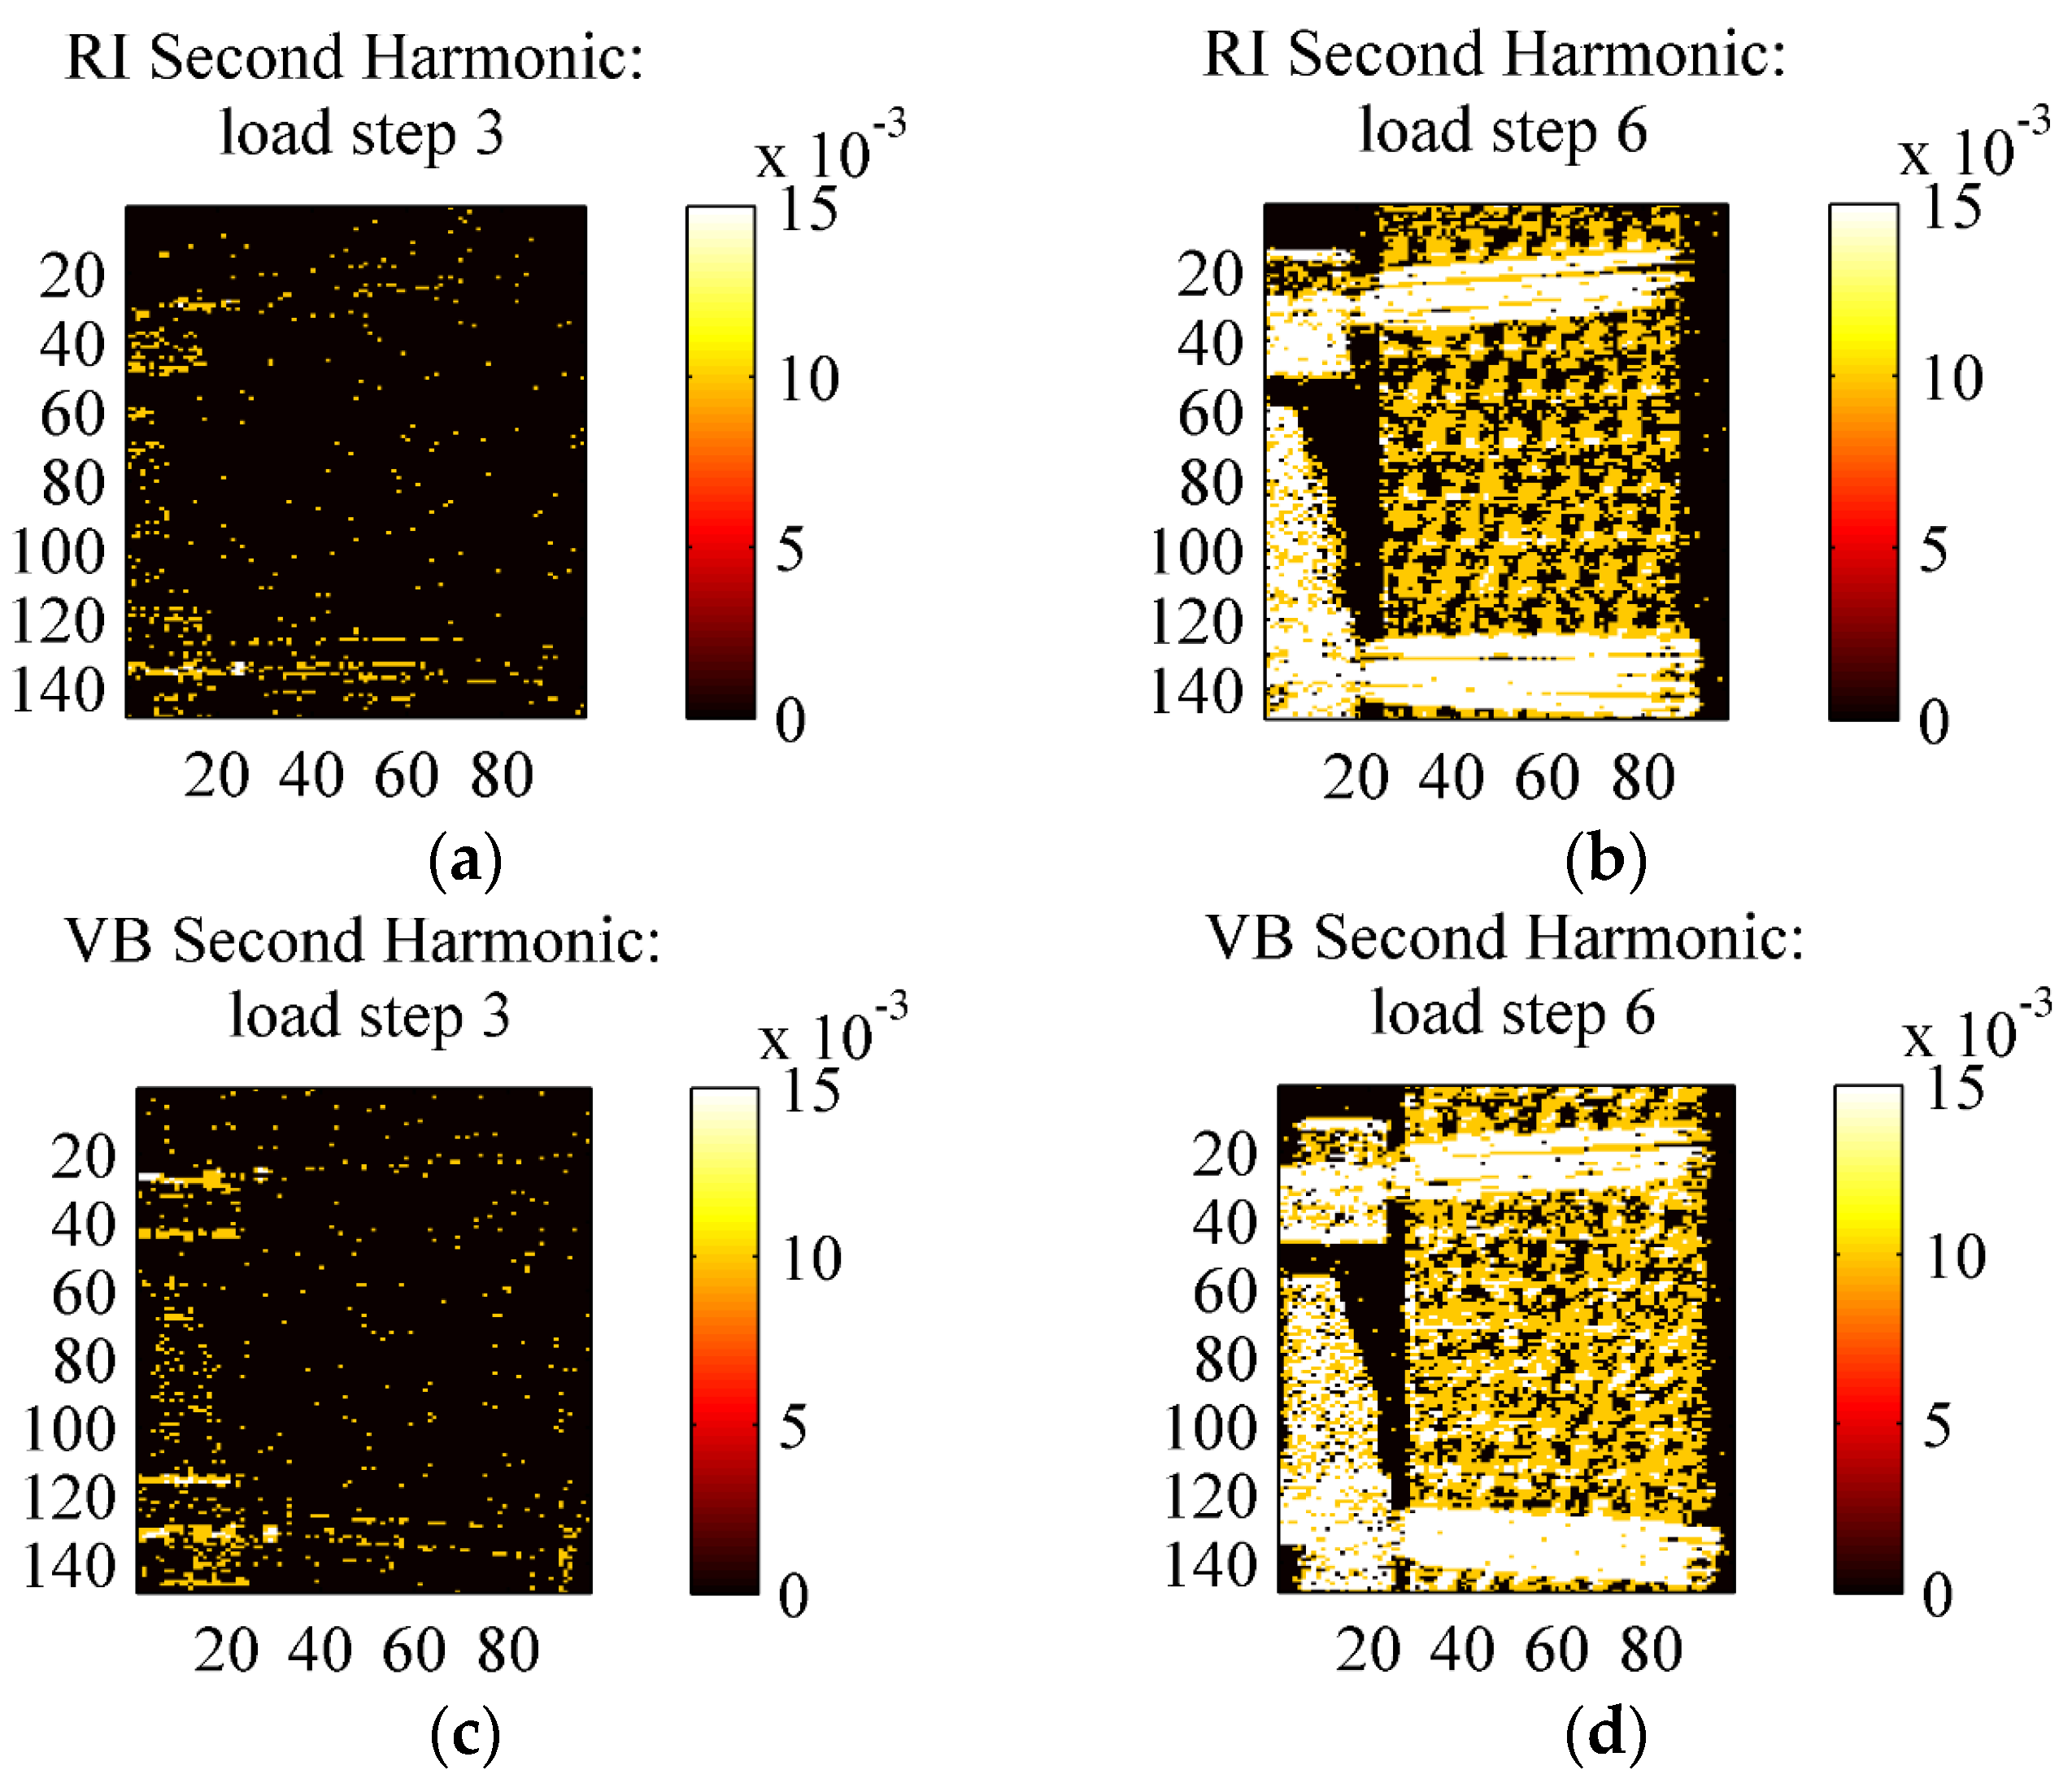
Figure 16.
Comparison of second harmonic maps (a) RI sample under load step 3; (b) RI sample under load step 6; (c) VB sample under load step 3; (d) VB sample under load step 3.
Figure 16.
Comparison of second harmonic maps (a) RI sample under load step 3; (b) RI sample under load step 6; (c) VB sample under load step 3; (d) VB sample under load step 3.
The maps of the thermoelastic signal amplitude in
Figure 11,
Figure 12,
Figure 13 and
Figure 14 show a peculiar chessboard like signal pattern, alternating zones of higher and lower amplitude. The higher signal is in particular detected above the zones of the sample surface which expose the weft yarns. This behaviour is also widely discussed in [
31] for a GRP composite with similar fabric texture. In such weft tie surfacing zones
Δσ1 =
ΔσT,
i.e., the orientation of the fibres is such that the transverse Coefficient of Thermal Expansion (CTE) should be considered as the correct coefficient multiplying the axial stress component in Equation (2). It is well known that transverse CTEs for highly anisotropic fibres are much higher (even one order of magnitude) than longitudinal CTEs [
27,
32]. Hence, the higher thermoelastic signal is mainly due to the higher local CTE. This mismatch in CTEs and the resulting pattern in the thermoelastic signal map also provide a very effective way to verify the quality of fibre alignment and the presence of surface damaged fabric zones. The phase map (see
Figure 11b) delivers additional important information about the nature of the acquired thermoelastic signal. In fact, it is possible to observe a constant phase angle and no peculiar pattern such as that of the signal amplitude. This means that adiabatic conditions prevail over the scanned area, which is an essential prerequisite for the effective interpretation of the thermoelastic effect induced temperature change. Although only one phase map is reported in this work, all other phase maps acquired from other samples, and at other load steps, presented similar features.
Figure 12,
Figure 13 and
Figure 14 show how all materials behaved in a pretty similar way for an equal load step. It is, in particular, reported that the typical features of the thermoelastic signal—pattern, amount of signal and proportionality to the applied load amplitude, phase distribution—were all found also in those load cycles positioned above the knee point. This is considered an important finding. In fact, it states that the behaviour of the cycling material in the CD region is still elastic, since the thermoelastic effect is activated by the reversible volume changes characterising a linear elastic deformation [
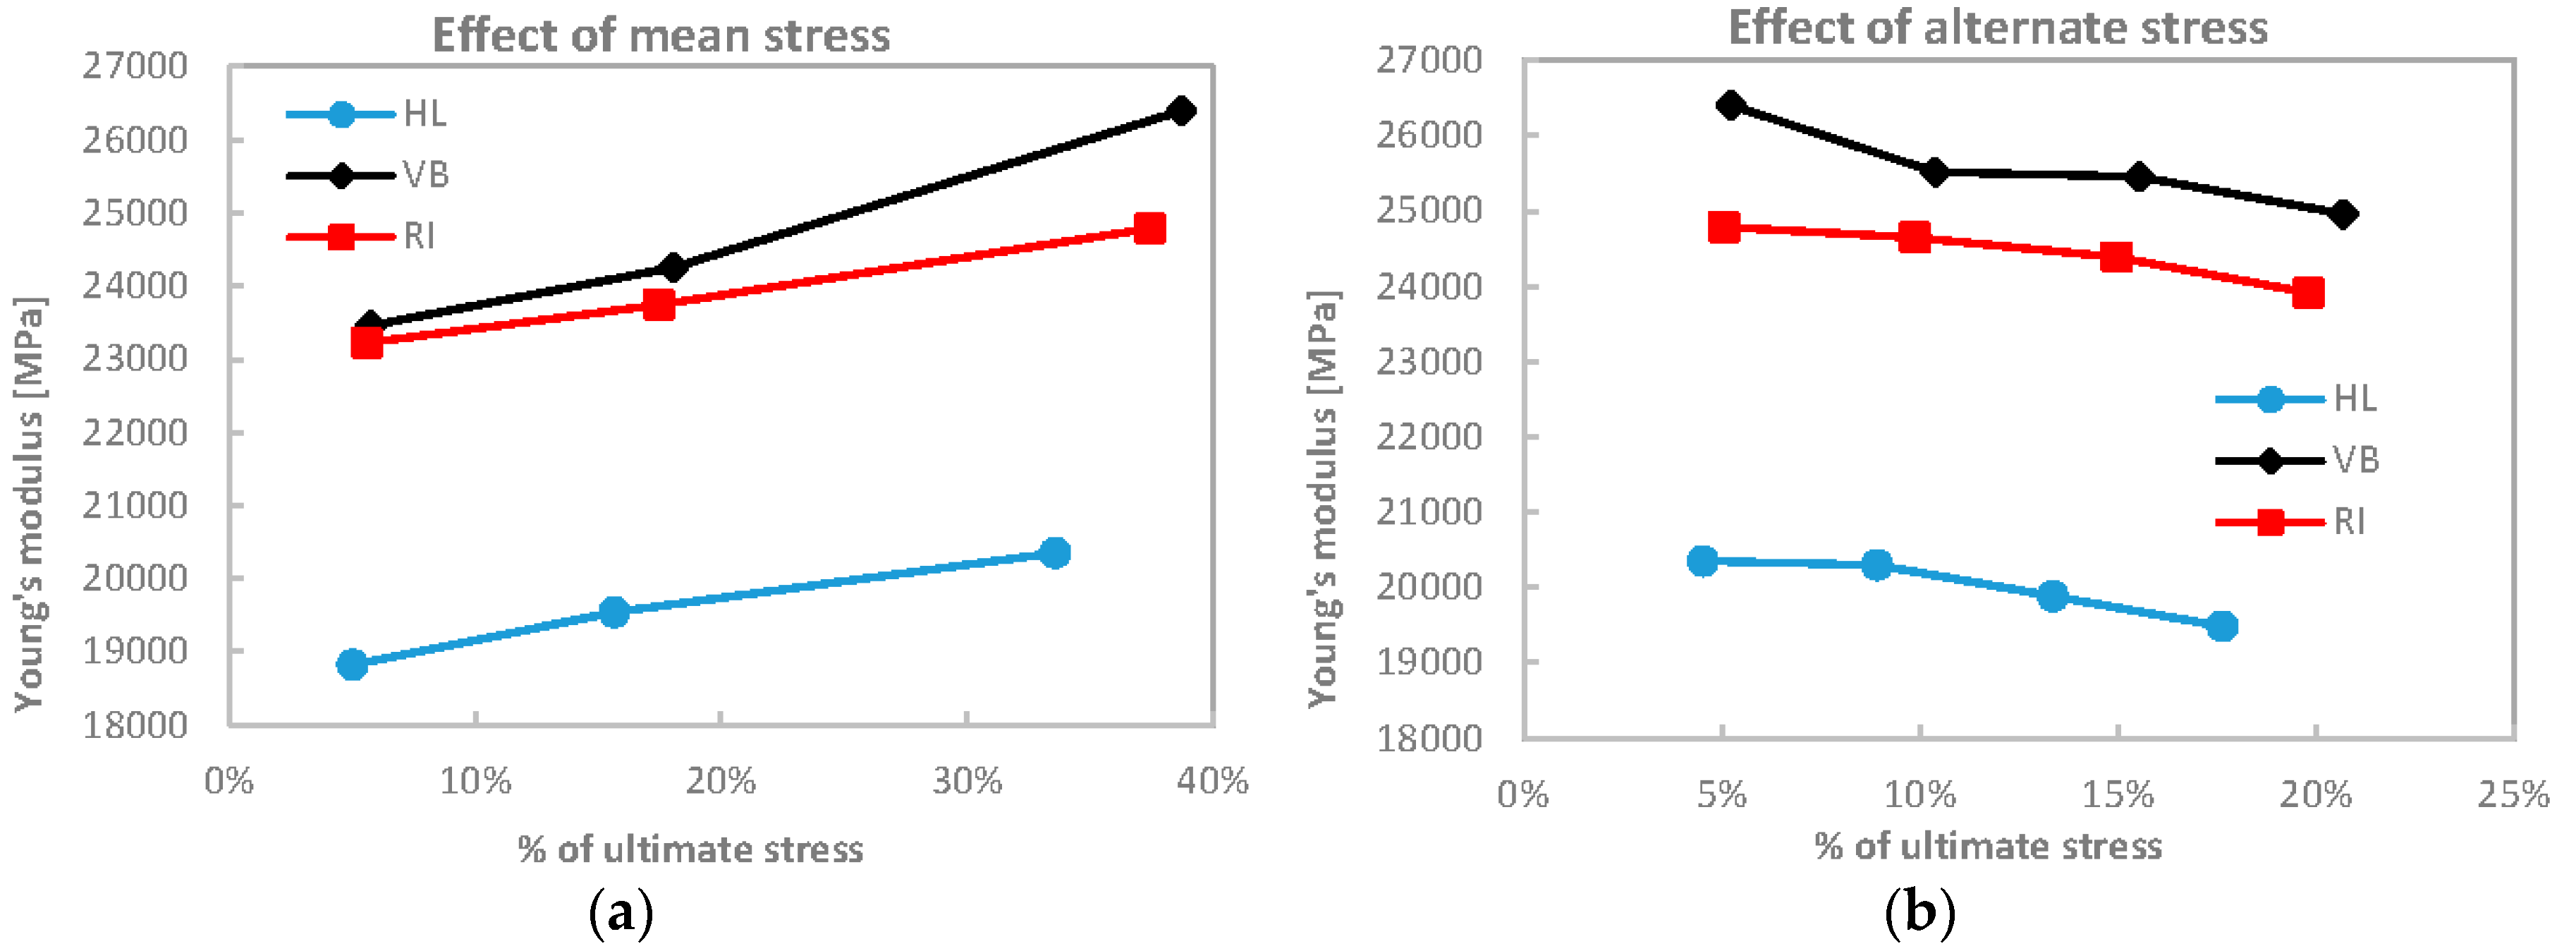
25]. Even if a complete unloading across the knee region would give rise to inelastic deformations, the materials seem to deploy a local elastic behaviour also in the post knee region. From a comparison of the thermoelastic signal maps, it is found that the signal is similar for load steps 1, 2 and 3, indicating a negligible influence of the mean load (as predicted by first order theories of the thermoelastic effect [
25]). As commented in
Section 3.3 and shown by
Figure 9, the material stiffness is similar during cycle steps 1–3, so an equal load amplitude will result in a similar stress amplitude, and then a similar thermoelastic signal. For load steps 3–6, which have the same average stress but increasing stress amplitude, the thermoelastic signal increases with the stress amplitude, while keeping the same chessboard pattern.
Figure 15 and
Figure 16 show the map of the second harmonic signal,
i.e., the temperature amplitude carried by the harmonic component at 8 Hz (twice the loading frequency of 4 Hz), obtained by the Fourier Transform Lock-In procedure by selecting a reference signal at 8 Hz [
30]. Some works have correlated the presence of dissipation effects to the increase of the second harmonic signal amplitude [
33]. This is, for instance, the basis of the Dissipation Mode (D-Mode) analysis proposed by TSA software Altair LI and Thesa by Flir
®.
Figure 15 in particular shows maps of the second harmonic component for all six load steps from an HL sample, while
Figure 16 reports the same maps for VB and RI only for loading steps 3 and 5.
Figure 15 in particular shows that the second harmonic signal for the HL material is practically null for loading steps 1–4. A response is starting to develop at load step 5 and consolidates at step 6, even though the amplitude of such signal is much lower than the first harmonic (
i.e., the thermoelastic signal), and in the order of 0.01 °C.
Figure 16 shows the second harmonic response for the other materials VB and HL, revealing a similar behaviour with HL. This second harmonic response at load step 6 can be regarded as an indication that some dissipative effects start to occur in the material. In this regard, it is interesting to report that the load cycles of step 6 showed a small but easily observed hysteresis area, which was instead absent or negligible during the other lower amplitude cyclic loading steps.
5. Conclusions
The present work has investigated the tensile behaviour of quasi-unidirectional Flax Reinforce Epoxy Matrix composites. The investigated materials use the same commercial plain fabric, made of twisted yarn reinforcements, and are fabricated by three traditional lamination processes giving rise to different fibre volume fractions.
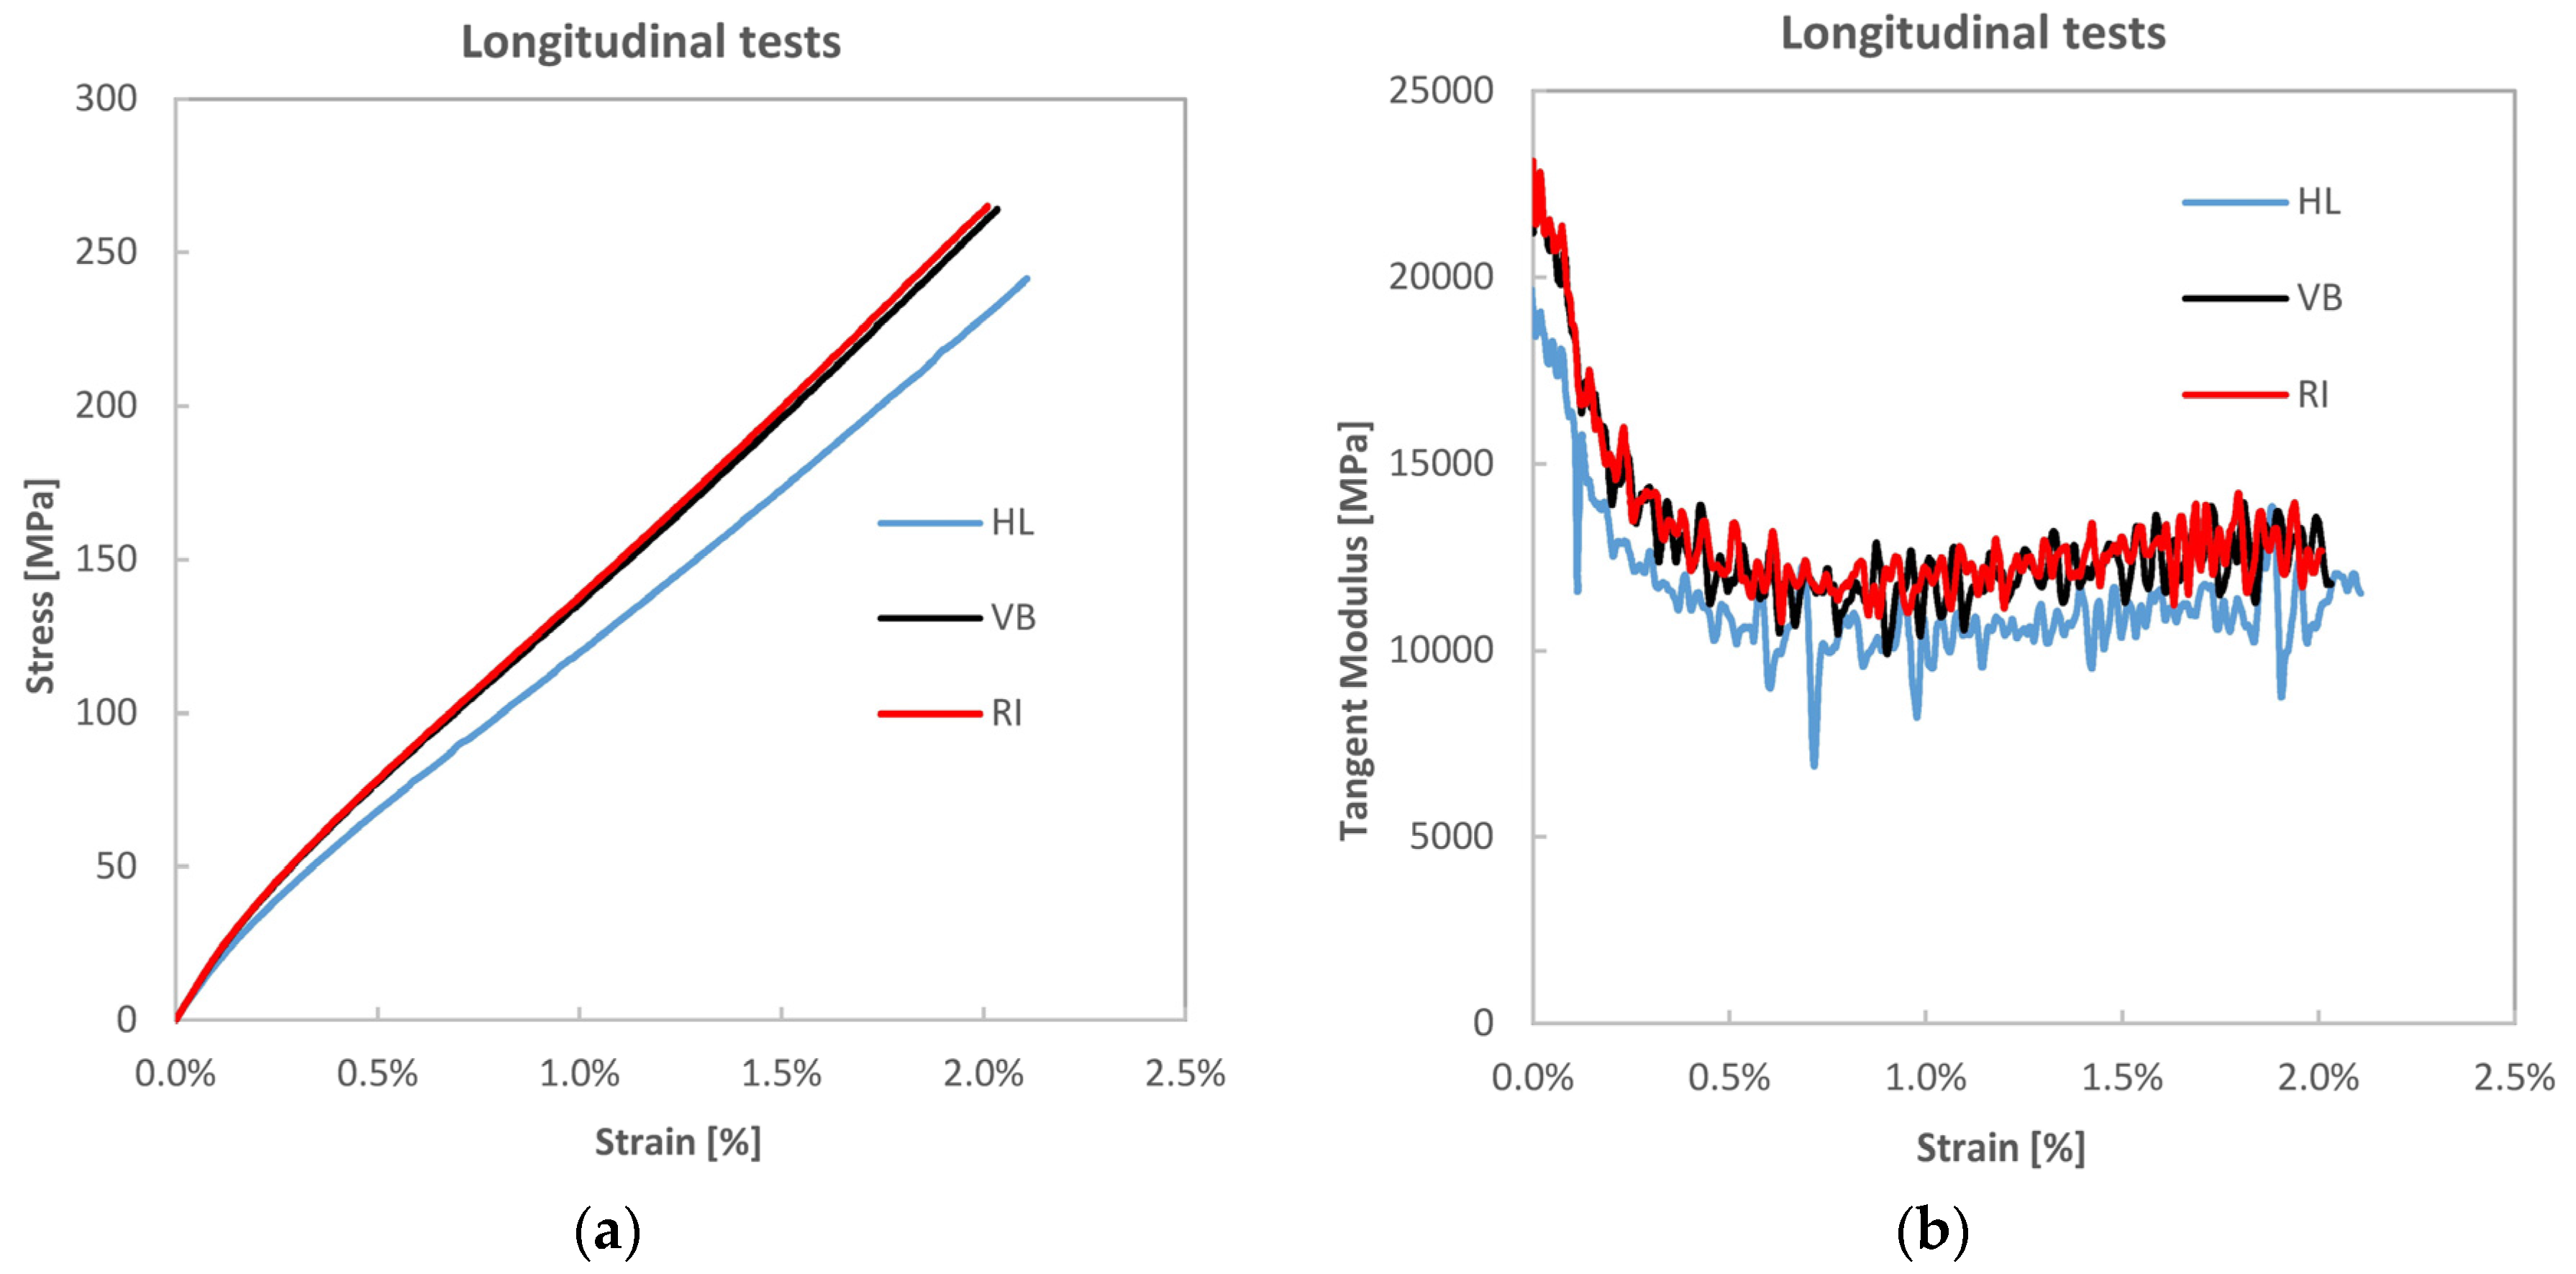
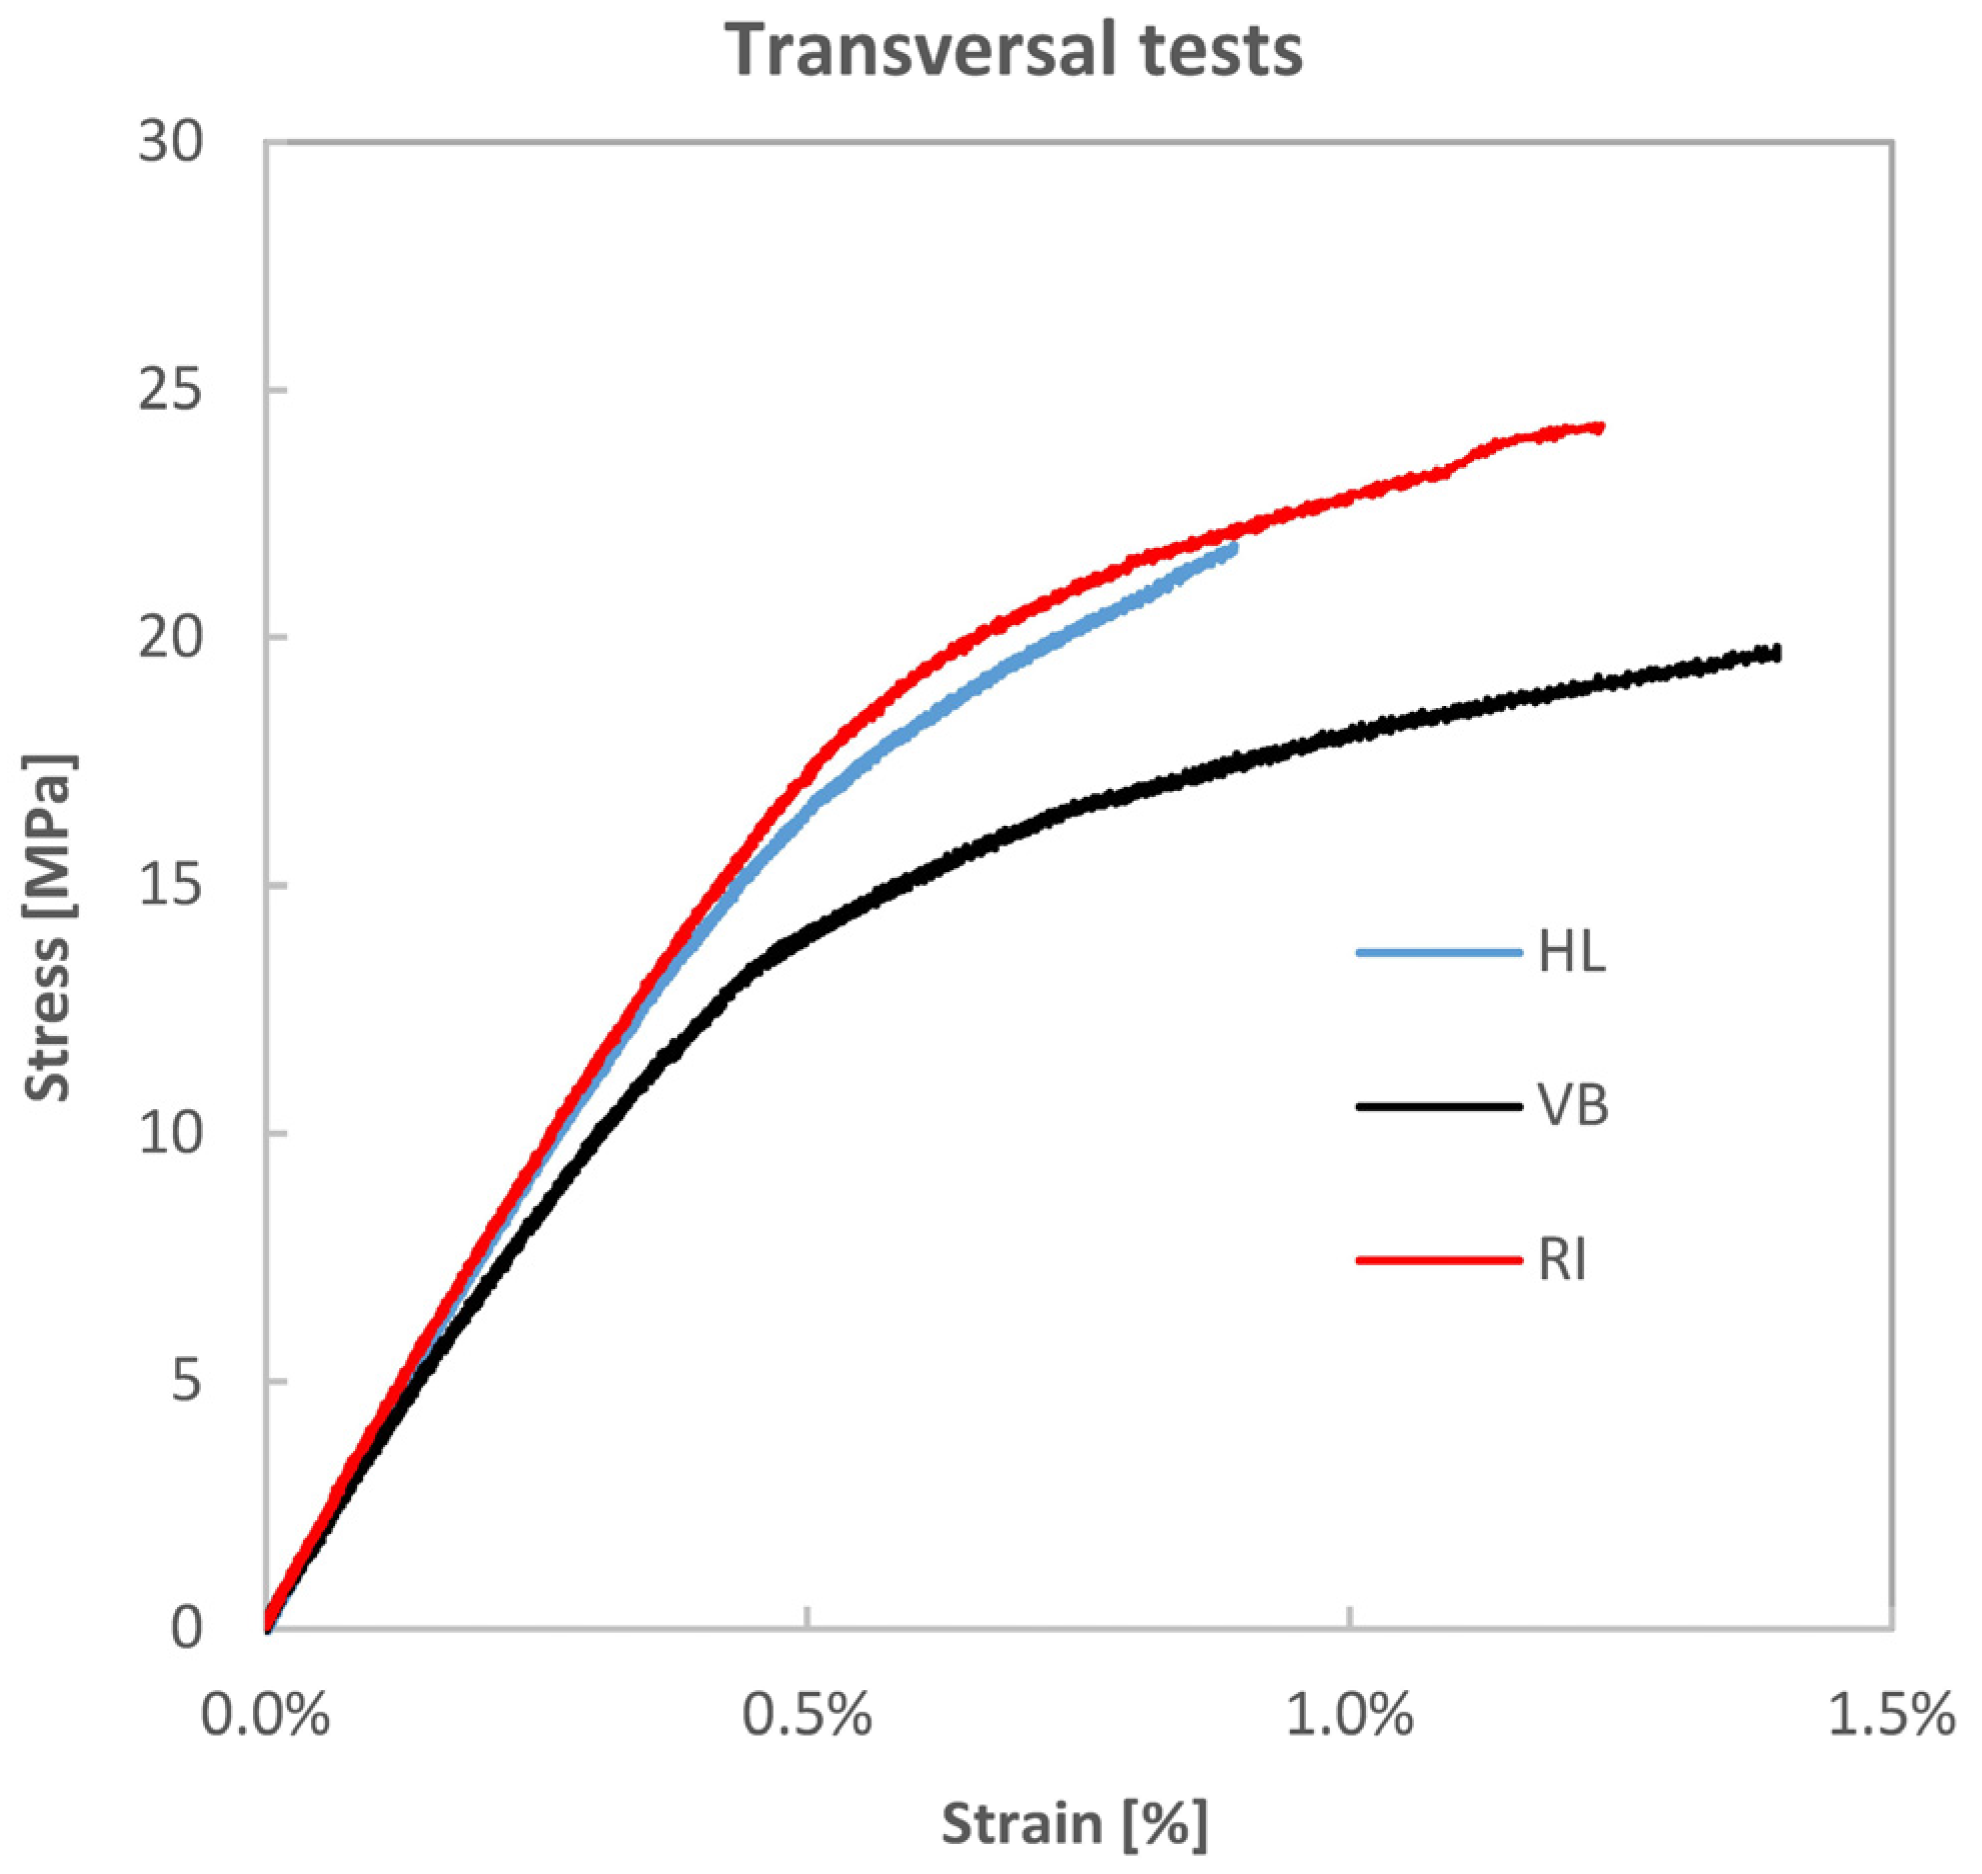
The measured tensile behaviour in the reinforcement direction has revealed the typical bilinear behaviour already reported in the literature for similar materials, where the stiffness modulus undergoes a rather marked reduction at low stress/strain values, to then proceed quasi-linearly until the onset of brittle failure.
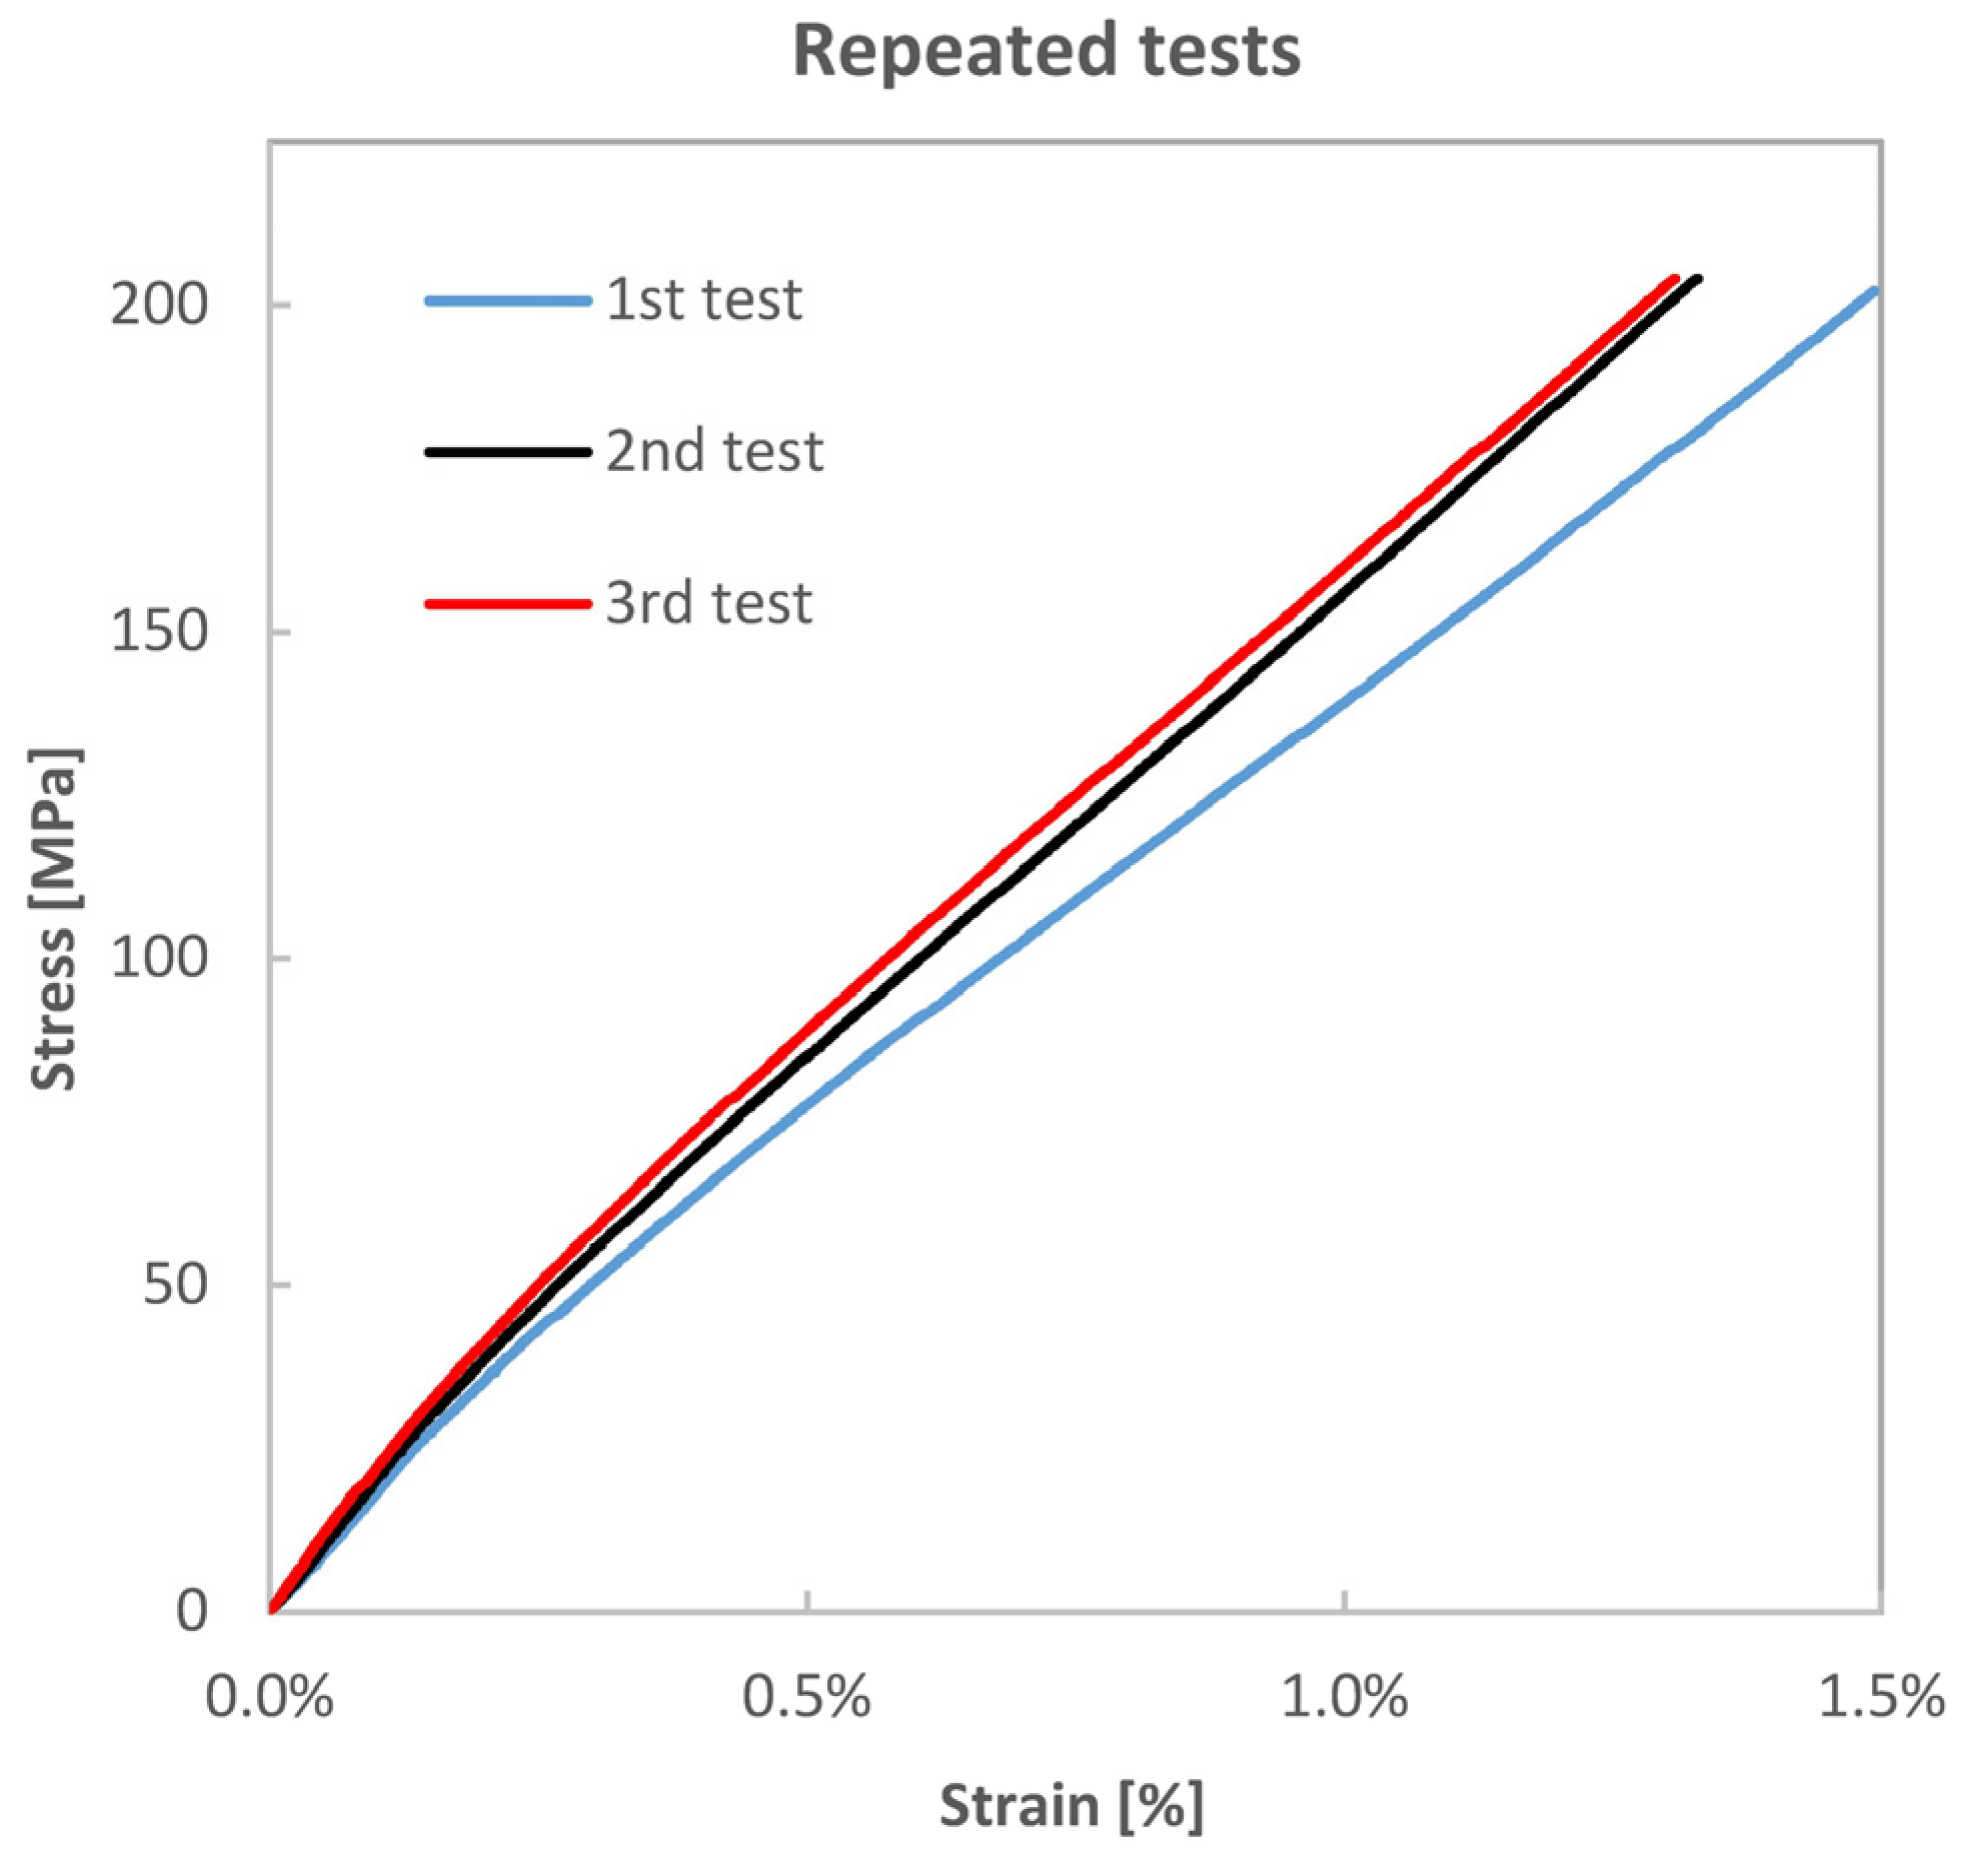
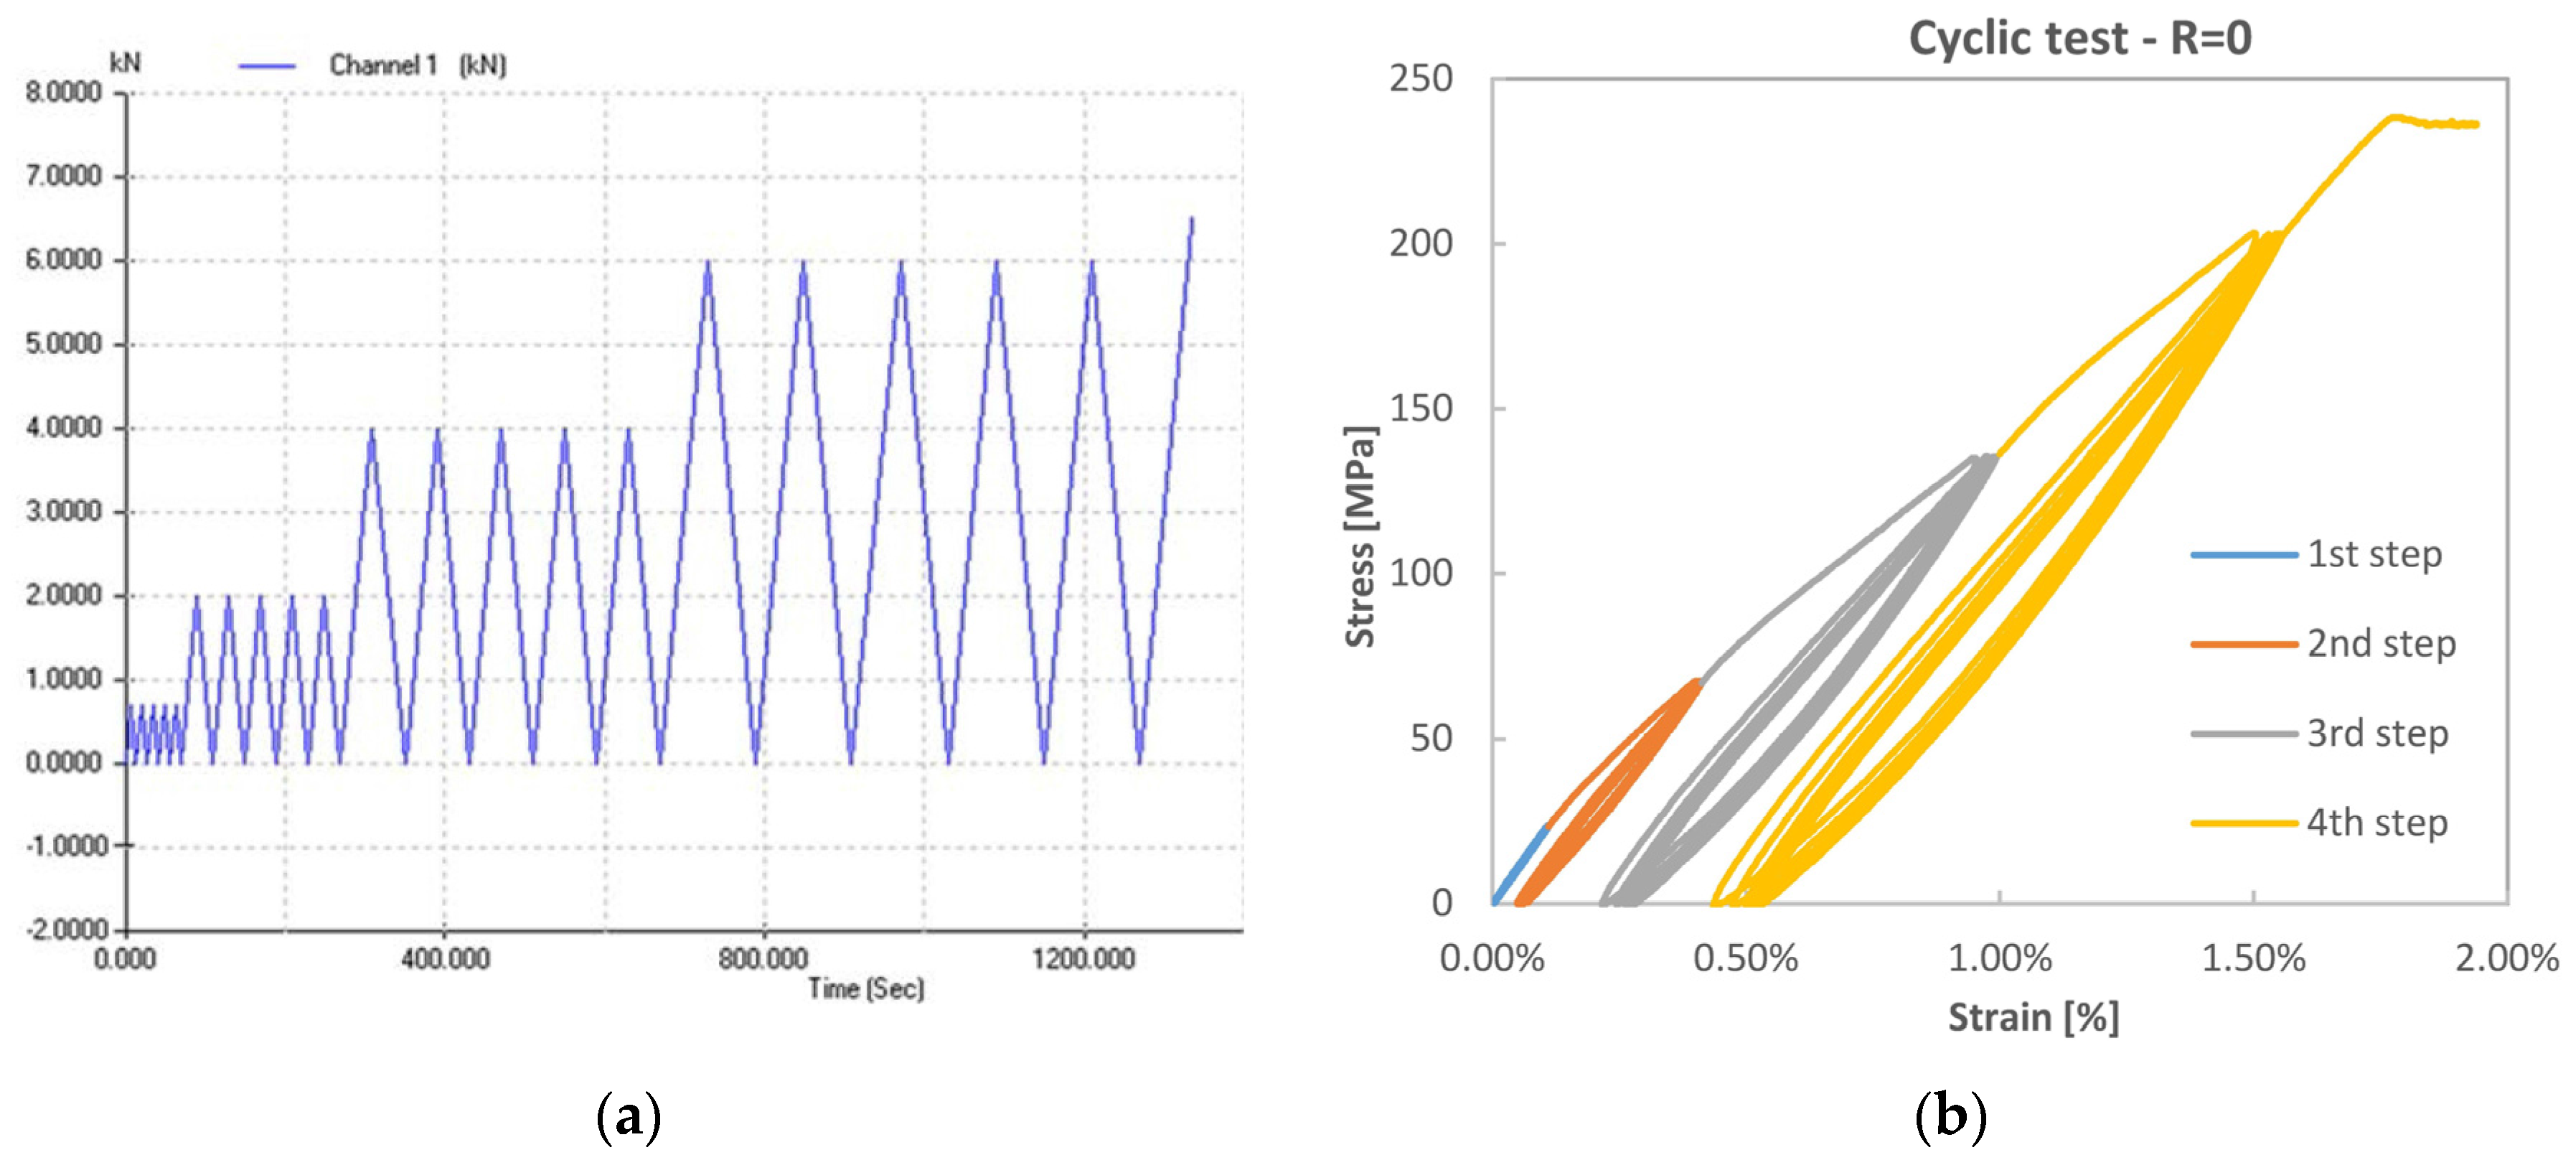
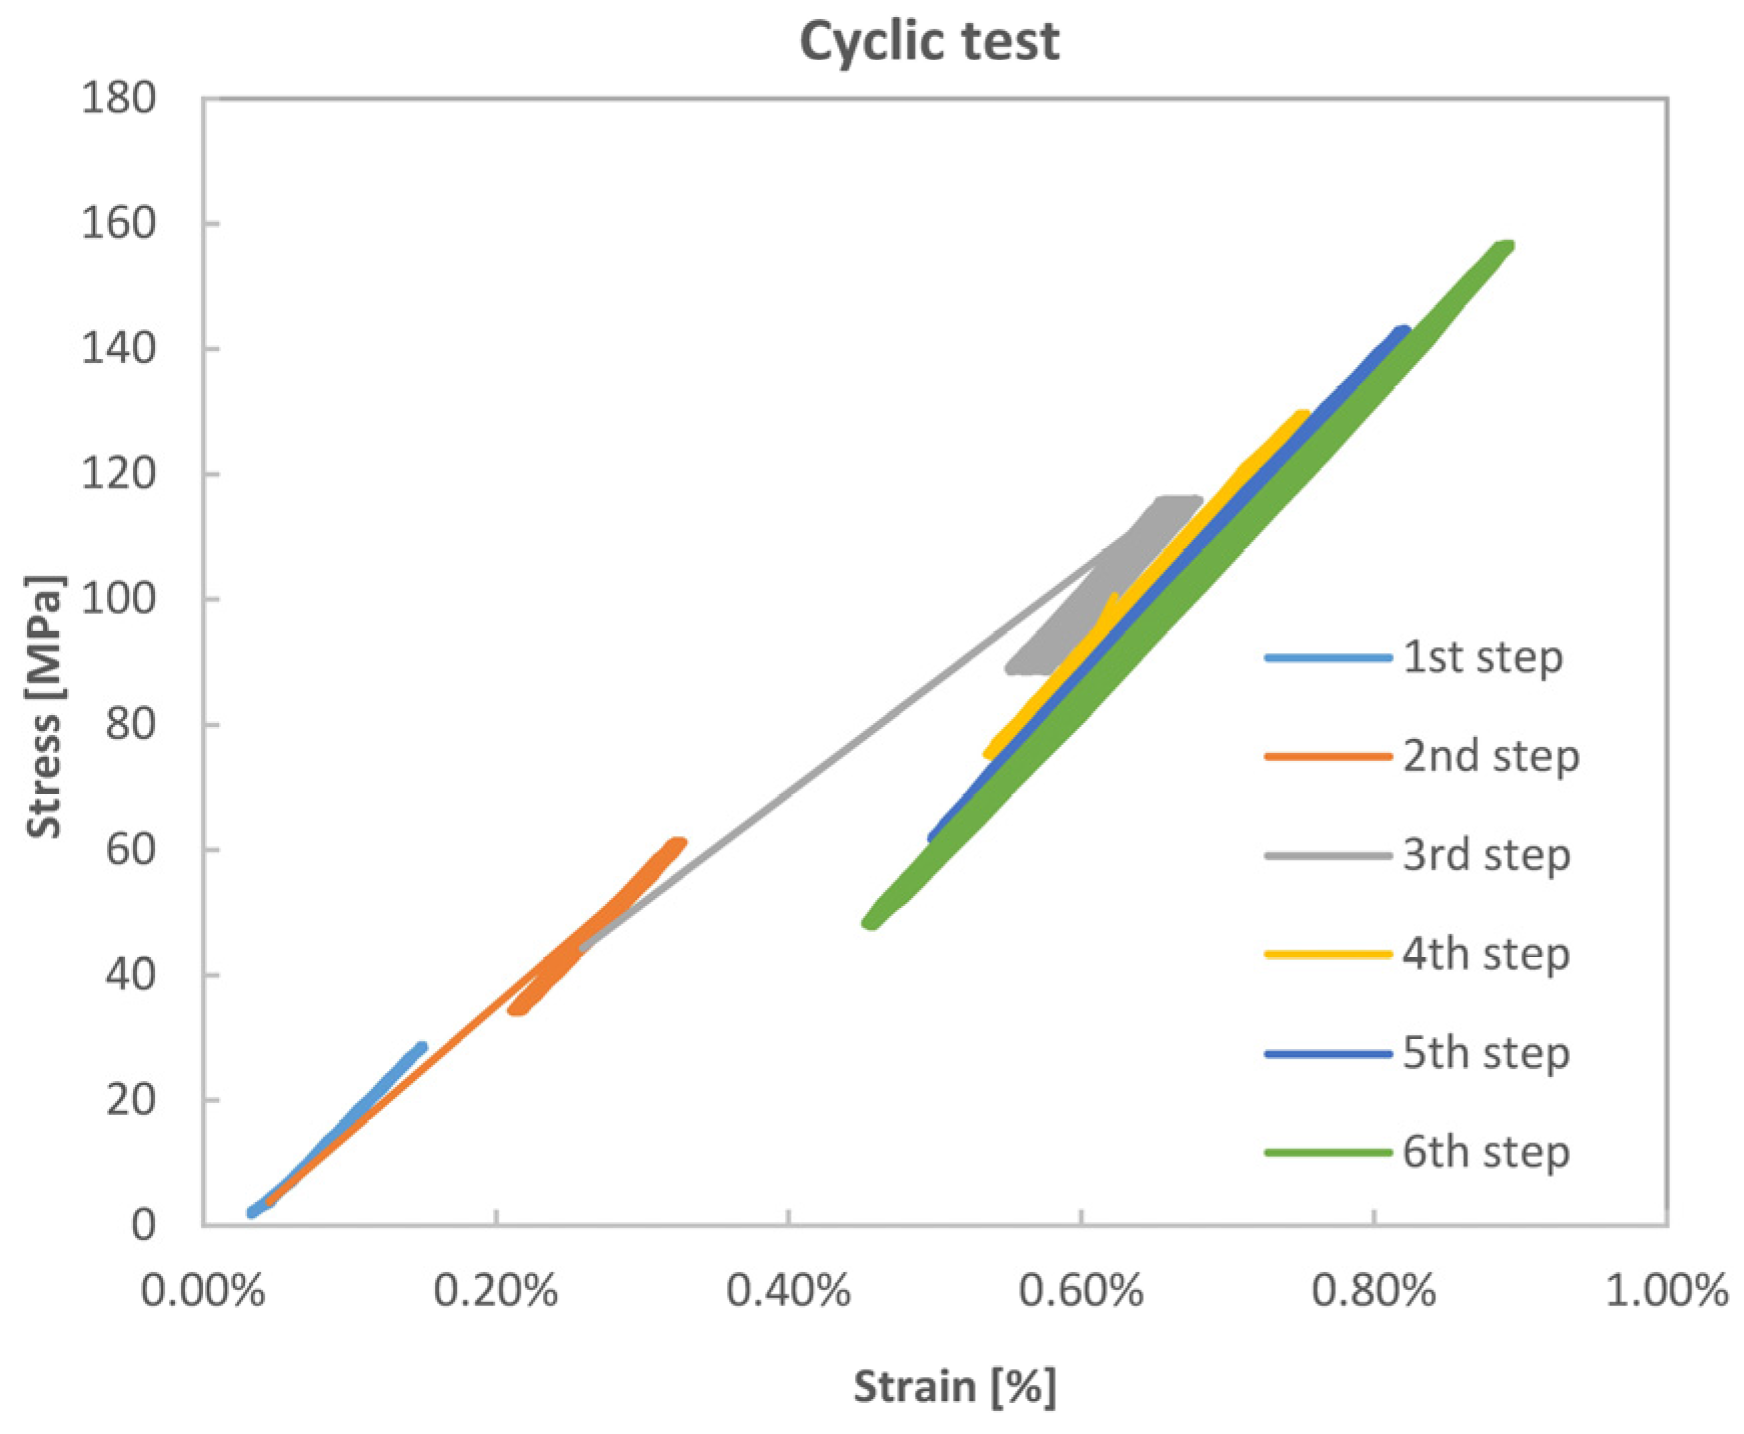
Repeated loading separated by a recovery period between each test has shown a significantly different behaviour compared to continuous quasi-static loading-unloading cycling. In particular, in the first case, the knee zone seems to change little, and a stiffness hardening is observed, which stabilises after a few loading repetitions. In the second case, a marked inelastic final deformation is obtained at complete unloading, and the stiffness during cycling is higher than that during monotonic loading. In addition, the cycles show a marked hysteresis. It is believed that such different features of the different reloading modes are due to marked intrinsic viscoelastic behaviour of the elementary flax fibres, activated by localised kink band defects as well as by Micro-Fibril-Angle rotations. Higher strain rate cycles lying within the linear portions of the monotonic tensile curve have instead exhibited a local elastic behaviour, with negligible hysteresis and stiffness levels comparable to the initial higher Young’s modulus.
IR thermography has been proposed to monitor the full field temperature evolution during the monotonic and fatigue cycling tensile tests. In the first case, the temperature is initially decreasing linearly due to the onset of the thermoelastic effect. A departure from linearity, associated with the onset of dissipative damage phenomena, has been detected at values of strain well above those of the nonlinear region of the tensile curve. Therefore, whatever produces the non-linear knee region does not seem to have a significant effect in terms of irreversible dissipative heating.
The sampling of temperature during the fatigue cycles has led to the evaluation of the Thermoelastic Signal, according with the procedure developed through Thermoelastic Stress Analysis. The features of the measured thermoelastic signal agree well with the nature of the thermoelastic effect in linear elastic materials. It is then concluded that, even in the post-knee region, and at least for the relatively high strain rates of fatigue cycling (specifically 4 Hz in the present work), the material behaves linearly elastic, at least locally and for load amplitudes not crossing the knee point region. Finally, the derivation of the second harmonic signal has been proposed as a promising approach to detect the load amplitude threshold at which dissipative damage phenomena start to occur.


