3.1. Compressive Performance
Compressive strength
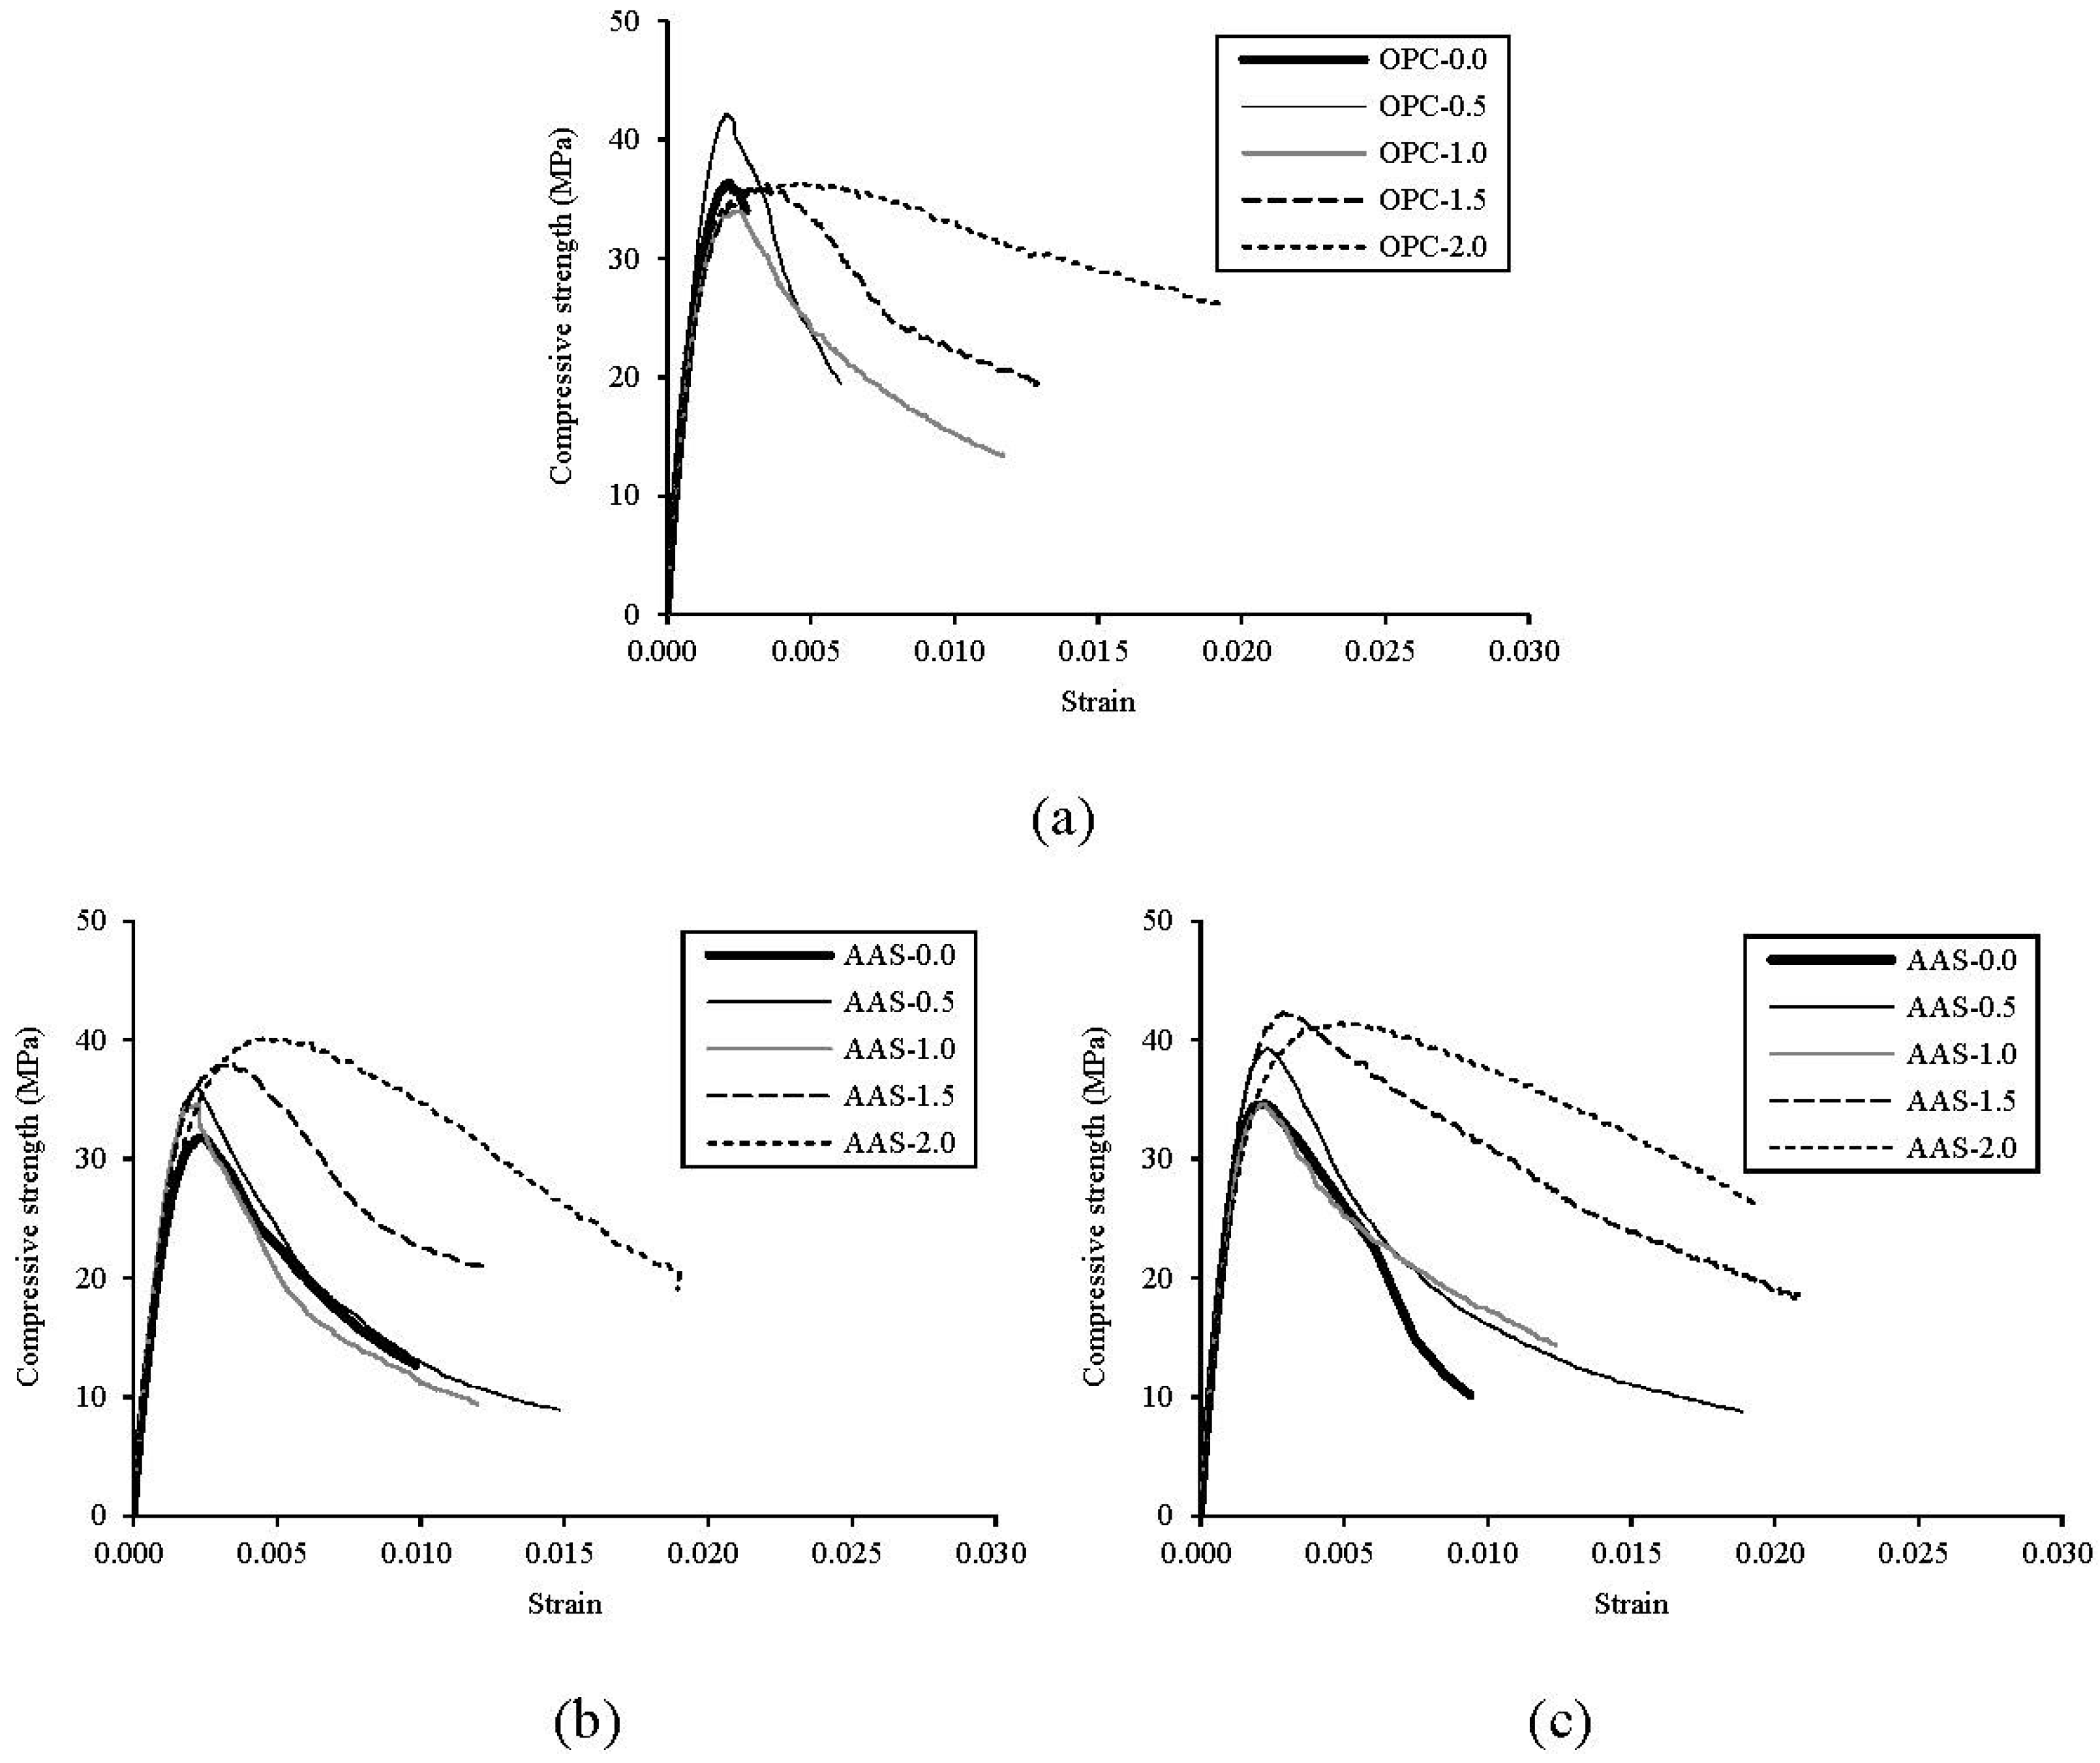
versus strain curves of OPC, AAS-dry, and AAS-wet specimens at 28 days with different fiber contents are presented in
Figure 2. The average curves were drawn from the three test results for each mix. The error in the measurement was calculated as the standard deviation of the compressive strength from three samples. The maximum standard deviations in the compressive strength were 1.56, 2.45, and 3.05 MPa at 3, 7, and 28 days, respectively. As seen in
Figure 2a, the descending curve of OPC-0.0 specimen has almost vanished due to brittle failure right after peak stress, whereas the other OPC specimens with fiber and all of the AAS specimens have various descending curves as seen in
Figure 2a,b. As the steel fiber volume fraction increases, the curve after peak stress descended slowly. It can be inferred that the compressive failure mode of concrete changed from a brittle to a more ductile failure due to the steel fiber inclusion. The effect of steel fibers on the compressive strength of AAS concrete is more noticeable in case of higher fiber inclusion [
5]. Karunanithi and Anandan (2014) reported that the increase of steel fiber inclusion improved the compressive strength of AAS concrete [
16]. As shown in
Figure 2b,c, AAS-wet specimens exhibit more stable post behavior than AAS-dry specimens. It reflects that water-curing enhances the bond properties in the interfacial zone between fibers and the matrix phase for AAS binders compared to dry-curing.
Figure 2.
Stress-strain curves of test specimens at 28 days. (a) OPC-wet; (b) AAS-dry; (c) AAS-wet.
Figure 2.
Stress-strain curves of test specimens at 28 days. (a) OPC-wet; (b) AAS-dry; (c) AAS-wet.
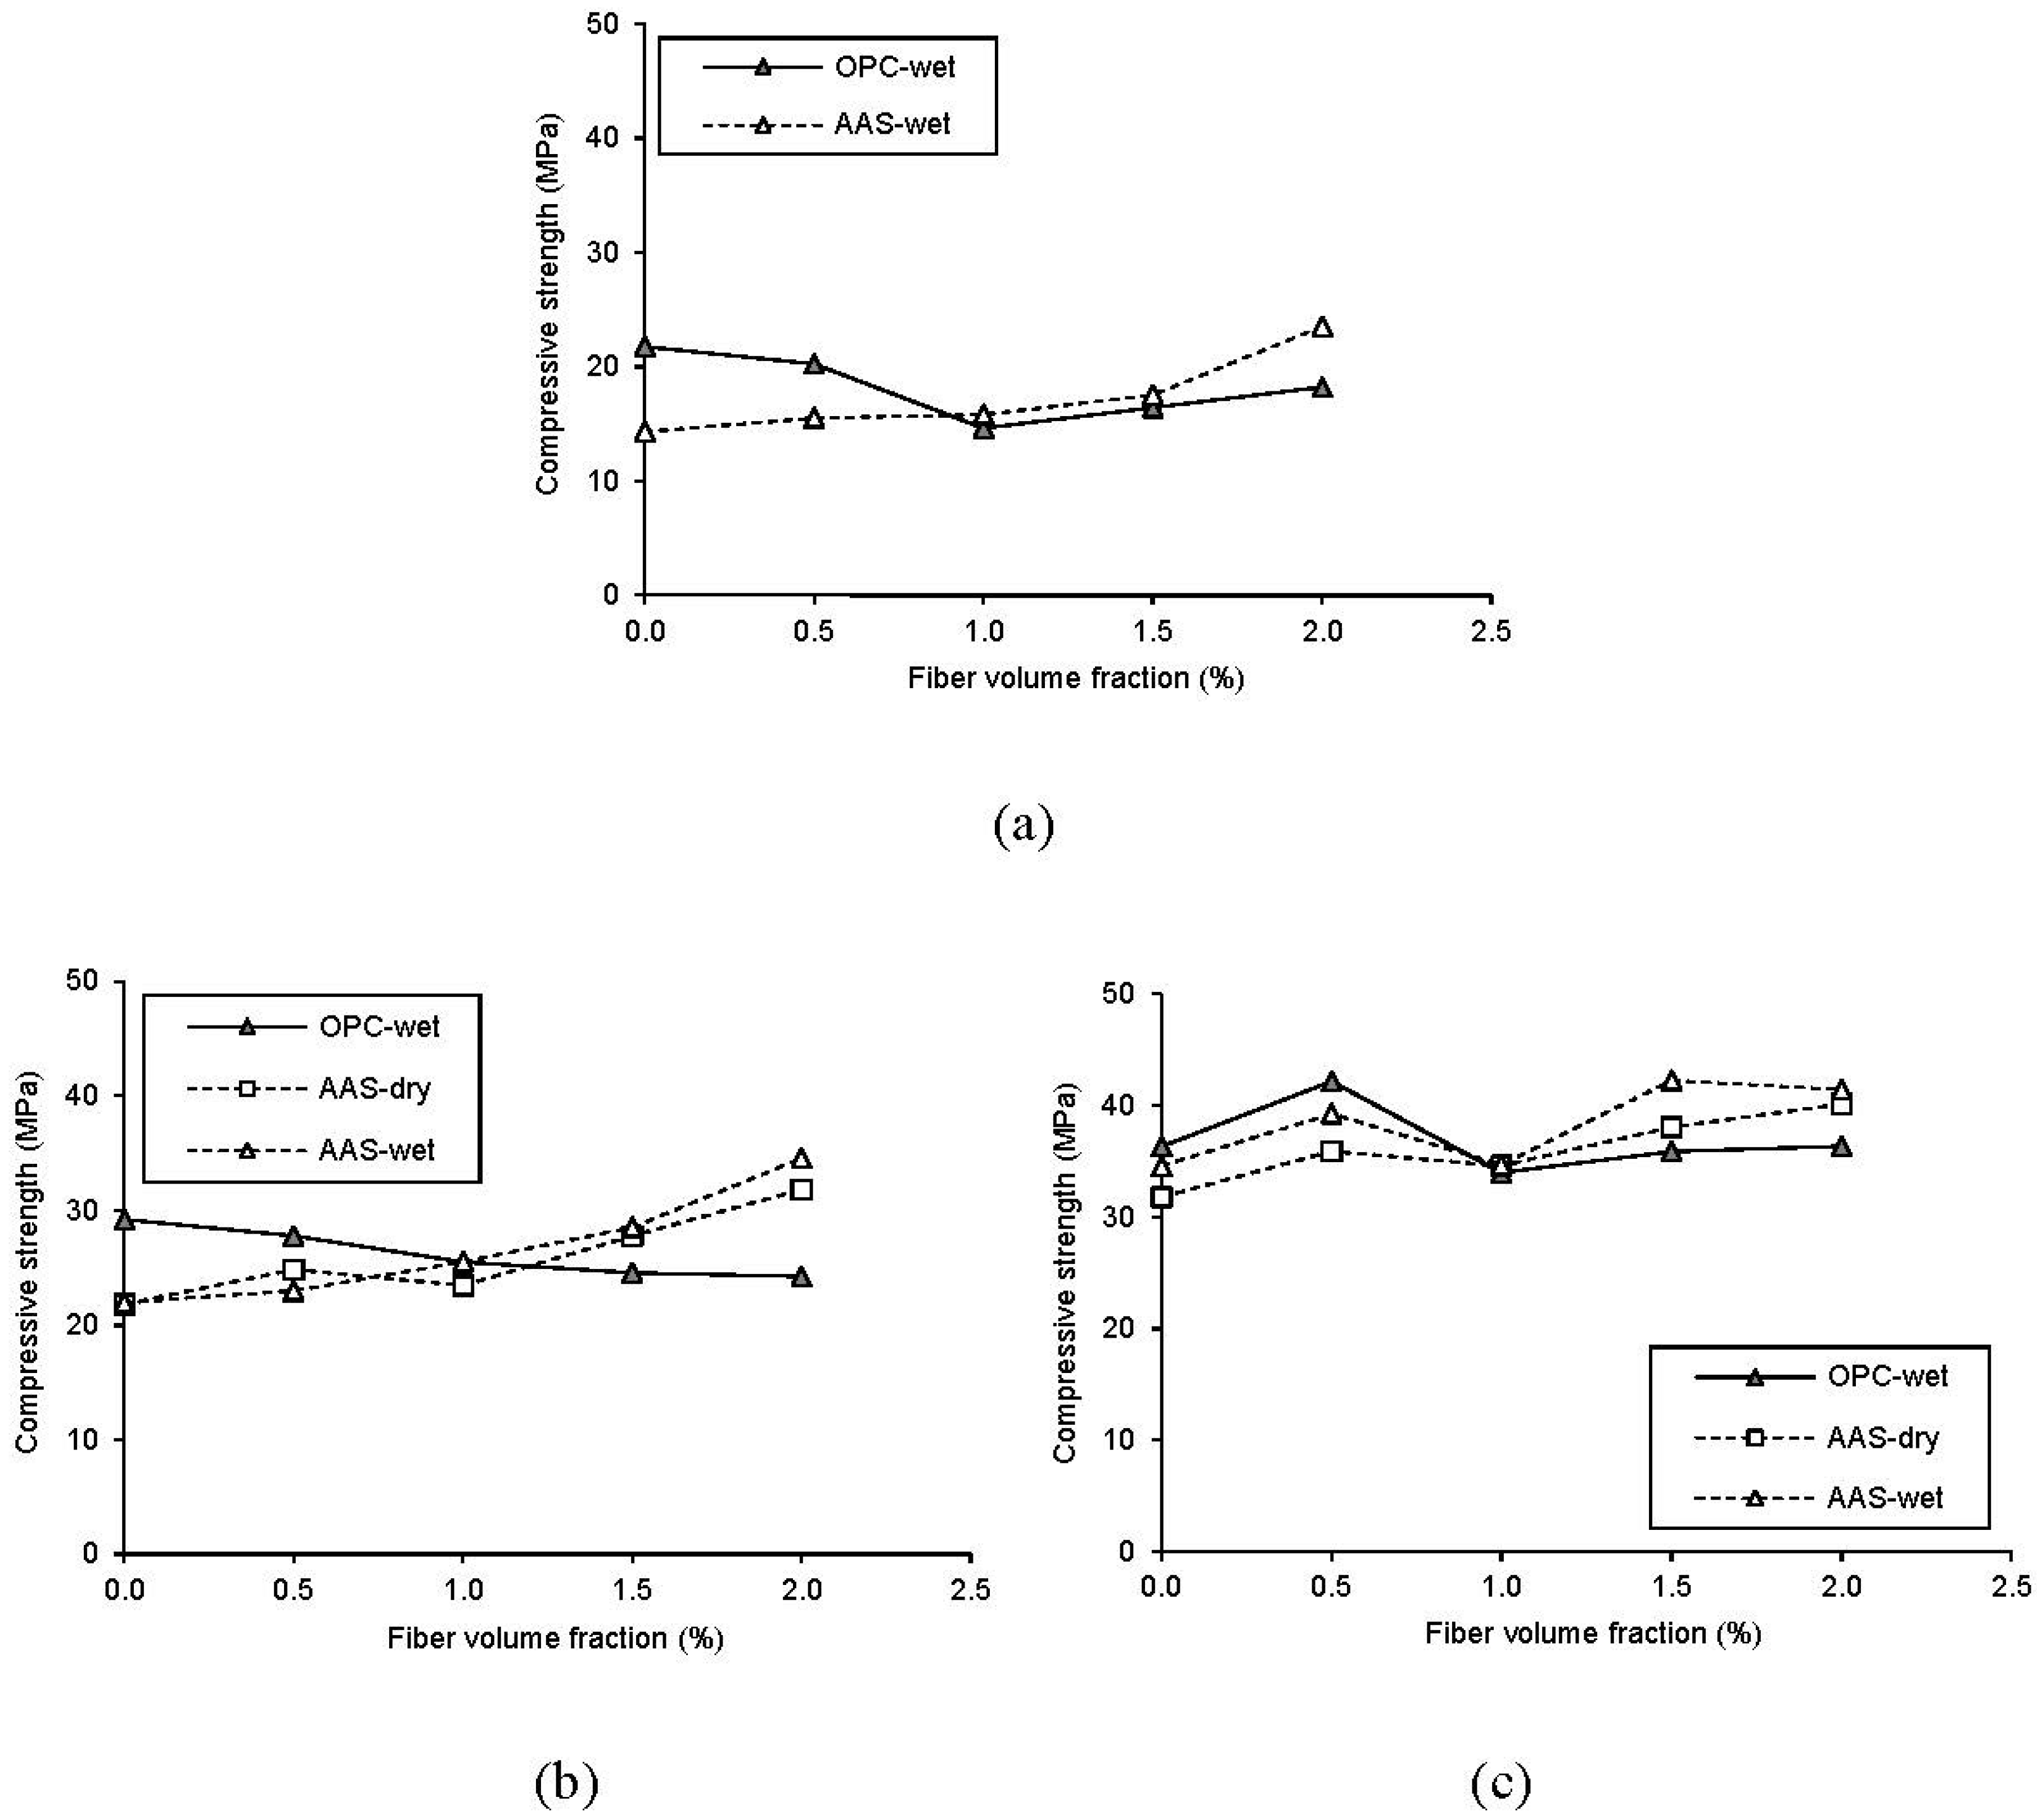
The effects of fiber inclusion on the compressive strengths with age are presented in
Figure 3. Until 7 days, OPC-0.5 specimen shows a little less strength than OPC-0.0. At 28 days, however, OPC-0.5 specimens show higher compressive strength value than OPC-0.0. For OPC specimens with over 1.0% of fiber volume fraction, there is no noticeable increase in the compressive strength compared to OPC-0.0 specimen. It is thought that the steel fibers were not effectively dispersed in concrete when mixing. However, compressive strength values of AAS specimens have significantly increased by fiber inclusion. At 28 days, the addition of steel fibers in AAS concrete has a significant effect on the enhancement of the compressive strength by 1.9%–17.8%. In addition to the fiber inclusion, the compressive strength development of concrete is affected by curing methods; it is clear that water-curing is more efficient for the strength development of concrete than dry-curing as shown in
Figure 3b,c.
Figure 3.
Compressive strength development with age (a) 3 days; (b) 7 days; (c) 28 days.
Figure 3.
Compressive strength development with age (a) 3 days; (b) 7 days; (c) 28 days.
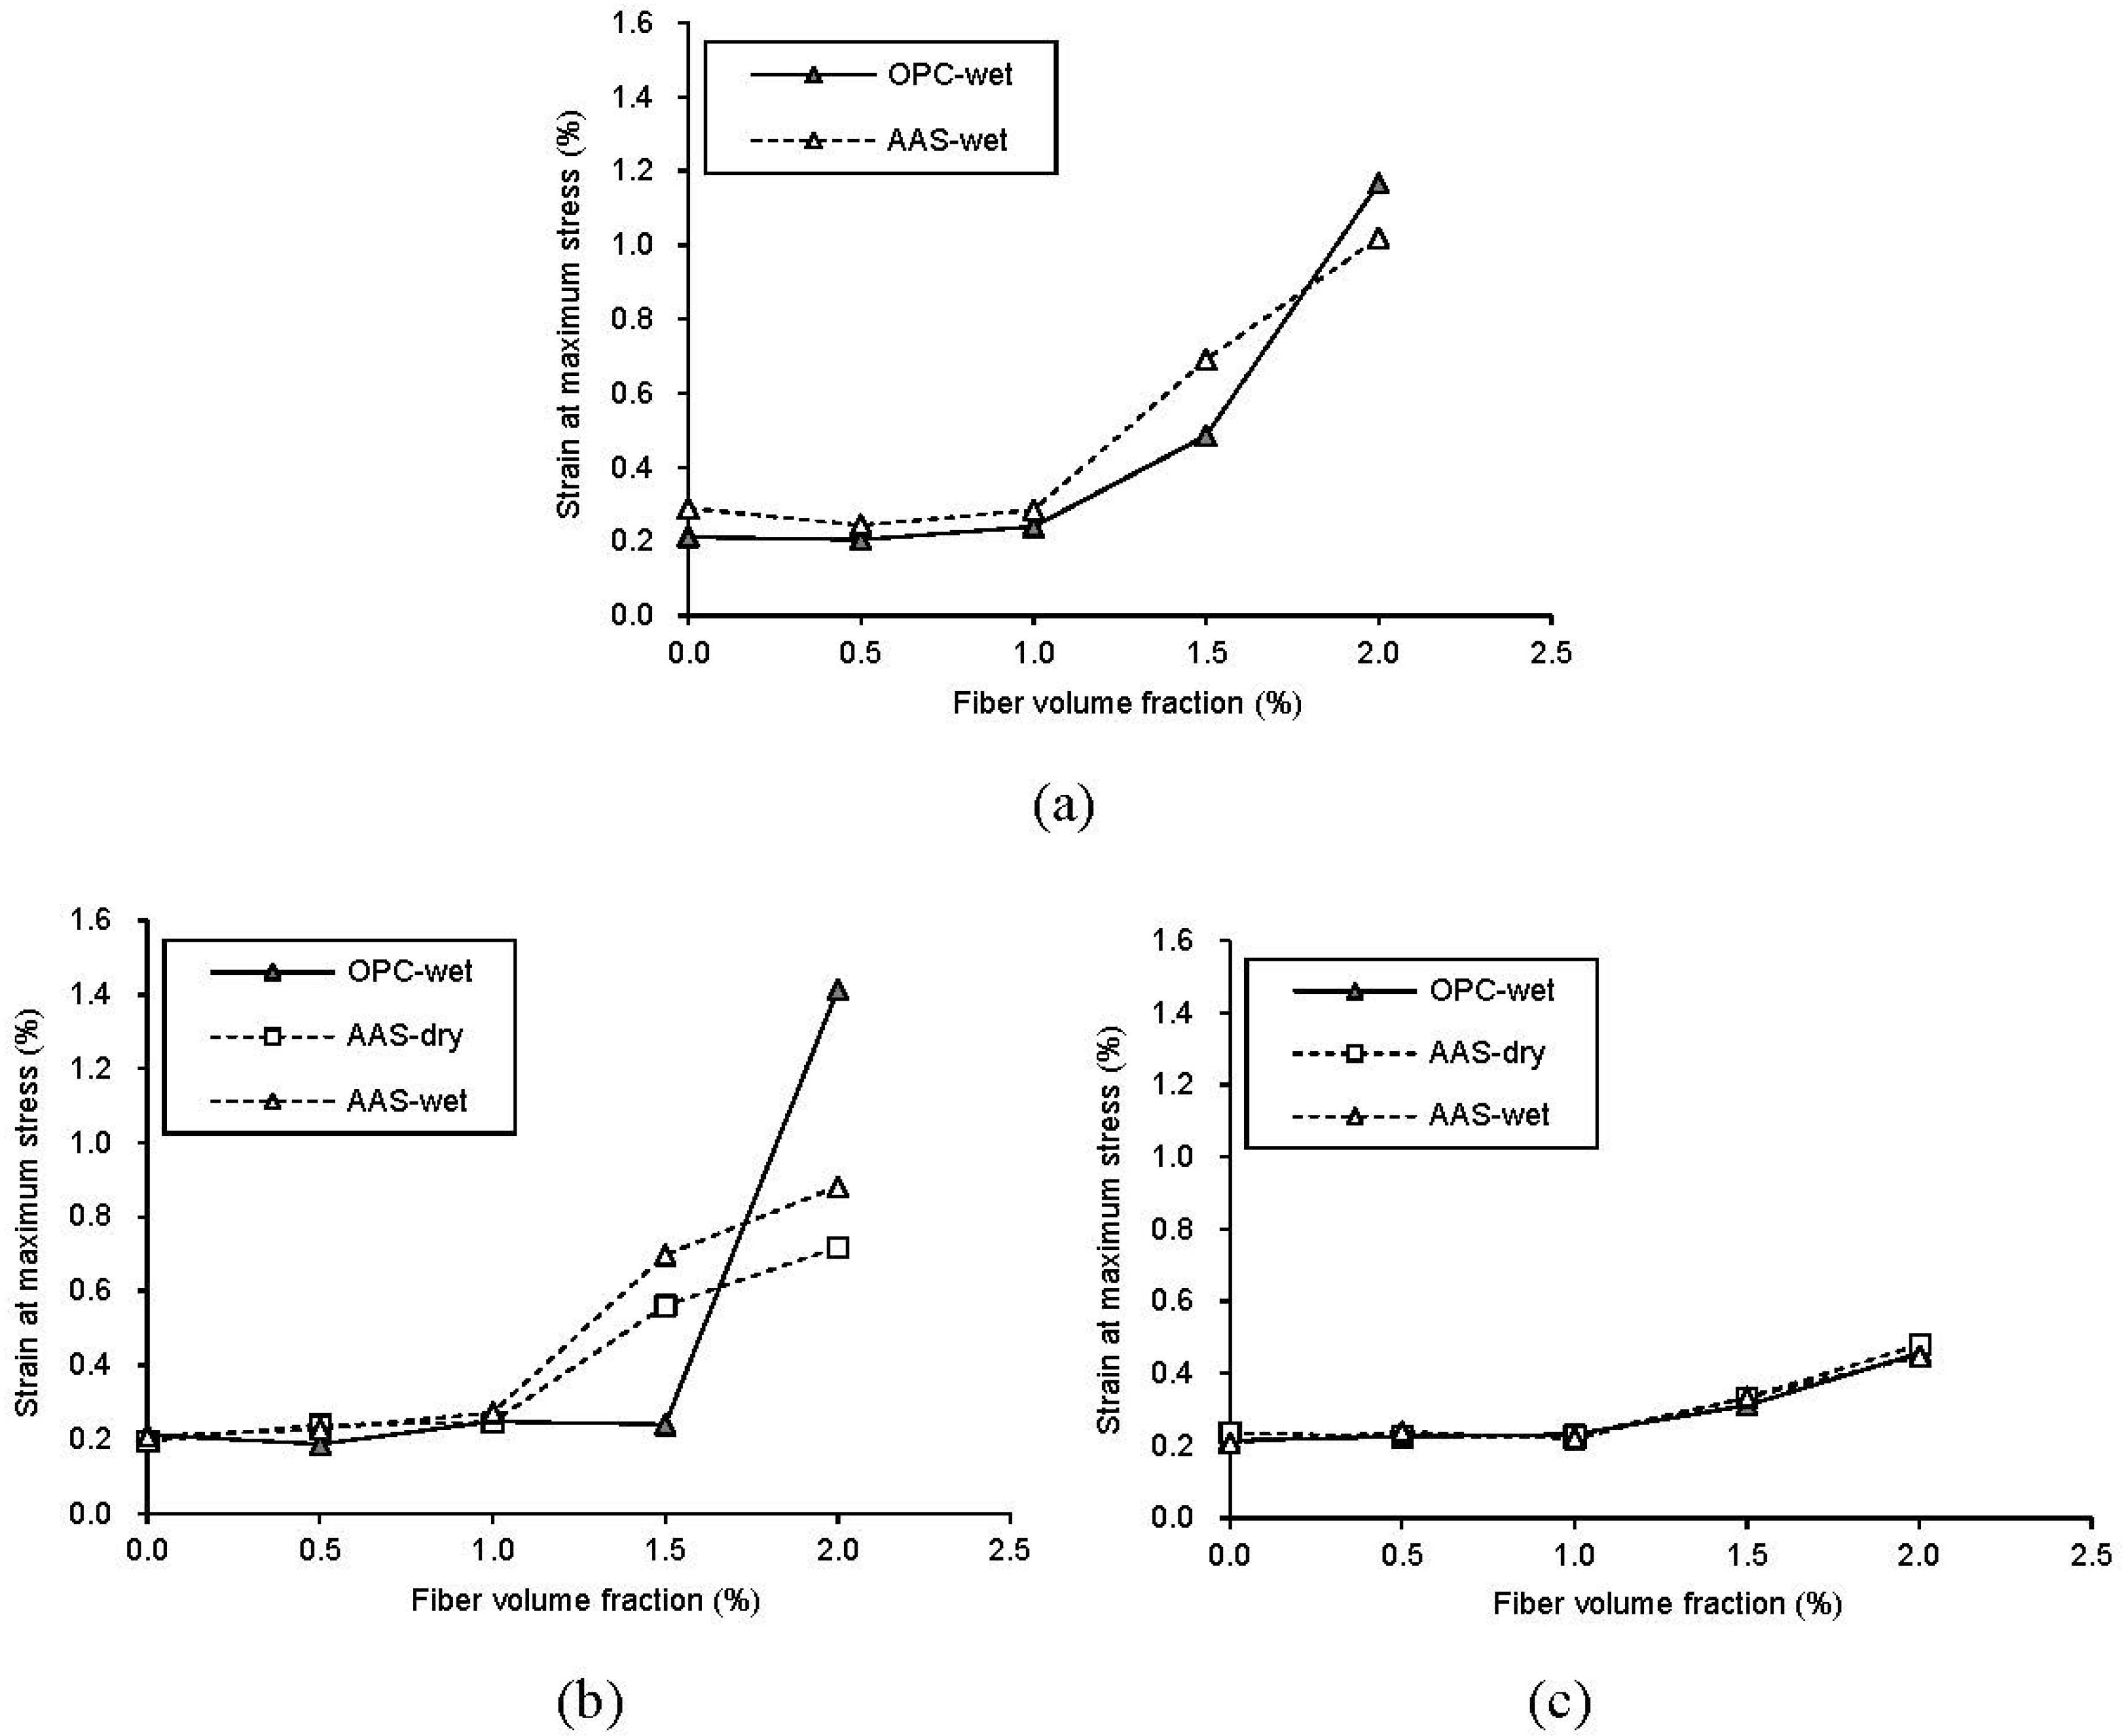
Figure 4 shows the effect of fiber inclusion on the strain at maximum stress of concrete at each age. As shown in the figure, the strain value has a tendency to decrease with the age of concrete as expected. From the results for strain at each age, except OPC specimens at 7 days, all specimens show a similar trend in the strain increase ratio, so it can be inferred that the effect of binder type on the strain capacity of concrete is negligible. For curing method, the increase ratio on the strain of AAS concrete is similar between dry- and wet-curing. For strain values at 7 days, regardless of curing methods, the AAS-1.5 specimen showed a noticeably higher strain than OPC. The compressive test results are summarized in
Table 4.
Figure 4.
Variation of compressive strain at maximum stress with age. (a) 3 days; (b) 7 days; (c) 28 days.
Figure 4.
Variation of compressive strain at maximum stress with age. (a) 3 days; (b) 7 days; (c) 28 days.
Table 4.
Compressive test results.
Table 4.
Compressive test results.
| Specimens | Compressive Strength (MPa) | Strain at Max. Compressive Strength (%) |
|---|
| 3 Days | 7 Days | 28 Days | 3 Days | 7 Days | 28 Days |
|---|
| Wet | Dry | Wet | Dry | Wet | Wet | Dry | Wet | Dry | Wet |
|---|
| OPC-0.0 | 21.7 | - | 29.2 | - | 36.3 | 0.212 | - | 0.211 | - | 0.214 |
| OPC-0.5 | 20.2 | - | 27.8 | - | 42.2 | 0.205 | - | 0.186 | - | 0.225 |
| OPC-1.0 | 14.6 | - | 25.5 | - | 34.0 | 0.241 | - | 0.247 | - | 0.231 |
| OPC-1.5 | 16.4 | - | 24.5 | - | 35.9 | 0.486 | - | 0.239 | - | 0.311 |
| OPC-2.0 | 18.2 | - | 24.2 | - | 36.4 | 1.167 | - | 1.413 | - | 0.457 |
| AAS-0.0 | 14.3 | 21.8 | 22.0 | 31.8 | 34.6 | 0.290 | 0.195 | 0.209 | 0.236 | 0.207 |
| AAS-0.5 | 15.5 | 24.8 | 23.0 | 35.9 | 39.3 | 0.245 | 0.238 | 0.227 | 0.225 | 0.238 |
| AAS-1.0 | 15.8 | 23.4 | 25.5 | 34.6 | 34.7 | 0.285 | 0.246 | 0.272 | 0.228 | 0.219 |
| AAS-1.5 | 17.5 | 27.8 | 28.5 | 38.1 | 42.3 | 0.692 | 0.561 | 0.697 | 0.333 | 0.334 |
| AAS-2.0 | 23.5 | 31.8 | 34.6 | 40.1 | 41.4 | 1.020 | 0.719 | 0.883 | 0.480 | 0.447 |
The compressive strength values of AAS concrete were significantly increased by fiber inclusion whereas OPC concrete shows no noticeable change in the compressive strength. It can be noted that lateral confinement by steel fiber is improved due to the smaller particle size of GGBS compared to OPC. Furthermore, the increase ratio in compressive strength for AAS concrete with wet-curing is higher than that with dry-curing. This indicates that wet-curing enhances the bonding properties between fiber and mortar phase for AAS based binders.
Figure 5 shows SEM micrographs of the steel fiber–matrix transition zone. From the micrographs in the figure, it is clear that using AAS binder turns the surface of the steel fiber from smooth to coarse. The SEM micrographs also confirmed that the bond property in the interfacial zone between steel fibers and matrix phase for AAS binders is better than that for OPC based binders. These enhanced bond characteristics of alkali activated binders have also been reported in other research results [
17,
18]. Shi and Xie [
17] also reported that the formation of the dense and uniform transition zone in the Na
2SiO
3− activated slag mortars can be attributed to several factors such as the water reducing function of Na
2SiO
3 and the high initial concentration of [SiO
4]
4− in the pore solution.
Figure 5.
SEM micrographs of steel fiber–matrix transition zone. (a) OPC-wet; (b) AAS-dry; (c) AAS-wet.
Figure 5.
SEM micrographs of steel fiber–matrix transition zone. (a) OPC-wet; (b) AAS-dry; (c) AAS-wet.
3.2. Flexural Performance
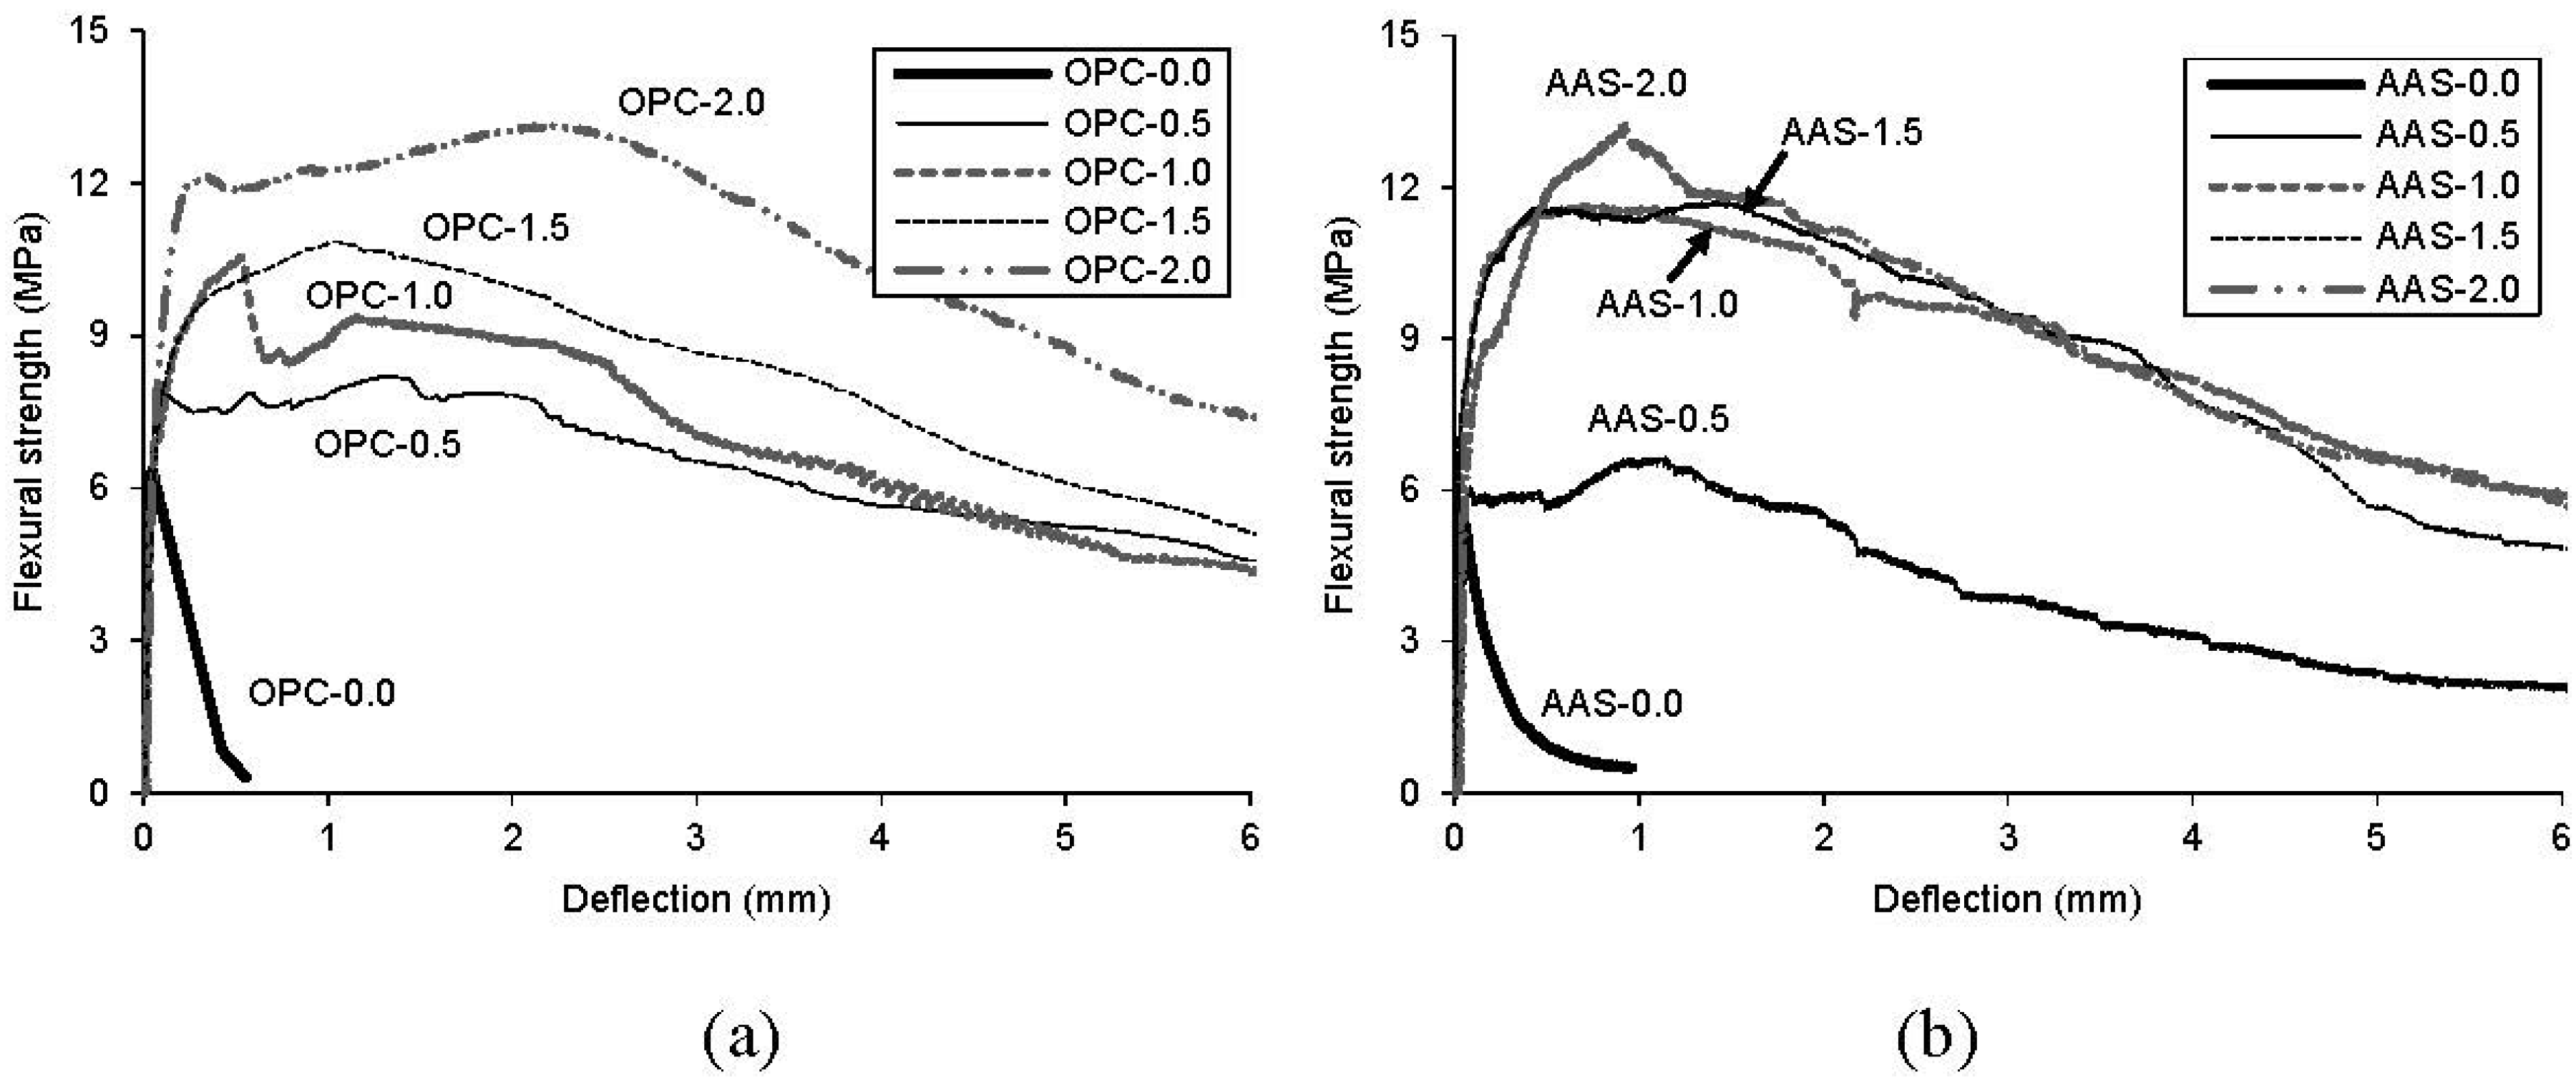
A flexural strength-deflection curve itself may be quite sensitive in distinguishing amongst different fiber inclusions, and the curve roughly indicates differences in the toughness performance of concrete with different fiber volume fractions.
Figure 6 shows flexural strength-deflection curves for all specimens. All the curves are the average values for three specimens. As expected, the ultimate strength is higher for concrete with more fiber volume fractions, due to bridging action. However, there was no significant effect of binder type or fiber inclusion on the first cracking strengths. The ultimate strength was noticeably improved when the fiber volume fraction was above 1.0%. In particular, AAS-1.0, AAS-1.5 and AAS-2.0 specimens showed very similar flexural behavior as shown in
Figure 6a, whereas the ultimate strengths of AAS-0.0 and AAS-0.5 specimens were lower than those of OPC-0.0 and OPC-0.5 specimens due to lower compressive strengths. In
Table 5, first crack strength (f
f), first crack deflection (δ
f), ultimate strength (f
f), and deflection at the peak load (δ
f) are given. As shown in flexural responses in
Figure 6, the descending portion of the curve is steeper when the ultimate strength is higher. Therefore, it can be inferred that the residual strength beyond the peak load decreases faster so that the post-crack toughness changes.
Figure 6.
Flexural strength-deflection curves of test specimens at 28 days. (a) OPC specimens; (b) AAS specimens.
Figure 6.
Flexural strength-deflection curves of test specimens at 28 days. (a) OPC specimens; (b) AAS specimens.
Table 5.
Strengths and deflections at both first crack and peak load.
Table 5.
Strengths and deflections at both first crack and peak load.
| Specimen | First Crack | Peak Load |
|---|
| ff (MPa) | δf (mm) | fu (MPa) | δu (mm) |
|---|
| OPC-0.0 | 6.329 | 0.049 | 6.329 | 0.049 |
| OPC-0.5 | 6.577 | 0.047 | 8.197 | 1.303 |
| OPC-1.0 | 5.755 | 0.042 | 10.557 | 0.531 |
| OPC-1.5 | 5.064 | 0.047 | 10.855 | 1.035 |
| OPC-2.0 | 6.646 | 0.055 | 13.130 | 2.221 |
| AAS-0.0 | 5.501 | 0.050 | 5.501 | 0.050 |
| AAS-0.5 | 4.674 | 0.044 | 6.638 | 1.145 |
| AAS-1.0 | 5.249 | 0.029 | 11.615 | 0.705 |
| AAS-1.5 | 5.910 | 0.019 | 11.714 | 1.427 |
| AAS-2.0 | 4.180 | 0.047 | 13.262 | 0.931 |
ASTM C1018 [
19] is the most common method used for evaluating the flexural toughness of FRC (fiber reinforced concrete). In this study, the ASTM flexural toughness indices and the ASTM residual strength factors are adopted for calculating the post-crack toughness of test specimens. The ASTM specifies the flexural toughness indices as I
5 (3δ), I
10 (5.5δ), I
20 (10.5δ), I
30 (15.5δ), and I
50 (25.5δ). For the residual strength factors, R
5,10, R
10,20, R
20,30 and R
30,50 are also specified in the ASTM. In this paper, for the flexural toughness indices and residual strength factors, I
100 (50δ), I
200 (100δ), R
50,100, and R
100,200 were added to consider overall flexural response including the deflection at peak load of test specimens. For the R
50,100 and R
100,200 added, the factors were reduced as per the following equations:
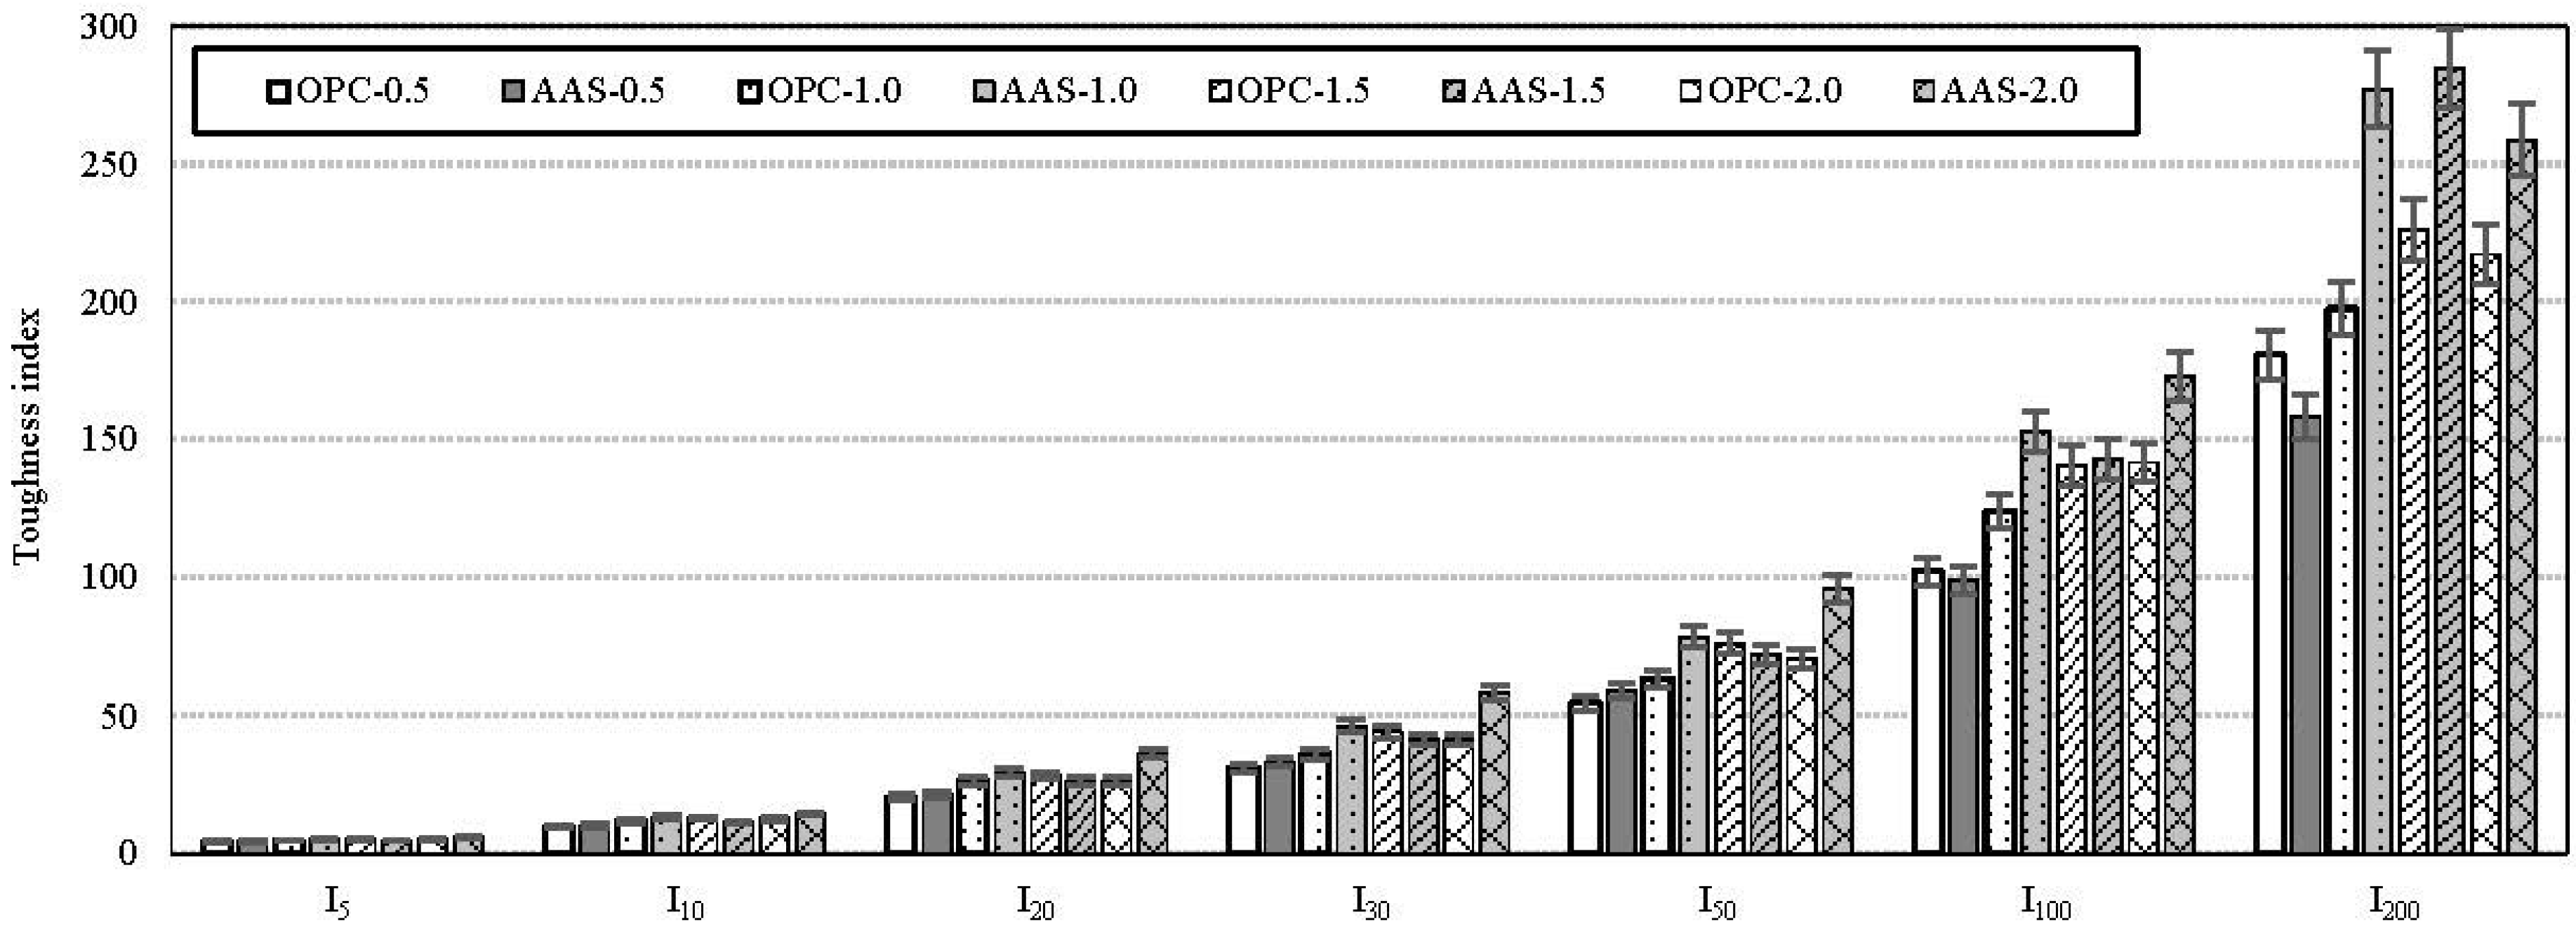
Figure 7 shows the effect of binder type on the ASTM toughness indices for all specimens. All are average values for three specimens. It can be seen that the ASTM toughness indices are particularly sensitive in distinguishing amongst different fiber volume fractions, which is more obvious when the fiber volume fraction is higher than 1.0%. AAS specimens exhibit similar or higher toughness index than OPC specimens, regardless of fiber volume fraction. In particular, for R
50,100 and R
100,200 which are toughness indices added in this paper, the difference of indices between AAS and OPC specimens was widened. This means that the AAS binder is more efficient for bonding in the interfacial zone between steel fibers and the matrix phase than OPC binder during post-cracking behavior.
Figure 7.
Comparison of toughness indices.
Figure 7.
Comparison of toughness indices.
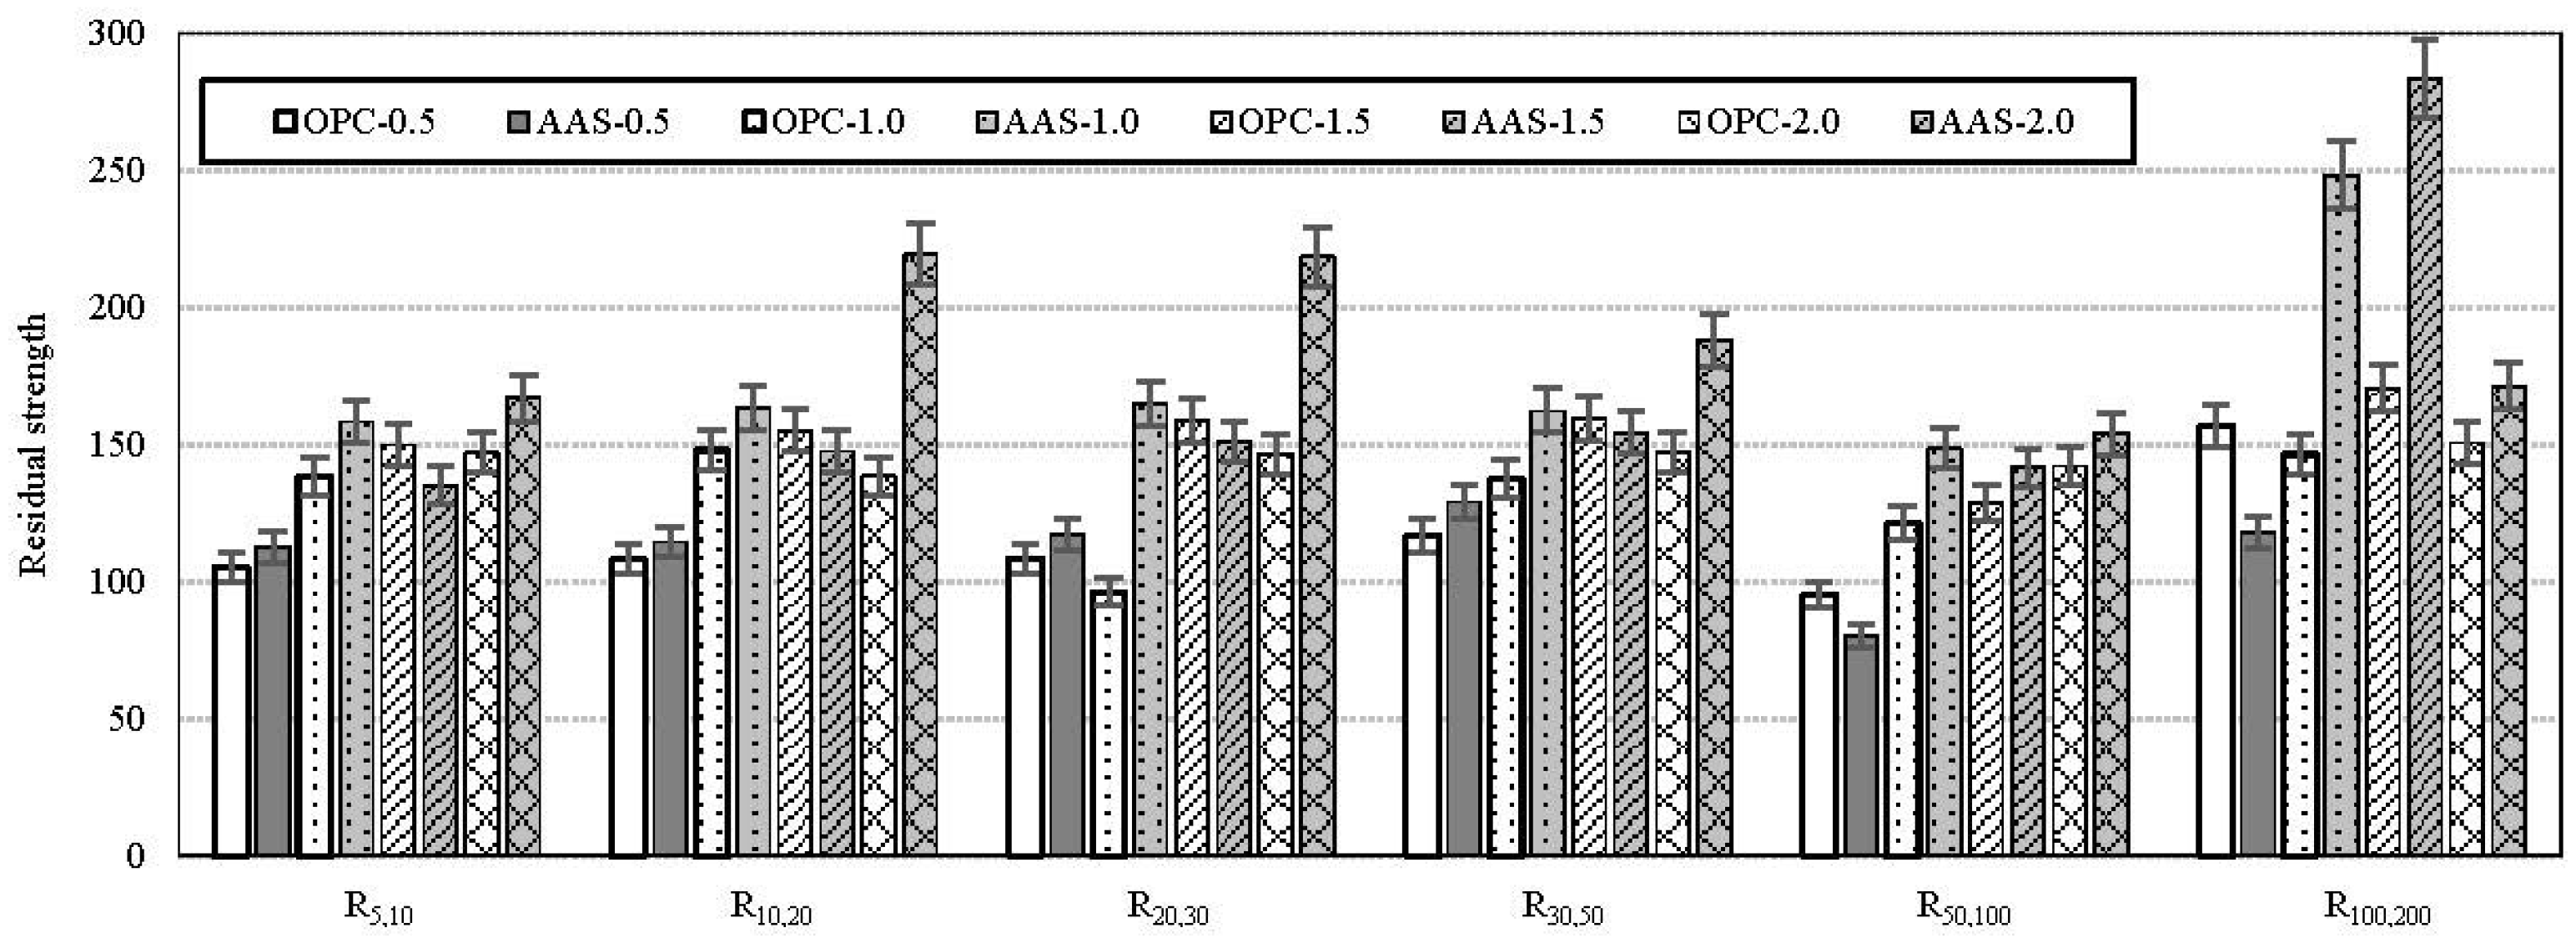
Figure 8 shows the effect of binder type on the ASTM residual strength factors for all specimens. As shown in the figure, AAS binder could be better for residual strength of FRC than OPC binder. It can be thought that the internal stress distribution in the tension zone would be enhanced due to the formation of the dense and uniform transition zone in the matrix as seen in
Figure 5.
Figure 8.
Comparison of residual strength factors.
Figure 8.
Comparison of residual strength factors.
3.3. Eco-Efficiency of Alkali-Activated Slag
Korea LCI Database Information Network [
20] and Japanese database [
21] were referred to in order to evaluate the CO
2 emissions of concrete.
Table 6 and
Table 7 show CO
2 evaluation of the OPC and the AAS concrete, respectively. As listed in the tables, the CO
2 emission of the AAS concrete is 15%~24% of that of the OPC concrete because the AAS based binder has about 97% lower CO
2 emission than the OPC based binder. The CO
2 emissions of concretes considering fiber inclusion are compared in
Table 8.
To compare environmental efficiency, a binder intensity (
bi) and CO
2 intensity (
ci) were proposed by Damineli BL
et al. [
1]. It was reported that the binder intensity yields the efficiency of using clinker and other hard to find clinker substitutes. The CO
2 intensity permits an estimation of the mix design’s global warming potential. The indices are calculated as:
where
b is the total consumption of binder materials (kg/m
3),
c is the total CO
2 (kg/m
3) emitted to produce, and
p is the compressive strength (MPa) at 28 days.
Table 6.
CO2 evaluation of OPC concrete.
Table 6.
CO2 evaluation of OPC concrete.
| Item | Material and Production |
|---|
| A | B | A·B |
|---|
| kg/m3 | CO2-kg/kg | CO2-kg/m3 |
|---|
| OPC | 373 | 0.944 | 352.1 |
| Sand | 756 | 0.0026 | 2.0 |
| Coarse | 924 | 0.0075 | 6.9 |
| Water | 205 | 1.96 × 10⁻⁴ | 0.0 |
| Admixture | 0.1492 | 0.25 | 0.0 |
| Conc. production | 2258 | 0.008 | 18.1 |
| Sum | – | – | 379.2 |
| Wet-curing | – | – | 38.5 |
| Total * = 417.7 CO2-kg/m3 |
Table 7.
CO2 evaluation of AAS concrete.
Table 7.
CO2 evaluation of AAS concrete.
| Item | Material and Production |
|---|
| A | B | A·B |
|---|
| kg/m3 | CO2-kg/kg | CO2-kg/m3 |
|---|
| GGBS | 373 | 0.0265 | 9.9 |
| Sand | 756 | 0.0026 | 2.0 |
| Coarse | 924 | 0.0075 | 6.9 |
| Water | 205 | 1.96 × 10⁻⁴ | 0.0 |
| Admixture | 0.1492 | 0.25 | 0.0 |
| Conc. production | 2258 | 0.008 | 18.1 |
| Sum | – | – | 36.9 |
| Dry-curing | – | – | 0.0 |
| Wet-curing | – | – | 38.5 |
Total * = 36.9 CO2-kg/m3 for AAS-dry;
75.4 CO2-kg/m3 for AAS-wet |
Table 8.
Final CO2 emission of concrete with fiber inclusion.
Table 8.
Final CO2 emission of concrete with fiber inclusion.
| Mix | Curing Method | CO2 Emission with Fiber Volume Fractions (CO2-kg/kg) |
|---|
| 0.0% | 0.5% | 1.0% | 1.5% | 2.0% |
|---|
| OPC | wet | 417.7 | 420.6 | 423.6 | 426.6 | 429.6 |
| AAS | dry | 36.9 | 39.9 | 42.9 | 45.9 | 48.9 |
| AAS | wet | 75.4 | 78.4 | 81.4 | 84.4 | 87.4 |
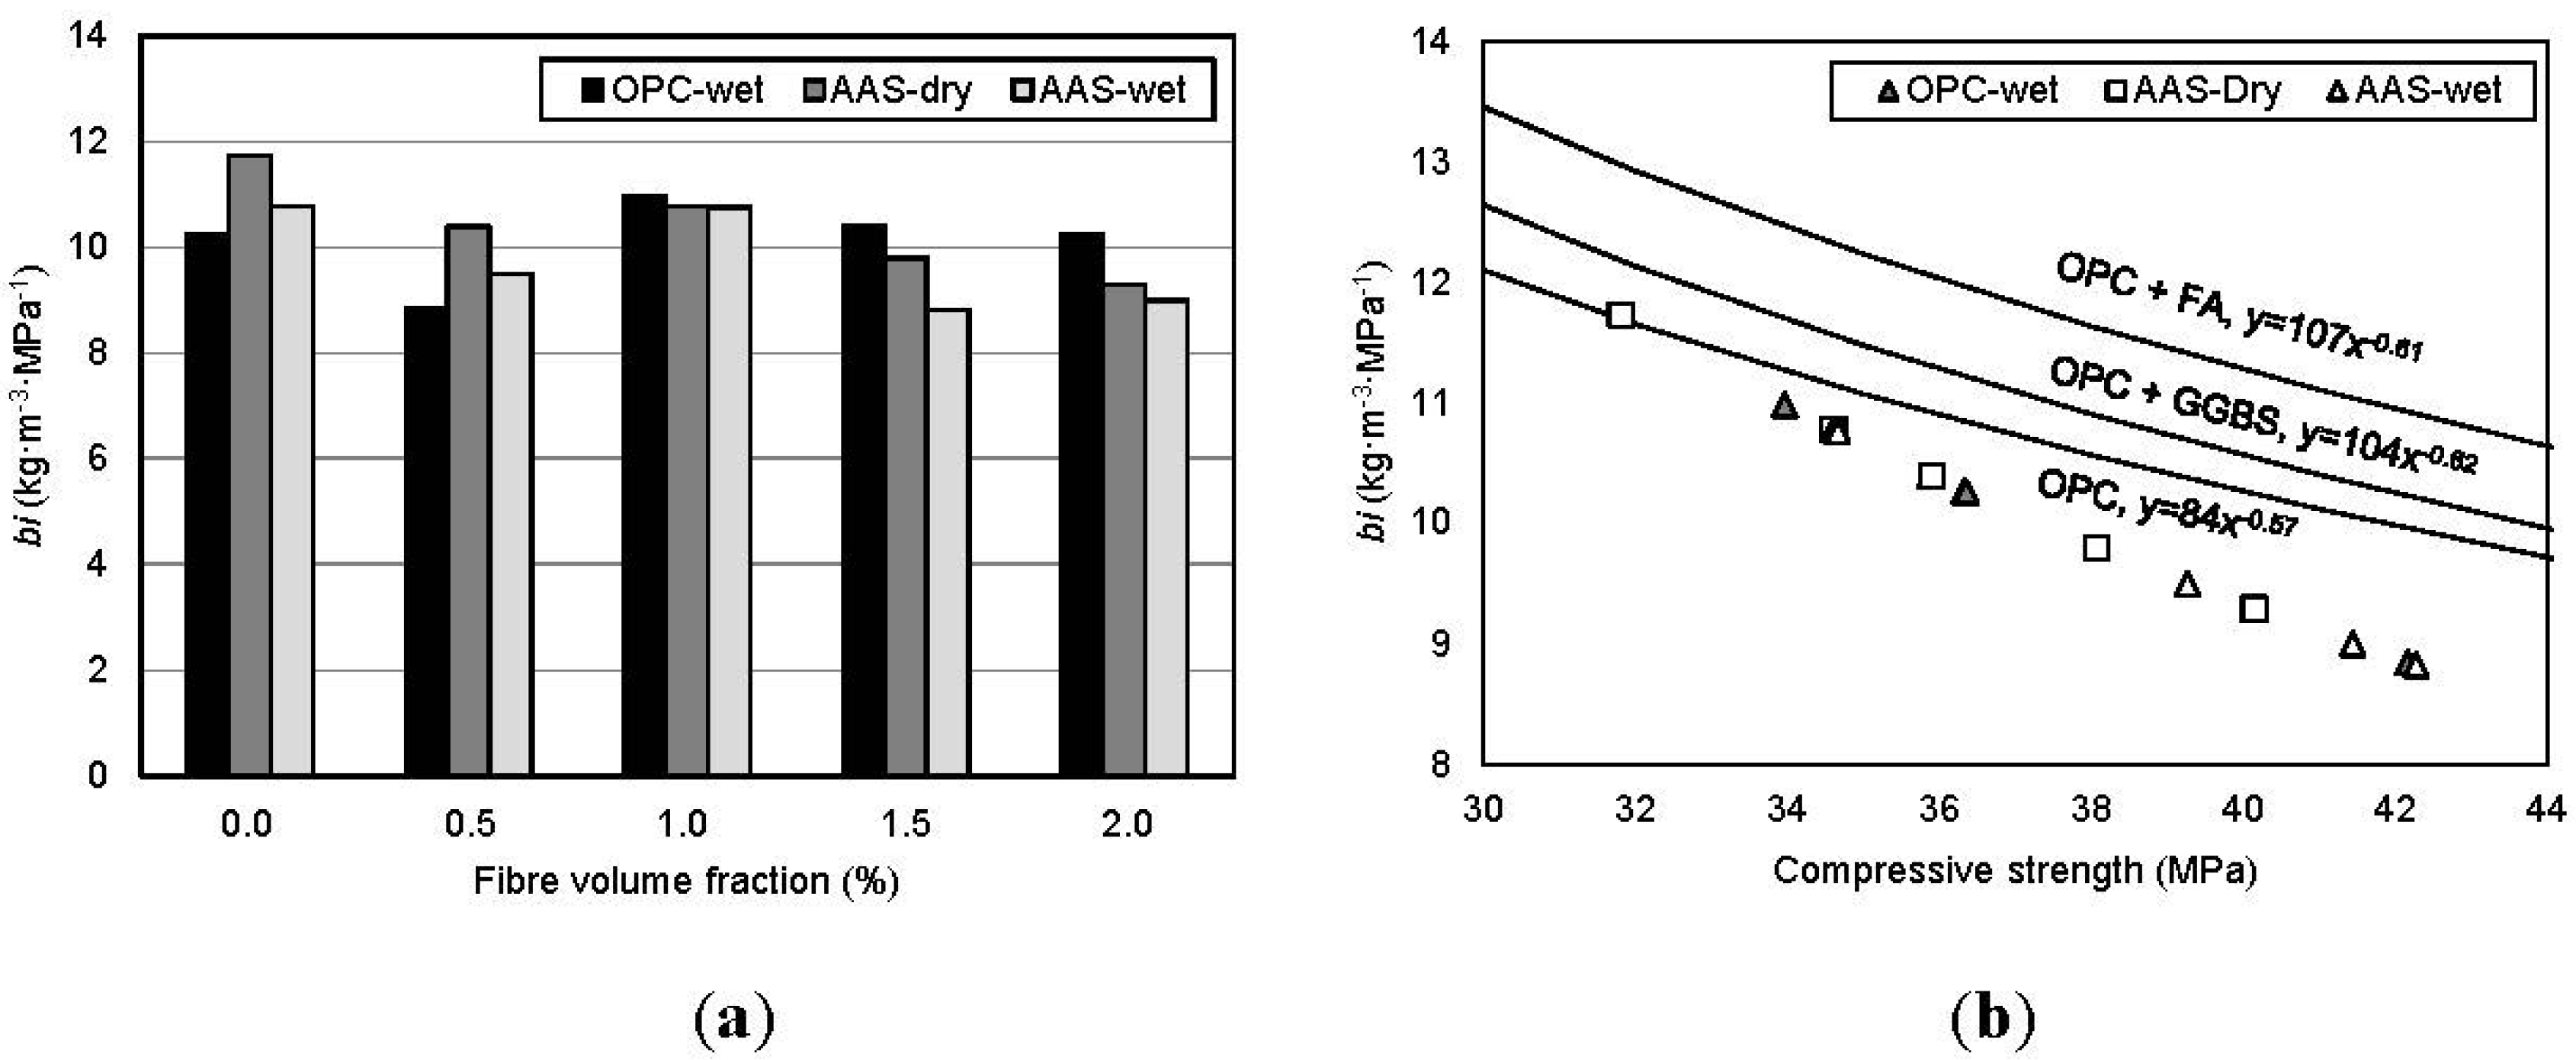
The binder intensity with variables and the relationship between the binder intensity and compressive strength are presented in
Figure 9. As seen in
Figure 9a, it is clear that the binder intensity can be reduced by wet-curing and fiber inclusion. In case of concrete with less than 1.0% of fiber volume fraction, OPC specimens have lower binder intensity compared to AAS specimens. However, as fiber volume fraction increases, the binder intensities of AAS specimens are lower than those of OPC specimens. It can be inferred that AAS binder can enhance performance, especially the compressive strength of concrete, and reduce the total amount of binder necessary to achieve the performance required. The best-fit curves in previous research [
2] are adopted to compare the binder intensity in this study and are presented in
Figure 9b. As shown in the figure, the binder intensity calculated in this study is below the best-fit curve of OPC (Yang
et al., 2013). AAS concrete has lower binder intensity compared to OPC concrete even though it was reported that Ca(OH)
2-based AA GGBS concrete requires a greater amount of binder in order to obtain the same compressive strength as OPC concrete [
2].
Figure 9.
Comparison of binder intensity (bi). (a) fiber volume fraction; (b) compressive strength.
Figure 9.
Comparison of binder intensity (bi). (a) fiber volume fraction; (b) compressive strength.
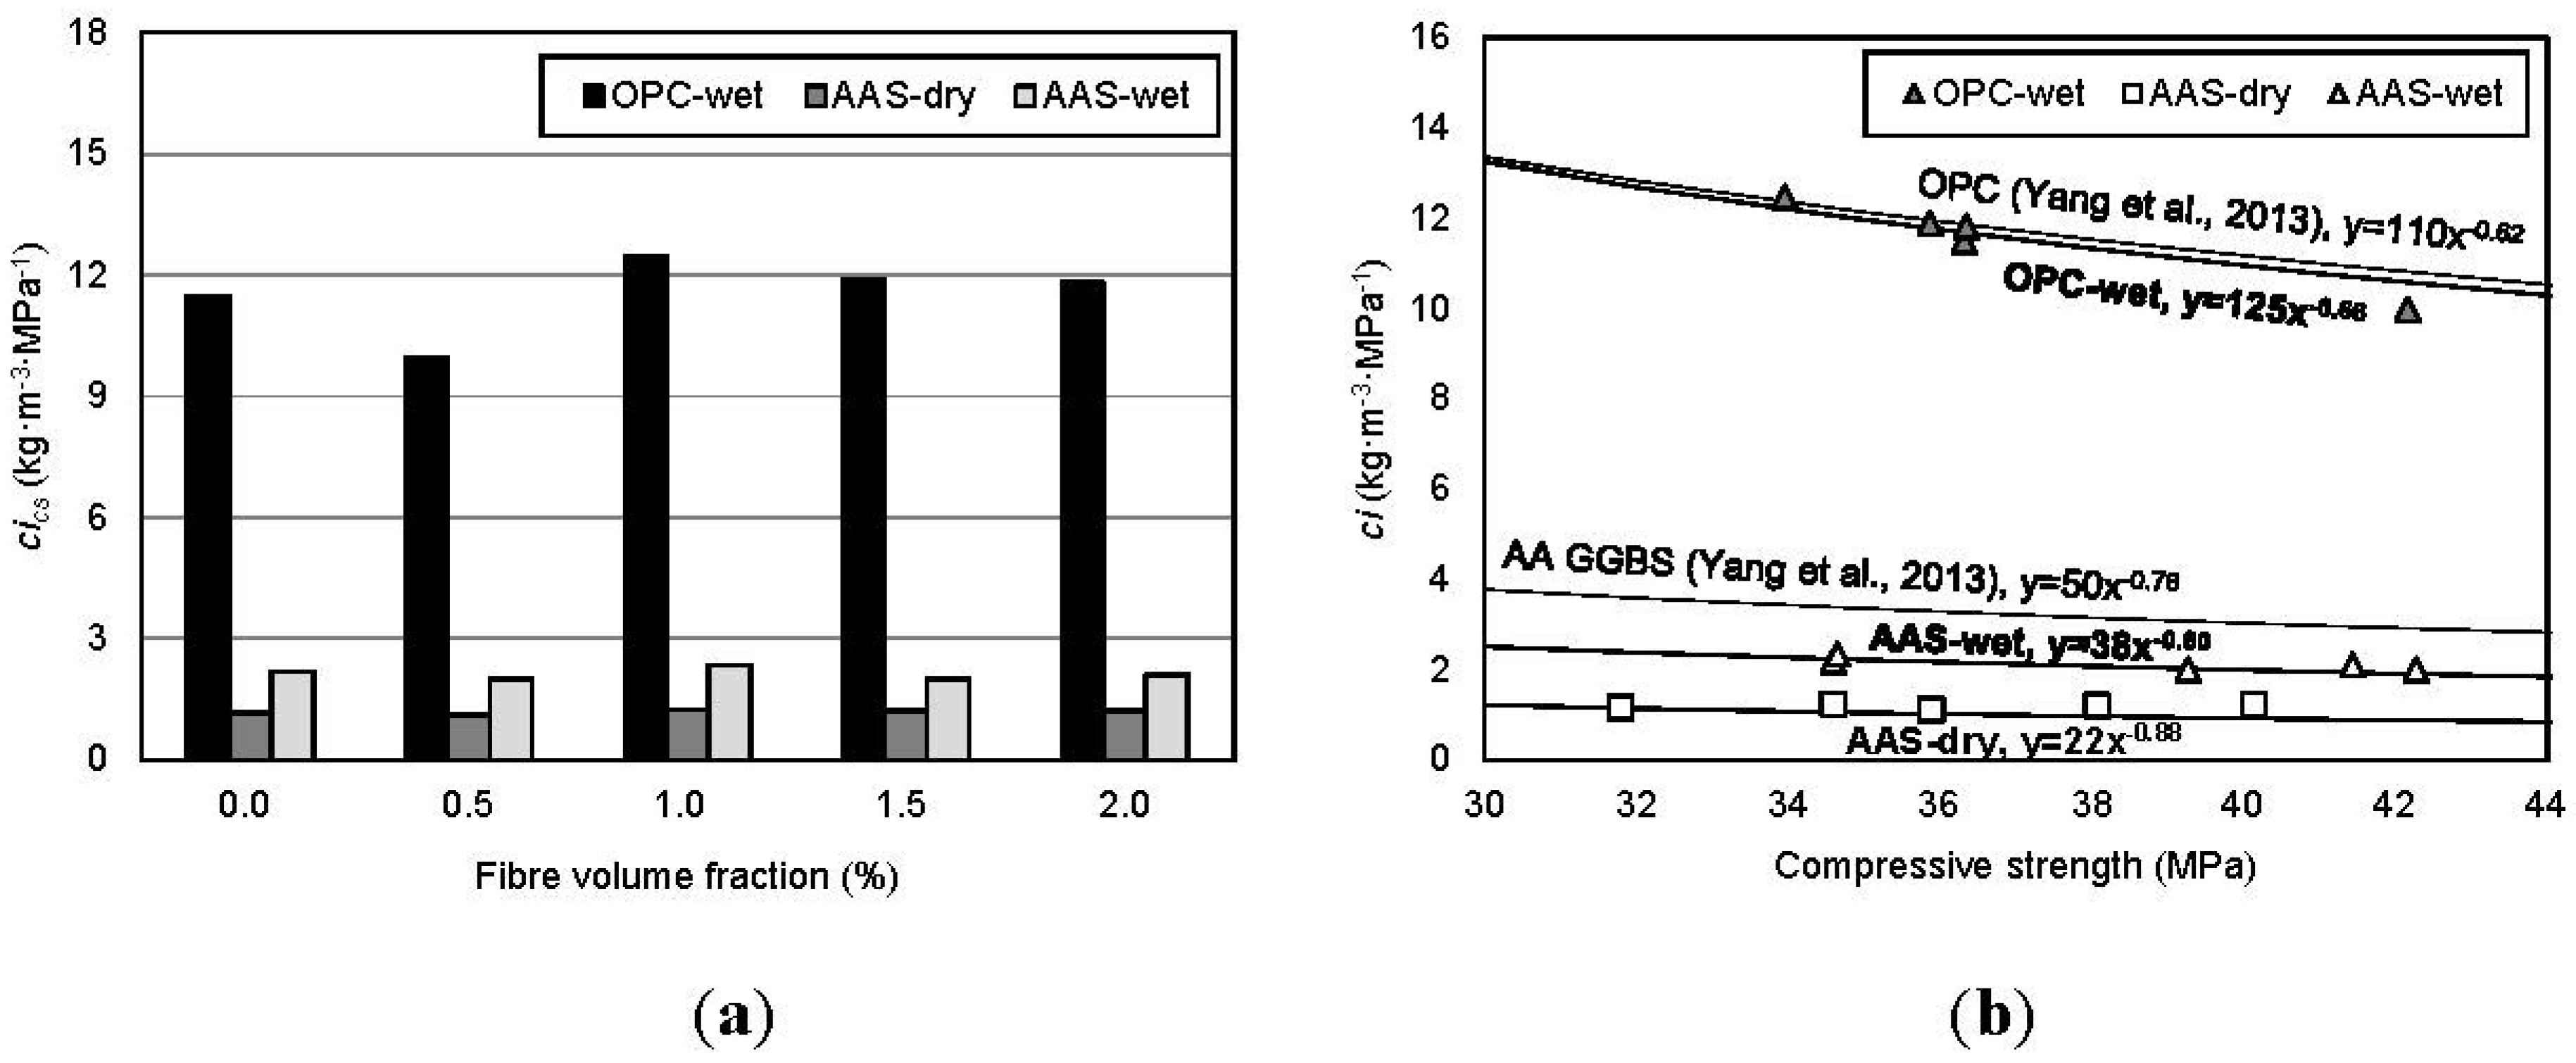
Figure 10 shows the CO
2 intensity with variables and the relationship between the CO
2 intensity and compressive strength. As estimated in
Table 8, the CO
2 intensity of AAS concrete is about 20%–25% of that of OPC concrete. In view of the curing method, as shown in
Figure 10a, wet-curing increases the CO
2 intensity by 40%–50% compared to dry-curing because electric equipment is needed to maintain the water at a constant temperature for curing. The best-fit curves in previous research [
2] are adopted to compare the CO
2 intensity in this study and are presented in
Figure 10b. As shown in the figure, it is indicated that the estimated CO
2 intensity for OPC is around the best-fit curve. However, there is little difference between the curves because Yang
et al. [
2] considered CO
2 emitted in production and transport as
c. In this study, CO
2 emitted for transport was omitted because the CO
2 emission is influenced by the transportation distance between the plant and construction sites. In this study, CO
2 emitted in production only (cradle to gate) was considered to calculate CO
2 intensity (
ci), and the best-fit curves for AAS-wet and -dry lie under the curve proposed by Yang
et al. [
2].
Figure 10.
Comparison of CO2 intensity (ci). (a) Fiber volume fraction; (b) compressive strength.
Figure 10.
Comparison of CO2 intensity (ci). (a) Fiber volume fraction; (b) compressive strength.


